Article

Spatial Variation of Phytochemical and Antioxidant Activities of Olive Mill Wastewater: A Chemometric Approach

1
Ecole Supérieure de Technologie d’El Kelaa Des Sraghna, Université Cadi Ayyad, B.P 104, El Kelaa Des Sraghna, Marrakech 40000, Morocco
2
Laboratory of Materials, Nanotechnology and Environment, Faculty of Sciences, Mohammed V University in Rabat, Rabat 10106, Morocco
3
Department of Laboratory Medicine, Faculty of Applied Medical Sciences, Umm Al-Qura University, Makkah 21955, Saudi Arabia
4
Faculty of Data Science and Information Technology, INTI International University, Nilai 71800, Malaysia
5
Pengiran Anak Puteri Rashidah Sa’adatul Bolkiah Institute of Health Sciences, Universiti Brunei Darussalam, Gadong BE1410, Brunei
6
Laboratory of Human Pathologies Biology, Department of Biology, Faculty of Sciences, Mohammed V University in Rabat, Rabat 10106, Morocco
*
Authors to whom correspondence should be addressed.
Sustainability 2022, 14(21), 14488; https://doi.org/10.3390/su142114488
Submission received: 9 September 2022 / Revised: 29 October 2022 / Accepted: 31 October 2022 / Published: 4 November 2022

Abstract

:
Olive mill wastewater (OMW) was obtained during the extraction of olive oil. It is typified by an elevated concentration of sugars, acids, proteins, polyphenols, and organic matter. This makes the removal of OMW problematic for all olive oil-producing countries. Due to their high concentration in polyphenols, these wastewaters are a source of danger to the environment. This research aimed to study the spatial distribution effect in terms of geographical origin production of olive oil on the phenolic content and the antioxidant activity of the OMWs. A chemometric approach using principal component analysis (PCA) and hierarchical cluster analysis (HCA) was utilized. Physico-chemical characterization of OMWs was performed to evaluate their pollutant load by setting the following parameters: pH, dry matter, conductivity, and chemical oxygen demand. Quantitative analysis of the phenolic compounds shows that the extract of all samples had a high content of phenolics varying from 238.26 ± 5.67 to 534.16 ± 3.83 mg GAE/g of extract, flavonoids varying from 179.89 ± 1.64 to 421.47 ± 3.42 mg QE/g of extract, and tannins varying from 101.66 ± 0.65 to 216.28 ± 3.41 mg CE/g of extract. Antioxidant activity was determined by two testing systems: DPPH and ABTS assay. The IC50 DPPH varied from 0.30 ± 0.08 to 1.93 ± 0.34 µg/mL, while it varied between 2.04 ± 0.16 and 6.11 ± 0.25 µg/mL for the IC50 ABTS method. The principal component analysis indicated that the two methods DPPH and ABTS are strongly correlated. Furthermore, important correlations were shown by the principal component analysis (PCA) on the one hand between the phenolic compounds and on other hand between their antioxidant activities (DPPH, ABTS).

1. Introduction

In Morocco, the olive tree represents more than 69.55% of the national cultivated area with 1.07 million ha and 2 million tons of olive oil. Moroccan olive groves consist of more than 96% of the single cultivar “Marocaine Picholine”. This latter was characterized by its adaptation to the Moroccan environment and is known for its high oil quality [1]. Olive oil is very popular, especially for its characteristic taste and socio-cultural value, but also thanks to its therapeutic, dietary, and nutritional virtues [2,3]. The current national production is 160,000 tons of olive oil per year, placing Morocco in 6th place among world suppliers [4]. However, consumption nationwide remains low, barely touching 2.5 kg per person per year, compared to large consuming countries (10 kg in Spain, 12 kg in Italy, and 24 kg in Greece [4].
The traditional techniques of production of these oils give low extraction yields, which hardly exceed 14%; the majority of the oils thus produced are of limited quality and are not resistant to oxidation [5]. In addition to olive oil, the olive industry generates two other byproducts, a solid reject known as olive husk and another liquid known as vegetable water or olive mill wastewaters (OMW), which is considered a critical environmental issue [6]. The latter effluent is characterized by a blackish color which varies according to its state of degradation. The organic fraction has a complex and highly variable composition, consisting essentially of sugars, lipids, polyphenols, polyalcohols, proteins, and organic acids [7,8,9,10].
Attempts to treat OMWs have remained limited due to the presence of toxic phenolic compounds, which are not easy to eliminate and inhibit biological activity. On the other hand, these polyphenols have a significant commercial value, especially in the pharmaceutical and agri-food field. These compounds have a strong capacity to trap free radicals, constituting the most crucial oxidation source [11].
Today, OMWs are a major environmental problem for olive oil-producing countries. This ecological situation prompted us to carry out an experimental chemometric approach based on the spatial variation of physico-chemical characteristics of OMWs, the extraction of phenolic compounds from the OMWs, assaying the different bioactive compounds, and finally the evaluation of the antioxidant activity of different OMWs studied by two methods DPPH and ABTS. The correlation between the phenolic compounds and their antioxidant effects was assessed by principal component analysis (PCA). Based on bioactive compounds and antioxidant activities, a hierarchical cluster analysis (HCA) was used to construct three clusters.

2. Materials and Methods

2.1. Sample

The study examined 10 samples of OMW from the Picholine Marocaine olive variety, using traditional oil mills from ten Moroccan cities: Beni Mella (W1), Shoul (W2), Meknes (W3), Khenifra (W4), Sidi Allal El Bahraoui (W5), Sidi Slimane (W6), Kelaat Sraghna (W7), Taza (W8), Guelmim (W9), and Guercif (W10), during the period of olive harvest season of 2018/2019. The geographical data of the 10 cities are shown in Table 1. The OMW samples were collected in glass vials and kept in the refrigerator at 4 °C until the analysis.

2.2. Chemicals

The solvents used for analytical or HPLC were purchased from Professional Labo (Casablanca, Morocco). n-Hexane, methanol, and ethyl acetate were of HPLC grade.
In this study, we used the following chemical reagents: 2,2-diphenyl-1-pycridazil (DPPH 90%), 2,2′-azino-bis (3-ethyl benzthiazoline-6-sulphonic acid) (ABTS), gallic acid, trolox, quercetin, catechin, vanillin, Folin–Ciocâlteu’s phenol reagent, aluminum chloride (AlCl3), hydrogen chloride, potassium persulphate, potassium dichromate (K2Cr2O7), silver sulfate (Ag2SO4), sodium nitrite (NaNO2), sodium hydroxide (NaOH) and sodium carbonate (Na2CO3) sourced from Professional Labo (Casablanca, Morocco).

2.3. Physico-Chemical Characteristics of OMWs

All parameters were determined in triplicate according to the standard methods described below.
The pH measurement was performed after standardization with buffer solutions (pH = 4 and 9) using a pH meter. The OMW sample was kept under stirring during the measurement. The method used is recommended by standard methods [12]. A conductivity meter was used for measuring the electrical conductivity (EC) [13]. Dry matter was calculated using an oven at 103 °C [14]. For the chemical oxygen demand (COD), the Standard Methods for the Examination of Water and Wastewater was used [15] by oxidation at 150 °C, the organic substance in the OMW sample, using an excess of potassium dichromate in the presence of Ag2SO4. The excess K2Cr2O7 was determined by colorimetric method with a UV spectrophotometer at 620 nm.

2.4. Extraction of Bioactive Compounds

The extraction of phenols was conducted based on the test reported by Bharagava et al. [16], with some changes.
The OMW was adjusted to pH = 2 with HCl (6N) after the elimination of lipids with n-hexane. The bioactive components were extracted with ethyl acetate. The mixture was vortexed and decanted; this process was repeated four times to recuperate a maximum of bioactive compounds. Biphasic isolation allows the supernatant to be recovered, which is ethyl acetate containing polyphenols.

2.5. Phytochemical Study

2.5.1. Determination of Total Phenolic Contents (TPC)

The content of TPC was determined based on the test of El Guezzane et al. [17] with minor changes. The sample solution (0.5 mL) was mixed with Folin–Ciocâlteu reagent (2.5 mL) diluted in distilled water at 1:10; at that time, 4 mL of Na2CO3 (7.5%, w/v) was added. The mixture was incubated in a water bath at 45 °C during 30 min. The absorbance was read using a UV–Vis spectrophotometer at 765 nm. The standard curve of gallic acid was done under the same conditions, a range of concentrations from 2 to 100 µg/mL was used. The TPC was determined as gallic acid equivalents (mg GAE/g of Extract).

2.5.2. Determination of Total Flavonoids Content (TFC)

The determination of the TFC was performed using the colorimetric method as described in our previous paper [18]. In a test tube, 6.4 mL of distilled water and 1 mL of the extract was added. Then, 0.3 mL of a solution of 5% NaNO2 was added. The same volume of 10% AlCl3 was added to the mixture after 5 min, and the tubes were left for 6 min. Afterwards, 2 mL of NaOH (1 M) was added to the mix, and the test tubes were votexed and left for 30 min. The absorbances were measured using a UV–Vis spectrophotometer at 510 nm. The standard curve of quercetin was obtained using a range of concentrations from 10 to 200 µg/mL. Results are expressed as milligram of quercetin equivalents/gram of extract (mg QE/g of extract).

2.5.3. Determination of Condensed Tannins Content (TTC)

The determination of condensed tannins was conducted by conforming to El Guezzane et al. [19]. In a tube containing 100 μL of the diluted sample, we added 3 mL of vanillin solution (4%) in methanol and concentrated HCl (1.5 mL). The mixture remained as it was for 15 min, and the absorbance was measured at 500 nm against water/ethanol as a blank using a UV–Vis spectrophotometer. The standard curve of catechin was drawn using an interval of concentrations from 2 to 100 µg/mL. The TTC was determined as catechin equivalents (mg CE/g of extract).

2.6. Antioxydant Activity

2.6.1. DPPH Assay

The antioxidant activity of the extracts was measured by DPPH. First, we prepared a solution of DPPH in methanol (0.2 mM), then, 0.5 mL of this latter was mixed to 2.5 mL of extract, and it remained as it was at ambient temperature for 30 min. Finally, the absorbance was determined using a UV spectrophotometer at 517 nm against a blank sample [20]. The antioxidant activity was measured by DPPH, the results are expressed using IC50 values. The results were compared to those of ascorbic acid (1–20 µg/mL).

2.6.2. ABTS Assay

The determination of ABTS radical was done by the method described by Zhang et al. [21]. Equal volumes of the solution of ABTS (2 mM) and potassium persulphate (70 mM) were left in the dark for 12 to 16 h at room temperature. This solution (2 mL) was added to the extracts with different concentrations (200 μL), after 30 min, the absorbance was read using a UV spectrophotometer at 734 nm. The same was done for the Trolox standard at different concentrations from 5 to 60 μg/mL.

2.7. Principal Component Analysis (PCA) and Hierarchical Cluster Analysis (HCA)

In this study, the PCA purpose to establish the existence of a correlation between the different physico-chemical characteristics of OMWs studies on the one hand and between the phytochemical content (TPC, TFC, and TTC) and their antioxidant activity (DPPH, ABTS) on the other hand. The PCA was realized on the results of 10 samples of OMWs collected in 10 regions. This method simplifies the analysis of the basic factors contributing most to explain the variation in physico-chemical characteristics depending on 10 samples of OMWs, HCA was used to prosecute the interrelatedness between all samples studied and cluster characteristics; furthermore, the dendrogram was formed by the cluster method of Ward and the squared Euclidean distance were considered as coefficients of similarity.

2.8. Correlation Matrix

The PCA was performed on a matrix that summarizes all the data of the different physico-chemical characteristics, phytochemical content (TPC, TFC, and TTC) and antioxidant activity (DPPH, ABTS). The 10 samples of OMWs represent the individuals. The significance level chosen by default was 5%. All the coefficients are significant at the significance level of 0.05 (p < 0.05), indicating that the risk of rejecting the null hypothesis when it is true is less than 5%.

2.9. Data Analysis

The Pearson correlation was adopted to estimate the correlation between the studied physico-chemical characteristics, phytochemical content (TPC, TFC, and TTC) and antioxidant activity (DPPH, ABTS) from 10 samples of this study. The HCA and PCA were done by the XLSTAT 2014 software [22]. IBM SPSS Statistics 21 software was used to analyze the obtained data.

3. Results and Discussion

3.1. Physico-Chemical Characteristics of OMWs

Table 2 summarizes the results from the analysis of chemical analysis and physicochemical parameters of the wastewaters from the olive industries.
The studied OMWs effluents are very acidic with a pH below 7. The acidic pH of the regions studied varies between 4.63 and 5.15. W8 is the region with the lowest pH value of 3.8, while W10 shows a high pH value of around 5.1. These values are identical to those cited in the literature by Mekki et al. and Khoufi et al. [20,21], which are of the order of 4.8–4.5 and 4.10–4.5, respectively. Moreover, similar values were cited by El Moudden et al. (4.6) [18]. However, the acidity of vegetable waters is linked to the duration of their storage in the basins. This can also be explained by polymerization and auto-oxidation reactions which convert phenolic alcohols into phenolic acids [23,24,25]. These reactions are manifested by a change in the initial coloration of the vegetable waters to a very dark black color [26].
Regarding conductivity, the ten regions marked variable values between 9.58 mS/cm and 20.7 mS/cm. The lowest conductivity value was attributed to the W8 region; this value is greater than that found by Paraskeva et al. (5 mS/cm) [27], while the W9 and W10 regions showed a high value and close to the interval found by Sassi et al. [28] (13 and 41 mS/cm).
The moisture content of this study showed very high percentages in all the regions studied, up to 76%, except the W2 region which showed a low value of around 46%. These results are in agreement with Kamal-eldine et al. [29], who presented moisture percentages ranging from 83 to 92%, and also according to El Moudden et al., with a value of 91% [18].
As for the dry matter, W2 and W9 had the highest content (53.87 and 23.3%) compared to the other OMWs studied. The latter presented percentages ranging from 6.5% to 23.33%. The values obtained are similar to those found by Kamal-eldine et al. (6–12%) [29] and De Ursinos et al. [30], showing that in the case of OMWs from the press, the dry matter is around 12%.
The lipid values presented a minority in the different regions studied; in particular, W7 and W9 showed the most significant value of 0.3%, followed by W3 and W6 with 0.2% and W1 with 0.1%, while the lowest lipid value is attributed to the W10 with 0.03%. These lipid contents are very low compared to the results found by Kamal-eldine et al. (0.5–2.3%) [29].
The ten OMWs studied experienced a variation between 93 and 300 g O2/L in chemical oxygen demand. W9 OMWs require a high oxygen concentration of 300 g O2/L, while W6 requires a low COD of 93 g O2/L. Research by Mouncif et al. has shown that OMWs generally have a very high organic and mineral load expressed by COD, with an average value varying between 100 and 430 g O2/L for extraction by pressure [31]. According to Al-Bsoul et al. [32], the average organic matter COD content is around 51.25 g O2/L. Our COD results are more or less in agreement with those found by Morillo et al. (200 g O2/L) [33], while the general release limit values in surface or groundwater are equal to 250 mg O2/L.

3.2. Phytochemical Study

The TPC, TFC, and TTC were determined using gallic acid, quercetin, and catechin, respectively, as standard. These colorimetric methods are widely used in research for the quantification of different phenolic compounds and especially for the extracts of margins [34,35,36,37].
Table 3 shows the TPC, TFC, and TTC of various OMW, extracted with ethyl acetate solvent.
The various extracts of OMWs had relatively high values of phenolic compounds. The phenolic contents were in the range from 238.26 to 534.16 (mg GAE/g), flavonoids content was from 179.89 to 421.47 (mg QE/g), and finally, tannins were found from 39.66 to 106.28 (mg CE/g). OMWs W4 had the highest polyphenol value of 534.16 (mg GAE/g) while W6 had the lowest value of 238.26 (mg GAE/g). In addition, the latter shows a low flavonoid content (179.89 mg QE/g). OMW W1 showed a very high flavonoid content of around (421.47 mg QE/g) and tannin content of (106.28 mg CE/g). In comparison, the OMW (W8) offered low tannin content (39.66 mg CE/g).
Several studies have already used colorimetric assay methods to quantify the contents of polyphenols and flavonoids using the same tests that we adopted. These methods show the quantitative richness of the extracts by phenolic compounds of different natures. Indeed, using the Folin–Ciocâlteu method, Leouifoudi et al. [35] showed that OMW extracts contain a high polyphenol content of 8.90 ± 0.728 g/L. Similar contents were found by El-Abbassi et al. [37]. The semi-modern milling technique showed a higher phenolic content (9.8 g/L) compared to the modern milling technique (6.1 g/L). For Di Mauro et al. [36], the values of total polyphenols were 5.20 ± 0.21 g/L gallic acid and the values of total flavonoids were 2.28 ± 0.23 g/L catechin using the colorimetric methods.
El Moudden et al. showed a polyphenol content of the order 431 mg GAE/g, this result is relatively in agreement with those obtained in this study [18]. This content is much lower compared to the results obtained for the OMWs studied. El Moudden et al. found a total flavonoid content of around 115 mg QE/g for OMWs from the Moroccan Picholine olive variety [18].
Posadino et al. [8] investigated the identification and quantification by HPLC-DAD of the main phenolic compounds of ethyl acetate extracts and revealed hydroxytyrosol and tyrosol as major components followed by vanillic acid, caffeic acid, ferulic acid, apigenin-7-O-glucoside, oleuropein, and luteolin-7-O-glucoside.
The difference of the OMW phenolic amount and its antioxidant activities is influenced by several factors such as the olive oil extraction process, olive cultivar, the physicochemical feature of OMW samples, the storage conditions, and finally the fungal and bacterial flora existing in OMW [38]. This high phenolic content gives the OMW, on the one hand, a phytotoxic effect, and on the other hand, an antimicrobial property [39], which prevents their purification through biological means. Taking into account the antioxidant capacity of polyphenols, they can be used as natural antioxidants as a substitute for non-natural antioxidants to preserve edible oils from oxidation and give them a noticeable organoleptic quality [40]. Flavonoids, the various and the largest group of natural phenolic compounds, are celebrated to have antioxidant, antimicrobial, antiallergic, anticarcinogenic, and anti-inflammatory properties [41].

3.3. Free Radical Scavenging Activity DPPH and ABTS

Antioxidant activity by DPPH and ABTS has been performed for the OMWs extracts for a concentration region from 2.5 to 100 µg/mL (Table 4).
All the extracts of the OMWs showed IC50 values of DPPH lower than that of the trolox of 2.96 µg/mL. These values prove that the extracts of OMWs have a better antioxidant power than that of the prepared standard. As for ABTS, the ten OMWs showed good antioxidant activity. The values obtained are all lower than that of the trolox (30.85 µg/mL). In particular, W1, W2, and W4 OMWs have the lowest values of IC50 for DPPH (0.32, 0.30 and 0.36 µg/mL) and for ABTS (2.04, 2.28 and 2.20 µg/mL) compared to the other OMWs studied.
The antioxidant IC50 value of the polyphenols extracted from hydrolyzed olive leaves was 0.65 mg/L, which was related to its high hydroxytyrosol content (hydroxytyrosol: IC50 = 0.58 mg/L) according to Bouaziz et al. [41]. The IC50 values our extracts, lead us propose that they have high content of hydroxytyrosol coming from the hydration of oleuropein.
Our results of the activity of scavenging free radicals by the phenolic extracts of OMWs (from the same variety of olive “Picholine Marocaine”) reinforce those found by [15,34,35,36,37,38]. All of these authors have shown the powerful antioxidant effect of phenolic extracts. The results of trapping of the DPPH radical reported by Sousa et al. are comparable to the trapping effect obtained by the BHA and alpha-tocopherol standards.
The phenolic extracts from OMW display a high antioxidant prospective; this is mainly attributed to the presence of polyphenols, which are known to be powerful free radical scavengers [35,36]. The results from our free radical scavenging assays using the OMW phenolic extracts are further confirmed by previous studies, where the powerful antioxidant effect of phenolic extracts is proven [34,35,36,37,38,39].
Phenolic acid extracts with ethyl acetate have the possibility to eliminate the DPPH radicals comparing to that of synthetic antioxidants. However, the result of the extraction of leaves using aqueous alkaline solutions show a high effect of trapping the free radicals [34,37], possibly because of a high concentration of hydroxytyrosol and oleuropein in these extracts.

3.4. Correlation Matrix

Table 5 and Table 6 show the Pearson correlations between physico-chemical characteristics on one hand and between the bioactive molecules and the antioxidants activity on the other hand. The TPC had a high correlation significant (p-value < 0.05) between DPPH (r2 = 0.863) and ABTS (r2 = 0.893). This showed that the polyphenol content (TPC) of OMWs are responsible to the antioxidant capacity by two assays studied These results conform with those that were obtained by several authors such as [19,42,43,44,45,46,47]. Concerning the physico-chemical characteristics, the correlation coefficient between pH and EC was (r2 = 0.692). Moreover, we observed a high negative significant correlation between humidity and DM (r2 = −1).

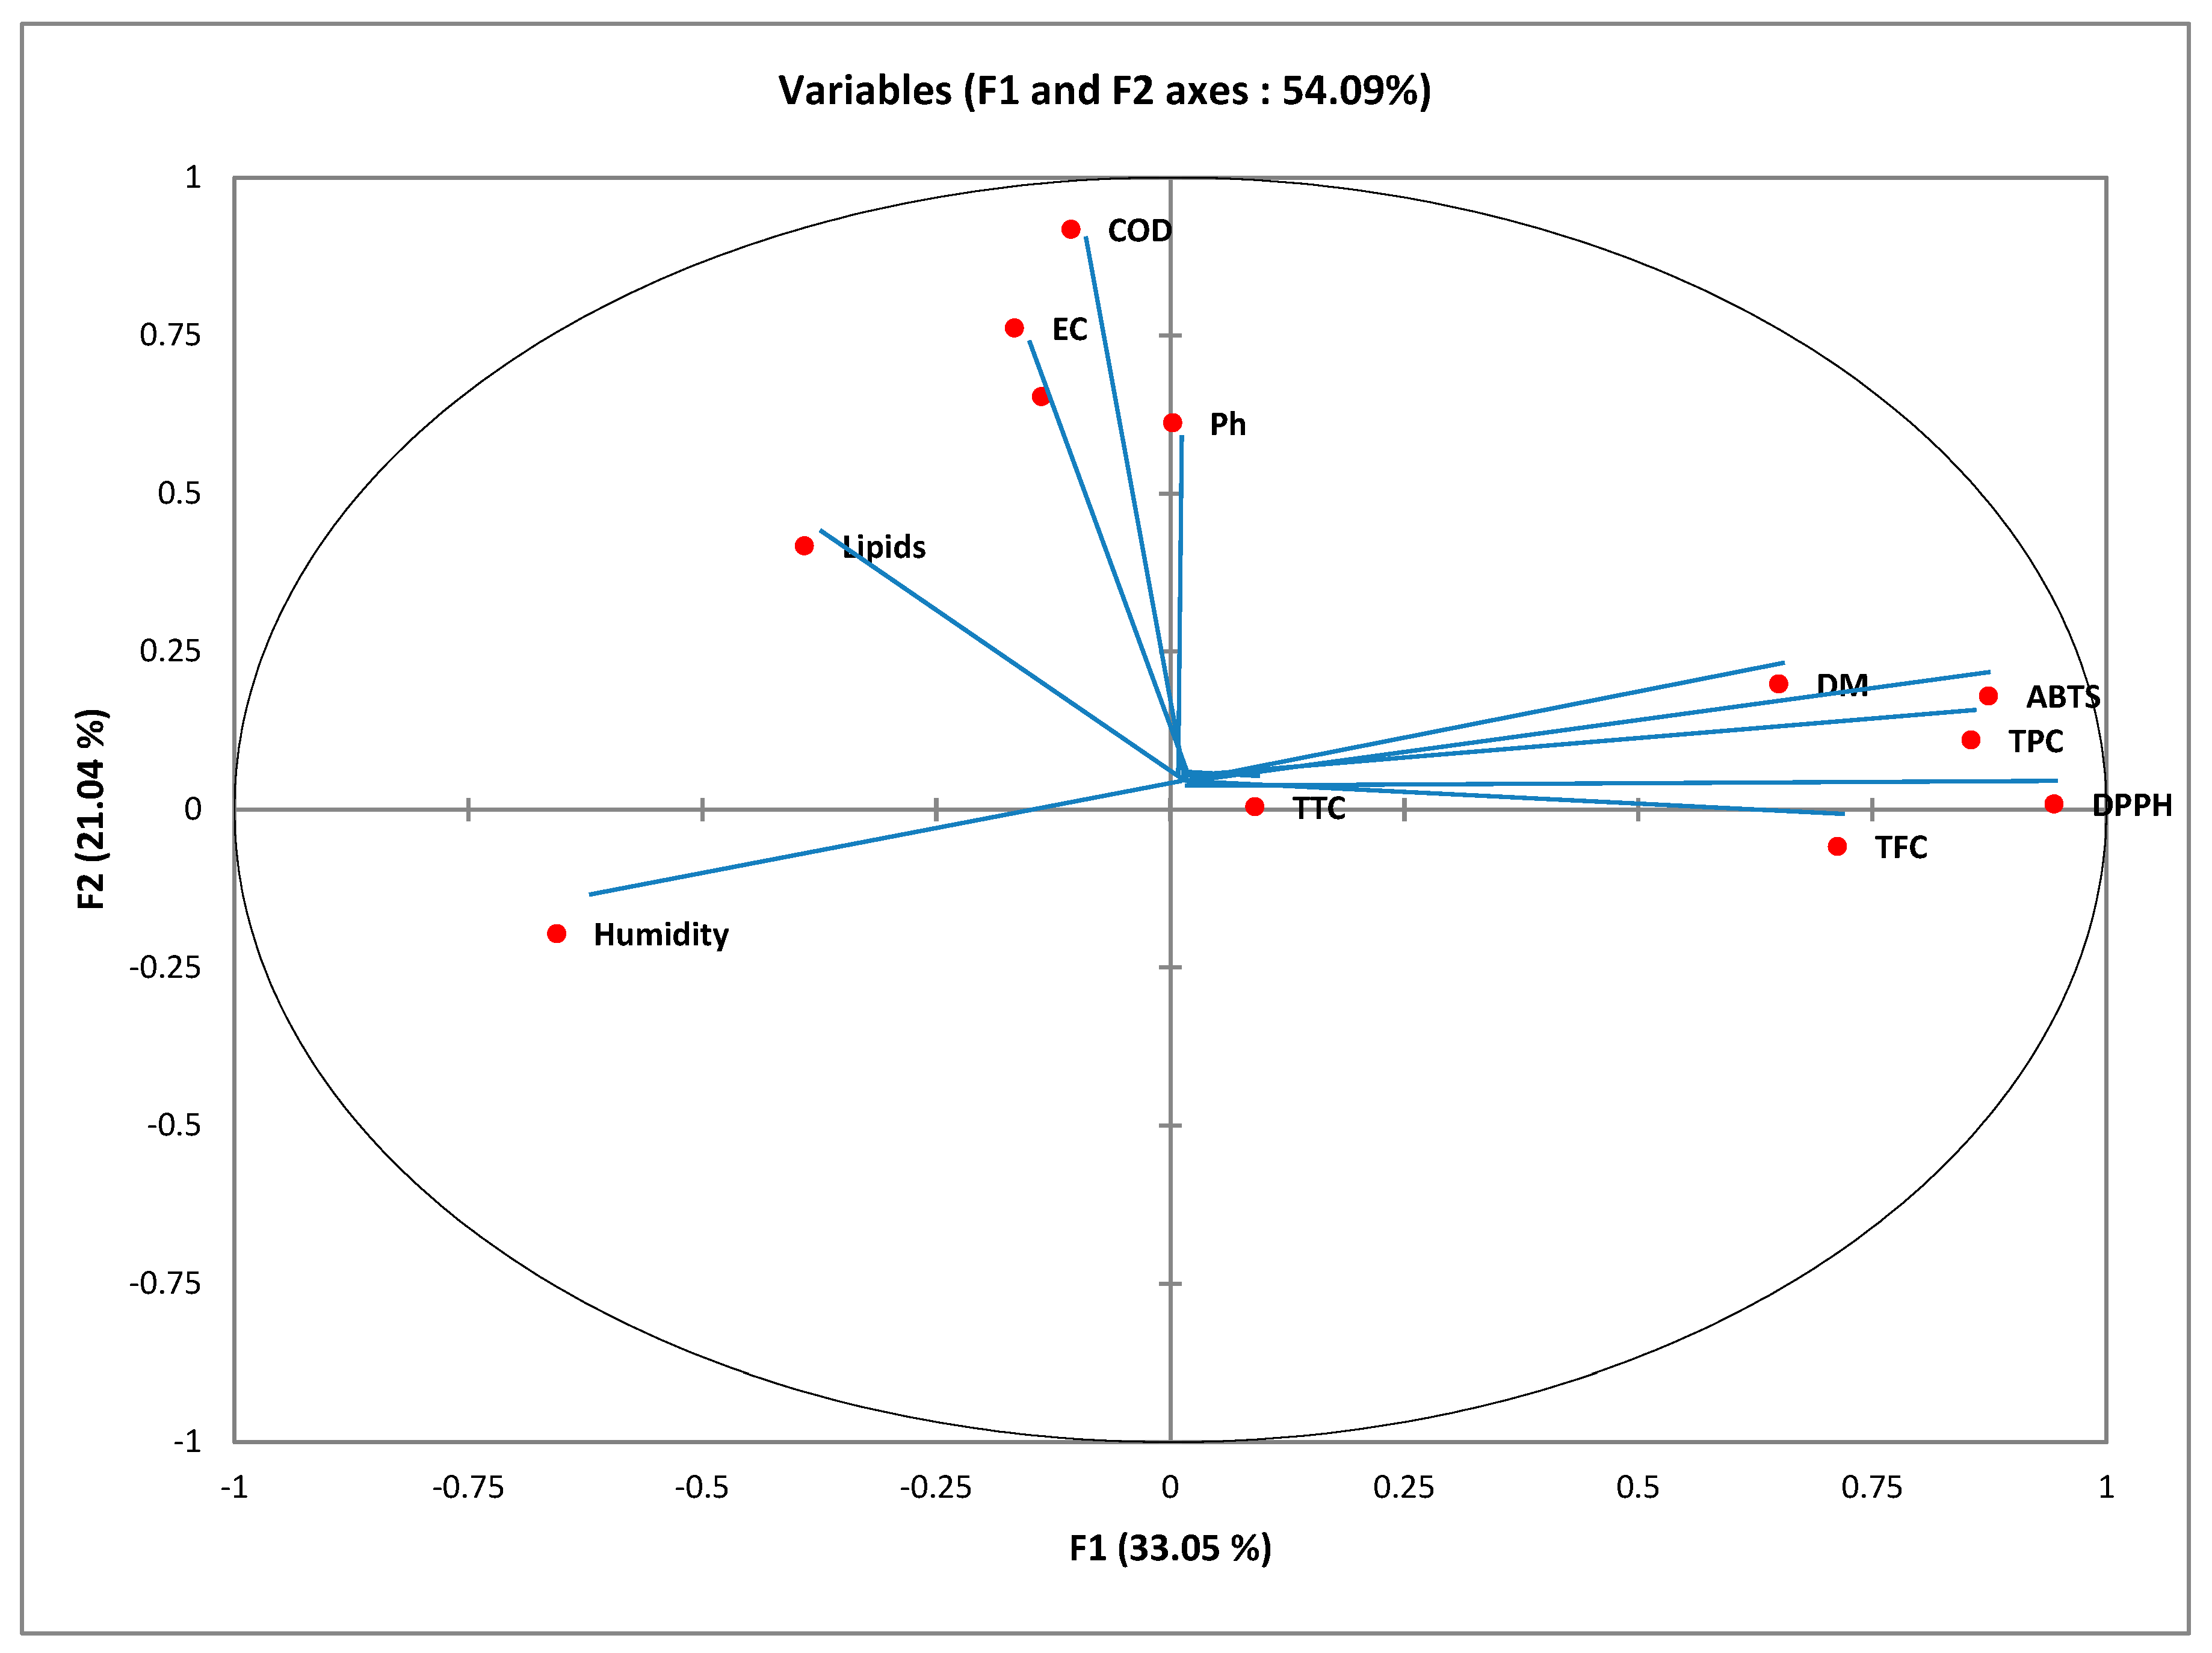
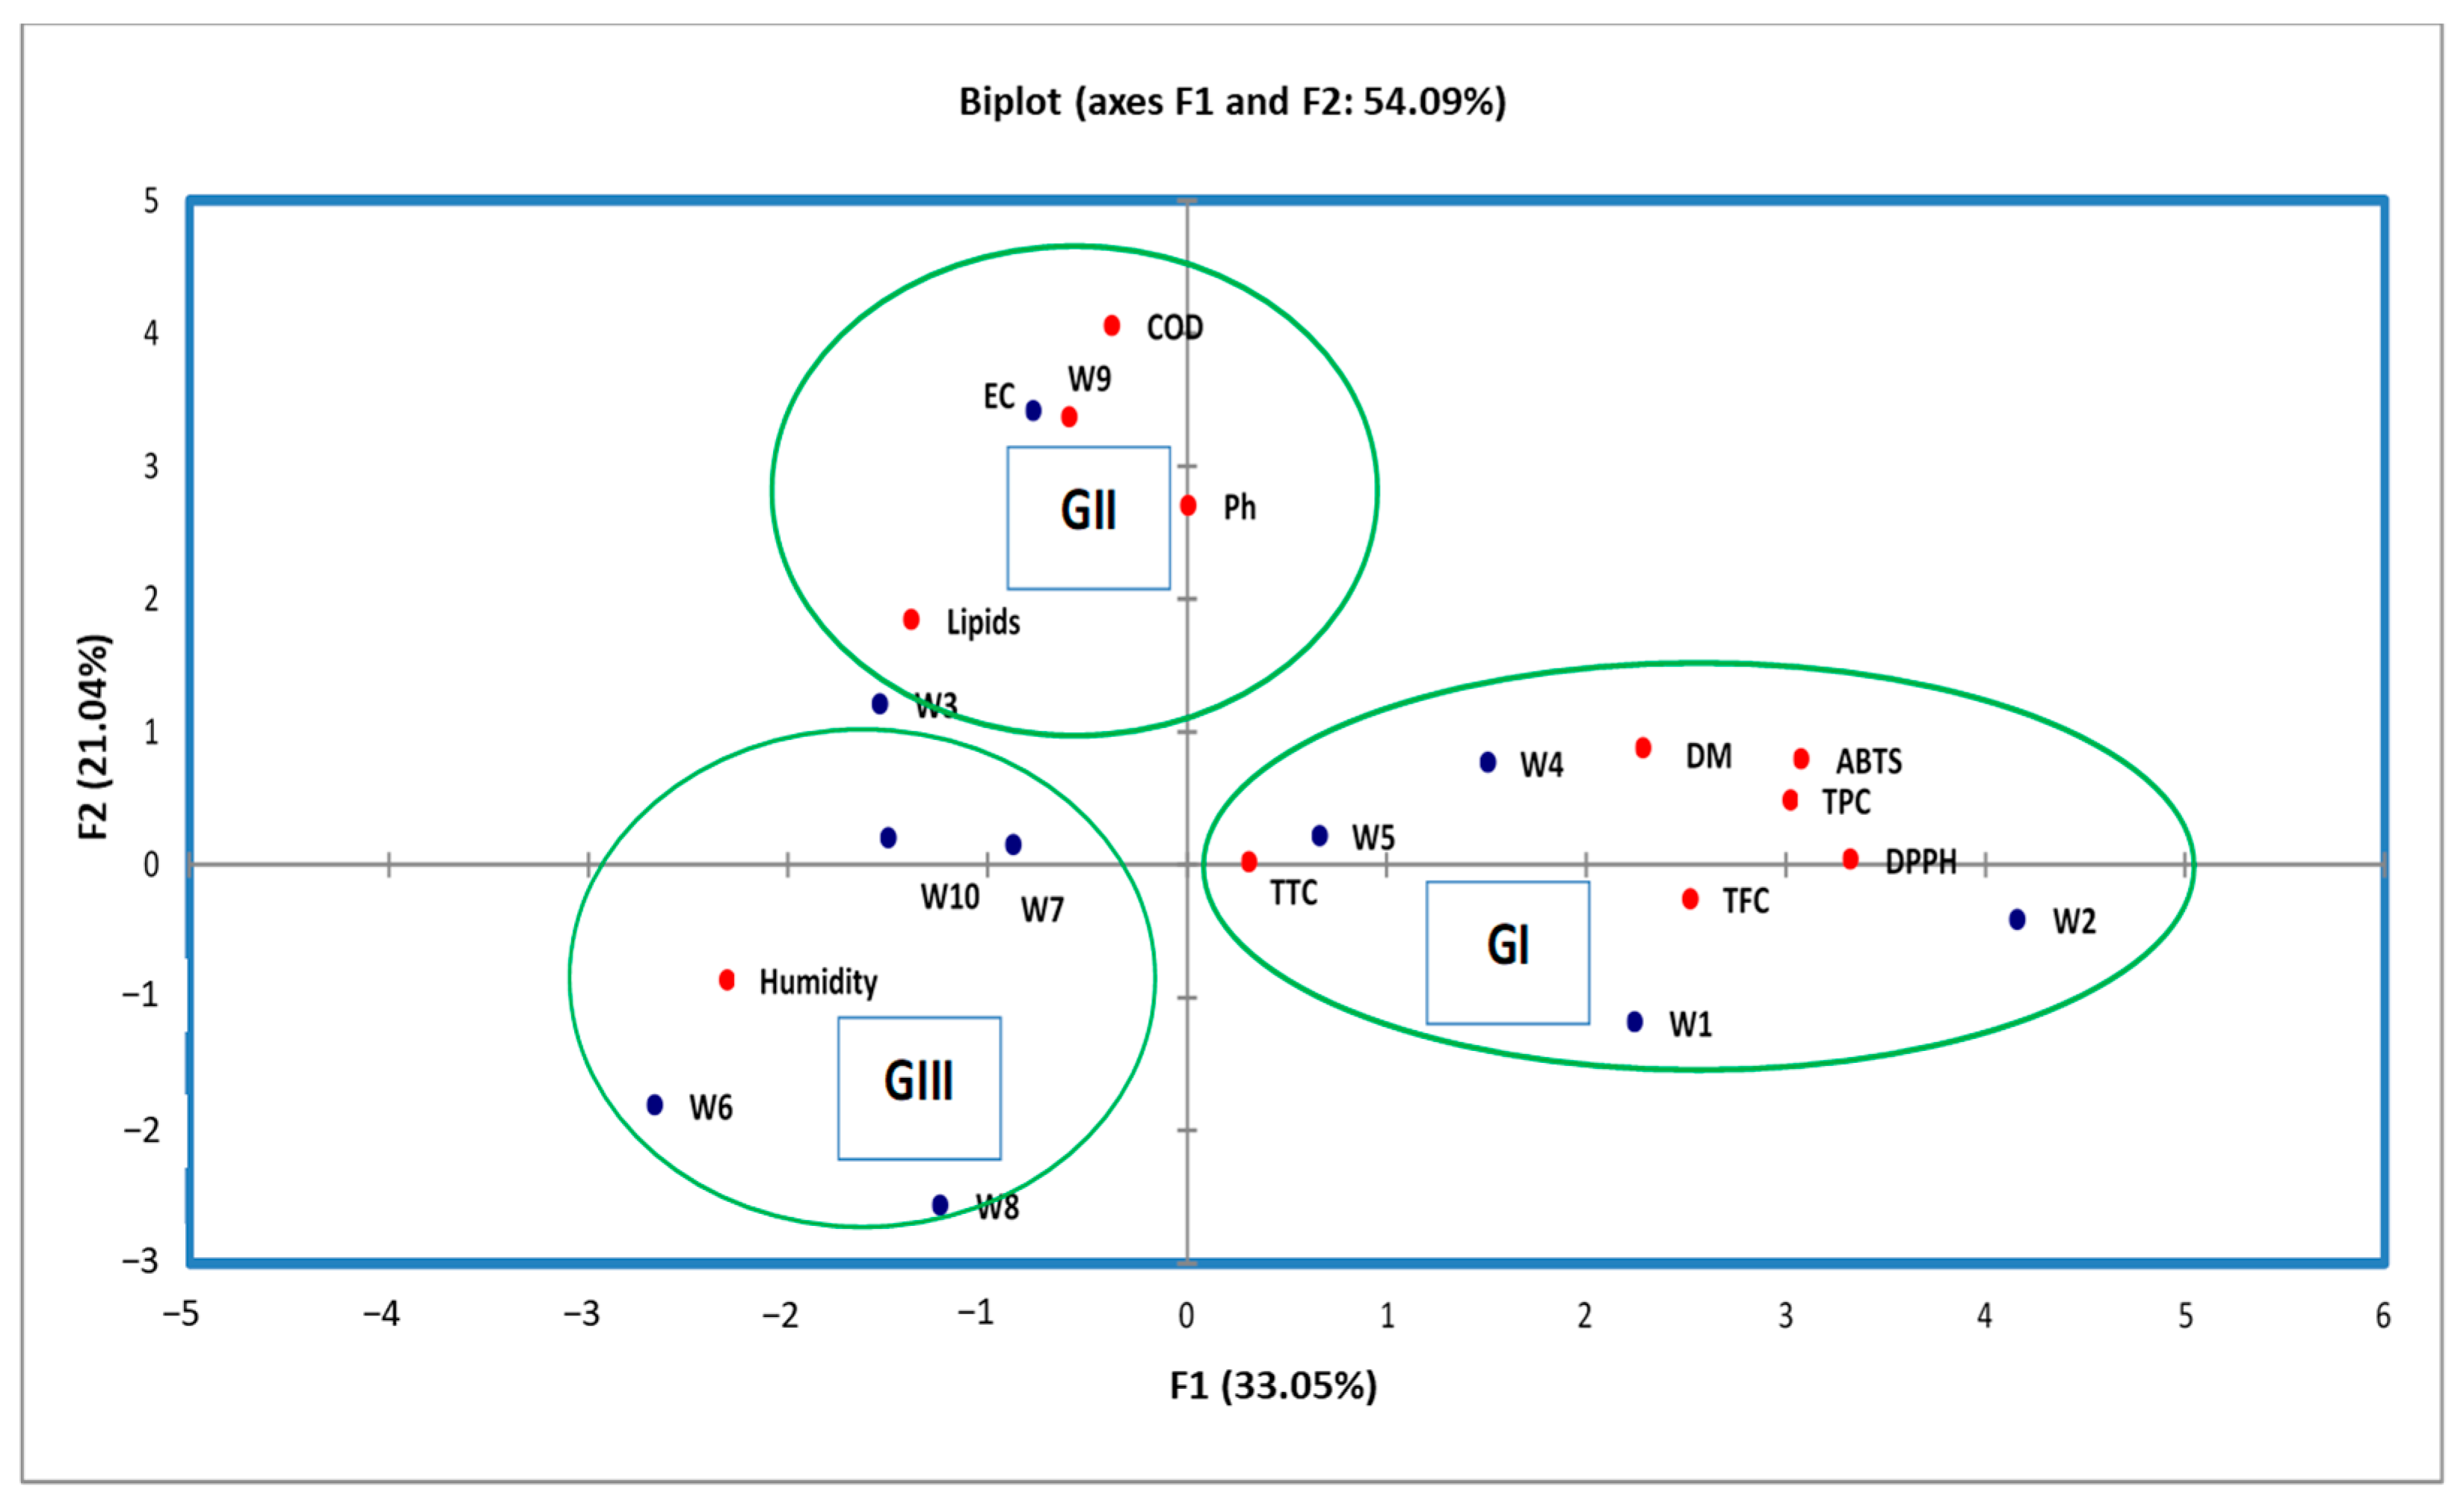
3.5. Principal Component Analysis (PCA)

The different physico-chemical characteristics data and the results of the phytochemical content and antioxidant activity of OMWs are considered variables. They are projected by the PCA on the F1–F2 factorial plan (Figure 1). The first main component (F1) and the second main component (F2) explain 33.05% and 21.04% of the total information, respectively. Moreover, the cumulative percentage of the two first principal components is 54.09%; accordingly, its linear combination is characteristic of the variables because it is more than 50%. Therefore, the first two axes are suitable for representing the information in general. Figure 1 represent the plane formed by axes F1 and F2 giving the correlation between the variables. The F1 axis is principally constructed by the positive correlation between the TPC, TFC, DPPH, and ABTS and the negative correlation between humidity and DM. Axis F2 is formed by the positive correlation between pH and EC (Figure 1).
Figure 2 shows that the 10 individuals are spread (extracts) into 3 groups.
Group I consist of 4 extracts (W1, W2, W4, and W5). They are characterized by the high value of TPC, TFC, and TTC, as well as a strong antioxidant activity by DPPH and ABTS assays. These extracts also had a high value of DM.
Group II is made up of two extracts named W3 and W9 collected in Meknes and Guelmim, respectively. They are characterized by a high value of pH and COD, as well as the value of lipids of these extracts being more than other groups.
Group III is formed by the 4 extracts named W6, W7, W8, and W10. They are characterized by the high value of humidity and by low antioxidant activity, because the values of TPC and TFC are less than other groups (1 and 2).

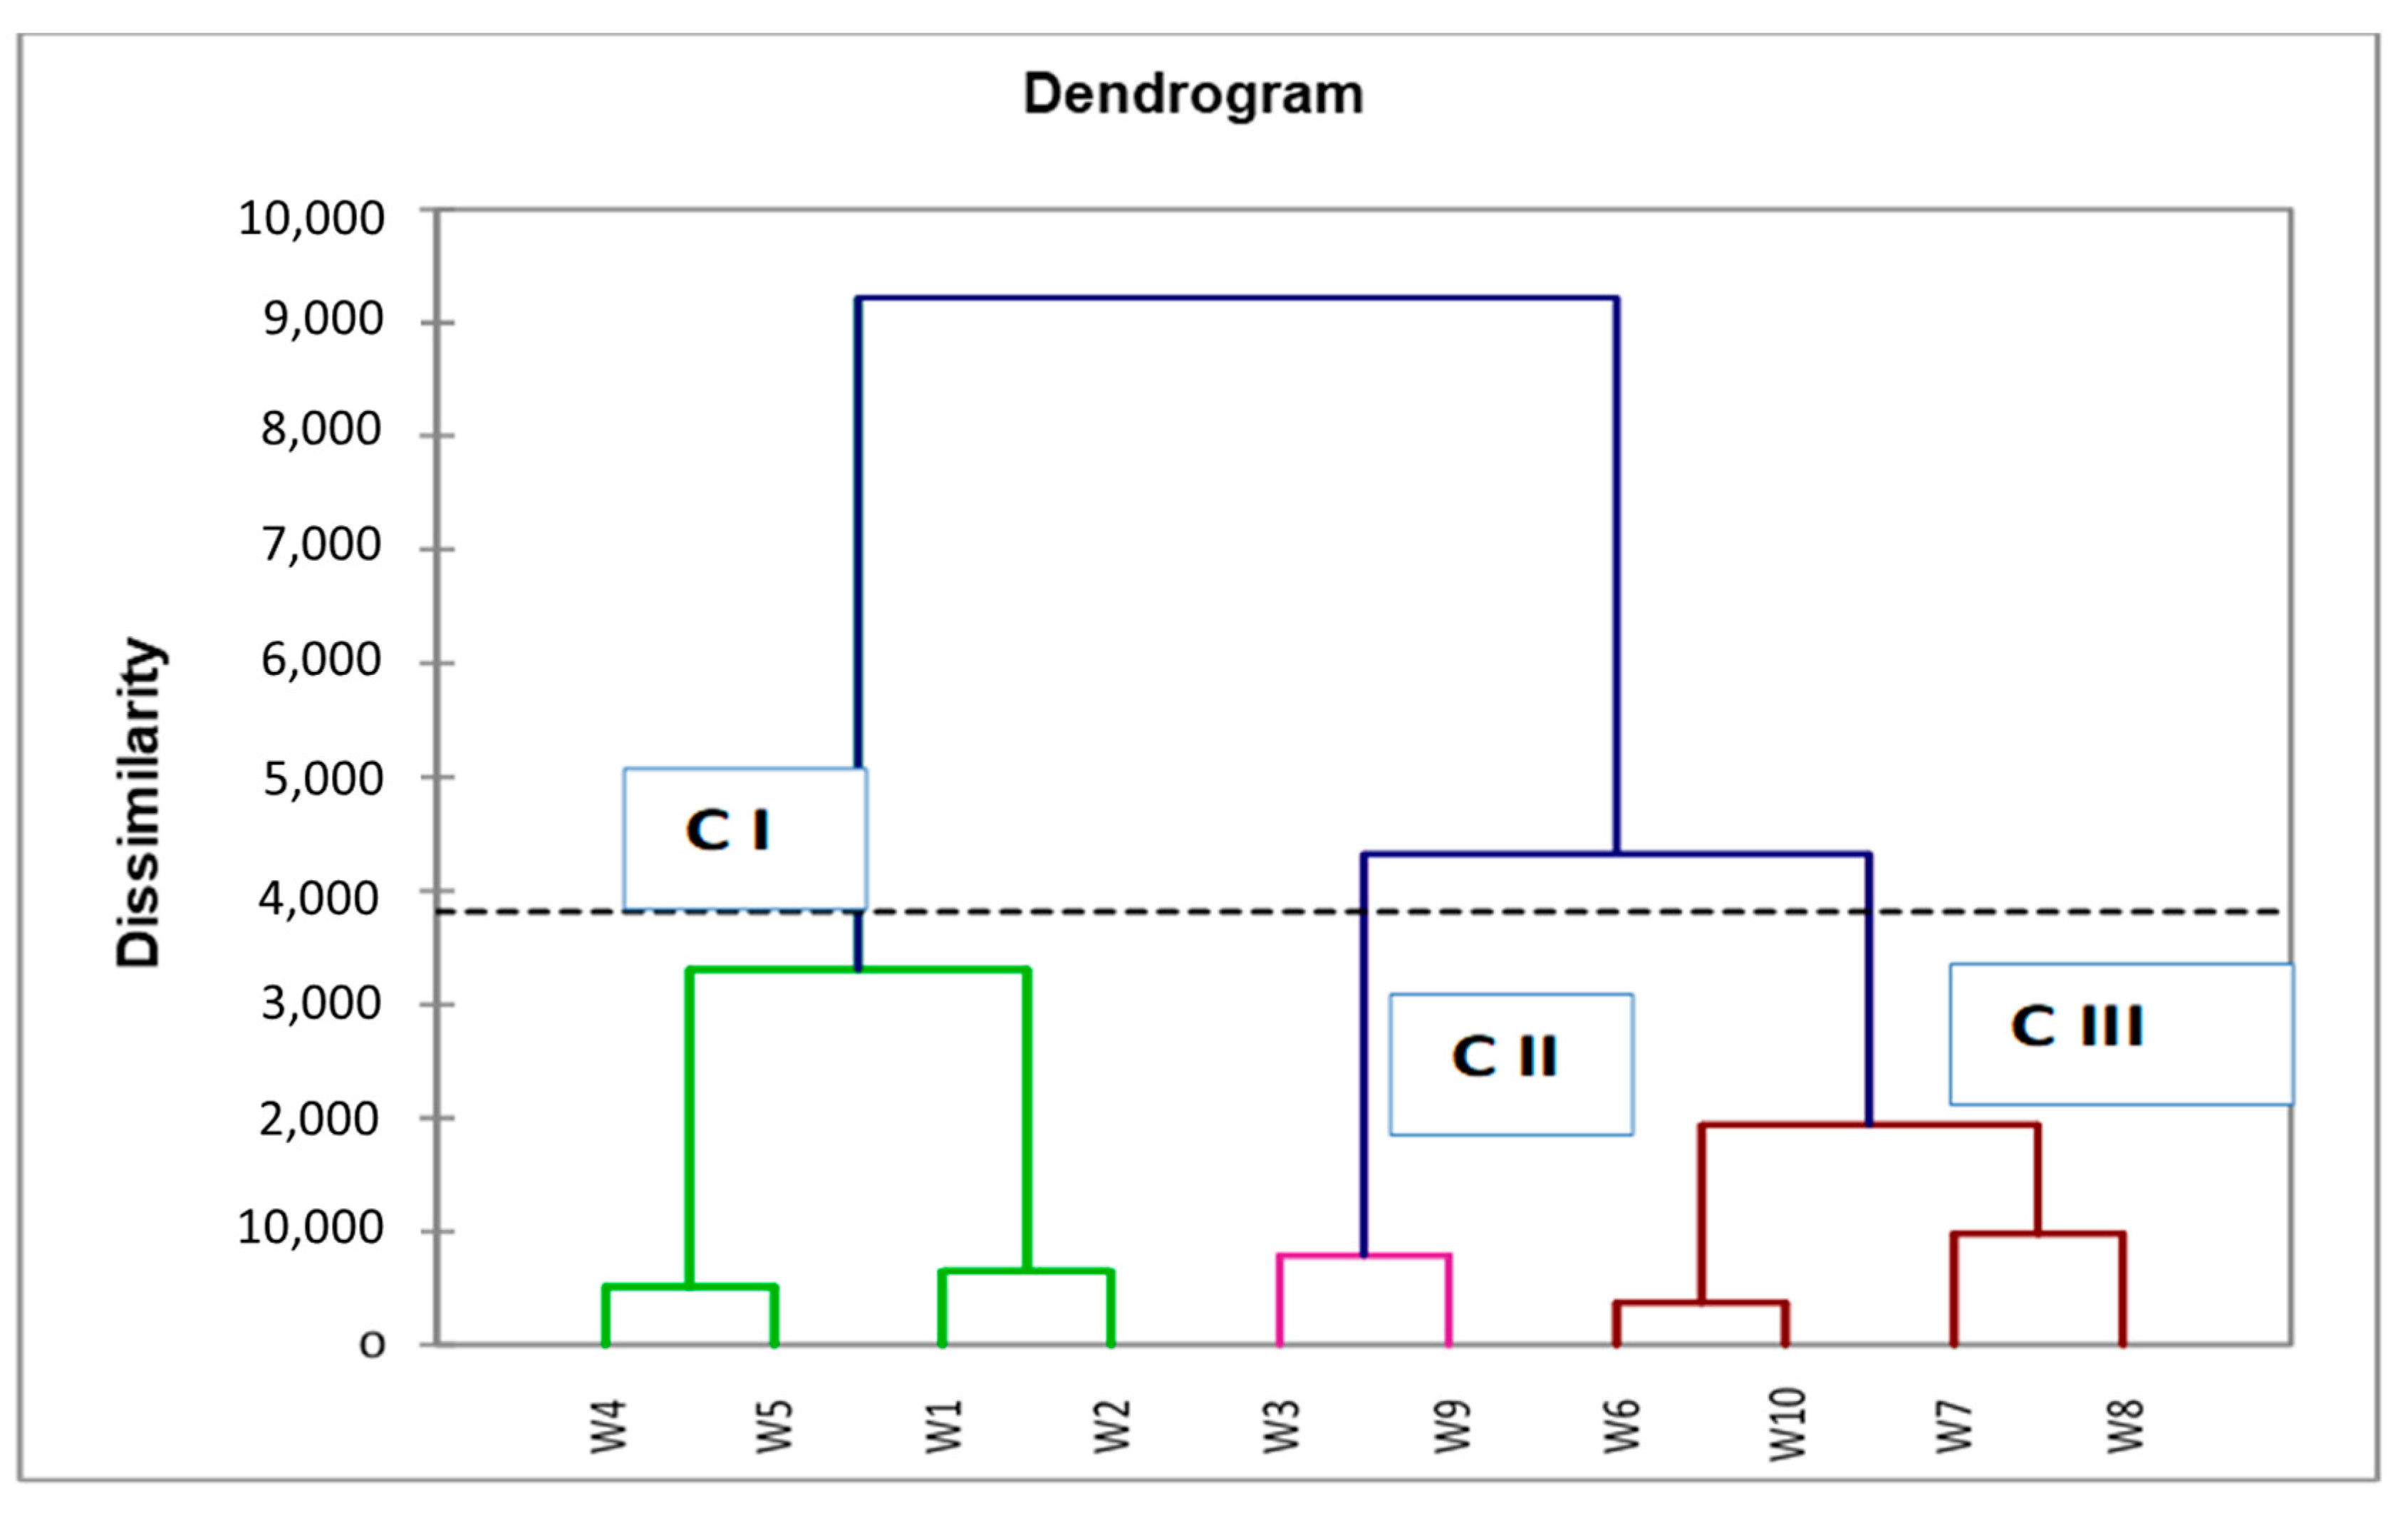
3.6. Hierarchical Clustering Analysis (HCA)

In order to evaluate the measure of similarity, the extracts of OMWs collected in 10 regions of Morocco were classified using the method of Wards and the Euclidean square.
HCA was used to quantify the correlation between all the extracts and to show similarities of 10 extracts based on the data of physico-chemical characteristics and the results of the phytochemical content as presented in the dendrogram in Figure 3.
According to the results of 10 extracts, these extracts were clustered into three clusters. Cluster I contains four extracts (W1, W2, W4, and W5), representing 40% of the total extracts characterized by a high value mean of TPC (467.90 mg GAE/g), TFC (312.19 mg QE/g), TTC (74.19 mg CE/g), and DM (22.22%), and they had a high antioxidant power compared to group II and group III, but they had a lower value mean of humidity (77.55%), EC (13.90 mS/cm), lipids (0.068%), and medium mean value of COD (174.25 g O2/L) and pH (4.6).
Cluster II, formed by two extracts named W3 and W9, accounted for 20% of total extracts. These extracts characterized by the strong mean value of COD (287.50 g O2/L), EC (16.30 mS/cm), lipids (0.25%), and pH (4.75). Moreover, they had a medium mean value of TPC (297.54 mg GAE/g), TFC (251.73 mg QE/g), and lowest mean value TTC (67.06 mg CE/g), but they are characterized by a medium antioxidant power. In addition, they had a medium mean value of humidity (89.75%) and DM (20.05%).
Cluster III contained extracts named W6, W7, W8, and W10, representing 40% of the total extracts. This cluster is characterized by a highest value mean of humidity 89.90%, and by a lowest mean value of TPC (283.20 mg GAE/g), TFC (232.63 mg QE/g), pH (4.52), DM (10%), and COD (142.25 g O2/L). Furthermore, these extracts had lower antioxidant power compared to group I and group II, and these extracts had a medium mean value of EC (14.10 mS/cm) and lipids (0.15%). This result is in conformity with those of the PCA in which the distribution of all extracts on the score plot shows a similar tendency. Furthermore, the comparison between the HCA and PCA is significant, which showed that the PCA score plot data were in line with HCA scores.

4. Conclusions

Results obtained from this work have shown that the OMWs of the ten regions studied showed diversity in their physico-chemical characteristics, their spectrophotometric assays, and their antioxidant activities. The OMWs studied are very acidic effluents with a pH lower than 7. The water content of this study showed very high percentages in all the studied regions. It reached 93%, and a minority of lipids in the order of 0.3 was somewhat proven. Spectrophotometric assays revealed that the different OMWs samples studied are rich in total polyphenols, flavonoids, and tannins, while the inhibitory capacity of free radicals using DPPH and ATBS showed that OMWs have an important antioxidant effect compared to ascorbic acid. PCA indicated the positive correlation between bioactive molecules and the antioxidant activities (DPPH, ABTS). This study has enabled us to deplete OMWs from their polluting organic matter and to use them as natural antioxidants for future work. Extracts of OMWs can be suggested as a new potential source of natural antioxidants in the pharmaceutical and food industries. Further studies are required for a better understanding of the antioxidant properties of OMWs and the valorization of its medicinal uses.

Author Contributions

Conceptualization, L.C.M. and A.B.; data curation, Y.E.I. and H.A.; formal analysis, H.E.M., K.W.G. and A.B.; funding acquisition, K.W.G.; investigation, C.E.G., H.H. and H.A.; methodology, H.E.M., Y.E.I., A.B. and M.T.; project administration, Z.L.E.I., H.H. and M.T.; resources, C.E.G., K.W.G. and L.C.M.; software, K.W.G.; supervision, L.C.M. and A.B.; validation, K.W.G.; visualization, K.W.G.; writing—original draft, C.E.G., Z.L.E.I., L.C.M. and M.T.; writing—review and editing, H.E.M., Y.E.I., H.H., H.A. and A.B. All authors have read and agreed to the published version of the manuscript.

Funding

This research received no external funding.

Institutional Review Board Statement

Not applicable.

Informed Consent Statement

Not applicable.

Data Availability Statement

All the available data are included in the manuscript.

Conflicts of Interest

The authors declare no conflict of interest.

References

  1. Boutaj, H.; Chakhchar, A.; Meddich, A.; Wahbi, S.; El Alaoui-Talibi, Z.; Douira, A.; Filali-Maltouf, A.; El Modafar, C. Bioprotection of Olive Tree from Verticillium Wilt by Autochthonous Endomycorrhizal Fungi. J. Plant Dis. Prot. 2020, 127, 349–357. [Google Scholar] [CrossRef]
  2. Zaroual, H.; El Hadrami, E.M.; Karoui, R. Preliminary Study on the Potential Application of Fourier-Transform Mid-Infrared for the Evaluation of Overall Quality and Authenticity of Moroccan Virgin Olive Oil. J. Sci. Food Agric. 2020, 101, 2901–2911. [Google Scholar] [CrossRef] [PubMed]
  3. Li, X.; Wang, S.C. Shelf Life of Extra Virgin Olive Oil and Its Prediction Models. J. Food Qual. 2018, 2018, 1639260. [Google Scholar] [CrossRef] [Green Version]
  4. Wang, Y.; Yu, L.; Zhu, Y.; Zhao, A.; Zhang, F.; Zhang, H.; Jin, Q.; Wu, G.; Wang, X. Chemical Profiles of Twenty-Three Monovarietal Olive Oils Produced in Liangshan Region of China. J. Oleo Sci. 2020, ess19265. [Google Scholar] [CrossRef] [PubMed]
  5. Ouedrhiri, M.; Benismail, C.; El Mohtadi, F.; Achkari-BEGDOURI, A. Évaluation de La Qualité de l’huile de Pulpe d’olive Vierge de La Variété Picholine Marocaine. Rev. Maroc. Des. Sci. Agron. Vétérinaires 2017, 5, 142–148. [Google Scholar]
  6. El Moudden, H.; El Yadini, A.; El Idrissi, Y.; Harhar, H.; Tabyaoui, B.; Tabyaoui, M.; Zarrouk, A. TiO 2-photocatalized degradation of vanillic acid in olive mill wastewaters. J. Chem. Technol. Metall. 2020, 55, 1019–1026. [Google Scholar]
  7. Gharby, S.; Harhar, H.; El Monfalouti, H.; Kartah, B.; Maata, N.; Guillaume, D.; Charrouf, Z. Chemical and Oxidative Properties of Olive and Argan Oils Sold on the Moroccan Market. A Comparative Study. Mediterr. J. Nutr. Metab. 2012, 5, 31–38. [Google Scholar] [CrossRef]
  8. Posadino, A.M.; Cossu, A.; Giordo, R.; Piscopo, A.; Abdel-Rahman, W.M.; Piga, A.; Pintus, G. Antioxidant Properties of Olive Mill Wastewater Polyphenolic Extracts on Human Endothelial and Vascular Smooth Muscle Cells. Foods 2021, 10, 800. [Google Scholar] [CrossRef]
  9. Yangui, A.; Abderrabba, M. Towards a High Yield Recovery of Polyphenols from Olive Mill Wastewater on Activated Carbon Coated with Milk Proteins: Experimental Design and Antioxidant Activity. Food Chem. 2018, 262, 102–109. [Google Scholar] [CrossRef]
  10. Dutournié, P.; Jeguirim, M.; Khiari, B.; Goddard, M.-L.; Jellali, S. Olive Mill Wastewater: From a Pollutant to Green Fuels, Agricultural Water Source, and Bio-Fertilizer. Part 2: Water Recovery. Water 2019, 11, 768. [Google Scholar] [CrossRef] [Green Version]
  11. Yahia, Y.; Benabderrahim, M.A.; Tlili, N.; Hannachi, H.; Ayadi, L.; Elfalleh, W. Comparison of Three Extraction Protocols for the Characterization of Caper (Capparis spinosa L.) Leaf Extracts: Evaluation of Phenolic Acids and Flavonoids by Liquid Chromatography–Electrospray Ionization–Tandem Mass Spectrometry (LC–ESI–MS) and the Antioxidant Activity. Anal. Lett. 2020, 53, 1366–1377. [Google Scholar]
  12. Federation, W.E. American Public Health Association. In Standard Methods for the Examination of Water and Wastewater; American Public Health Association (APHA): Washington, DC, USA, 2005. [Google Scholar]
  13. 2510 Conductivity; Standard Methods for the Examination of Water and Wastewater. American Public Health Association: Washington, DC, USA, 2018.
  14. 2540 SOLIDS—Standard Methods for the Examination of Water and Wastewater. Available online: https://www.standardmethods.org/doi/abs/10.2105/SMWW.2882.030 (accessed on 4 April 2021).
  15. 5220 Chemical Oxygen Demand (COD)—Standard Methods for the Examination of Water and Wastewater. Available online: https://www.standardmethods.org/doi/10.2105/SMWW.2882.103 (accessed on 4 April 2021).
  16. Bharagava, R.N.; Saxena, G.; Mulla, S.I.; Patel, D.K. Characterization and Identification of Recalcitrant Organic Pollutants (ROPs) in Tannery Wastewater and Its Phytotoxicity Evaluation for Environmental Safety. Arch. Environ. Contam. Toxicol. 2018, 75, 259–272. [Google Scholar] [CrossRef]
  17. El-Guezzane, C.; El-Moudden, H.; Harhar, H.; Chahboun, N.; Tabyaoui, M.; Zarrouk, A. A Comparative Study of the Antioxidant Activity of Two Moroccan Prickly Pear Cultivars Collected in Different Regions. Chem. Data Collect. 2021, 31, 100637. [Google Scholar] [CrossRef]
  18. El Moudden, H.; El Idrissi, Y.; Belmaghraoui, W.; Belhoussaine, O.; El Guezzane, C.; Bouayoun, T.; Harhar, H.; Tabyaoui, M. Olive Mill Wastewater Polyphenol-Based Extract as a Vegetable Oil Shelf Life Extending Additive. J. Food Processing Preserv. 2020, 44, e14990. [Google Scholar] [CrossRef]
  19. El Guezzane, C.; El Moudden, H.; Harhar, H.; Warad, I.; Bellaouchou, A.; Guenbour, A.; Zarrouk, A.; Tabyaoui, M. Optimization of Roasting Conditions on the Bioactive Compounds and Their Antioxidant Power from Opuntia Fiscus-Indica Seeds Using Response Surface Methodology (RSM). Biointerface Res. Appl. Chem. 2020, 11, 10510–10532. [Google Scholar]
  20. Boujemaa, I.; El Bernoussi, S.; Harhar, H.; Tabyaoui, M. The Influence of the Species on the Quality, Chemical Composition and Antioxidant Activity of Pumpkin Seed Oil. OCL 2020, 27, 40. [Google Scholar] [CrossRef]
  21. Zhang, H.; Yang, Y.; Zhou, Z. Phenolic and Flavonoid Contents of Mandarin (Citrus Reticulata Blanco) Fruit Tissues and Their Antioxidant Capacity as Evaluated by DPPH and ABTS Methods. J. Integr. Agric. 2018, 17, 256–263. [Google Scholar] [CrossRef]
  22. Zielinski, A.A.; Haminiuk, C.W.; Nunes, C.A.; Schnitzler, E.; van Ruth, S.M.; Granato, D. Chemical Composition, Sensory Properties, Provenance, and Bioactivity of Fruit Juices as Assessed by Chemometrics: A Critical Review and Guideline. Compr. Rev. Food Sci. Food Saf. 2014, 13, 300–316. [Google Scholar] [CrossRef] [PubMed]
  23. Mekki, A.; Dhouib, A.; Sayadi, S. Effects of Olive Mill Wastewater Application on Soil Properties and Plants Growth. Int. J. Recycl. Org. Waste Agric. 2013, 2, 15. [Google Scholar] [CrossRef] [Green Version]
  24. Khoufi, S.; Louhichi, A.; Sayadi, S. Optimization of Anaerobic Co-Digestion of Olive Mill Wastewater and Liquid Poultry Manure in Batch Condition and Semi-Continuous Jet-Loop Reactor. Bioresour. Technol. 2015, 182, 67–74. [Google Scholar] [CrossRef]
  25. Paulo, F.; Santos, L. Deriving Valorization of Phenolic Compounds from Olive Oil By-Products for Food Applications through Microencapsulation Approaches: A Comprehensive Review. Crit. Rev. Food Sci. Nutr. 2020, 61, 920–945. [Google Scholar] [CrossRef] [PubMed]
  26. Nikiema, M.; Somda, M.K.; Sawadogo, J.B.; Dianou, D.; Traoré, A.S.; Ouattara, A.S. Valorization of Agricultural Waste: Theoretical Estimation and Experimental Biomethane Yield from Cashew Nut Hulls. J. Sustain. Bioenergy Syst. 2020, 10, 113. [Google Scholar] [CrossRef]
  27. Paraskeva, C.A.; Papadakis, V.G.; Tsarouchi, E.; Kanellopoulou, D.G.; Koutsoukos, P.G. Membrane Processing for Olive Mill Wastewater Fractionation. Desalination 2007, 213, 218–229. [Google Scholar] [CrossRef]
  28. Sassi, A.B.; Boularbah, A.; Jaouad, A.; Walker, G.; Boussaid, A. A Comparison of Olive Oil Mill Wastewaters (OMW) from Three Different Processes in Morocco. Process Biochem. 2006, 41, 74–78. [Google Scholar] [CrossRef]
  29. Kamal-Eldin, A. Effect of Fatty Acids and Tocopherols on the Oxidative Stability of Vegetable Oils. Eur. J. Lipid Sci. Technol. 2006, 108, 1051–1061. [Google Scholar] [CrossRef]
  30. De Ursinos, J.F.R.; Padilla, R.B. Use and Treatment of Olive Mill Wastewater: Current Situation and Prospects in Spain. Grasas Y Aceites 1992, 43, 101–106. [Google Scholar] [CrossRef] [Green Version]
  31. Mouncif, M.; Tamoh, S.; Faid, M.; Achkari-Begdouri, A. A Study of Chemical and Microbiological Characteristics of Olive Mill Waste Water in Morocco. Grasas Y Aceites 1993, 44, 335–338. [Google Scholar] [CrossRef] [Green Version]
  32. Al-Bsoul, A.; Al-Shannag, M.; Tawalbeh, M.; Al-Taani, A.A.; Lafi, W.K.; Al-Othman, A.; Alsheyab, M. Optimal Conditions for Olive Mill Wastewater Treatment Using Ultrasound and Advanced Oxidation Processes. Sci. Total Environ. 2020, 700, 134576. [Google Scholar] [CrossRef]
  33. Morillo, J.A.; Antizar-Ladislao, B.; Monteoliva-Sánchez, M.; Ramos-Cormenzana, A.; Russell, N.J. Bioremediation and Biovalorisation of Olive-Mill Wastes. Appl. Microbiol. Biotechnol. 2009, 82, 25–39. [Google Scholar] [CrossRef] [PubMed]
  34. Kachouri, F.; Hamdi, M. Enhancement of Polyphenols in Olive Oil by Contact with Fermented Olive Mill Wastewater by Lactobacillus Plantarum. Process Biochem. 2004, 39, 841–845. [Google Scholar] [CrossRef]
  35. Leouifoudi, I.; Harnafi, H.; Zyad, A. Olive Mill Waste Extracts: Polyphenols Content, Antioxidant, and Antimicrobial Activities. Adv. Pharmacol. Sci. 2015, 2015, 714138. [Google Scholar] [CrossRef] [PubMed]
  36. Di Mauro, M.D.; Giardina, R.C.; Fava, G.; Mirabella, E.F.; Acquaviva, R.; Renis, M.; D’antona, N. Polyphenolic Profile and Antioxidant Activity of Olive Mill Wastewater from Two Sicilian Olive Cultivars: Cerasuola and Nocellara Etnea. Eur. Food Res. Technol. 2017, 243, 1895–1903. [Google Scholar] [CrossRef]
  37. El-Abbassi, A.; Kiai, H.; Hafidi, A. Phenolic Profile and Antioxidant Activities of Olive Mill Wastewater. Food Chem. 2012, 132, 406–412. [Google Scholar] [CrossRef] [PubMed]
  38. Günal, D.; Turan, S. Effects of Olive Wastewater and Pomace Extracts, Lecithin, and Ascorbyl Palmitate on the Oxidative Stability of Refined Sunflower Oil. J. Food Processing Preserv. 2018, 42, e13705. [Google Scholar] [CrossRef]
  39. Wanasundara, P.; Shahidi, F.; Shahidi, F. Bailey’s Industrial Oil and Fat Products; Wiley: New York, NY, USA, 2005. [Google Scholar]
  40. Górniak, I.; Bartoszewski, R.; Króliczewski, J. Comprehensive Review of Antimicrobial Activities of Plant Flavonoids. Phytochem. Rev. 2019, 18, 241–272. [Google Scholar] [CrossRef] [Green Version]
  41. Bouaziz, M.; Fki, I.; Jemai, H.; Ayadi, M.; Sayadi, S. Effect of Storage on Refined and Husk Olive Oils Composition: Stabilization by Addition of Natural Antioxidants from Chemlali Olive Leaves. Food Chem. 2008, 108, 253–262. [Google Scholar] [CrossRef]
  42. Sousa, A.; Ferreira, I.C.; Barros, L.; Bento, A.; Pereira, J.A. Effect of Solvent and Extraction Temperatures on the Antioxidant Potential of Traditional Stoned Table Olives “Alcaparras”. LWT-Food Sci. Technol. 2008, 41, 739–745. [Google Scholar] [CrossRef]
  43. Fki, I.; Allouche, N.; Sayadi, S. The Use of Polyphenolic Extract, Purified Hydroxytyrosol and 3, 4-Dihydroxyphenyl Acetic Acid from Olive Mill Wastewater for the Stabilization of Refined Oils: A Potential Alternative to Synthetic Antioxidants. Food Chem. 2005, 93, 197–204. [Google Scholar] [CrossRef]
  44. De Marco, E.; Savarese, M.; Paduano, A.; Sacchi, R. Characterization and Fractionation of Phenolic Compounds Extracted from Olive Oil Mill Wastewaters. Food Chem. 2007, 104, 858–867. [Google Scholar] [CrossRef]
  45. Mansouri, A.; Embarek, G.; Kokkalou, E.; Kefalas, P. Phenolic Profile and Antioxidant Activity of the Algerian Ripe Date Palm Fruit (Phoenix Dactylifera). Food Chem. 2005, 89, 411–420. [Google Scholar] [CrossRef]
  46. Conde, E.; Cara, C.; Moure, A.; Ruiz, E.; Castro, E.; Domínguez, H. Antioxidant Activity of the Phenolic Compounds Released by Hydrothermal Treatments of Olive Tree Pruning. Food Chem. 2009, 114, 806–812. [Google Scholar] [CrossRef]
  47. Cheniany, M.; Ebrahimzadeh, H.; Vahdati, K.; Preece, J.E.; Masoudinejad, A.; Mirmasoumi, M. Content of Different Groups of Phenolic Compounds in Microshoots of Juglans Regia Cultivars and Studies on Antioxidant Activity. Acta Physiol. Plant. 2013, 35, 443–450. [Google Scholar] [CrossRef]
Figure 1. PCA factorial plan carried out on the for physico-chemical characteristics and antioxidants compounds of OMWs.
Sustainability 14 14488 g001
Figure 2. Projection of individuals on the factorial plan (F1×F2). GI: Group I; GII: Group II.
Sustainability 14 14488 g002
Figure 3. Dendrogram of the extracts studied obtained by cluster analysis (Ward and Euclidean distance). CI: Cluster I; CII: Cluster II; C III; Cluster III.
Sustainability 14 14488 g003
Table 1. Sites of collection and their geographical data.
LocationAltitude (m)Average Temperature (°C)Rainfall (mm)
Beni Mellal50018.3493
Shoul21117.9530
Meknes51617.2576
Khenifra83716.0633
Sidi Allal El Bahraoui34418.0534
Sidi Slimane15918.2326
Kelaat Sraghna40019.1278
Taza55017.9563
Guelmim30418.9119
Guercif37818.5222
Table 2. Physico-chemical characteristics of OMWs studies.
W1W2W3W4W5W6W7W8W9W10
pH4.6 ± 0.02 ad4.6 ± 0.02 ad4.7 ± 0.02 ac4.7 ± 0.02 ac4.5 ± 0.02 d4.6 ± 0.02 ad4.6 ± 0.02 ad3.8 ± 0.02 b4.8 ± 0.02 c5.1 ± 0.02 e
EC (mS/cm)11.3 ± 0.05 a12.1 ± 0.05 b11.9 ± 0.05 b16.1 ± 0.05 c16.1 ± 0.05 c12.9 ± 0.05 d14.9 ± 0.05 e9.5 ± 0.05 f20.7 ± 0.05 g19.1 ± 0.05 h
Humidity (%)91.3 ± 1.00 ae46.1 ± 0.54 b83.1 ± 0.82 c86.7 ± 0.60 ac86.1 ± 0.90 cd93.4 ± 1.02 e89.9 ± 1.10 ade87.4 ± 0.89 ac76.6 ± 0.50 f88.9 ± 0.75 ade
DM (%)8.1 ± 1.00 ai53.8 ± 0.54 b16.8 ± 0.82 c13.2 ± 0.60 cd13.8 ± 0.90 ce6.5 ± 1.02 a10.0 ± 1.10 aedf12.5 ± 0.89 cfg23.3 ± 0.50 h11.0 ± 0.75 edgi
Lipids (%)0.10 ± 0.02 a0.09 ± 0.01 a0.2 ± 0.01 b0.04 ± 0.01 a0.04 ± 0.01 a0.2 ± 0.02 b0.3 ± 0.02 c0.07 ± 0.01 a0.3 ± 0.02 c0.03 ± 0.01 a
COD (g O2/L)159 ± 2.02 a126 ± 1.00 b275 ± 2.20 c212 ± 1.80 d200 ± 1.10 e93 ± 0.80 f187 ± 1.60 g117 ± 1.44 b300 ± 2.78 h172 ± 1.24 i
The data are presented in the form of the average of three individual repetitions (n = 3e ± SEM). The means ± SD in the same row with the same letters are not significantly different (p > 0.05). EC: Electrical conductivity, DM: dry matter, COD: chemical oxygen demand.
Table 3. Flavonoid, tannin, and total phenolic content of OMW extracts.
SampleTPC (mg GAE/1 g Extract)TFC (mg QE/1 g Extract)TTC (mg CE/1 g Extract)
W1431.03 ± 1.68 a421.47 ± 3.2 a106.28 ± 1.9 a
W2469.59 ± 4.46 b355.68 ± 5.21 b65.05 ± 2.04 be
W3287.42 ± 8.18 ch194.63 ± 1.07 c82.72 ± 0.8 c
W4534.16 ±3.10 d242.52 ± 1.18 d54.08 ± 1.96 dh
W5436.81 ± 1.11 a228.84 ± 3.08 d71.36 ± 2.08 b
W6238.26 ± 5.12 e179.89 ± 1.10 c61.12 ± 1.11 ed
W7370.31 ± 7.10 f289.80 ± 3.10 e97.04 ± 2.03 af
W8275.37 ± 2.22 cg275.68 ± 1.30 e39.66 ± 2.22 g
W9307.66 ± 7.07 h308.84 ± 2.14 f51.40 ± 1.2 h
W10248.86 ± 4.09 eg185.15 ± 3.15 c91.98 ± 1.01 cf
Different letters exposing in the same column are not different (p < 0.05). TPC: Total phenolic content, TFC: total flavonoid content, TTC: total tannin content, GAE: gallic acid equivalent, QE: quercetin equivalent, CE: catechin equivalent.
Table 4. Total antioxidant capacity, scavenging ability on DPPH and ABTS radical capacities in different extracts of OMWs.
SampleDPPH IC50 (µg/mL)ABTS IC50 (µg/mL)
W10.32 ± 0.02 a2.04 ± 0.2 a
W20.3 ± 0.6 a2.28 ± 0.11 a
W31.05 ± 0.05 be3.65 ± 0.3 ab
W40.36 ± 0.3 a2.20 ± 0.04 a
W50.49 ± 0.07 ac2.32 ± 0.22 a
W61.25 ± 0.12 be6.11 ± 0.11 b
W71.35 ± 0.09 b2.89 ± 0.10 ab
W81.93 ± 0.03 d3.73 ± 0.22 ab
W90.86 ± 0.8 ce3.02 ± 0.12 ab
W101.17 ± 0.10 be3.25 ± 0.25 ab
Trolox2.96 ± 0.14 f30.85 ± 2.1 c
Different letters exposing in the same column reveal the significant difference (p < 0.05).
Table 5. Pearson’s correlation matrix coefficient between physico-chemical characteristics and antioxidant compounds.
VariablespHECHumidityDMLipidsCODTPCTFCTTCDPPH (1/IC50)ABTS (1/IC50)
pH10.692−0.0440.0440.1260.4150.014−0.1960.4850.1300.117
EC0.69210.055−0.0510.1700.561−0.034−0.2490.004−0.1300.069
Humidity−0.0440.0551−1.0000.0450.007−0.350−0.3770.237−0.492−0.310
DM0.044−0.051−1.0001−0.043−0.0060.3460.368−0.2430.4860.304
Lipids0.1260.1700.045−0.04310.391−0.3450.0650.078−0.433−0.388
COD0.4150.5610.007−0.0060.39110.055−0.0770.047−0.0870.154
TPC0.014−0.034−0.3500.346−0.3450.05510.4900.0450.8630.893
TFC−0.196−0.249−0.3770.3680.065−0.0770.49010.2010.6160.655
TTC0.4850.0040.237−0.2430.0780.0470.0450.20110.1320.277
DPPH (1/IC50)0.130−0.130−0.4920.486−0.433−0.0870.8630.6160.13210.855
ABTS (1/IC50)0.1170.069−0.3100.304−0.3880.1540.8930.6550.2770.8551
The values in bold are different from 0 at a significance level alpha = 0.05.
Table 6. p-values of the correlation matrix coefficient.
VariablespHECHumidityDMLipidsCODTPCTFCTTCDPPH (1/IC50)ABTS (1/IC50)
pH00.0270.9040.9040.7280.2320.9700.5870.1550.7210.747
EC0.02700.8810.8890.6390.0920.9250.4880.9910.7200.849
Humidity0.9040.8810<0.00010.9020.9840.3220.2840.5090.1480.384
DM0.9040.889<0.000100.9050.9870.3270.2960.4980.1550.394
Lipids0.7280.6390.9020.90500.2640.3290.8580.8310.2110.268
COD0.2320.0920.9840.9870.26400.8790.8320.8970.8110.671
TPC0.9700.9250.3220.3270.3290.87900.1510.9030.0010.001
TFC0.5870.4880.2840.2960.8580.8320.15100.5770.0580.040
TTC0.1550.9910.5090.4980.8310.8970.9030.57700.7160.438
DPPH (1/IC50)0.7210.7200.1480.1550.2110.8110.0010.0580.71600.002
ABTS (1/IC50)0.7470.8490.3840.3940.2680.6710.0010.0400.4380.0020
Values are expressed with SD. EC: Electrical conductivity, DM: dry matter, SS: suspended solids, COD: chemical oxygen demand. The values in bold are different from 0 at a significance level alpha = 0.05.
Publisher’s Note: MDPI stays neutral with regard to jurisdictional claims in published maps and institutional affiliations.

