1. Introduction
Since the reform and opening up, China’s economic development has made unprecedented achievements. However, problems such as low-end lock-in of the industrial chain caused by overcapacity, weak independent innovation capacity, and distorted factor prices have greatly hindered its high-quality economic development (HQD). To this end, the Fifth Plenary Session of the 19th CPC Central Committee pointed out that it is necessary to implement critical measures such as speed shifting, power transformation, and system innovation, and to implement the theme of promoting HQD in all fields and the whole process of national development. As a brand-new economic form, the digital economy (DE) is essential in promoting industrial structure optimization, improving production efficiency, and promoting HQD. Therefore, the Chinese government regards the development of the DE as its current priority and proposes accelerating the deep integration of big data, cloud computing, and other technologies with the real economy. At the same time, the 14th Five-Year Plan also clearly proposes to promote the in-depth development of the “digital silk road”, create new advantages for the DE, and fully release the welfare effect of the DE on HQD. It can be seen that it has become the mainstream trend in China’s development to promote HQD by promoting mass entrepreneurship and innovation, optimizing the industrial structure, and increasing people’s welfare through the DE.
In research on the DE, scholars at home and abroad firstly studied the impact of industries with digital characteristics on economic benefits, and their conclusions were the same. For example, new economic forms such as e-commerce [
1,
2] and the Internet [
3] can improve economic benefits, optimize the efficiency of capital allocation, provide employment, etc., as well as provide an impetus for HQD. Lars et al., (2001) [
4] also pointed out that popularizing electronic equipment, Internet broadband, and other infrastructure can effectively promote economic growth. Meanwhile, Liu and Li (2022) [
5] and Ivus and Boland (2015) [
6] also concluded that the construction and improvement of new infrastructure could promote economic development through empirical analysis. Later, with the development of artificial intelligence, cloud computing, and other information technologies, scholars focused on artificial intelligence. For example, Hanson (2001) [
7] improved the neoclassical model through the assumption of human complementarity and the introduction of artificial intelligence, and he found that the widespread application of artificial intelligence can significantly improve the economic growth rate. In China, Chen et al., (2019) [
8] found that AI responds to the impact of population aging and promotes economic growth through three channels: reducing labor demand, improving capital return, and improving total factor productivity. Liu et al., (2022) [
9] also concluded that the application of artificial intelligence is conducive to improving the quality of economic development, taking the manufacturing industry as an example. It can be seen that the academic community has confirmed that different forms of the DE can promote economic development, but quantitative research is still relatively scarce, and there is still room for further exploration. According to the existing research, the literature on the influencing factors of HQD mainly focused on urban characteristics and the external environment. Urban characteristics include industrial agglomeration and environmental regulation. For example, the research of Zheng and He (2022) [
10] and Peng et al., (2022) [
11] found that there is not only a positive correlation between industrial agglomeration and HQD but also a positive spatial spillover effect. Song et al., (2022) [
12] found an inverse U-shaped relationship between environmental regulation and local and surrounding economic development quality. The external environment mainly includes the financial environment, policy changes, and opening up. For example, Kong et al., (2021) [
13] and Zhang et al., (2020) [
14] proposed that moderately expanding the degree of opening up to the outside world would help improve the quality of economic development. Kong et al., (2021) [
15] found that the implementation of the “Belt and Road Initiative” can promote the HQD of cities by promoting technological innovation, promoting industrial upgrading, and optimizing the efficiency of capital allocation through the dual difference model.
Some scholars used empirical methods to study the impact of the digital economy on high-quality development. For example, Ding et al., (2021) [
16] used the spatial Dobbin model and found that the role of the digital economy in promoting high-quality development in the eastern, central, and western regions was weakened in turn. However, Jiang and Sun (2020) [
17] believed that the digital economy was not conducive to the development of the real economy, which was not conducive to the improvement of the quality of economic development. Sun and Tang (2022) [
18] analyzed the role of inclusive digital finance in promoting sustainable economic growth from the perspectives of loans from financial institutions, household savings, and household consumption. Ma and Zhu (2022) [
19] believed that the digital economy can affect high-quality development through industrial structure and technological innovation and spatial spillover effects. Yang et al., (2022) [
20] also used the PLS structural equation model to conclude that the digital economy can effectively promote high-quality, innovative, and green development, with the coordinated development of urban and rural areas playing an intermediary role. Wang et al., (2022) [
21] pointed out that the digital economy promotes high-quality development through innovation.
To sum up, scholars at home and abroad have conducted extensive research on the impact of the digital economy and its different forms on high-quality development, which provides a rich research basis for this study, but there are some deficiencies. First, most of them studied the impact of digital industries on the economy, such as the Internet and infrastructure construction, and they constructed the digital economy index. It is more realistic to study its impact on the quality of economic development. Secondly, in terms of research methods, OLS and spatial econometric models were mainly used, while few scholars used DID to analyze the impact of specific digital economic policies on high-quality development. Therefore, according to the logic of “five new development concepts”, this paper selected 18 three-dimensional indicators from the five dimensions of innovation, coordination, green, openness, and sharing to build an HQD index. Taking the big national data comprehensive experimental area as a quasi-natural experiment, the multistage DID model was used to empirically analyze the impact of the DE on HQD and its mechanisms, and to discuss whether there are differences in the above effects under different circumstances. At the same time, a dual difference spatial Dobbin model was built to test whether the DE has spillover effects on the HQD of neighboring cities, which can help relevant departments to formulate relevant development plans efficiently and reasonably, as well as ensure the HQD process.
The contributions of this paper are as follows: (1) most existing studies investigated the relationship between the DE and HQD theoretically or using OLS, spatial metrology, and threshold regression models, whereas few used the DID model. Therefore, this paper takes the establishment of the big national data comprehensive experimental area as a quasi-natural experiment and adopts a multistage DID model to evaluate the impact of the DE on HQD, which enriches the research ideas of relevant studies and alleviates endogenous problems; (2) this paper analyzes the impact mechanism of the DE on HQD from the perspective of regional innovation and residents’ consumption, which provides new empirical evidence for the impact of the DE on HQD, helps government departments to formulate economic policies scientifically, and provides useful experience for high-quality economic development; (3) by constructing an adjacency matrix, economic distance matrix, and nested matrix of economic and geographical distance, this paper adopts the dual difference spatial Dobbin model to investigate the spatial spillover effect of the DE on the quality of economic development, which helps the government better grasp the deep-seated role of the DE on the quality of economic development.
3. Research Design
3.1. Model Selection
The difficulty in exploring the impact of the establishment of the comprehensive experimental zone on high-quality economic development lies in how to effectively identify the causal effect; the government may not be exogenous in the location of the comprehensive experimental zone but fully considers the regional economic level, resource sufficiency, institutional environment improvement, and other factors. This series of region-related factors cannot be wholly observed or controlled. Therefore, if the least-squares method is directly used for estimation, it inevitably results in deviation. At the same time, since the establishment time of the comprehensive experimental area was in 2015 and 2016, which is not a single year, the traditional double-difference method may not be able to effectively evaluate the impact of the establishment of the comprehensive experimental area on high-quality development. Therefore, in this paper, 10 regions, such as Guizhou, Beijing–Tianjin–Hebei, and the Pearl River Delta, were taken as the experimental group, and other regions, except for Hong Kong, Macao, and Taiwan, were taken as the control group. The implementation points of the Guizhou policy were set as 2015, and the implementation points of other experimental regions were set as 2016. The multiphase DID model was used for analysis. Secondly, the PSM-DID, placebo test, and modified model setting were used to test the robustness of the above conclusions. Thirdly, the heterogeneity was analyzed from two aspects: the level of economic development and the institutional environment. Lastly, the mechanism was tested from the two aspects of technological innovation and residents’ consumption, and the spatial spillover effect was analyzed using the double-difference spatial Dobbin model.
3.2. Sample Selection and Data Sources
This paper regards the establishment of the big national data comprehensive experimental area as a quasi-natural experiment. A multiperiod DID model was built on the basis of 31 high-quality economic development indices (excluding Hong Kong, Macao, and Taiwan, due to data availability) from 34 provinces and cities in China in 2011–2019 to explore the impact of the digital economy on high-quality economic development and its mechanism. In order to ensure the reliability and validity of the data, the continuous variables used in this paper were subjected to two-sided tailing winsorization at 1% and 99% quartiles. All data were from the China Urban Statistical Yearbook, provincial statistical yearbooks, annual statistical reports of some provinces and cities, and the EPS database. Stata 16 was used for data preprocessing and correlation analysis.
3.3. Variable Selection
The explained variable was high-quality economic development (HQD). According to the existing research, the measurement of high-quality development mainly includes two methods: narrow and broad. The former is mainly represented by total factor productivity [
34,
35]. However, due to the volatility of index measurement and the oneness of dimension, the measurement results have a significant deviation. With the continuous deepening of research by scholars at home and abroad, the narrow index measurement method can no longer meet research needs. Therefore, many scholars have begun using the broad measurement method. From the multidimensional perspective, they have measured high-quality development by building indicator systems at different levels. For example, Qi (2016) [
36] measured the high-quality development index from three dimensions: economic structure, production performance, and regional coordination. Compared with the narrow measurement method, the broad measurement method can more comprehensively and accurately reflect the high-quality development level of various provinces and cities in China. Therefore, this paper refers to the research of Sun et al., (2020) [
37] and, according to the logic of the “five new development concepts”, selects 18 three-dimensional indicators from the five dimensions of innovation, coordination, green, openness, and sharing to build a high-quality development index. In contrast, in terms of weight processing, this paper believes that the contribution of indicators in all dimensions to high-quality development differs; hence, it does not adopt equal-weight processing but selects a more scientific and rigorous entropy weight method to determine the weight of each indicator.
The explanatory variable was the policy dummy variable (DID). According to the establishment time of the comprehensive experimental area, this paper takes the value of the area of the comprehensive experimental area in the current year and later years as 1, and vice versa.
In order to more accurately reflect the effect of the digital economy on high-quality economic development, with reference to the high-quality development-related literature, this paper selects a series of provincial-level control variables: (1) fiscal decentralization (FD), measured by the ratio of fiscal budget revenue to fiscal budget expenditure at the end of the year; (2) economic development level (EDL), measured by the logarithm of per capita GDP; (3) industrial structure (IS), measured by the ratio of the output value of the tertiary industry to the regional GDP; (4) urbanization level (UL), measured by the logarithm of population density; (5) degree of openness to the outside world (OTW), measured by the ratio of total import and export volume to regional GDP.
As mechanism variables, technological innovation (TI) was measured by the logarithm of the number of patent applications authorized at the end of the year [
38], while household consumption (HS) was measured by the logarithm of household consumption level.
3.4. Model Construction
In order to test the impact of the digital economy on high-quality economic development, this paper built the following multistage DID model with reference to Thorsten et al., (2010) [
39]:
where
HQDit represents the high-quality economic development level of province
i in year
t, and
DID is the policy dummy variable set up by the experimental area. If province
i belongs to the comprehensive experimental area in year
t,
DID takes the value of 1; otherwise, it is 0.
indicates the policy effect. If it is greater than 0, it indicates that the establishment of the comprehensive experimental zone had a positive effect on high-quality economic development. Otherwise, it indicates that establishing a comprehensive experimental zone hindered high-quality economic development.
Controlit represents a group of control variables,
is the estimation coefficient of the control variables,
and
represent the fixed effect of year and province, respectively, and
represents the random disturbance term.
is a constant term.
In order to test the role of technological innovation and resident consumption in the impact of the digital economy on high-quality economic development, this paper refers to the research of Baron and Kenny (1986) [
40] and constructs the following intermediary effect model:
where int
er refers to intermediary variables, mainly technological innovation and resident consumption, while the other variables are the same as in Equation (1).
In order to further analyze the spatial spillover effect of the establishment of the comprehensive experimental area on high-quality economic development, this paper constructs the following dual-difference spatial Dobbin model (SDMDID) with reference to the practice of Paul (2010) [
41]:
where
represents the spatial autocorrelation coefficient, and
W is the spatial weight matrix. In this paper, three methods (adjacency matrix, economic distance matrix, and economic geography nested matrix) are used for regression;
and
are the elastic coefficients of the spatial interaction terms of the policy dummy variables and the control variables, respectively, in the comprehensive experimental area. The other variables are the same as in Equation (1).
4. Empirical Analysis
4.1. Descriptive Statistics
Table 1 reports the descriptive statistical results of each variable. The results show that the maximum and minimum values of high-quality economic development are 0.786 and 0.128, respectively, indicating a significant gap in the level of high-quality development among provinces and cities in China, followed by an average of 0.293, which is higher than the median of 0.249, indicating that the quality of economic development of most provinces and cities in China has not reached the average level. The overall level of economic development is still relatively low. From the perspective of intermediary variables, the standard deviation of technological innovation is 1.61, which indicates significant differences in the level of technological innovation between different provinces and cities; the average consumption level of residents is 9.729, slightly less than the median of 9.665, which indicates that the consumption level of residents is generally low in China. From the perspective of control variables, there are specific differences in economic development level, fiscal decentralization, urbanization level, industrial structure, and degree of opening up among provinces and cities in China, which are basically consistent with the existing research results.
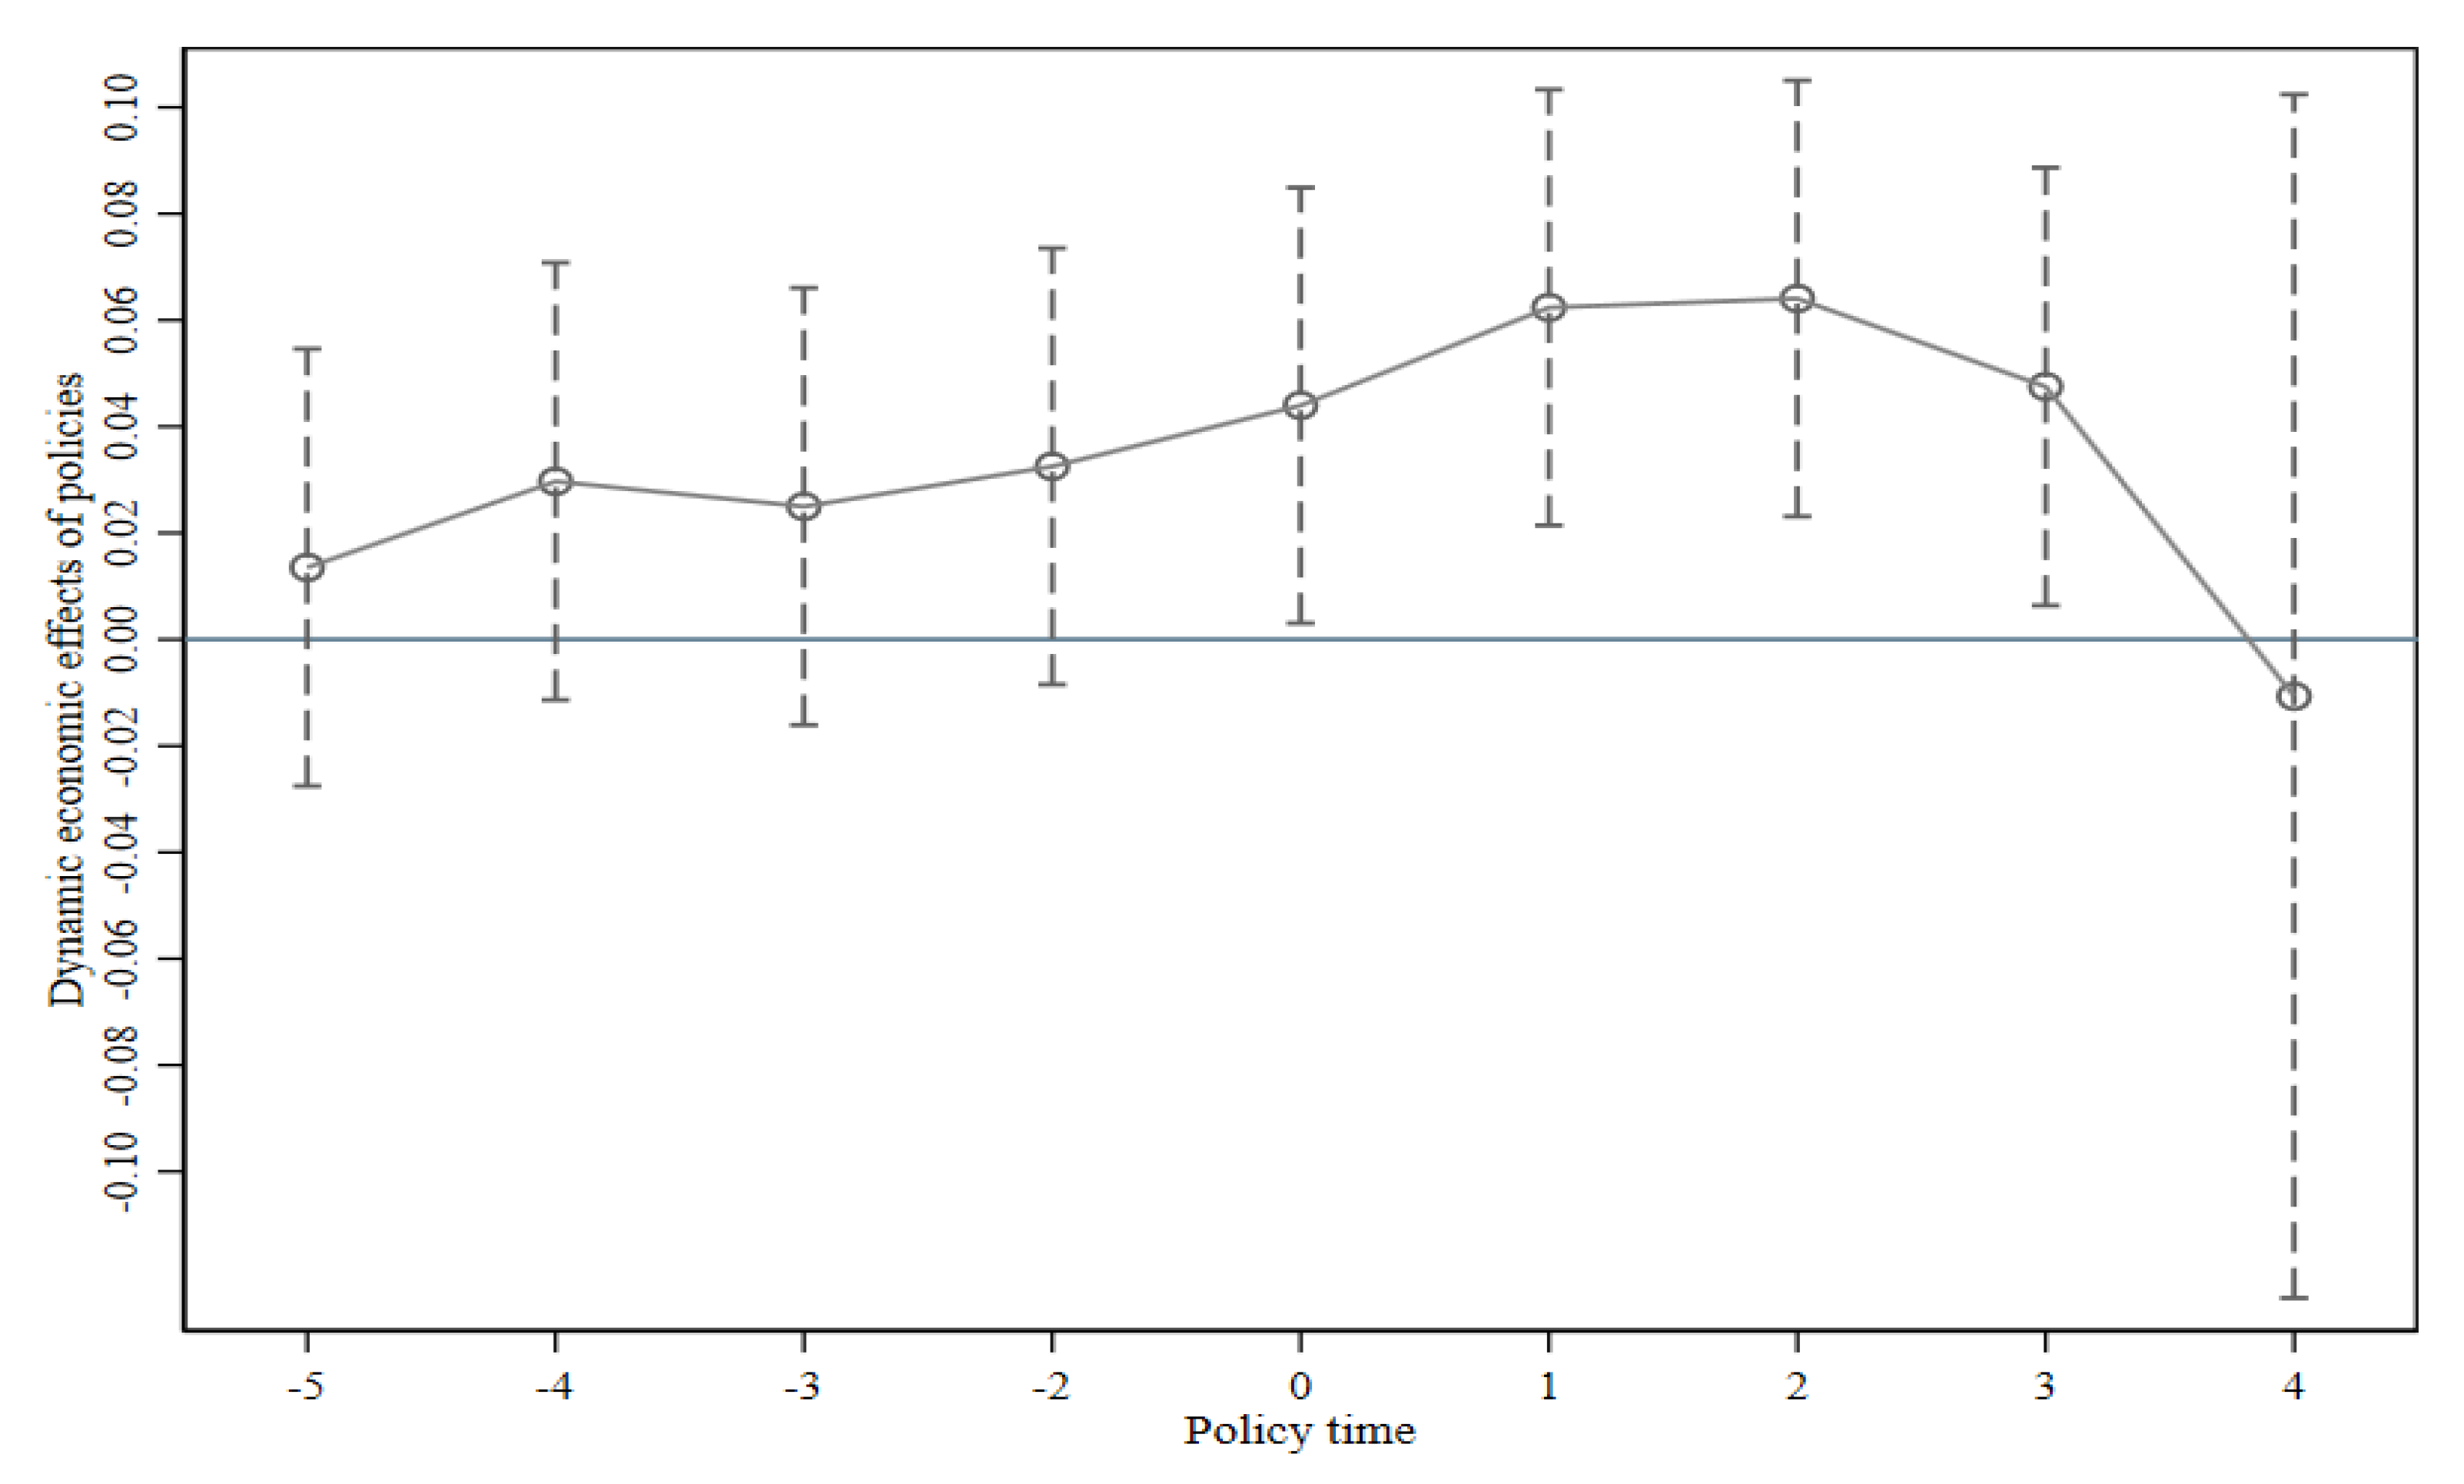
4.2. Parallel Trend Test
The basic premise of using double difference is to meet the “parallel trend hypothesis”, i.e., before the establishment of the comprehensive experimental area, the high-quality economic development level of the experimental group and the control group showed a similar time trend. Otherwise, there may be some deviation in the evaluation effect of the policy. Therefore, this paper refers to the method of Autor (2003) [
42] and uses the event research method to test the parallel trend.
where
is a dummy variable. When
k < 0, if it belongs to the comprehensive experimental area after
k years, the value is 1; otherwise, it is 0. When
k ≥ 0, if it belongs to the comprehensive experimental area before
k years, the value is 1; otherwise, it is 0. The other variables are the same as in Equation (1). The dummy variable of 1 year before the establishment of the comprehensive experimental area, i.e.,
k = −1, was excluded, mainly to take that year as the base period and prevent multicollinearity.
Figure 1 shows the specific analysis results. It can be seen from the figure that, before the implementation of the policy, the estimated value of
was significantly zero, indicating that it passed the parallel trend hypothesis test. In the year when the policy was implemented, the high-quality economic development level of the experimental group area was significantly improved, and the promotion effect of the establishment of the experimental area on high-quality development showed a trend of continuous enhancement, reaching a peak in the second year after the implementation, before weakening.
4.3. Benchmark Regression
Table 2 shows the benchmark regression results of the impact of the digital economy on high-quality economic development, in which Model 1 only controlled individual and time effects, while Model 2 added relevant control variables. It can be seen that, first, the coefficient of the core explanatory variable (DID) was significantly positive at the statistical level of 1%, which indicates that the establishment of a comprehensive experimental area has a significant incentive effect on improving high-quality development. The economic development quality of the comprehensive experimental area is 0.0197 units higher than that of the noncomprehensive experimental area, on average, which indicates that, under the demonstration and guidance of the comprehensive experimental area, the digital dividend is more fully released, and the quality of economic development is improved. Although this conclusion is consistent with the results of OLS and spatial econometric model analysis [
3,
21,
43], in terms of research methods, this paper used the multistage DID model for analysis, which enriches the research ideas, alleviates the impact of endogenous problems on the research conclusions, and makes the research conclusions more reliable. Hypothesis 1 was confirmed. Second, from the perspective of control variables, the coefficients of fiscal decentralization, economic development level, urbanization level, industrial structure, and opening up were all significantly positive, indicating that a higher fiscal level, an increase in economic aggregate, an improvement of the urbanization level, optimization of the industrial structure, and expansion of opening up are conducive to improving the quality of economic development.
4.4. Robustness Test
4.4.1. Analysis Results of PSM-DID
In order to ensure that the selection of the experimental group and the control group was random and to reduce the influence of selectivity bias on the research results, in this paper, the tendency matching score method was used to select the provinces closest to the provinces of the experimental group from the control group. Taking fiscal decentralization, economic development level, industrial structure, opening up, and other control variables as covariates, the samples of the experimental group and the control group were matched in a way that the nearest neighbor 1:1 was put back and allowed to be juxtaposed. The logit model was used to calculate the propensity matching score, and the provinces with similar scores were used as the control group. After matching, a further balance test was applied to determine whether there were significant differences in covariates before and after the matching.
Table 3 reports the balance test results. It can be seen that the standardized deviation of each covariate was greatly reduced after matching. Secondly, the
p-value corresponding to the
t-value after matching was greater than 10%, indicating no significant difference between each covariate before and after matching; thus, the PSM-DID method could be used for analysis.
According to the covariate balance test results, the PSM-DID method was adopted for the robustness test in this paper. The analysis results are presented in
Table 4. It can be seen that the estimated coefficient of DID was still significantly positive at the statistical level of 5%, indicating that the development of the digital economy helps to improve the quality of economic development. However, the estimated value was lower than the benchmark regression. The results of the control variables basically did not change much, which verified the robustness of the benchmark regression.
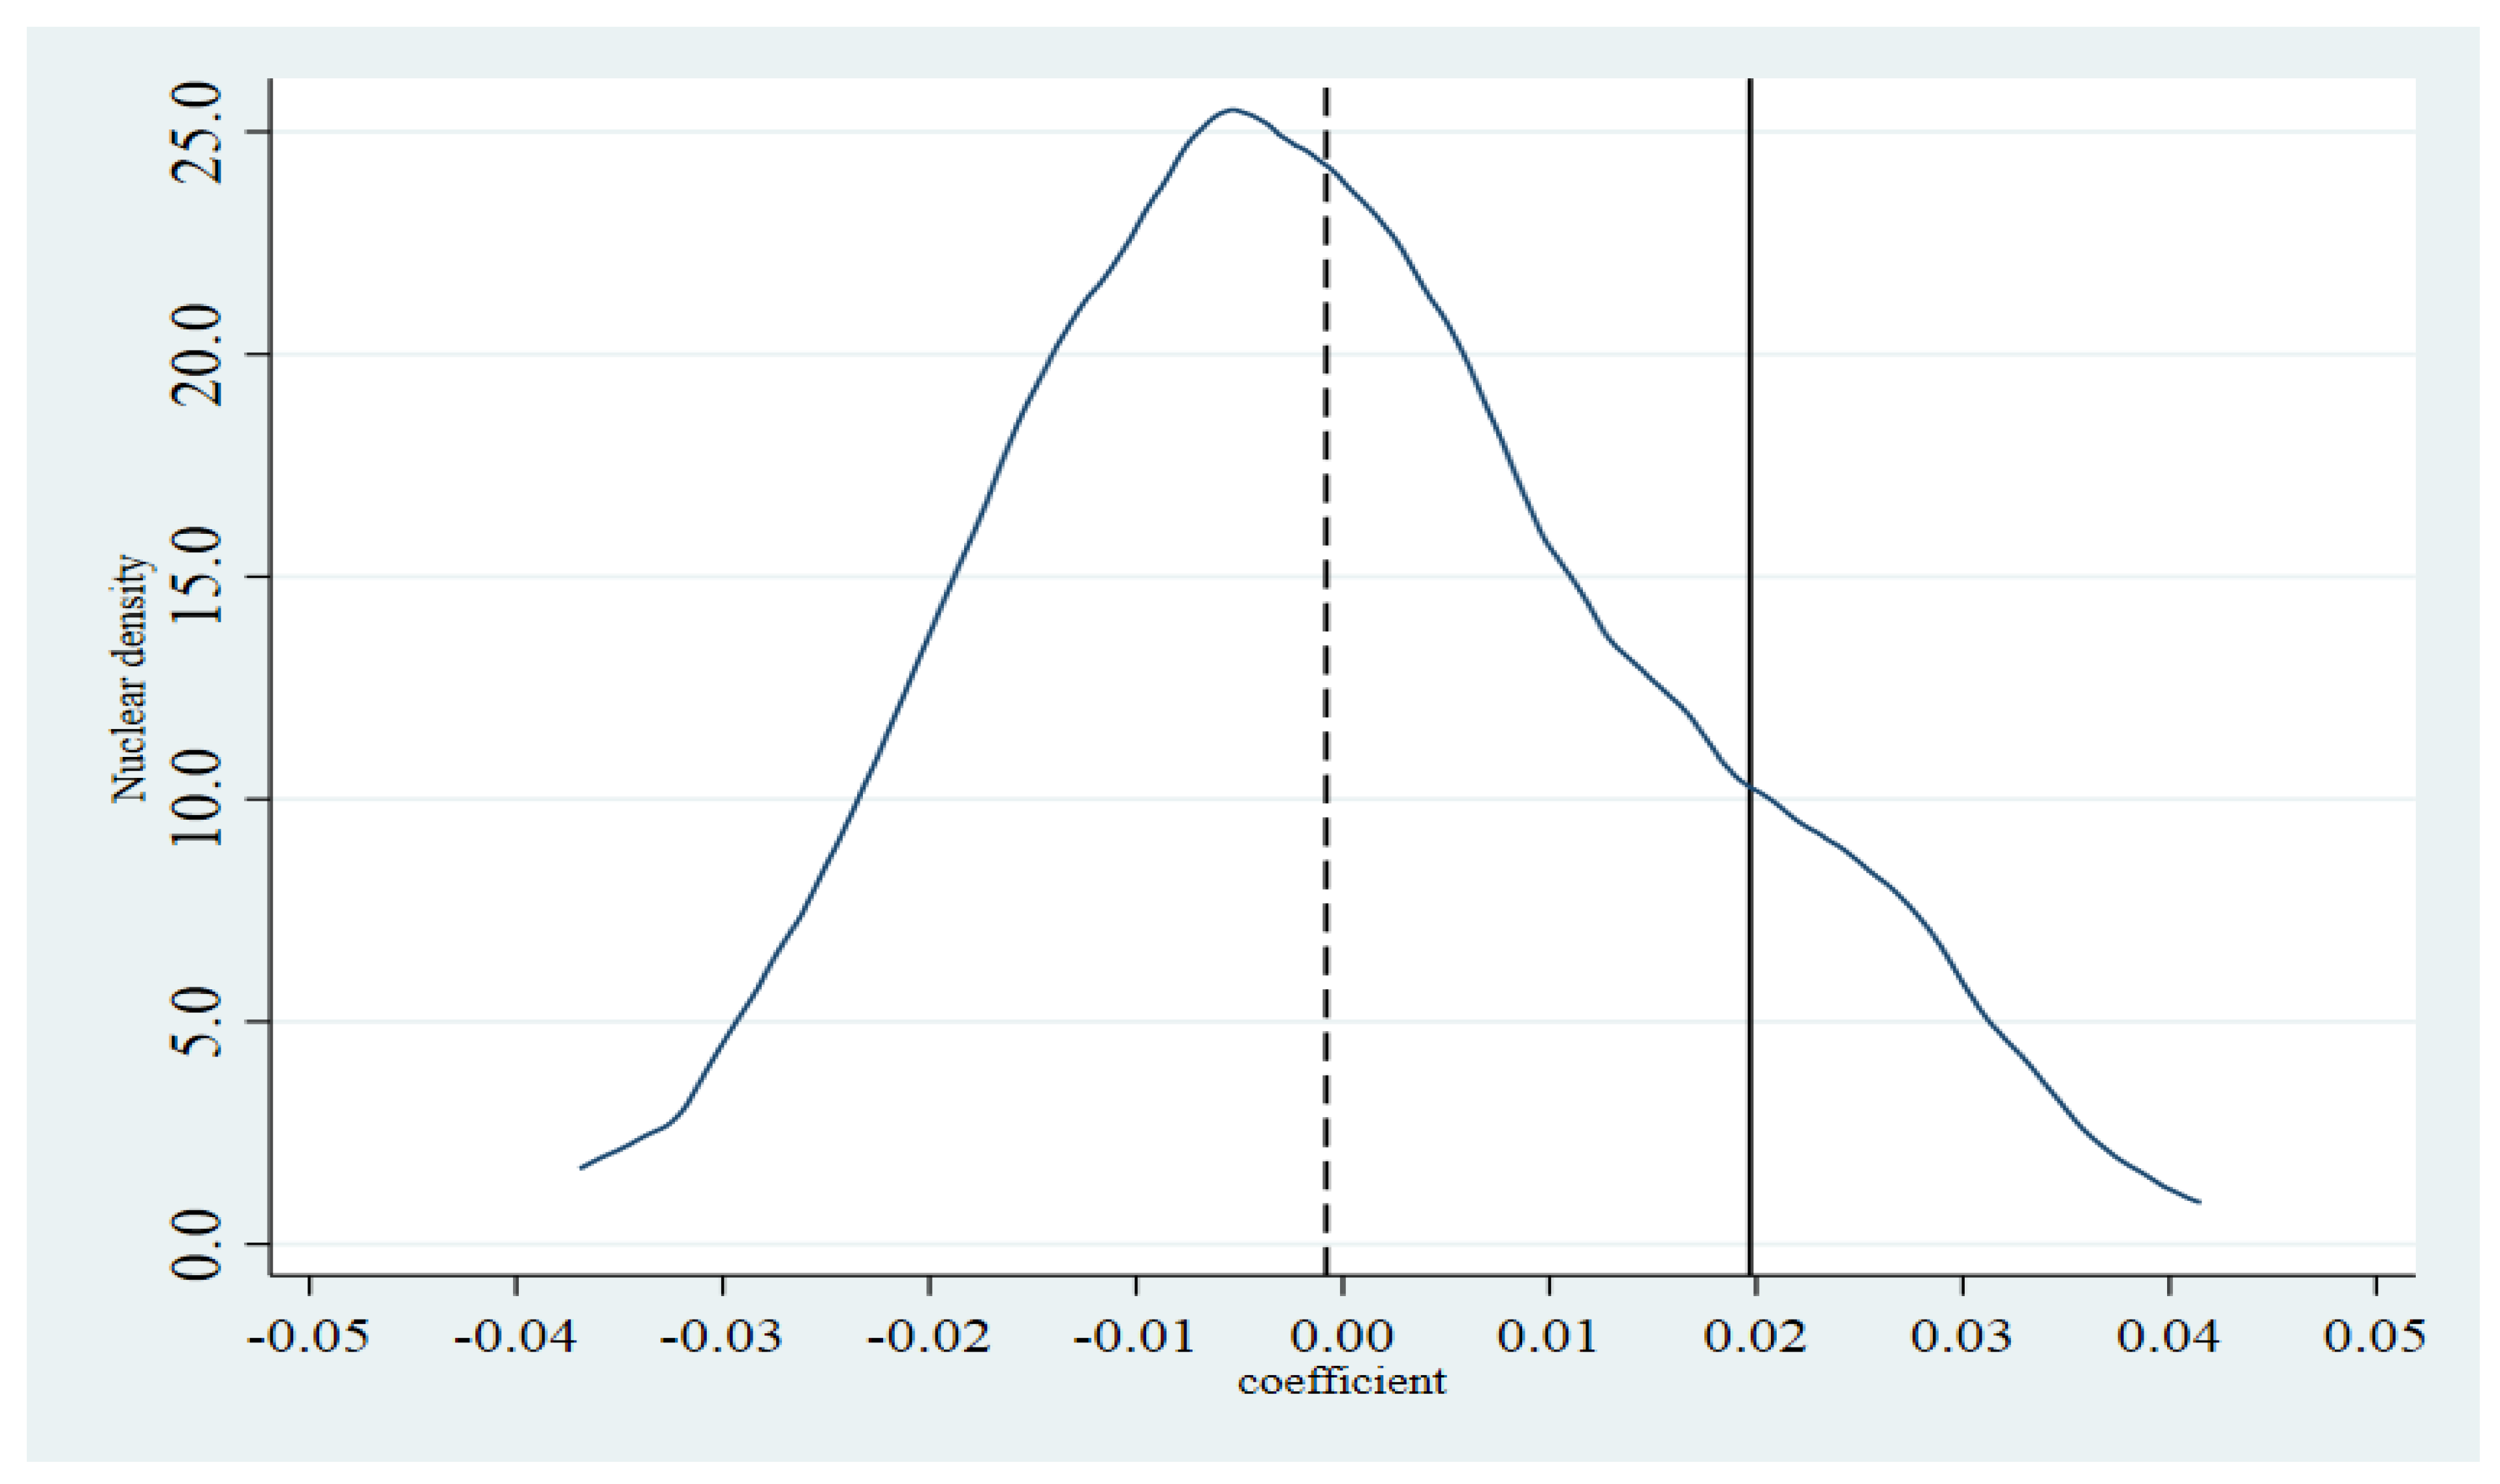
4.4.2. Placebo Test
As an exogenous event, the improvement effect of the big data comprehensive experimental area on the quality of economic development may be a “false fact”, as other policy factors may have caused it. Therefore, this paper refers to the practice of Li et al., (2016) [
44] to conduct a placebo test by fictitious treatment groups and policy implementation times. Firstly, 10 provinces and cities were randomly selected from 31 provinces and cities as the “pseudo experimental group”, with the remainder as the control group. Secondly, a year was randomly selected as the “pseudo policy implementation point”. Lastly, the “pseudo policy dummy variable” was generated. Random sampling was repeated 500 times to obtain 500 regression coefficients.
Figure 2 is the plotted density distribution diagram. It can be seen that there was no significant difference between the mean value of 500 random sampling coefficients and zero. Furthermore, the coefficient of random sampling was around zero and showed a normal distribution, with only a few values falling on the right side of the real regression coefficient value, indicating that there was no policy effect of the randomly fictitious policy, i.e., the improvement of the economic development quality of the experimental group was indeed caused by the establishment of the big data comprehensive experimental area, and its policy effect was less influenced by other factors.
4.4.3. Change of Model Setting
The implementation time of the comprehensive experimental area was not uniform; only Guizhou belonged to the comprehensive experimental area in 2015, with most provinces and cities implementing it in 2016. Therefore, 2016 was selected as the policy implementation point in this paper, and regression was conducted according to the ordinary DID.
Table 5 reports the analysis results. It can be seen that regardless of whether the control variable was added or not, the coefficient of the core explanatory variable (DID1) was still significantly positive, consistent with the benchmark regression, indicating the robustness of the results.
4.5. Heterogeneity Analysis
Due to the unbalanced and insufficient development of various regions in China and the different resource endowments and development stages, the high-quality development level may be heterogeneous in regional distribution. Therefore, this paper further discusses whether there were differences in the impact of the digital economy on high-quality economic development in different situations from the perspectives of the economic development level and institutional environment. Firstly, according to the level of economic development of various provinces and cities, the sample was divided into the eastern region and the central and western regions. Among them, the eastern region is rich in resources and has a fast economic development, while the central and western regions have relatively slow development. Secondly, the institutional environment index calculated by Fan Gang et al., was used to measure the excellence of the regional institutional environment. A larger index indicates a better regional institutional environment. Moreover, the samples were divided into two groups: those with a poor institutional environment and those with a good institutional environment. The results of the heterogeneity analysis are reported in
Table 6.
It can be seen that, in terms of regional heterogeneity, for the eastern region, the digital economy could help achieve high-quality economic development. However, although it showed a restraining effect for the central and western regions, this effect was insignificant. A possible reason is that the digital economy in the central and western regions is developing slowly and at a low level, and the construction of new infrastructure is not perfect, which makes it difficult for the central and western regions to efficiently give full play to the digital economy dividend and restrains the improvement of the quality of economic development by the digital economy. This shows that, at the present stage, it is necessary to continue accelerating the construction of a new pattern of western development by promoting high-quality economic development in the western region.
In terms of the heterogeneity of the institutional environment, the coefficient of the core explanatory variables in regions with a better institutional environment was significantly positive and more significant than that in regions with a poorer institutional environment, which indicates that the digital economy has a significantly better effect on promoting high-quality economic development in regions with a better institutional environment than in regions with a poorer institutional environment. A possible reason is that an excellent institutional environment can effectively guarantee the exclusive rights of enterprises’ patent output and strengthen enterprises’ response to the market and policies, while a perfect institutional environment can enhance investors’ confidence, reduce information asymmetry, eliminate investors’ concerns of others infringing on their R&D products, help stimulate investors’ innovation awareness, improve regional innovation level, and expand the impact of the digital economy on high-quality development.
4.6. Mechanism Test
The above research shows that the digital economy can help China to accelerate high-quality economic development, but the channel through which the digital economy improves the quality of economic development was not studied. In previous studies, most scholars studied the intermediary effects of industrial structure [
45], capital allocation efficiency [
46], etc., whereas few scholars considered the role of residents’ consumption and technological innovation. Therefore, this paper applied the intermediary effect model to test the role of technological innovation and residents’ consumption level. The specific steps are described below.
The first step was to analyze the impact of the digital economy on high-quality development and test the main effect. It can be seen from the results in
Table 2 that the estimated coefficient of DID was 0.0197, which was significant at the 5% statistical level, indicating that the digital economy has a significant positive impact on the quality of economic development, i.e., the digital economy can effectively enable high-quality development.
The second step was to introduce technological innovation and resident consumption variables to analyze the impact of the digital economy. Models 1 and 3 in
Table 7 present the impact of the digital economy on technological innovation and residents’ consumption, respectively. The results show that the coefficients of DID were significantly positive at the statistical level of 5%, indicating that the digital economy helps stimulate enterprises’ innovation consciousness and improves regional technological innovation. Secondly, the digital economy provides convenience for people’s lives, reduces service costs, increases people’s desire to consume, and stimulates consumption.
The third step was to analyze the impact of mechanism variables on high-quality economic development and test whether the intermediary effect was influential. First, the coefficients of the core explanatory variables and the intermediate variables in Models 1–4 were significant to varying degrees, indicating that the intermediate variables were influential. Secondly, the results for Models 2 and 4 show that, at the level of 1% significance, the digital economy had a significant and stable positive impact on high-quality economic development, which indicates that, with the improvement of technological innovation and residents’ consumption level, the quality of economic development will be significantly improved. This also shows that technological innovation and resident consumption are part of the mediating variables of the digital economy affecting high-quality development. In conclusion, Hypotheses 2 and 3 were confirmed.
4.7. Spatial Spillover Effect
In order to test whether the incentive effect of the digital economy on high-quality development had a spatial spillover effect, this paper uses the double-difference spatial Dobbin model (SDMDID). First, Moran’s I was used to analyze whether the high-quality economic development in each year had spatial relevance under the nested economic and geographical distance matrix. The results are presented in
Table 8. It can be seen that the global Moran’s I of the high-quality economic development index in 2011–2019 was significantly positive at the level of 1% and showed a rising trend of fluctuation, which suggests that the high-quality economic development in China in 2011–2019 had a significant clustering feature in the spatial distribution, thus preliminarily indicating that high-quality economic development has spatial relevance.
Table 9 reports the results of the spatial regression model of the two-way fixed effects model under the adjacency matrix, the economic distance matrix, and the nested matrix of economic and geographical distance. The results show that, firstly, under the three weight matrices, the spatial autocorrelation coefficient was significantly positive, which indicates an endogenous interaction effect of high-quality development, i.e., the high-quality development of neighboring provinces and cities drives the high-quality development of the region through the spatial spillover effect, and this correlation effect should be more prominent under the nested matrix of economic and geographical distance. Meanwhile, the regression coefficients of W × DID were all significantly positive at the level of 1%, indicating an exogenous digital economy interaction effect. Secondly, under the adjacency matrix, the regression coefficient of DID was positive, but it did not pass the significance test, showing that the positive effect of changes in the digital economy on high-quality economic development is not apparent. A possible reason is that the calculation of the adjacency matrix is relatively simple, and the differences in economic development, geographical distance, institutional environment, and other factors among provinces and cities were not fully considered. Therefore, the matrix may not fully reflect the complex relationship between provinces and cities, resulting in deviation in the results. According to James et al., (2008) [
47], in the spatial Dobbin model, the marginal effect of the explanatory variable cannot be simply reflected by the spatial interaction term coefficient, and the spatial effect needs to be decomposed by the partial differential method. Therefore, this paper decomposes the digital economy’s spatial effects into direct, indirect, and total effects.
Table 10 reports the decomposition results.
From the perspective of the total effect, the total effect of the digital economy on high-quality economic development was significantly positive at the level of 1% under the three weight matrices, indicating that changes in the digital economy do help improve the quality of economic development. When considering the economic and geographical distance, the total effect should reach the maximum of 0.1021. From the perspective of direct effects, under the adjacency matrix, the intra-regional spillover effects of the digital economy on the high-quality regional economy were not significant, while, under the other two weight matrices, the intra-regional spillover effects were 0.0236 and 0.0229, respectively, significant at the statistical level of 1%, indicating that the digital economy has a significant positive effect on high-quality development. From the perspective of indirect effects, among the three spatial correlation modes, the spatial spillover effects of the digital economy were 0.05, 0.0487, and 0.0792, respectively, indicating that the development of the digital economy also plays a significant role in promoting the quality of economic development of neighboring provinces and cities. It may be that the establishment of the comprehensive experimental zone has accelerated the flow of production factors among provinces and cities to a certain extent, resulting in a spatial radiation effect. In conclusion, Hypothesis 4 was confirmed. Although existing studies have confirmed that the digital economy does have spatial spillover effects on high-quality development, this paper combines the double-difference method with the spatial Dobbin model to build a double-difference spatial Dobbin model, which tests the spatial spillover effects of the digital economy on high-quality development under three different spatial weight matrices and enhances the reliability of the research results.
5. Conclusions and Suggestions
Since the report of the 19th National Congress of the Communist Party of China proposed that China’s economy has changed from a stage of rapid growth to high-quality development, a large number of scholars began paying attention to the impact of fiscal decentralization, environmental regulation, and green finance on high-quality development, concluding that the enhancement of fiscal decentralization and environmental regulation strength is not conducive to high-quality development, while the development of green finance is conducive to improving the quality of economic development. In addition, some scholars used the OLS method to conclude that the improvement of the digital economy can also improve the quality of economic development, but few scholars used the double-difference method for analysis. Therefore, this paper first theoretically sorted out the impact of the digital economy on high-quality development and the role of technological innovation and residents’ consumption level. Secondly, on the basis of the establishment of the big national data comprehensive experimental area, the multistage DID model was used to explore its implementation effect and impact on high-quality development. The results show that the digital economy can significantly improve the quality of economic development. With the continuous development of the digital economy, the quality of economic development will also be improved, and this effect was still valid after a series of robustness tests. Furthermore, the heterogeneity analysis showed that the digital economy has a significant effect on improving the quality of economic development in the eastern region and the regions with better institutional environments. In contrast, the central and western regions and the regions with a poor institutional environment are not significantly affected due to the slow development of the digital economy and the lack of resources. Moreover, the intermediary effect test found that the technological innovation effect and resident consumption effect are the main channels for the digital economy to improve the quality of economic development. Lastly, the spatial spillover effect test found that the digital economy can drive the local economy’s high-quality development and empower the high-quality development of neighboring regions.
On the basis of above conclusions, this paper puts forward some policy recommendations. First, we should vigorously develop the digital economy following the practice of the big national data comprehensive experimental area. On the one hand, the construction of new digital infrastructure industrial parks should be strengthened, R&D investment in weak links in big data, artificial intelligence, and other fields should be increased, the transformation and upgrading of traditional industries should be promoted, the dividends of the digital economy should be given full play, and new momentum for high-quality development should be provided. On the other hand, we should appropriately open the access to data resources, guide local governments to accelerate the digital process, and introduce a series of incentive policies related to the new digital infrastructure industry to stimulate the construction of Digital China. Furthermore, the development level of the regional digital economy should be balanced, the technical cooperation and linkage development between the east and the central and western regions should be strengthened, and the demonstration and leading role of the east should be effectively established. The central and western regions should strengthen the building of a digital economy industrial chain, actively build a diversified modern digital industry ecosystem, strive to bridge the digital divide, and break through the bottlenecks and shortcomings of development. Additionally, we should accelerate the construction of a new pattern for the large-scale development of the western region and promote the high-quality economic development of the western region. Technological innovation and the improvement of residents’ consumption level should be promoted, and the incentive role of the digital economy for high-quality development should be enhanced. The deep integration of the Internet and the real economy should be accelerated, the welfare effect of the digital economy on innovation and entrepreneurship should be fully released, Internet-related innovation activities should be actively carried out, the inflow of digital innovation talents should be attracted, and the regional innovation level should be improved. The regional consumption environment and regulatory system should be improved, support for online consumption should be strengthened, and the safety of online consumption should be ensured to enhance consumer confidence, stimulate residents’ consumption, and help high-quality development. Lastly, we should eliminate the idea of “local orientation” and give full play to the leading role of the “Belt and Road Initiative”. From the domestic perspective, we should cross regional administrative boundaries and give full play to the spillover effect of the digital economy in the broader scope. Internationally, we should give full play to the leading role of the “Belt and Road Initiative”, guide more Internet-related high-quality enterprises to “go global”, deliver new technologies, share digital dividends, and further expand the application scope of digital technologies.
Although this paper comprehensively analyzed the impact of the digital economy on high-quality development and its mechanism, there are still some shortcomings, which can be addressed in future research. Firstly, this paper’s analysis was performed at the provincial level, and the sample size was small; thus, the results cannot fully reflect the impact of the establishment of the experimental area on the quality of economic development of all cities in China. Secondly, from the perspective of the impact mechanism, under the trend of accelerating the development of the digital economy, the cultural level, ecological environment, and other factors may have an impact on the quality of economic development. Therefore, in follow-up studies, it is necessary to include factors such as the cultural level and ecological environment into the research framework.


