Article

The Effects of Surfactants and Essential Oils on Microwave−Assisted Hydrothermal Synthesis of Iron Oxides

1
Faculty of Science, University of Split, Ruđera Boškovića 33, 21000 Split, Croatia
2
Division of Material Physics and Center of Excellence for Advanced Materials and Sensing Devices, Ruđer Bošković Institute, Bijenička 54, 10000 Zagreb, Croatia
3
Faculty of Chemistry and Technology, University of Split, Ruđera Boškovića 35, 21000 Split, Croatia
4
Division of Material Chemistry, Ruđer Bošković Institute, Bijenička 54, 10000 Zagreb, Croatia
*
Author to whom correspondence should be addressed.
Crystals 2022, 12(11), 1567; https://doi.org/10.3390/cryst12111567
Submission received: 4 October 2022 / Revised: 26 October 2022 / Accepted: 31 October 2022 / Published: 3 November 2022
(This article belongs to the Special Issue Synthesis, Characterization, and Properties of Nanomaterials)

Abstract

:
Microwave-assisted hydrothermal synthesis is a simple, reproducible, rapid, and effective method, and therefore, has attracted considerable interest among scientists in the field of synthesis not only of iron oxide but also of other metal oxides. This method has been used for the synthesis of iron oxide nanoparticles, hematite (α-Fe2O3), and goethite (α-FeOOH) in strongly alkaline media with iron(III) chloride (FeCl3) as precursor under microwave emission of 850 W. In this work, the effect on the size, shape, and composition of the final product was investigated by changing the conditions, such as shortening the synthesis time, increasing the synthesis temperature, and adding various substances to the synthesis pathway. Samples synthesized at 200 °C for 20 min by increasing the added percentage of polyethylene glycol (PEG), sodium dodecyl sulfate (SDS), rosemary essential oil and lavender essential oil promote goethite-to-hematite transformation, while N-guanylurea sulfate (NGS) and sage essential oil behave differently. The aforementioned substances added at 260 °C resulted in a decrease in particle size, but pure hematite was obtained, regardless of the type of the substances added or the decrease in synthesis time from 20 min to 5 min. Furthermore, the use of essential oils rather than surfactants in this study was presented as a novel, environmentally friendly method of iron oxide synthesis.

1. Introduction

Iron oxides are one of the most common compounds in nature and are used in many different scientific fields, which has led to the development of many different routes for their laboratory synthesis [1]. Goethite (α-FeOOH) and hematite (α-Fe2O3) are often final products of iron oxide transformations due to their thermodynamic stability at room temperature (RT) [1,2]. Because of their different morphological properties, they are widely used and, therefore, most frequently synthesized particles. For example, hollow and solid hematite spindles have been used in gas sensors and photocatalysis [3], hematite nanotubes for photooxidation of water [4], hematite nanorods for applications in lithium-ion batteries and gas sensors [5], and spherical goethite as an adsorbent for heavy metal removal [6].
The chemical composition, purity, morphology, and size of iron oxide particles are the key features of their application. Each potential application requires different properties and specific iron oxide particles, which are mainly dependent on the preparation method and experimental conditions of the synthesis route. There are various methods for the synthesis of nanoparticles (NPs), such as chemical precipitation, sol-gel, microemulsion method, thermal decomposition, sonochemical techniques, and hydrothermal methods. Hydrothermal techniques are the most widely used pathways for the preparation of these oxides in the last few decades, so the hydrothermal routes under different experimental conditions of pressure, temperature, pH medium, reaction time, precursor type, and concentration are well investigated and reported in the literature [1,7,8,9,10,11,12,13,14,15,16,17,18,19,20,21,22,23,24,25,26,27,28,29,30,31,32,33,34,35,36,37]. Matijević and Scheiner [38] investigated the hydrolysis of FeCl3, Fe(NO3)3, and Fe(ClO4)3 aqueous solutions. Musić et al. [15] proposed a dissolution/recrystallization mechanism for the formation of Fe(III)-oxyhydroxides and oxides by the hydrolysis of aqueous Fe(III)-salt solutions at an elevated temperature [38,39]. The influences of temperature and reaction time are explained by two processes: nucleation and crystal growth. At higher temperatures, nucleation is faster than crystal growth, so the particles obtained have a small size. Larger particles are obtained by a longer reaction time since the crystal growth becomes the determining factor [40,41]. Efficiently synthesizing iron oxides using the appropriate method and experimental conditions to obtain the particles’ specific morphology, size, and functionality is a great challenge. Hydrothermal reactions take place in aqueous media in an autoclave or reactor (conventional heating) where the temperature usually needs to be more than 200 °C, and the pressure needs to be higher than 13,800 kPa, about 2000 psi.
According to the literature review, the lack of all mentioned methods for the synthesis of iron oxide particles in the laboratory is the poorly controlling experimental condition and a long time for the synthesis process. The microwave-assisted hydrothermal method can precisely control the synthesis conditions for designing iron oxide particles with a desired shape, size, and other properties for multiple applications, so it is a very desirable method in various academic studies [42,43,44,45,46,47,48]. The greatest advantage of microwave irradiation is that it can heat a solution uniformly through glass, plastic, or Teflon reaction container, leading to a more homogeneous nucleation and shorter crystallization time compared with those conventionally heated [49].
Additives can be used in the synthesis process as reducing or oxidating reactants and change polymorphous transformation pathways (phase composition, structure, crystallinity) or after synthesis as a coating material for particles to design their specific properties (particle morphology, degree of particle aggregation, the size distribution of particles) for targeted application [50,51,52]. The most commonly used substances in the synthesis of iron oxide particles are organic polymers [53,54,55], surfactants [53,54,55], and inorganic ions [56]. For example, the non-ionic surfactant polyethylene glycol (PEG) can be used to manipulate the size and shape of iron oxide NPs, such as the formation of ellipsoidal hematite NPs and for the preparation of mesoporous magnetite powder [57,58]. They can also be used as coating materials for particles to improve their properties and extend their application, e.g., for magnetite NPs to improve their water dispersibility and stability [59]. Both surfactants, PEG and sodium dodecyl sulfate (SDS), were used for better uniformity and stability of maghemite NPs [60]. However, these types of substances are generally not environmentally friendly. Therefore, the aim of this study was to evaluate the possibility of using natural substances in NP synthesis, as they are more environmentally friendly, easily accessible, and ecological, in contrast to synthetic substances.
Natural substances, such as essential oils, are non-hazardous to the environment and can be obtained through simple hydrodistillation. Because of their antimicrobial, antifungal, antioxidant, and aromatherapeutic properties, essential oils have a wide range of applications [61,62,63]. In the synthesis process of metal NPs, they can act as adsorbents, stabilizers, capping agents, and reducens for metal precursors [63,64]. For example, the essential oils of Curcuma pseudomontana [65], Eucalyptus globulus, Rosmarinus officinalis [66], Nigella sativa [67], and Mentha piperita [68] were used as reducing agents and stabilizers in the synthesis of Au NPs, and the essential oils of Thymus vulgaris [69], Pelagonium graveolens [70], Syzigium aromaticum [71], Myrstica fragrans [72], and Coleus aromaticus [73] as reducing agent in the synthesis of Ag NPs. It has also been reported that the amount of essential oil in the synthesis pathway can affect the shape of NPs. Thus, the essential oil from the leaves of Anacardium occidentale was used to prepare monodisperse hexagonal Au NPs [74]. Although the addition of essential oil to the synthesis process is most commonly used to obtain Ag and Au NPs, it has been reported that Satureja hortensis essential oil was used for the synthesis of iron oxide NPs [75]. After synthesis, essential oils can be used as coating materials for NPs as well; e.g., Rosmarinus officinalis was used to coat magnetite NPs [76].
The effect of natural and synthetic substances on the iron oxide product obtained by the microwave-assisted hydrothermal method in very specific experimental conditions was investigated and compared to develop an environmentally friendly method for hematite and goethite synthesis. Essential oils from the Lamiaceae family, sage (Salvia officinalis L.), rosemary (Rosmarinus officinalis L.), and lavender (Lavandula spica L.), were used as natural substances. Polyethylene glycol (PEG), sodium dodecyl sulfate (SDS), and N-guanylurea sulfate (NGS) were the surfactants used in the synthesis. The morphological effects of additives, as well as the effects of temperature and time reduction during synthesis, on the obtained hematite particles, were studied.

2. Materials and Methods

2.1. Materials

The following chemicals were used in the synthesis: anhydrous iron(III) chloride, FeCl3 (Fluka Chemie GmbH, Buchs, Switzerland), sodium hydroxide, NaOH (T.T.T., Sveta Nedelja, Croatia), polyethylene glycol, PEG (Alfa Aesar, Ward Hill, MA, USA), N-guanylurea sulfate, NGS (Alfa Aesar, Ward Hill, MA, USA), sodium n-dodecyl sulfate, SDS (Alfa Aesar, Ward Hill, MA, USA) and absolute ethanol (Gram-mol, Zagreb, Croatia). Commercially available essential oils were used, and their composition is given on declaration: lavender (Lavandula spica—linalool and borneol), rosemary (Rosmarinus officinalis c.t. campher—borneol and trans-β-caryophyllene) and sage (Salvia officinalis—camphor and 1,8-cineole). The precursor solution (1M FeCl3) and 8M NaOH were prepared by dissolving calculated mass of solids in ultrapure water (resistance at 25 °C: 18.2 MΩ cm−1) prepared by Millipore Simplicity 185 Purification System, Burlington, MA, USA.

2.2. Synthesis

The precipitation mixture was prepared in plastic tube at RT. The reference samples, as well as samples with added surfactants or essential oils, were prepared by mixing 4 mL of a 1M FeCl3 solution, 4 mL of 8M NaOH, and ultrapure water to a total volume of 40 mL.
The percentage of surfactants or essential oils added to the samples synthesized at 200 °C for 20 min was increased from 1 to 4.5 percent, as shown in Table 1. Experimental conditions for samples synthesized at 260 °C with varying program durations and the addition of 1% surfactants or essential oils are shown in Table 2.
The mixtures were thoroughly mixed before being placed in a Teflon vessel for the microwave oven (Milestone, FlexiWave SK15, Sorisole (Bergamo) Italy, direct temperature control monitor via microwave-transparent fiber optic sensor up to 300 °C, magnetron frequency 2450 MHz, magnetron output 2 × 950 Watt, power supply 230 V, 50–60 Hz). Each program was set to emit at 850 W continuous microwave with rotor-twist and with cooling time of 20 min. Following the completion of the program and cooling of the tubes to RT, the samples were placed in an ultrafast centrifuge (Backman Avanti J25, Indianapolis, IN, USA) to separate the mother liquor from the precipitate. To remove any impurities, the precipitate was rinsed with ultrapure water and absolute ethanol. A pH meter was used to determine the pH of the mother liquor (Mettler Toledo, MP220, Columbus, OH, USA). Samples were dried overnight at 60 °C in a vacuum oven (Thermo Scientific, 3608-1CE, Waltman, MA, USA) with a rotary vane pump (Pfeiffer Vacuum, DUO Line 5 M, Aßlar, Germany).

2.3. Characterization Techniques

Samples for Fourier Transform Infrared Spectroscopy (FTIR) (Shimadzu, IR Prestige−21, FTIR−8400S, Kyoto, Japan) were prepared by mixing with spectroscopy grade KBr powder (Alfa Aesar, Kandel, Germany) and pressing into the pellets. The Origin software [77] was used to process the FTIR data.
Powder X-ray diffraction (PXRD) measurements were performed using an Empyrean X-ray diffractometer with Cu Kα1 radiation, λ = 1.5406 Å (Malvern Panalytical Ltd. Malvern, Worcestershire, UK). Samples were collected in a 2θ range between 10° and 75° with a scan step size of 0.013°. The quantitative phase analysis was performed using the Rietveld structure refinement [78] and Hill and Howard guidelines [79]. Structure refinements against PXRD data were carried out using the HighScore Plus program [80]. The starting models for hematite and goethite phases were based on those of Ünlü et al. [81] and Zepeda-Alarcon et al. [82], respectively. A pseudo-Voigt profile function and a polynomial background with up to five coefficients were applied to the structure refinements along with instrumental parameters (i.e., sample displacement and scaling factor), lattice parameters, and peak shape parameters for both phases. Crystallite size information was extracted from the phase fitting method (i.e., simultaneously with the Rietveld refinements) based on the change in profile widths compared to a standard sample.
Thermal field-emission scanning electron microscope (FE-SEM), JEOL JSM−7000F, Tokyo, Japan) was used to obtain morphological data from the samples.
The valence state and magnetic ordering analysis were carried out using the Mössbauer spectrometer (WissEl GmbH) with a Mössbauer source of 25 mCi 57Co (Rh). Details are summarized in the Supplementary information.

3. Results

3.1. FTIR Analysis

Figure 1 depicts the FTIR spectra of the reference sample and samples containing 4.5% surfactants and 4.5% essential oils prepared at 200 °C for 20 min.
The FTIR spectra of reference sample RS1 and samples S2, S4, and S6 synthesized with 4.5% surfactants (PEG, NGS, and SDS), as well as samples S8 and S10 synthesized with 4.5% essential oils (sage and rosemary) (Figure 1) show IR bands typical of both α-FeOOH and α-Fe2O3. The goethite phase is represented by the in-plane bending band (δOH) at 893 cm−1 and the out-of-plane band (γOH) at 799 cm−1, while the hematite phase is represented by the bands at ~540 cm−1 and ~460 cm−1. Furthermore, the IR band at ~640 cm−1 is a typical band caused by the interaction of residual Cl ions (from FeCl3 precursor used in the synthesis) with Fe-OH groups [24] or the shape of the synthesized particles [83]. The IR spectrum of sample S12 synthesized with 4.5% lavender oil shows IR bands that are characteristic only for α-Fe2O3 (Figure 1b).
Figure 2 shows the FT-IR spectra of reference samples RS2, RS3, and RS4 prepared at 260 °C with synthesis times of 20, 10, and 5 min, as well as samples with 1% PEG surfactant (S13) and 1% lavender essential oil (S18) addition and synthesis time of 5 min.
All of the FTIR spectra in Figure 2 show IR bands that are typical for α-Fe2O3.

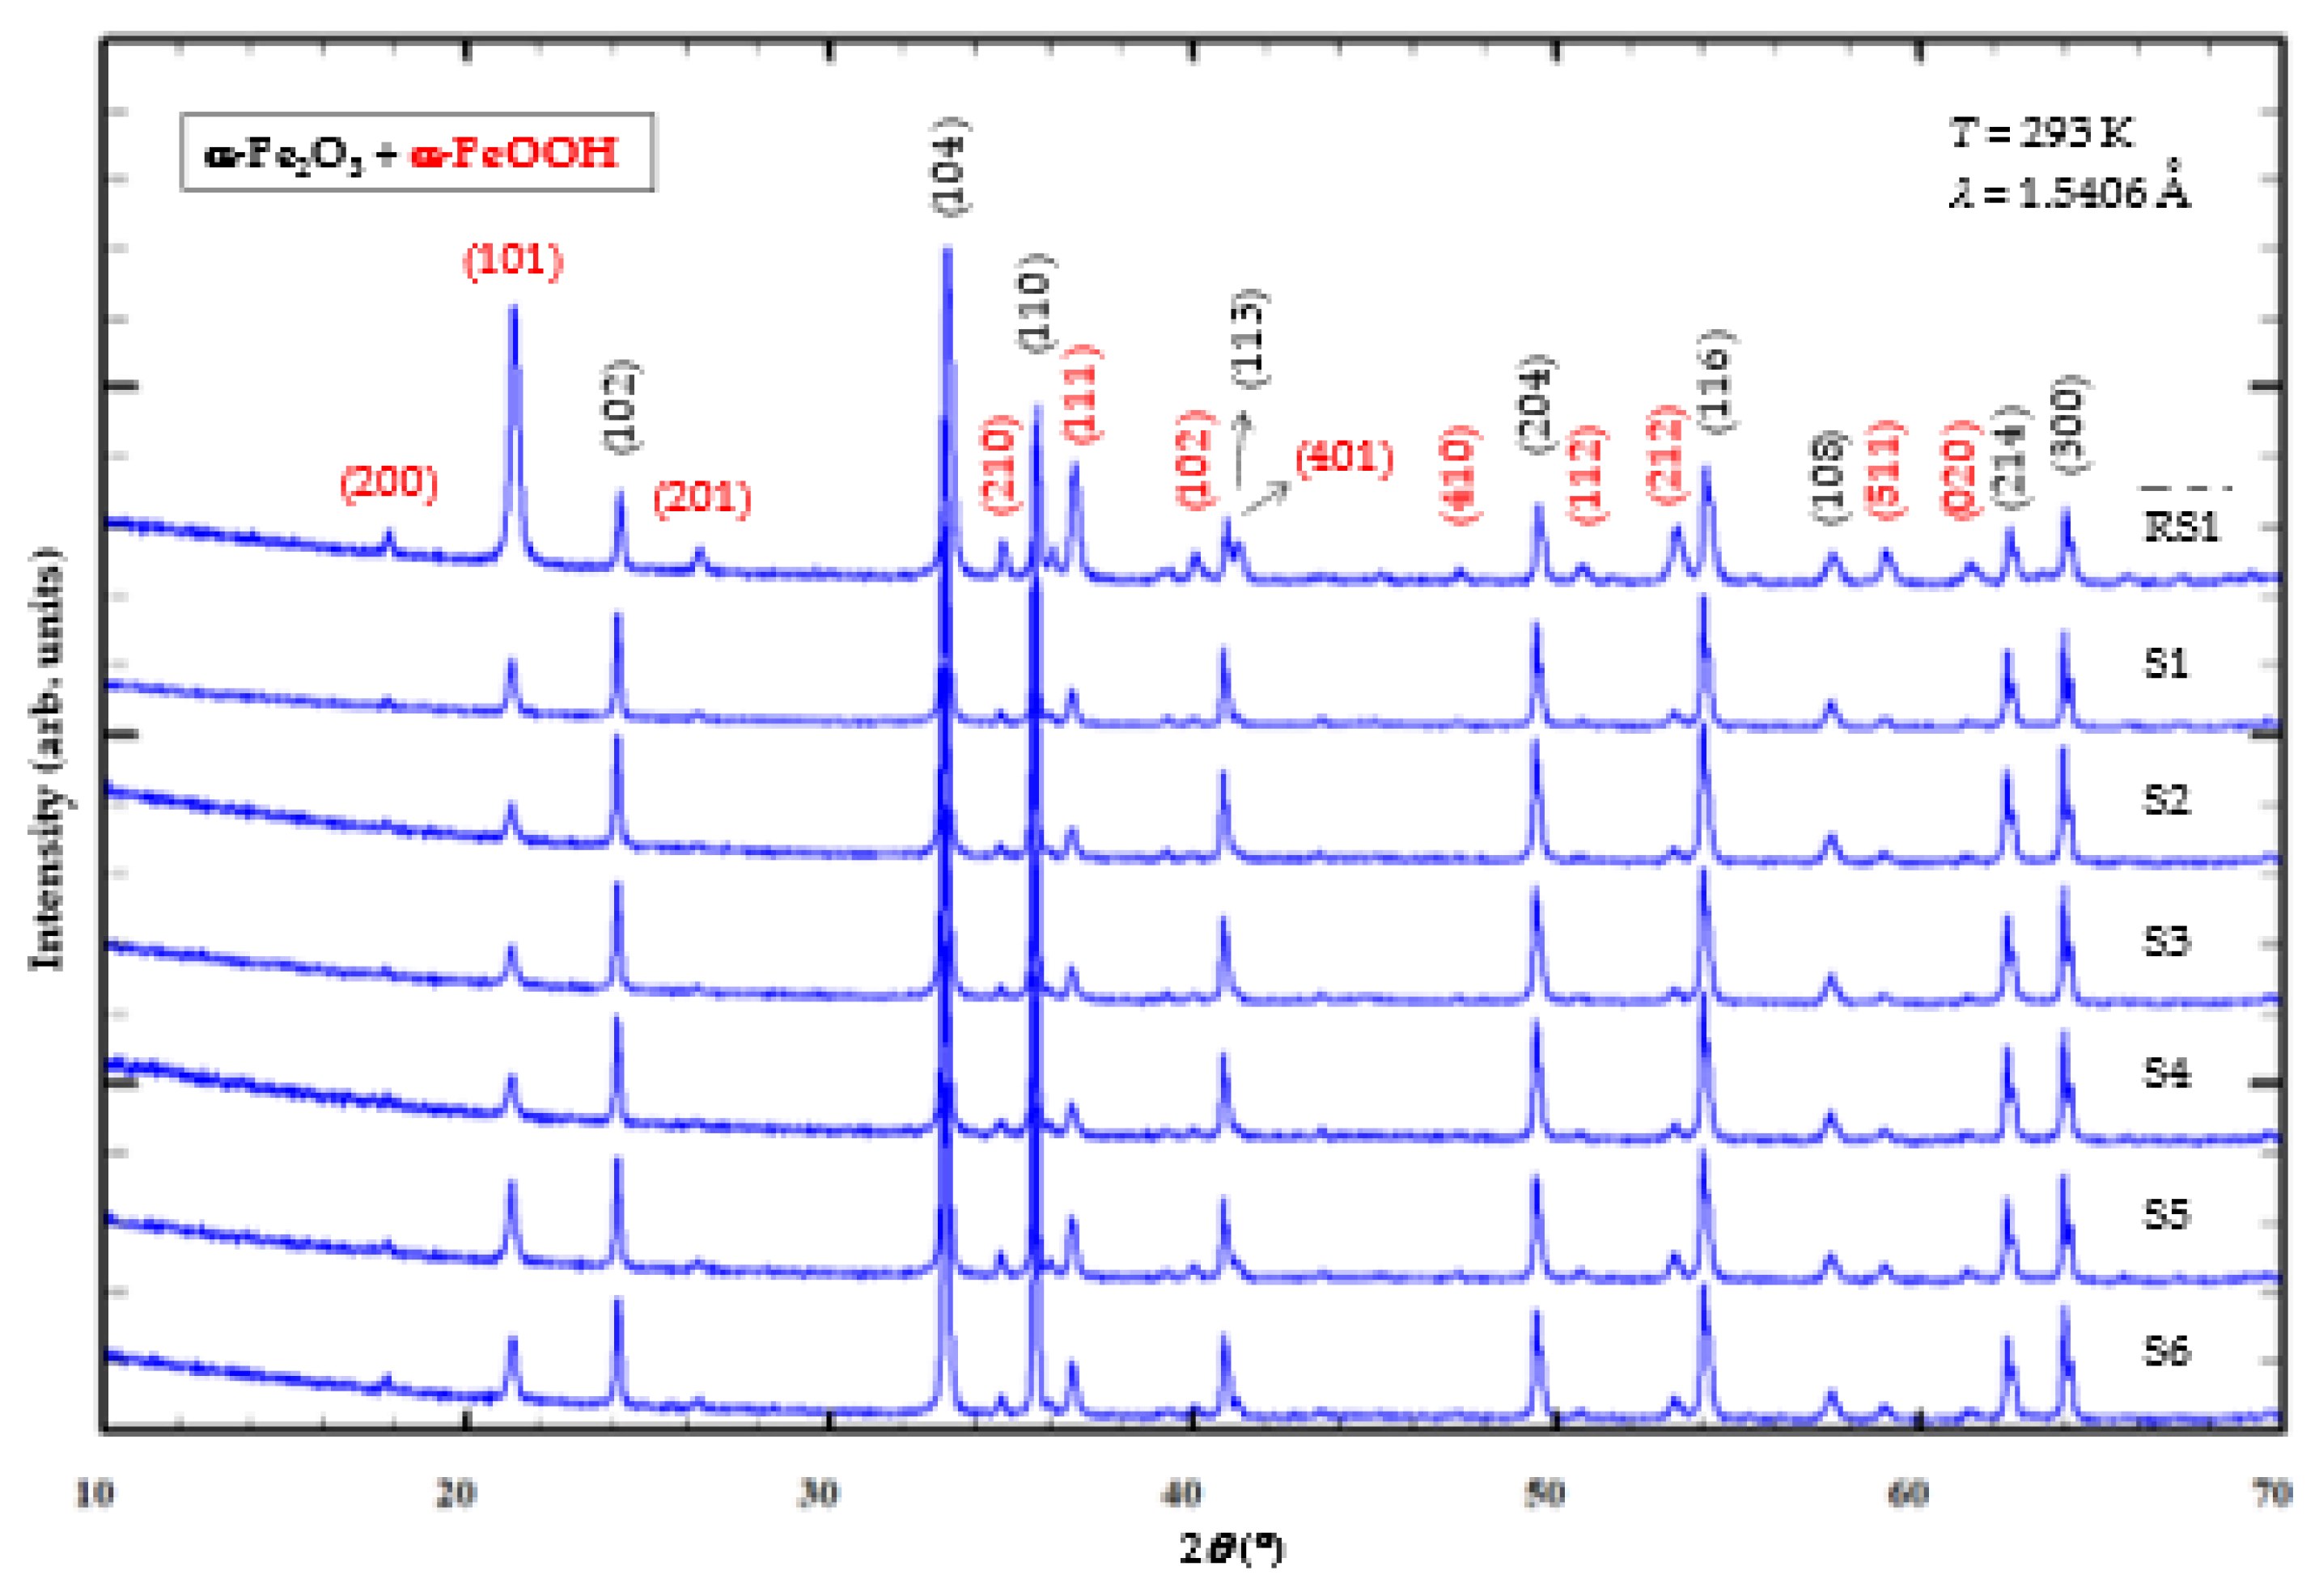
3.2. PXRD Characterization

Qualitative-phase analysis using PXRD patterns collected at RT revealed the formation of both hexagonal hematite [81] and orthorhombic goethite phases [82] in samples RS1 and S1–S11 (Table 3). On the other hand, a single-phase PXRD pattern of the hematite phase was observed in sample S12. The microstructural evolution, resulting from the line-broadening analysis performed during the structure refinements, reveals a clear disparity in the size of the crystallites between the formed phases. Namely, the average size of α-Fe2O3 crystallites shows increases from 103.1(1) nm in sample RS1 to 220.4(1) nm in sample S12.
Table 3 shows that the samples prepared at 200 °C for 20 min have a higher percentage of hematite phase in the mixture, regardless of chemical or natural substance addition, than the reference sample RS1, which has 43.1 wt.% hematite and 56.9 wt.% goethite (Figure 3a). Sample S12 (Figure 3b) with 4.5% lavender addition is the only sample that contains 100.0 wt.% hematite and was synthesized under the same conditions as samples in Table 3.
According to the results in Table 3 and Figure 4, the proportion of phases in the final product is determined by the amount of surfactants added to the synthesis mixture. As a result, when 1% PEG is added to the synthesis mixture, sample S1 contains 80.3 wt.% hematite and 19.7 wt.% goethite, and when the PEG addition amount is increased to 4.5%, sample S2 contains 84.7 wt.% hematite. Sample S5 synthesized with 1% SDS in the mixture, contained 71.4 wt.% hematite, while sample S6 synthesized with 4.5% SDS in the mixture contained 75.5 wt.% hematite. On the contrary, as the amount of NGS in the synthesis mixture increases, the percentage of the hematite phase in the final product decreases. Sample S3 with 1% NGS contains 84.0 wt.% hematite and 16.0 wt.% goethite, while sample S4 with 4.5% NGS contains 82.1 wt.% hematite and 17.9 wt.% goethite.
According to the results in Table 3 and Figure 5, adding 1% lavender essential oil to the synthesis mixture (sample S11) has the same effect on the composition of the final synthesis product as PEG and SDS, increasing the proportion of the hematite phase. Finally, adding 4.5% lavender (sample S12) to the synthesis mixture yields a pure hematite phase, as shown in Figure 3b. The content of the hematite phase increases slightly with an increasing amount of rosemary essential oil (samples S9 and S10). The samples with sage essential oil (samples S7 and S8), on the other hand, behave completely differently than the samples with lavender essential oil. When the amount of added oil is increased from 1% in sample S7 to 4.5% in sample S8, the hematite percentage decreases from 98 to 74.9 wt.%, and the goethite phase increases from 2.0 to 25.1 wt.%.
As shown in Table 4 and Figure 6, the samples prepared at 260 °C only show the hematite phase, regardless of the addition of chemical or natural substances, as well as synthesis time reduction. The observed effect is visible only on crystallite size. Namely, the crystallite size decreased when the reaction time was reduced, from 194.2(2) nm in sample RS2 to 98.7(2) nm in sample RS4. On the contrary, the addition of surfactants or essential oils yields larger crystallites (sample S13–S18) compared to sample RS4 with a 5 min synthesis time.
The iron oxide phase fractions determined by quantitative Rietveld phase analysis and the microstructural trends observed in the prepared samples correlate favorably with the results of 57Fe Mössbauer spectroscopy (see Supplementary Figures S1 and S2, Table S1), confirming their purity. In contrast to PXRD analysis, which only detects phases with a certain degree of crystallinity, Mössbauer spectroscopy is sensitive to atomic nuclei capable of recoilless absorption and γ-radiation [84]; that is, in our case, to any type of solid containing structural or adsorbed 57Fe. In particular, the synthesis of Fe(III) oxides, except for hematite (α-Fe2O3) and/or goethite (α-FeOOH), could also lead to the formation of various other iron(III) oxide phases such as β-Fe2O3, maghemite (γ-Fe2O3), akaganeite (β-FeOOH), lepidocrocite (γ-FeOOH) and/or feroxyhyte (δ-FeOOH) phases, whereas the structure of feroxyhyte is not well defined due to ambiguities in the PXRD pattern [85]. Specifically, the Mössbauer detection of significant proportions of lepidocrocite in the absence of any diffraction peak is noteworthy since even nanometer-sized lepidocrocite can appear as broad reflections in XRD spectra [84,86]. For this reason, PXRD and Mössbauer results can be considered complementary rather than comparative, with each method considering different aspects of the solid phase.

3.3. SEM Analysis

The FE-SEM image of reference sample RS1 (Figure 7a) prepared at 200 °C for 20 min shows the presence of rod-shaped goethite particles of various sizes as well as plate-shaped hematite particles. Sample S2 with 4.5% PEG addition (Figure 7b) has the same particle shape as the reference sample RS1 but with more hematite plates, as confirmed by PXRD and FTIR analysis of those samples. Samples containing SDS, NGS, and essential oils of sage and rosemary also contain rod-shaped goethite and plate-shaped hematite, and their images are shown in Supplementary Figure S3. Unlike the other samples, the FE-SEM micrographs of sample S12 with 4.5% lavender essential oil (Figure 7c) show only irregular plate-like hematite particles.
The FE-SEM images of reference sample RS2 prepared at 260 °C for 20 min (Figure 8a) and reference sample RS4 prepared at the same temperature for 5 min (Figure 8b) show the presence of irregular hematite plates varying particle sizes due to rapid crystallization at high temperatures. Samples S13 with 1% PEG (Figure 8c) and S18 with 1% lavender essential oil (Figure 8d) prepared at 260 °C for 5 min show significantly smaller particle sizes of irregular hematite plates. FE-SEM images of other samples synthesized at 260 °C for 5 min, S14–S17, also show smaller hematite plates and are shown in Supplementary Figure S4.

4. Discussion

The hydrolysis of Fe3+ in aqueous media may be utilized in the synthesis of a specific form of iron oxides. Hematite can be prepared by a variety of routes. The most convenient and common ones are: (1) by thermal dehydration of a crystalline iron oxide hydroxide (e.g., 2 FeOOH → Fe2O3 + H2O) or an iron salt, (2) by forced hydrolysis of Fe3+ solutions and (3) by the transformation of ferrihydrite in aqueous suspension.
Ferric salt solution hydrolysis can lead directly to goethite, lepidocrocite, akageneite, and hematite individually or a mixture of these compounds, depending on the experimental conditions. Under hydrothermal conditions (>150 °C) formation of hematite is very rapid. These reactions were extensively investigated by many researchers, as exemplified in the Section 1 and reported in the literature [1,7,8,9,10,11,12,13,14,15,16,17,18,19,20,21,22,23,24,25,26,27,28,29,30,31,32,33,34,35,36,37]. In view of so many factors affecting the reactions involved, a slight condition change may yield an entirely different precipitate. For those reasons, synthesis conditions were precisely set by the microwave-assisted hydrothermal method: 0.1M FeCl3 as precursor solution, temperature at 200 °C, pH at ~13, and 20 min reaction time. The aim of controlling those experimental conditions was to observe the effects of the addition of surfactants or essential oils in the synthesis process on the composition, size, and shape of the final products. At the mentioned experimental conditions, a mixture of goethite and hematite was obtained, which represents reference sample RS1. It was found that the addition of surfactants or essential oils of any type significantly increased the weight percentage of the hematite phase in the mixture compared with a reference sample. The effect on the synthesis pathway also varies depending on the amount and nature of added substances. The increased addition of PEG, SDS, rosemary, and lavender essential oil promotes the goethite-to-hematite phase transformation, while NGS and sage essential oil slow down the goethite-to-hematite transformation. Only a higher percent of lavender essential oil added completes the goethite-to-hematite transformation to the desired single-phase hematite product. Based on the results of this experiment, a novel method for obtaining the desired single-phase hematite (α-Fe2O3) product using a microwave-hydrothermal method with the addition of lavender essential oil in the synthesis mixture is presented.
Terpenes and their derivatives, terpenoids, belong to the group of phytochemicals found in the essential oils of various plants [87,88], with monoterpenoids and sesquiterpenoids being the most abundant [89]. These compounds can be used as reducing agents for metal ions in the synthesis of NPs [90]. Although, to our knowledge, the mechanism of synthesis of iron oxide NPs using monoterpenoids has not yet been described, the function of other phytochemicals (especially polyphenols) as reducing agents has been explained in the literature [91].
Analogously, Figure 9 shows the mechanism of the synthesis pathway of hematite NPs by monoterpenoids (linalool or/and borneol) found in lavender essential oil and their role as a reducing agent in iron(III) chloride (FeCl3) solution in strongly alkaline media is proposed:
After dilution of the precursor (FeCl3) (1), the ferric cations are reduced by the monoterpenoids of the essential oil, and elemental iron is formed (2). After hydration, ferric cations are formed (3), (4), and ferric hydroxide is precipitated (5). The ferric hydroxide is dehydrogenated to FeOOH-oxyhydroxide (6), which is converted to ferric oxide (7), hematite, and α-Fe2O3.
The samples prepared at the same conditions (0.1M FeCl3 solution and pH at ~13) but at higher temperature (260 °C) exhibit a single-phase hematite regardless of the reduction of the synthesis time or the addition of the surfactants or essential oils in the synthesis process. Synthesized particles with substance addition synthesized at 5 min have a significantly smaller particle size despite the rapid crystallization that occurs at this extreme temperature.

5. Conclusions

In this paper, an environmentally friendly microwave-assisted hydrothermal synthesis of NPs with the use of natural essential oils as a substitute for synthetic surfactants is presented.
Hydrolysis of 0.1M FeCl3 obtained single-phase hematite product with the use of lavender essential oil at a temperature of 200 °C for 20 min. The detailed mechanism of hematite NPs synthesis, mediated with monoterpenoids present in the oil, is explained.
Pure hematite with smaller-sized particles can be obtained with the addition of natural substances in the 0.1M precursor solution at 260 °C in just 5 min.

Supplementary Materials

The following supporting information can be downloaded at: https://www.mdpi.com/article/10.3390/cryst12111567/s1, Supplementary Figure S1. 57Fe Mössbauer spectra (recorded at 20 °C) of reference sample RS1, sample S2 with 4.5% PEG and sample S12 with 4.5% lavender essential oil, prepared at 200 °C for 20 min. Supplementary Figure S2. 57Fe Mössbauer spectra (recorded at 20 °C) of reference sample RS4, sample S13 with 1% PEG and sample S18 with 1% lavender essential oil, prepared at 260 °C for 5 min. Supplementary Figure S3. The FE−SEM images of (a) sample S1 with 1% PEG, (b) sample S3 with 1% NGS, (c) sample S4 with 4.5% NGS, (d) sample S5 with 1% SDS, (e) sample S6 with 4.5% SDS, (f) sample S7 with 1% sage essential oil, (g) sample S8 with 4.5% sage essential oil, (h) sample S9 with 1% rosemary essential oil, (i) sample S10 with 4.5% rosemary essential oil and (j) sample S11 with 1% lavender essential oil, prepared at 200 °C for 20 min, taken at 33000 × magnification. Supplementary Figure S4. The FE−SEM images of (a) sample S14 with 1% NGS, (b) sample S15 with 1% SDS, (c) sample S16 with 1% sage essential oil, and (d) sample S17 with 1% rosemary essential oil, prepared at 260 °C for 5 min, taken at 33000× magnification. Supplementary Table S1. Mössbauer parameters for reference samples and samples with PEG and lavender essential oil prepared at 200 °C for 20 min and 260 °C for 5 min. References [92,93] are cited in Supplementary Materials.

Author Contributions

Conceptualization, I.M.; methodology, I.M.; L.G.; A.M., J.R. and P.Ć. software, I.M., L.G., A.P. (Andrea Paut), M.M. and M.V.; validation, I.M. and L.G.; formal analysis, L.G., M.V., S.K. and M.M.; investigation, I.M., L.G. and A.P. (Andrea Paut); resources, I.M.; data curation, I.M., A.P. (Ante Prkić), L.G., A.P. (Andrea Paut), M.V., S.K. and M.M.; writing—original draft preparation, L.G.; writing—review and editing, I.M., A.P. (Ante Prkić), L.G., A.P. (Andrea Paut), M.V., S.K. and M.M.; visualization, L.G., I.M., A.P. (Andrea Paut) and M.V.; supervision, I.M. and A.P. (Ante Prkić); project administration, A.P. (Ante Prkić) and S.K.; funding acquisition, I.M., A.P. (Ante Prkić) and S.K. All authors have read and agreed to the published version of the manuscript.

Funding

This work was funded by Croatian Science Foundation, project numbers: UIP-2017-05-6282 and IP-2016-06-8254.

Institutional Review Board Statement

Not applicable.

Informed Consent Statement

Not applicable.

Data Availability Statement

Not applicable.

Conflicts of Interest

The authors declare no conflict of interest.

References

  1. Cornell, R.M.; Schwertmann, U. The Iron Oxides: Structure, Properties, Reactions, Occurrence, and Uses, 2nd ed.; John Wiley & Sons: Weinheim, Germany; New York, NY, USA, 2003; pp. 1–664. [Google Scholar]
  2. Yang, S.; Xu, Y.; Sun, Y.; Zhang, G.; Gao, D. Size-controlled synthesis, magnetic property, and photocatalytic property of uniform α-Fe2O3 nanoparticles via a facile additive-free hydrothermal route. CrystEngComm 2012, 14, 7915. [Google Scholar] [CrossRef]
  3. Huang, J.R.; Yang, M.; Gu, C.P.; Zhai, M.H.; Sun, Y.F.; Liu, J.H. Hematite solid and hollow spindles: Selective synthesis and application in gas sensor and photocatalysis. Mater. Res. Bull. 2011, 46, 1211–1218. [Google Scholar] [CrossRef]
  4. Mohapatra, S.K.; John, S.E.; Banerjee, S.; Misra, M. Water Photooxidation by Smooth and Ultrathin α-Fe2O3 Nanotube Arrays. Chem. Mater. 2009, 21, 3048–3055. [Google Scholar] [CrossRef]
  5. Wu, C.; Yin, P.; Zhu, X.; OuYang, C.; Xie, Y. Synthesis of Hematite (alpha-Fe2O3) Nanorods: Diameter-Size and Shape Effects on Their Applications in Magnetism, Lithium Ion Battery, and Gas Sensors. J. Phys. Chem. B 2006, 110, 17806–17812. [Google Scholar] [CrossRef]
  6. Jaiswal, A.; Banerjee, S.; Mani, R.; Chattopadhyaya, M.C. Synthesis, characterization and application of goethite mineral as an adsorbent. J. Environ. Chem. Eng. 2013, 1, 281–289. [Google Scholar] [CrossRef]
  7. Mohapatra, M.; Anand, S. Synthesis and applications of nano-structured iron oxides or hidroxides—A review. Int. J. Eng. Sci. Technol. 2010, 2, 127–146. [Google Scholar] [CrossRef] [Green Version]
  8. Lu, A.-H.; Salabas, E.L.; Schueth, F. Magnetic nanoparticles: Synthesis, protection, functionalization, and application. Angew. Chem. Int. Ed. 2007, 46, 1222–1244. [Google Scholar] [CrossRef]
  9. Wu, W.; He, Q.; Jiang, C. Magnetic iron oxide nanoparticles: Synthesis and surface functionalization strategies. Nanoscale Res. Lett. 2008, 3, 397–415. [Google Scholar] [CrossRef] [Green Version]
  10. Teja, A.S.; Koh, P.-Y. Synthesis, properties, and applications of magnetic iron oxide nanoparticles. Prog. Cryst. Growth Charact. Mater. 2009, 55, 22–45. [Google Scholar] [CrossRef]
  11. Schwertmann, U.; Cornell, R.M. Iron Oxides in the Laboratory: Preparation and Characterization; Wiley VCH: Weinheim, Germany, 2000; 204p. [Google Scholar]
  12. Žic, M.; Ristić, M.; Musić, S. Fe57 Mössbauer, FT-IR and FE SEM investigation of the formation of hematite and goethite at high pH values. J. Mol. Struct. 2007, 834, 141–149. [Google Scholar] [CrossRef]
  13. Gotić, M.; Popović, S.; Ljubešić, N.; Musić, S. Structural Properties of Precipitates Formed by Hydrolysis of Fe3+ Ions in Aqueous Solutions Containing NO3 and Cl Ions. J. Mater. Sci. 1994, 29, 2474–2480. [Google Scholar] [CrossRef]
  14. Musić, S.; Vertes, A.; Simmons, G.W.; Czakonagy, I.; Leidheiser, H. Mössbauer spectroscopic study of the formation of Fe(III) oxyhydroxides and oxides by hydrolysis of aqueous Fe(III) salt-solutions. J. Colloid. Interface Sci. 1982, 85, 256–266. [Google Scholar] [CrossRef]
  15. Šarić, A.; Musić, S.; Nomura, K.; Popović, S. Microstructural properties of Fe-oxide powders obtained by precipitation from FeCl3 solutions. Mater. Sci. Eng. B 1998, 56, 43–52. [Google Scholar] [CrossRef]
  16. Musić, S.; Santana, G.P.; Smit, G.; Garg, V.K. Fe57 Mössbauer, FT-IR and TEM investigations of Fe-oxide powders obtained from concentrated FeCl3 solutions. J. Alloys Compd. 1998, 278, 291–301. [Google Scholar] [CrossRef]
  17. Musić, S.; Maljković, M.; Popović, S. Chemical and microstructural properties of iron oxide powders obtained from FeCl3 solutions with decomposing urea. ACH Models Chem. 1999, 136, 299–316. [Google Scholar]
  18. Musić, S.; Krehula, S.; Popović, S.; Skoko, Z. Some factors influencing forced hydrolysis of FeCl3 solutions. Mater. Lett. 2003, 57, 1096–1102. [Google Scholar] [CrossRef]
  19. Musić, S.; Krehula, S.; Popović, S. Effect of HCl additions on forced hydrolysis of FeCl3 solutions. Mater. Lett. 2004, 58, 2640–2645. [Google Scholar] [CrossRef]
  20. Krehula, S.; Music, S. Influence of ruthenium ions on the precipitation of α-FeOOH, α-Fe2O3 and Fe3O4 in highly alkaline media. J. Alloys Compd. 2006, 416, 284–290. [Google Scholar] [CrossRef]
  21. Ristić, M.; Musić, S.; Godec, M. Properties of γ-FeOOH, α-FeOOH and α-Fe2O3 particles precipitated by hydrolysis of Fe3+ ions in perchlorate containing aqueous solutions. J. Alloys Compd. 2006, 417, 292–299. [Google Scholar] [CrossRef]
  22. Gotić, M.; Musić, S. Mössbauer, FT-IR and FE SEM investigation of iron oxides precipitated from FeSO4 solutions. J. Mol. Struct. 2007, 834, 445–453. [Google Scholar] [CrossRef]
  23. Krehula, S.; Musić, S. Influence of aging in an alkaline medium on the microstructural properties of α-FeOOH. J. Cryst. Growth 2008, 310, 513–520. [Google Scholar] [CrossRef]
  24. Žic, M.; Ristić, M.; Musić, S. Microstructural changes in particles detected during the transformation from β-FeOOH to α-Fe2O3 in dense aqueous suspensions. J. Alloys Compd. 2008, 464, 81–88. [Google Scholar] [CrossRef]
  25. Gotić, M.; Musić, S.; Popović, S.; Sekovanić, L. Investigation of factors influencing the precipitation of iron oxides from Fe(II) containing solutions. Croat. Chem. Acta 2008, 81, 569–578. [Google Scholar]
  26. Žic, M.; Ristić, M.; Musić, S. Precipitation of α-Fe2O3 from dense β-FeOOH suspensions with added ammonium amidosulfonate. J. Mol. Struct. 2009, 924, 235–242. [Google Scholar] [CrossRef]
  27. Žic, M.; Ristić, M.; Musić, S. The effect of temperature on the crystallization of α-Fe2O3 particles from dense β-FeOOH suspensions. Mater. Chem. Phys. 2010, 120, 160–166. [Google Scholar] [CrossRef]
  28. Opačak, I.; Ristić, M.; Musić, S. Preparation and characterization of hollow alpha-Fe2O3 irregular microspheres. Mater. Lett. 2010, 64, 2555–2558. [Google Scholar] [CrossRef]
  29. Žic, M.; Ristić, M.; Musić, S. Monitoring the hydrothermal precipitation of α-Fe2O3 from concentrated Fe(NO3)3 solutions partially neutralized with NaOH. J. Mol. Struct. 2011, 993, 115–119. [Google Scholar] [CrossRef]
  30. Ristic, M.; Opacak, I.; Music, S. The synthesis and microstructure of goethite particles precipitated in highly alkaline media. J. Alloy Compd. 2013, 559, 49–56. [Google Scholar] [CrossRef]
  31. Ristić, M.; Fujii, T.; Hashimoto, H.; Opačak, I.; Musić, S. A novel route in the synthesis of magnetite nanoparticles. Mater. Lett. 2013, 100, 93–97. [Google Scholar] [CrossRef]
  32. Ristić, M.; Štajdohar, J.; Mitar, I.; Musić, S. Monitoring of the Forced Hydrolysis of FeCl3 Solutions in the Presence of Sodium Dodecyl Sulphate. Croat. Chem. Acta 2018, 91, 403–410. [Google Scholar] [CrossRef]
  33. Ristić, M.; Mitar, I.; Musić, S. Forced hydrolysis of FeCl3 solutions in the presence of sodium dextran sulphate. Colloid Polym. Sci. 2019, 297, 177–182. [Google Scholar] [CrossRef]
  34. Gupta, A.K.; Gupta, M. Synthesis and surface engineering of iron oxide nanoparticles for biomedical applications. Biomaterials 2005, 26, 3995–4021. [Google Scholar] [CrossRef] [PubMed]
  35. Wu, W.; Jiang, C.Z.; Roy, V.A.L. Designed synthesis and surface engineering strategies of magnetic iron oxide nanoparticles for biomedical applications. Nanoscale 2016, 8, 19421–19474. [Google Scholar] [CrossRef]
  36. Faraji, M.; Yamini, Y.; Rezaee, M. Magnetic nanoparticles: Synthesis, stabilization, functionalization, characterization, and applications. J. Iran. Chem. Soc. 2010, 7, 1–37. [Google Scholar] [CrossRef]
  37. Krehula, S.; Popović, S.; Musić, S. Synthesis of acicular α-FeOOH particles at a very high pH. Mater. Lett. 2002, 54, 108–113. [Google Scholar] [CrossRef]
  38. Matijevic, E.; Scheiner, P. Ferric Hydrous Oxide sols: III. Preparation of Uniform Particles by Hydrolysis of Fe(III)-Chloride, Fe(III)-Nitrate, and Fe(III)-Perchlorate Solutions. J. Colloid Interface Sci. 1978, 63, 509–524. [Google Scholar] [CrossRef]
  39. Hamada, S.; Matijevic, E. Formation of monodispersed colloidal cubic hematite particles in ethanol + water solutions. J. Chem. Soc. Faraday Trans. 1982, 78, 2147–2156. [Google Scholar] [CrossRef]
  40. Tavakoli, A.; Sohrabi, M.; Kargari, A. A review of methods for synthesis of nanostructured metals with emphasis on iron compounds. Chem. Pap. 2007, 61, 151–170. [Google Scholar] [CrossRef]
  41. Movlaee, K.; Ganjali, M.R.; Norouzi, P.; Neri, G. Iron-Based Nanomaterials/Graphene Composites for Advanced Electrochemical Sensors. Nanomaterials 2017, 7, 406. [Google Scholar] [CrossRef] [Green Version]
  42. Parsons, J.; Luna, C.; Botez, C.; Elizalde, J.; Gardea-Torresdey, J. Microwave assisted synthesis of iron(III) oxyhydroxides/oxides characterized using transmission electron microscopy, X-ray diffraction, and X-ray absorption spectroscopy. J. Phys. Chem. Solids 2009, 70, 555–560. [Google Scholar] [CrossRef] [Green Version]
  43. Yin, S.; Luo, Z.; Xia, J.; Li, H. Microwave-assisted synthesis of Fe3O4 nanorods and nanowires in an ionic liquid. J. Phys. Chem. Solids 2010, 71, 1785–1788. [Google Scholar] [CrossRef]
  44. Hu, X.L.; Yu, J.C.; Gong, J.M. Fast production of self-assembled hierarchical alpha-Fe2O3 nanoarchitectures. J. Phys. Chem. C 2007, 111, 11180–11185. [Google Scholar] [CrossRef]
  45. Mahmoud, W.E.; Al-Hazmi, F.; Al-Noaiser, F.; Al-Ghamdi, A.A.; Bronstein, L.M. A facile method to syntheses monodisperse gamma-Fe2O3 nanocubes with high magnetic anisotropy density. Superlattices Microstruct. 2014, 68, 1–5. [Google Scholar] [CrossRef]
  46. Deshmukh, R.G.; Badadhe, S.S.; Mulla, I.S. Microwave-assisted synthesis and humidity sensing of nanostructured alpha-Fe2O3. Mater. Res. Bull. 2009, 44, 1179–1182. [Google Scholar] [CrossRef]
  47. Katsuki, H.; Komarneni, S. Microwave-Hydrothermal Synthesis of Monodispersed Nanophase α-Fe2O3. J. Am. Ceram. Soc. 2001, 84, 2313–2317. [Google Scholar] [CrossRef]
  48. Yang, G.; Park, S.J. Conventional and Microwave Hydrothermal Synthesis and Application of Functional Materials: A Review. Materials 2019, 12, 1177. [Google Scholar] [CrossRef] [Green Version]
  49. Hasany, S.F.; Ahmed, I.; Rajan, J.; Rehman, A. Systematic review of the preparation techniques of iron oxide magnetic nanoparticles. Nanosci. Nanotechnol. 2013, 2, 148–158. [Google Scholar] [CrossRef] [Green Version]
  50. Wang, D.B.; Song, C.X.; Zhao, Y.H.; Yang, M.L. Synthesis and Characterization of Monodisperse Iron Oxides Microspheres. J. Phys. Chem. C 2008, 112, 12710–12715. [Google Scholar] [CrossRef]
  51. Wang, L.L.; Gao, L. Morphology-Controlled Synthesis and Magnetic Property of Pseudocubic Iron Oxide Nanoparticles. J. Phys. Chem. C 2009, 113, 15914–15920. [Google Scholar] [CrossRef]
  52. Mosivand, S.; Monzon, L.; Kazeminezhad, I.; Coey, J. Influence of growth conditions on magnetite nanoparticles electro crystallized in the presence of organic molecules. Int. J. Mol. Sci. 2013, 14, 10383–10396. [Google Scholar] [CrossRef]
  53. Bronstein, L.M.; Huang, X.; Retrum, J.; Schmucker, A.; Pink, M.; Stein, B.D.; Dragnea, B. Influence of Iron Oleate Complex Structure on Iron Oxide Nanoparticle Formation. Chem. Mater. 2007, 19, 3624–3632. [Google Scholar] [CrossRef]
  54. Jia, B.P.; Gao, L. Growth of Well-Defined Cubic Hematite Single Crystals: Oriented Aggregation and Ostwald Ripening. Cryst. Growth Des. 2008, 8, 1372–1376. [Google Scholar] [CrossRef]
  55. Yang, D.P.; Gao, F.; Cui, D.X.; Yang, M. Microwave Rapid Synthesis of Nanoporous Fe3O4 Magnetic Microspheres. Curr. Nanosci. 2009, 5, 485–488. [Google Scholar] [CrossRef] [Green Version]
  56. Shi, W.; Song, S.; Zhang, H. Hydrothermal synthetic strategies of inorganic semiconducting nanostructures. Chem. Soc. Rev. 2013, 42, 5714–5743. [Google Scholar] [CrossRef]
  57. Wang, W.W.; Zhu, Y.J.; Ruan, M.L. Microwave-assisted synthesis and magnetic property of magnetite and hematite nanoparticles. J. Nanopart. Res. 2007, 9, 419–426. [Google Scholar] [CrossRef]
  58. Savic, A.B.; Cokesa, D.; Lazarevic, S.; Jokic, B.; Janackovic, D.; Petrovic, R.; Zivkovic, L.S. Tailoring of magnetite powder properties for enhanced phosphate removal: Effect of PEG addition in the synthesis process. Powder Technol. 2016, 301, 511–519. [Google Scholar] [CrossRef]
  59. Mukhopadhyay, A.; Joshi, N.; Chattopadhyay, K.; De, G. A Facile Synthesis of PEG-Coated Magnetite (Fe3O4) Nanoparticles and Their Prevention of the Reduction of Cytochrome C. ACS Appl. Mater. Interfaces 2012, 4, 142–149. [Google Scholar] [CrossRef]
  60. Mahajan, R.; Suriyanarayanan, S.; Nicholls, I.A. Improved Solvothermal Synthesis of gamma-Fe2O3 Magnetic Nanoparticles for SiO2 Coating. Nanomaterials 2021, 11, 1889. [Google Scholar] [CrossRef]
  61. Muhammad Irshad, M.A.S.; Saqib, A.; Amjad, H. Biological importance of essential oils. In Essential Oils—Oils of Nature; IntechOpen: London, UK, 2019. [Google Scholar]
  62. Mihai, A.D.; Chircov, C.; Grumezescu, A.M.; Holban, A.M. Magnetite Nanoparticles and Essential Oils Systems for Advanced Antibacterial Therapies. Int. J. Mol. Sci. 2020, 21, 7355. [Google Scholar] [CrossRef]
  63. Pathania, D.; Sharma, M.; Sonu; Kumar, S.; Thakur, P.; Torino, E.; Janas, D.; Thakur, S. Essential oil derived biosynthesis of metallic nano-particles: Implementations above essence. Sustain. Mater. Technol. 2021, 30, e00352. [Google Scholar] [CrossRef]
  64. Sana, S.S.; Li, H.; Zhang, Z.; Sharma, M.; Usmani, Z.; Hou, T.; Netala, V.R.; Wang, X.; Gupta, V.K. Recent advances in essential oils-based metal nanoparticles: A review on recent developments and biopharmaceutical applications. J. Mol. Liq. 2021, 333, 115951. [Google Scholar] [CrossRef]
  65. Muniyappan, N.; Nagarajan, N.S. Green synthesis of gold nanoparticles using Curcuma pseudomontana essential oil, its biological activity and cytotoxicity against human ductal breast carcinoma cells T47D. J. Environ. Chem. Eng. 2014, 2, 2037–2044. [Google Scholar] [CrossRef]
  66. Dzimitrowicz, A.; Berent, S.; Motyka, A.; Jamroz, P.; Kurcbach, K.; Sledz, W.; Pohl, P. Comparison of the characteristics of gold nanoparticles synthesized using aqueous plant extracts and natural plant essential oils of Eucalyptus globulus and Rosmarinus officinalis. Arab J. Chem. 2019, 12, 4795–4805. [Google Scholar] [CrossRef] [Green Version]
  67. Manju, S.; Malaikozhundan, B.; Vijayakumar, S.; Shanthi, S.; Jaishabanu, A.; Ekambaram, P.; Vaseeharan, B. Antibacterial, antibiofilm and cytotoxic effects of Nigella sativa essential oil coated gold nanoparticles. Microb. Pathog. 2016, 91, 129–135. [Google Scholar] [CrossRef] [PubMed]
  68. Thanighaiarassu, R.R.; Sivamai, P.; Devika, R.; Nambikkairaj, B. Green Synthesis of Gold Nanoparticles Characterization by using Plant Essential Oil Menthapiperita and their Antifungal Activity against Human Pathogenic Fungi. J. Nanomed. Nanotechnol. 2014, 5, 1. [Google Scholar] [CrossRef]
  69. De Melo, A.P.Z.; de Oliveira Brisola Maciel, M.V.; Sganzerla, W.G.; da Rosa Almeida, A.; de Armas, R.D.; Machado, M.H.; da Rosa, C.G.; Nunes, M.R.; Bertoldi, F.C.; Barreto, P.L.M. Antibacterial activity, morphology, and physicochemical stability of biosynthesized silver nanoparticles using thyme (Thymus vulgaris) essential oil. Mater. Res. Express 2020, 7, 015087. [Google Scholar] [CrossRef]
  70. Nancy, B.A.; Elumalai, K. Synthesis of Silver Nanoparticles Using Pelargonium Graveolens Essential Oil and Anti-Fungal Activity. Int. J. Pharm. Biol. Sci. 2019, 9, 176–185. [Google Scholar] [CrossRef]
  71. Maciel, M.V.d.O.B.; Almeida, A.d.R.; Machado, M.H.; Melo, A.P.Z.d.; Rosa, C.G.d.; Freitas, D.Z.d.; Noronha, C.M.; Teixeira, G.L.; Armas, R.D.d.; Barreto, P.L.M. Syzygium aromaticum L. (Clove) Essential Oil as a Reducing Agent for the Green Synthesis of Silver Nanoparticles. Open J. Appl. Sci. 2019, 9, 45–54. [Google Scholar] [CrossRef] [Green Version]
  72. Vilas, V.; Philip, D.; Mathew, J. Catalytically and biologically active silver nanoparticles synthesized using essential oil. Spectrochim. Acta Part A 2014, 132, 743–750. [Google Scholar] [CrossRef]
  73. Vilas, V.; Philip, D.; Mathew, J. Biosynthesis of Au and Au/Ag alloy nanoparticles using Coleus aromaticus essential oil and evaluation of their catalytic, antibacterial and antiradical activities. J. Mol. Liq. 2016, 221, 179–189. [Google Scholar] [CrossRef]
  74. Sheny, D.S.; Mathew, J.; Philip, D. Synthesis characterization and catalytic action of hexagonal gold nanoparticles using essential oils extracted from Anacardium occidentale. Spectrochim. Acta Part A 2012, 97, 306–310. [Google Scholar] [CrossRef] [PubMed]
  75. Ahmadi, S.; Fazilati, M.; Nazem, H.; Mousavi, S.M. Green Synthesis of Magnetic Nanoparticles Using Satureja hortensis Essential Oil toward Superior Antibacterial/Fungal and Anticancer Performance. BioMed Res. Int. 2021, 2021, 8822645. [Google Scholar] [CrossRef] [PubMed]
  76. Chifiriuc, C.; Grumezescu, V.; Grumezescu, A.M.; Saviuc, C.; Lazar, V.; Andronescu, E. Hybrid magnetite nanoparticles/Rosmarinus officinalis essential oil nanobiosystem with antibiofilm activity. Nanoscale Res. Lett. 2012, 7, 209. [Google Scholar] [CrossRef] [PubMed] [Green Version]
  77. OriginPro, Version 2020b; OriginLab Corporation: Northampton, MA, USA, 2020.
  78. Rietveld, H.M. A Profile Refinement Method for Nuclear and Magnetic Structures. J. Appl. Crystallogr. 1969, 2, 65–71. [Google Scholar] [CrossRef]
  79. Hill, R.J.; Howard, C.J. Quantitative phase analysis from neutron powder diffraction data using the Rietveld method. J. Appl. Crystallogr. 1987, 20, 467–474. [Google Scholar] [CrossRef]
  80. HighScore Plus Program, Version 4.1; PANalytical: Almelo, The Netherlands, 2014.
  81. Unlu, C.G.; Kaynar, M.B.; Simsek, T.; Tekgul, A.; Kalkan, B.; Ozcan, S. Structure and magnetic properties of (La1−xFex)FeO3 (x = 0, 0.25, 0.50) perovskite. J. Alloys Compd. 2019, 784, 1198–1204. [Google Scholar] [CrossRef]
  82. Zepeda-Alarcon, E.; Nakotte, H.; Gualtieri, A.F.; King, G.; Page, K.; Vogel, S.C.; Wang, H.-W.; Wenk, H.-R. Magnetic and nuclear structure of goethite (α-FeOOH): A neutron diffraction study. J. Appl. Crystallogr. 2014, 47, 1983–1991. [Google Scholar] [CrossRef] [Green Version]
  83. Cambier, P. Infrared Study of Goethites of Varying Crystallinity and Particle-Size: 1. Interpretation of OH and Lattice Vibration Frequencies. Clay Miner. 1986, 21, 191–200. [Google Scholar] [CrossRef] [Green Version]
  84. Thomas Arrigo, L.K.; Byrne, J.M.; Kappler, A.; Kretzschmar, R. Impact of Organic Matter on Iron(II)-Catalyzed Mineral Transformations in Ferrihydrite–Organic Matter Coprecipitates. Environ. Sci. Technol. 2018, 52, 12316–12326. [Google Scholar] [CrossRef]
  85. Bowles, J.F.W. Hydroxides. In Encyclopedia of Geology, 2nd ed.; Alderton, D., Elias, S.A., Eds.; Academic Press: Oxford, UK, 2021; pp. 442–451. [Google Scholar]
  86. Thomas Arrigo, L.K.; Mikutta, C.; Byrne, J.; Kappler, A.; Kretzschmar, R. Iron(II)-Catalyzed Iron Atom Exchange and Mineralogical Changes in Iron-rich Organic Freshwater Flocs: An Iron Isotope Tracer Study. Environ. Sci. Technol. 2017, 51, 6897–6907. [Google Scholar] [CrossRef]
  87. Zielińska-Błajet, M.; Feder-Kubis, J. Monoterpenes and Their Derivatives—Recent Development in Biological and Medical Applications. Int. J. Mol. Sci. 2020, 21, 7078. [Google Scholar] [CrossRef] [PubMed]
  88. Ovais, M.; Khalil, A.T.; Islam, N.U.; Ahmad, I.; Ayaz, M.; Saravanan, M.; Shinwari, Z.K.; Mukherjee, S. Role of plant phytochemicals and microbial enzymes in biosynthesis of metallic nanoparticles. Appl. Microbiol. Biotechnol. 2018, 102, 6799–6814. [Google Scholar] [CrossRef] [PubMed]
  89. Ludwiczuk, A.; Skalicka-Woźniak, K.; Georgiev, M.I. Chapter 11—Terpenoids. In Pharmacognosy; Badal, S., Delgoda, R., Eds.; Academic Press: Boston, MA, USA, 2017; pp. 233–266. [Google Scholar]
  90. Venkata, A.L.K.; Sivaram, S.; Sajeet, M.; Sanjay, P.M.; Srilakshman, G.; Muthuraman, M.S. Review on terpenoid mediated nanoparticles: Significance, mechanism, and biomedical applications. Adv. Nat. Sci. Nanosci. Nanotechnol. 2022, 13, 033003. [Google Scholar] [CrossRef]
  91. Aksu Demirezen, D.; Yıldız, Y.Ş.; Yılmaz, Ş.; Demirezen Yılmaz, D. Green synthesis and characterization of iron oxide nanoparticles using Ficus carica (common fig) dried fruit extract. J. Biosci. Bioeng. 2019, 127, 241–245. [Google Scholar] [CrossRef] [PubMed]
  92. Klencsár, Z.; Kuzmann, E.; Vértes, A. User-friendly software for Mössbauer spectrum analysis. J. Radioanal. Nucl. Chem. 1996, 210, 105–118. [Google Scholar] [CrossRef]
  93. Murad, E.; Cashion, J. Mössbauer Spectroscopy of Environmental Materials and Their Industrial Utilization; Kluwer Academic Publishers: Boston, MA, USA, 2004. [Google Scholar]
Figure 1. FTIR spectra of the reference sample and samples with the addition of (a) 4.5% surfactants and (b) 4.5% essential oils prepared at 200 °C for 20 min.
Crystals 12 01567 g001
Figure 2. FTIR spectra of the reference samples with varying synthesis times and samples with 1% addition of surfactant PEG and lavender essential oil prepared at 260 °C.
Crystals 12 01567 g002
Figure 3. Final observed (red dots) and calculated (blue solid line) powder diffraction profile for (a) sample RS1 and (b) sample S12 as obtained from Rietveld refinements against PXRD data at RT. The fitted background contribution is represented by the lower dark green solid line. The black solid line (bottom) shows the difference profile, while the green and purple vertical lines show the reflection positions of hexagonal α-Fe2O3 and orthorhombic α-FeOOH, respectively.
Crystals 12 01567 g003
Figure 4. Cascade PXRD patterns of reference sample RS1 and samples S1–S6, prepared with addition of surfactants at 200 °C.
Crystals 12 01567 g004
Figure 5. Cascade PXRD patterns of the reference sample RS1 and samples S7–S12 prepared with addition of essential oils at 200 °C.
Crystals 12 01567 g005
Figure 6. Cascade PXRD patterns of the reference samples RS2–RS4 and samples S13–S18 prepared at 260 °C.
Crystals 12 01567 g006
Figure 7. The FE-SEM images of (a) reference sample RS1, (b) sample S2 with 4.5% PEG, and (c) sample S12 with 4.5% lavender essential oil, prepared at 200 °C for 20 min, taken at 33,000× magnification.
Crystals 12 01567 g007
Figure 8. The FE-SEM images of (a) reference sample RS2 prepared for 20 min, (b) reference sample RS4 prepared for 5 min, (c) sample S13 with 1% PEG, and (d) sample S18 with 1% lavender essential oil, prepared at 260 °C for 5 min, taken at 33,000× magnification.
Crystals 12 01567 g008
Figure 9. Proposed mechanisam of the synthesis pathway of hematite NPs by monoterpenoids.
Crystals 12 01567 g009
Table 1. Experimental conditions for the samples prepared at 200 °C for 20 min.
SampleSurfactantMass.%pHSampleEssential OilVol.%pH
RS1--13.28S7sage1.013.22
S1PEG 11.013.04S8sage4.513.06
S2PEG 14.513.15S9rosemary1.013.09
S3NGS 21.012.81S10rosemary4.513.14
S4NGS 24.59.50S11lavender1.013.26
S5SDS 31.013.07S12lavender4.513.23
S6SDS 34.513.03
1 PEG (polyethylene glycol) 2 NGS (N-guanylurea sulfate) 3 SDS (sodium dodecyl sulfate).
Table 2. Experimental conditions for the samples prepared at 260 °C with different synthesis times.
SampleSurfactantMass.%t/minpHSampleEssential OilVol.%t/minpH
RS2--2013.24S16sage1513.12
RS3--1013.09S17rosemary1512.24
RS4--513.14S18lavender1513.14
S13PEG 11513.04
S14NGS 21512.93
S15SDS 31513.04
1 PEG (polyethylene glycol) 2 NGS (N-guanylurea sulfate) 3 SDS (sodium dodecyl sulfate).
Table 3. The notation of samples prepared at 200 °C for 20 min, results of phase analysis, and resulting microstructural parameters obtained from the Rietveld refinements against laboratory PXRD data.
SampleUnit Cell Metrics/ÅCrystallite Size/nmPhase Fraction/wt.%Rwp
/%
α-Fe2O3
(s.g. R-3c)
α-FeOOH
(s.g. Pbnm)
α-Fe2O3α-FeOOHα-Fe2O3α-FeOOH
RS1a = 5.0359(2)
c = 13.7571(4)
a = 9.9570(7)
b = 3.0216(2)
c = 4.6085(3)
103.1(1)73.1(1)43.156.92.43
S1a = 5.0359(9)
c = 13.7568(2)
a = 9.957(1)
b = 3.0220(2)
c = 4.6087(4)
146.2(1)46.2(1)80.319.72.07
S2a = 5.0364(1)
c = 13.7586(3)
a = 9.957(1)
b = 3.0226(3)
c = 4.6093(6)
125.0(1)39.7(1)84.715.21.30
S3a = 5.0358(1)
c = 13.7577(3)
a = 9.955(1)
b = 3.0225(3)
c = 4.6079(5)
142.5(1)42.6(1)84.016.02.59
S4a = 5.0358(1)
c = 13.7579(4)
a = 9.959(2)
b = 3.0220(4)
c = 4.6091(7)
157.2(2)39.6(1)82.117.92.38
S5a = 5.03609(1)
c = 13.7582(3)
a = 9.9561(8)
b = 3.0222(2)
c = 4.6082(4)
177.5(1)46.0(1)71.428.61.47
S6a = 5.0357(1)
c = 13.7563(3)
a = 9.958(1)
b = 3.0218(3)
c = 4.6087(4)
166.6(1)45.9(1)75.524.52.02
S7a = 5.0348(1)
c = 13.7500(4)
a = 9.953(8)
b = 3.023(2)
c = 4.596(4)
172.1(1)53.2(1)98.02.01.59
S8a = 5.0348(6)
c = 13.752(3)
a = 9.957(5)
b = 3.0214(4)
c = 4.6059(5)
130.2(1)51.6(1)74.925.12.23
S9a = 5.03451(8)
c = 13.7501(3)
a = 9.949(4)
b = 3.021(1)
c = 4.605(2)
173.1(2)44.6(2)96.43.61.58
S10a = 5.0346(1)
c = 13.7500(4)
a = 9.960(5)
b = 3.0195(8)
c = 4.607(2)
182.3(2)98.1(2)96.83.21.98
S11a = 5.0348(3)
c = 13.7513(3)
a = 9.957(4)
b = 3.021(1)
c = 4.6068(7)
170.2(1)50.4(1)74.225.82.01
S12a = 5.03600(7)
b = 13.7546(2)
220.4(1)-100-1.95
Table 4. The notation of samples prepared at 260 °C with varying synthesis times, results of phase analysis, and resulting microstructural parameters obtained from the Rietveld refinements against laboratory PXRD data.
SampleUnit Cell Metrics
α-Fe2O3 (s.g. R-3c)
Crystallite Size/nmPhase Fraction/wt.%Rwp
/%
a/Åc/Åα-Fe2O3α-Fe2O3
RS25.0345(1)13.7511(2)194.2(2)1008.50
RS35.0370(2)13.7576(4)102.7(3)1008.64
RS45.0351(1)13.7520(3)98.7(2)1008.40
S135.0358(1)13.7544(3)140.3(1)1008.66
S145.0349(1)13.7513(3)190.3(2)1002.08
S155.0361(1)13.7570(3)150.2(1)1008.66
S165.0350(1)13.7503(3)190.3(2)1001.99
S175.0350(2)13.7512(3)203.9(1)1001.93
S185.035(1)13.751(2)221.7(1)1002.15
Publisher’s Note: MDPI stays neutral with regard to jurisdictional claims in published maps and institutional affiliations.

