
Properties of Humic Substances in Composts Comprised of Different Organic Source Material
by
 , , , ,
Marge Lanno
1,*,
Maris Klavins
2,
Oskars Purmalis
2,
Merrit Shanskiy
1,
Anu Kisand
1 and
Mait Kriipsalu
3 
1
Institute of Agricultural and Environmental Sciences, Estonian University of Life Sciences, 51006 Tartu, Estonia
2
Department of Environmental Sciences, University of Latvia, 1586 Riga, Latvia
3
Institute of Forestry and Rural Engineering, Estonian University of Life Sciences, 51006 Tartu, Estonia
*
Author to whom correspondence should be addressed.
Agriculture 2022, 12(11), 1797; https://doi.org/10.3390/agriculture12111797
Submission received: 4 October 2022
/
Revised: 20 October 2022
/
Accepted: 24 October 2022
/
Published: 28 October 2022
(This article belongs to the Special Issue Sustainable Utilization of Humic Substances and Organic Waste in Green Agriculture)
Abstract
:Reusing organic waste as fertilizer is one method to reduce the use of mineral fertilizers and minimize waste disposal in landfills. Regulations have been enacted for the processing of organic waste and for recycling end products, but the humic content of organic fertilizers has been neglected. We studied seven composts with different organic input materials and technologies. Humic substances (HSs) were detected in all composts. The total organic carbon in the HSs constituted 8.7 ± 0.1% (SD)–27.0 ± 0.2% of the compost dry matter. Spectral differences between the studied samples in FTIR spectroscopy could be observed at 1700–1000 cm−1, indicating differences in compost precursor material. The EEM peak, associated with humic acids (HAs), was high in composts containing animal by-products (e.g., fish waste, horse manure, and kitchen biowaste). Kitchen biowaste, also when processed by Hermetia illucens larvae and vermicompost, exhibited slower organic material transformation with low humic acid/fulvic acid ratios (<1.60). The results show the importance of source material origin and amendments, which influence the composting process and final products. Our study emphasizes the role of humic substances in the comprehensive evaluation of composts. To maximize the added value of composts, marketing strategies should consider determining the share of humic substances besides the content of organic matter and nutrients.
1. Introduction
With rapid urbanization and population growth, global annual waste is expected to increase by 3.4 billion tons by 2050 [1]. It is estimated that, across the European Union (EU), up to 138 million tons of bio-waste is generated annually, of which only 60 million tons is recycled through composting and anaerobic digestion [2]. About 120–130 tons of bio-waste are generated in Estonia annually, of which 30% is recycled. Unsegregated bio-waste is incinerated or disposed in a landfill [3]. Managing this waste to minimize environmental impacts is increasingly important. Waste disposal, especially organic waste disposal in landfills, causes various environmental impacts, including landfill gases, contributing to air pollution and climate warming and leachate contaminating groundwater [4]. Within the framework of a circular economy, EU waste policies (directives 2018/850 and 2018/851) aim to reduce the landfilling of municipal waste to 10% of current levels by 2035 and to increase the re-use and recycling of municipal waste up to 65% [5,6]. This ambitious policy objective is only achievable by implementing organic-waste-management strategies.
The dependence on mineral fertilizers for agriculture can threaten food security if they become less available. Limited reserves of mineral fertilizer raw materials and changes in supply chains due to various environmental, political, and epidemiological crises all affect the price and availability of mineral fertilizers [7,8]. At the same time, the EU is conducting the Green Deal, which aims to reduce greenhouse gas pollution and slow down climate change [8]. To increase self-sufficiency and reduce environmental impacts, the supply of alternative fertilizers could be increased at the local level.
It was stated within EU regulation 2019/1009 that organic fertilizer shall contain organic carbon (Corg) and nutrients of a solely biological origin [9]. Composting is a common biological treatment option, suitable for processing organic waste from various sources. Mature compost is a stable and nutrient-rich, humus-like product, representing a valuable source of recovered nutrients. The concentration of nutrients is determined by input materials. The determination of total nutrient contents for fertilizing purposes is regulated, but results do not describe the proportion of nutrients that are readily available to plants [10,11]. The quality of mature compost is described as a combination of two criteria. First, the precautionary criteria (hygiene parameters, impurities, weed seeds, and inorganic pollutants, such as heavy metals) set limits to prevent environmental pollution and the spread of diseases [9]. Second, quality criteria provide information about fertilizing properties, such as nitrogen (N), phosphorus (P), potassium (K) and micronutrients, organic matter content, salinity, and pH [12,13].
Composts tend to be compared to mineral fertilizers, despite having more complex compositions [14,15]. A distinctive feature of compost is the presence of natural organic matter, reflecting a wide range of environmental and biowaste degradation processes. In Europe, an estimated 45% of soils are low in organic matter content, which lowers soil productivity and increases the risk of soil degradation [16]. With climate change, it is estimated that global air temperatures will increase by 2 °C by 2100 compared to pre-industrial levels, which will change environmental conditions and agricultural production [8,17]. Soils with a higher organic matter content are more resistant to drought and climate change [18]. Organic matter is a nutrient reservoir and can retain nutrients in a plant-available form. Compost can also help restore humus in degraded soils [14,18,19]. While compost has various quality standards regarding fertilizing properties and has limits to prevent environmental pollution and the spread of diseases, it is often overlooked that compost adds humic substances (HSs) to the soil [9,20]. HSs, including humic acids (HAs), fulvic acids (FAs), and humin, are part of the soil organic matter (SOM) that forms humus [21]. The formation of fertile soil layers rich in humic substances can take decades in nature, but it takes 6–12 months to produce a humic-acid-like substance by composting [22,23]. HSs are important in soil restoration processes and can be used to promote nutrient uptake, increase soil porosity, enhance nutrient preservation and water-holding capacity, and reduce the abundance of pathogens [24,25]. HS concentration in the compost is correlated with compost maturity and provides added value to the waste material [26,27]. Therefore, the benefits of composts are described by nutrient and HS contents. These natural biostimulants can be an important marketing tool for composts, which are primarily used in agriculture.
The aim of this study is to compare various composts to quantify HSs and determine whether HS content depends on input materials (manure, sewage sludge, vermicompost, fish, food, yard waste, and black soldier frass) or the selected treatment. These results will draw attention to an important feature of compost that has been underappreciated in compost evaluation and marketing processes.
2. Materials and Methods
2.1. Selection of Composts
Seven composts of different source materials were investigated. Composts were produced from low-valued fish (C1), horse manure (C2), green waste (e.g., branches, leaves, plant residues) (C3), sewage sludge (C4), and kitchen biowaste (C5). In addition, Hermetia illucens frass (C6) and vermicompost (C7) were selected. All composts were prepared in Estonia by different manufacturers or by the authors. Four composts (C2–C5) were industrially produced and commercially marketed. Composts C3, C4, and C5 were certified according to the Estonian end-of-waste regulation [28], while certification was not required for C2 because manures are not classified as waste. Composts C1, C6, and C7 were experimental (Table 1), and compost amendments and composting technologies were determined by the manufacturer. Straw is a dry and widely available bulking material in Estonia; therefore, it is well-suited for composting wet waste, such as sludge. Shredded wood, another common bulking material, and straw increase porosity, improve air circulation, and adjust C/N ratios (20–30)/1.
Composts C1–C5 were processed on an industrial scale in outdoor windrows and mixed mechanically with a Backhus 16.30 windrow turner (Eggersmann Anlagenbau GmbH, Bad Oeynhausen, Germany) or an CMC ST 300 windrow turner (Composts Systems GmbH, Wels, Austria). All windrows were approximately 1.5 m high, 3 m wide, and 12 m long and were covered with semi-permeable geotextile KSV 200 (Compost Systems GmbH, Wels, Austria). All composts were maintained in accordance with national biowaste recycling regulations [28,29]. For waste containing animal by-products (ABPRs), such as fish waste and horse manure, the temperature exceeded 70 °C for at least 1 h, as required by EU regulations (EU 142/2011) [10]. To compost biodegradable waste, including kitchen waste and sewage sludge, the temperature had to exceed 55 °C for 10 d or 65 °C for at least 3 d [12,13]. The active composting period was considered complete when the temperature dropped to an ambient level, and after mixing the windrows, no significant temperature increase occurred.
Compost C1 was an experimental treatment made by the authors at an industrial scale. For C1, the targeted waste material, measured as wet weight, was fish by-catch (ABPRs, 22%) amended with structural materials, wheat straw (22%), peat (22%), and inoculated with composts from similar previous batches (34%). Peat and mature compost, which have a small particle size, also served as a binder for fish material [30]. Compost C2 was composed of horse manure (ABPRs, 60%) amended with straw (40%). Compost C3 consisted of municipal sewage sludge (WWTP with a load of 16.733 PE) amended with straw. The ratio of sludge to straw was 1:1 by volume, resulting in a 9:1 ratio by weight. Compost C4 was composed of biowaste from urban green areas. Compost C5 was made of source-separated household biowaste amended with shredded wood (1:1 by volume) and 6% of category III ABPRs from the chicken industry. Treatments C2–C5 were compatible with national compost quality regulations [28].
Treatments C6 and C7 were prepared on a pilot scale. For C6, H. illucens larvae were fed for 51 d, with the frass in contact with fresh feed. The frass was sieved off every two weeks during the cycle. Feed consisted of approximately 150 L of raw vegetable and fruit waste. To ensure a suitable moisture content, hot-pressed rapeseed cake, rye/wheat bread, and 2 L of canola oil were used. In addition to vegetable and fruit waste, approximately 90 L of catering waste was used.
For treatment C7, Eisenia fetida were fed in quadruplicate three-liter mesocosms for 136 d. In the beginning of the experiment, 20 earthworms were applied in each mesocosm (average mass 4.12 g). The experiment was conducted in a temperature-controlled room at 22 °C. Moisture was controlled weekly using the hand-held W.E.T. Sensor Kit (Delta-T Devices, Cambridge, England). Vermicompost moisture was kept in a range of 75–80%, as recommended by Khan et al. [31]. The organic feed was mixed with 50 g of biochar (Biolan Baltic OÜ, Lavassaare, Estonia), with properties described by Escuer, 2021 [32]. Biochar was added to increase reproduction and create favorable conditions for E. fetida, while also enhancing microbial biodegradation and the composting process [31,33]. For amendments, milled straw, garden and kitchen green waste, and shredded paper were used. Feed calculations assumed that individual E. fetida consume half of its body mass per day. Later, feeding was adjusted based on earthworm performance in the mesocosms. For the first feeding, 200 g of feed with 50 g of biochar was applied.
2.2. Chemical Analyses
Approximately 250 g of mature compost from three random locations were collected and homogenized from each treatment. For treatments C1–C5, the compost samples were collected 20–30 cm inside the windrow. For treatment C6, H. illucens frass was sieved and homogenized before sampling. For treatment C7, subsamples were taken from four replicate mesocosms and mixed to obtain one homogenous sample per mesocosm. Subsamples were collected based on volume, and earthworms and cocoons were separated by hand.
Samples were dried at 105 °C and ball-milled prior to analysis. Elemental analysis (C, N) was conducted using a VarioMAX CNS analyzer (ELEMENTAR, Langenselbold Germany). Potassium (K), calcium (Ca), magnesium (Mg) contents, and phosphorus (P) were determined using the ammonium acetate–lactate (AL) method as described by Egner et al. [34].
Lipids were extracted using 10 g of dried compost sample and 10 mL of CHCl3. The extract was filtered after 24 h through filter paper into a pre-weighed Petri dish. The air-dried lipids were weighed, and their proportion in the compost was calculated.
2.3. Extraction of Humic and Fulvic Acids
For HA extraction, 5 g compost and 50 mL 2% NaOH solution were combined and stirred for 4 h. The suspension was filtered and acidified with 6M HCl under constant stirring until pH = 2 was reached, HA precipitated, and only FA remained in the solution. Freeze-dried HA were used to prepare HA solution (50 mg/L) using 0.1 NaOH [35].
Characterization of isolated humic and fulvic acids were conducted as suggested by Klavins and Purmalis [36]. The ratio of HA/FA was calculated the using total organic carbon (TOC) values in HA and FA solutions. TOC analyses were performed using a Shimadzu TOC-V CSN total carbon analyzer (Shimadzu Corporation, Kyoto, Japan), operating at 720 °C.
2.4. UV–Vis Absorption Spectra of HA
The absorbance of solubilized HA (50 mg/L) in 0.1 M NaOH was measured using a UV–Vis spectrophotometer Shimadzu UV-1800 (Shimadzu Corporation, Kyoto, Japan), with a 1 cm quartz cuvette and a wavelength range of 230–670 nm. Absorbance ratios, E2/E3, were calculated using UV–Vis absorption at 250 nm and 365 nm, and E4/E6 was calculated from the UV–Vis absorption at 465 nm and 665 nm [37,38].
2.5. Fourier-Transform Infrared Absorption Spectra (FTIR) of HA
To obtain the spectra, 3 mg of HA sample and 200 mg of KBr powder were mixed together, and 30 mg of the mixture was weighed and compressed into a tablet. The FTIR spectra were obtained using a Fourier-transform infrared spectrophotometer Shimadzu IR-Tracer 100 (Shimadzu Corporation, Kyoto, Japan), at an infrared spectrum of 400 to 4000 cm−1, with a resolution 4 cm−1, and by taking 10 scans.
2.6. Excitation Emission Matrix (EEM) Spectroscopy of HA and FA
Extracted HA and FA samples were analyzed using fluorescence spectroscopy TL spectrometer HORIBA Aqualog (Horiba Ltd., Kyoto, Japan). The EEM spectra were measured at an emission wavelength range of 250–600 nm and an excitation wavelength range of 250–600 nm scanning with 5 nm increments. The obtained spectra were evaluated with PARAFAC analysis using MATLAB R2014 a v. 5.3.0.532 software with the DOMFluor and drEEM toolboxes [39].
2.7. Statistical Analysis
3. Results
The nutrient content and pH of the composts is presented in Table 2. Composts C3 and C6 had a remarkably high P concentration, and C5 showed the lowest P and highest N concentration, concurrently. Compost C6 had the lowest Ca and Mg content, while both of these nutrients were high in C2 and C4. The pH of the treatments ranged from 5.77 to 8.10.
The humification of organic material can be estimated from the HA/FA ratio (Table 3). A higher HA/FA ratio corresponded to higher humification rates of the organic material. The highest HA/FA ratios were measured in treatments C2 (7.88) and C4 (7.82), whereas the lowest HA/FA ratios were observed in treatments C6 (1.46) and C5 (1.42). Treatments C6 and C5 had the highest concentrations of lipids (2.1% and 4.2%, respectively).
The spectral ratio E4/E6 shows the overall aromaticity and condensation of the material and can characterize the size of molecules (Table 3) [37]. E4/E6 depends on the source material. The smallest E4/E6 ratio, indicating the greatest organic matter polymerization, was observed in compost C6 (6.40), followed by C5 (6.88) and C2 (6.95). The lowest aromaticity was observed in compost C7 (8.59). E2/E3 describes not only aromaticity, but also the degradation of original material, including the degradation of phenols [37]. When E2/E3 is <3.5, the content of HA is higher than that of FA [42]. For all composts, the ratio varied in the range 2.38–2.66.
The UV–Vis spectra of HA (Figure 1) monotonically decreased with the increasing wavelength. The absorption peaks of UV–Vis spectra between 255 and 290 nm are typical for aromatic or unsaturated compounds, such as quinones and ketones [36]. These spectra were visible for C1, C2, and C3. Composts C4, C7, and C6 had small shoulders of spectra, and C5 did not exhibit a shoulder of spectra.
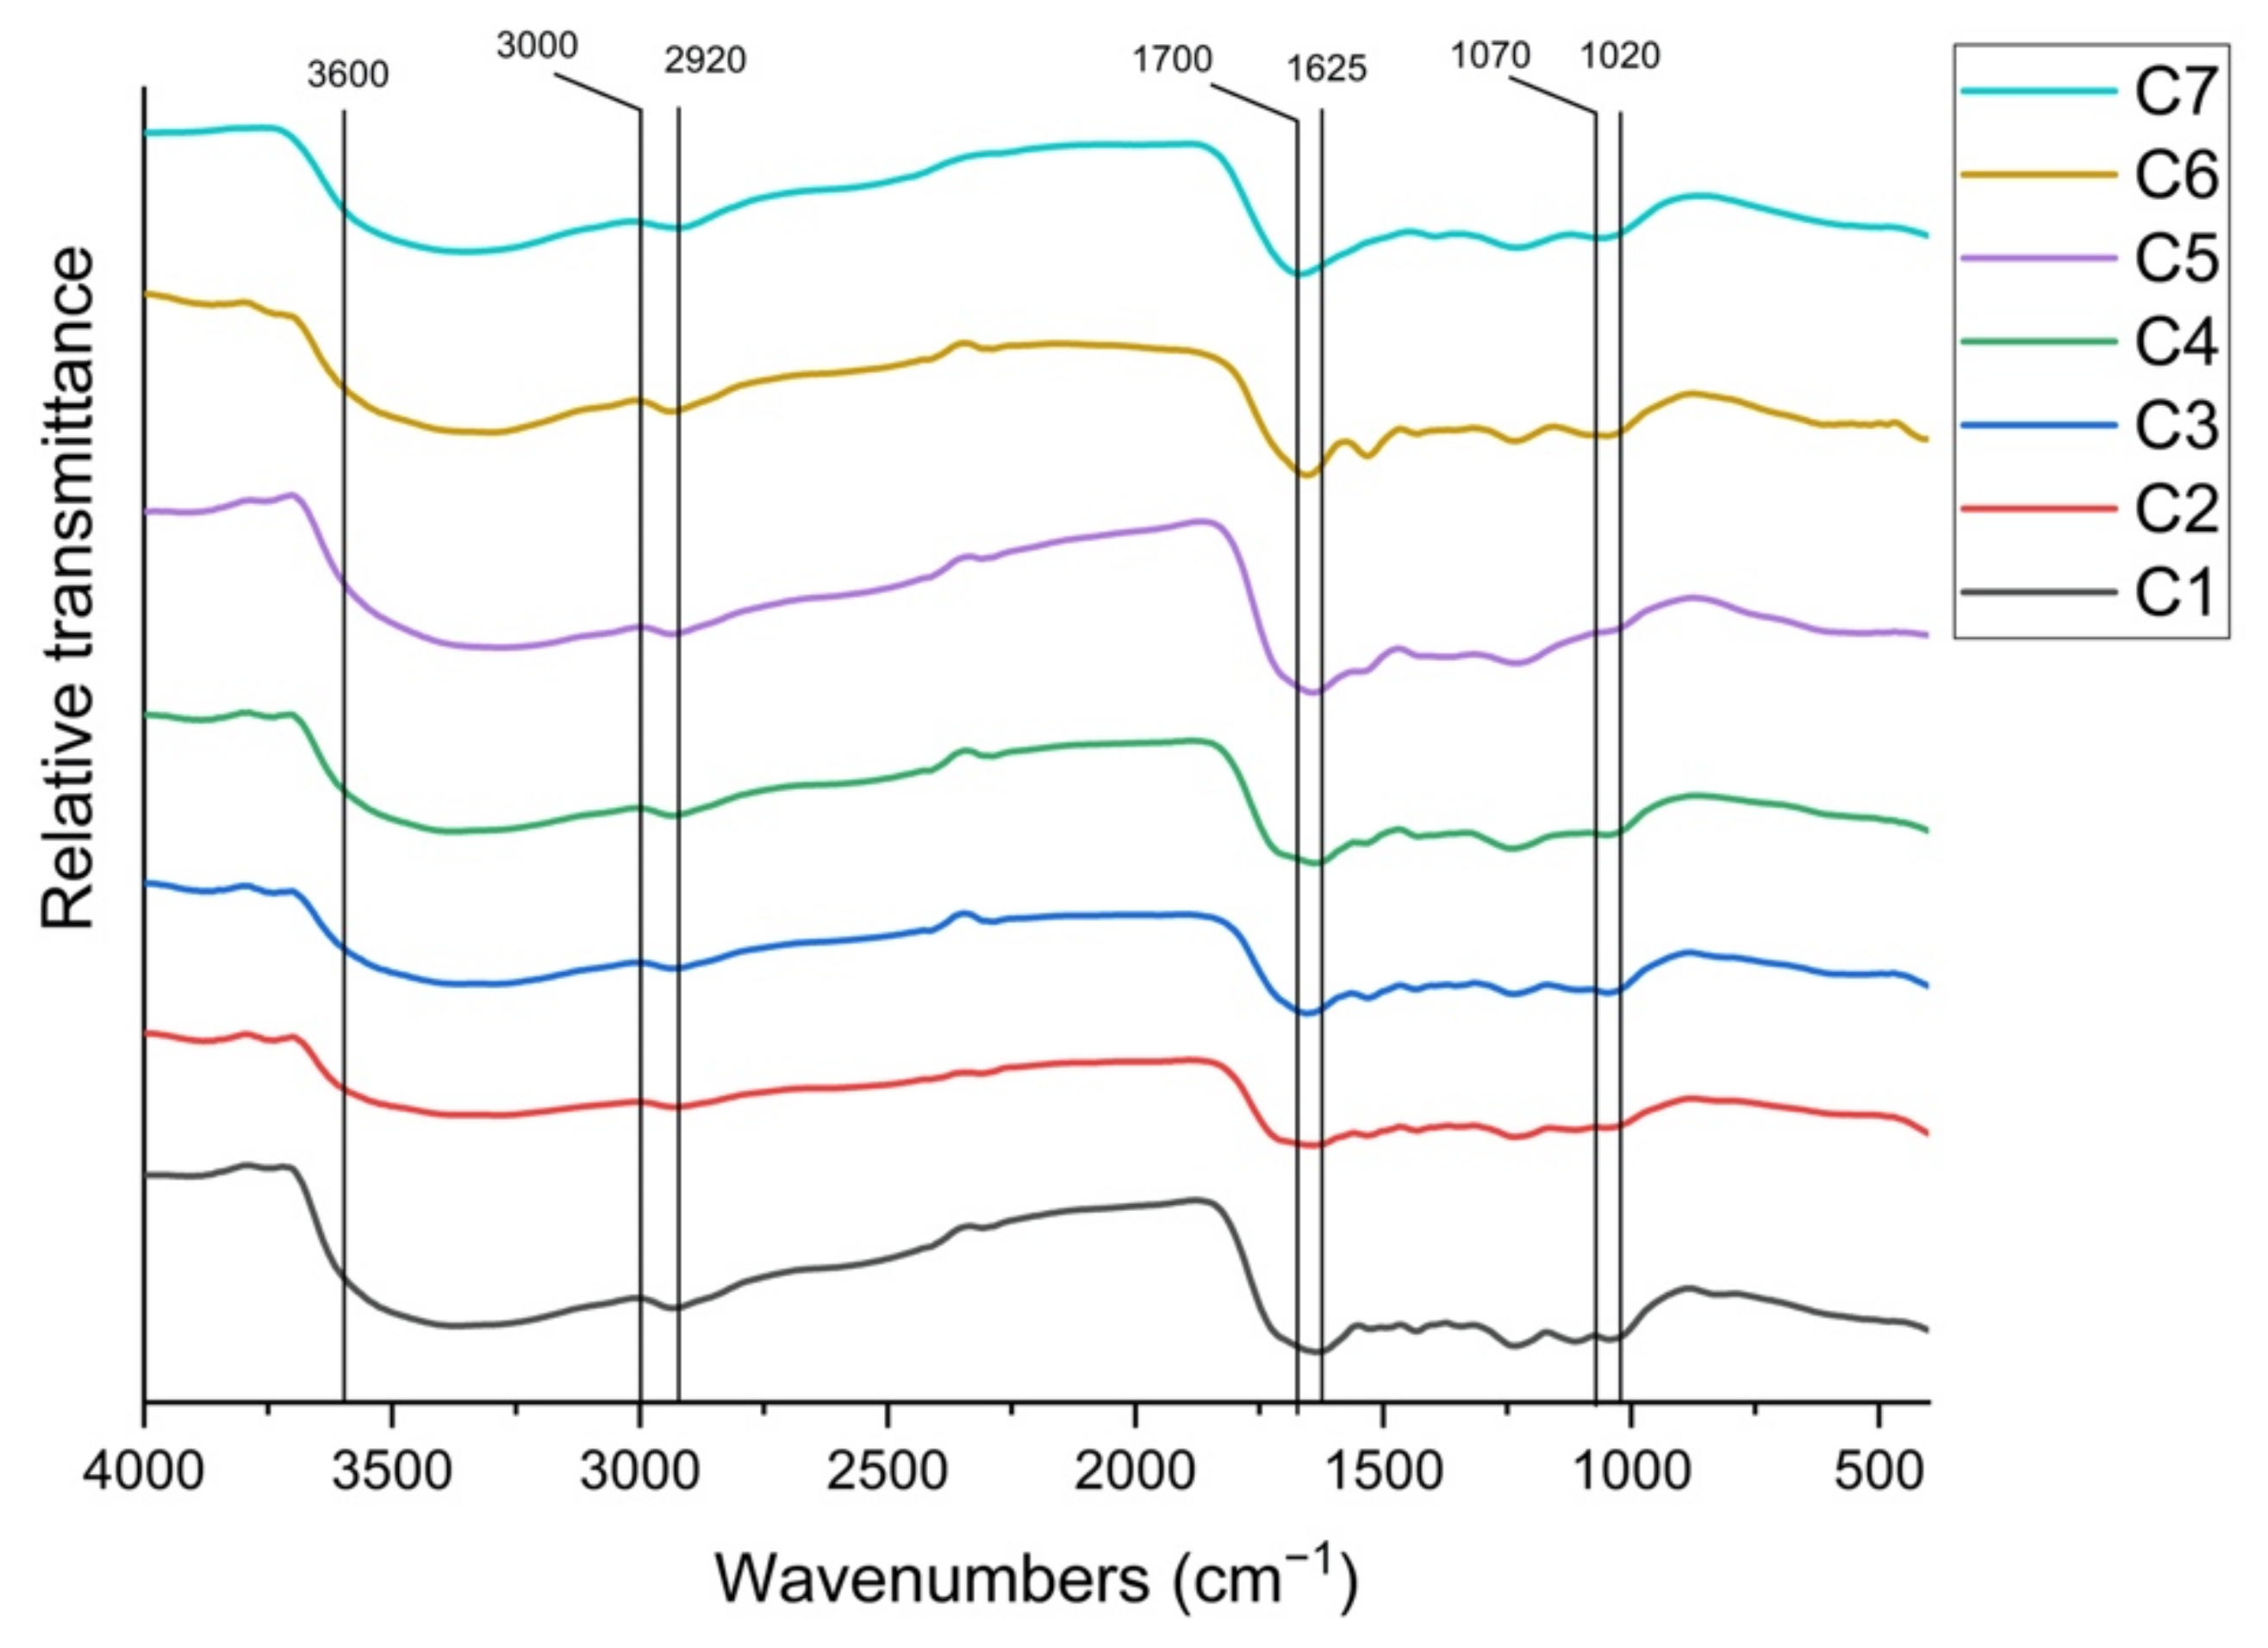
The FTIR spectra of the analyzed samples had a similar pattern, showing the similarity of the obtained HSs and absorption at 3600–3000 cm−1, representing -OH groups (Figure 2). Methyl groups in aliphatic compounds were visible at 2920 cm−1 and were similar in all samples [43]. At 1700 cm−1, the spectra showed the absorption of C=O bonds in carboxyl groups, aldehydes, ketones, and esters, with higher rates in samples C3, C4, C5, and C7. The region at 1637–1610 cm−1 shows significantly less signal for C7 and moderately less for C2. Different from other composts, C5 had a small absorption in C-N and N-H bonds in amides, and C7 had none. The region at 1470–1370 cm−1 represents carbonyl acids and phenols, and there were visible differences for samples C7 and C5, where the presence of those bands was low. Carboxylic groups and ethers were present in all compost HA samples, with slightly higher amounts for C1 and C4.
Common, and at the same time similar for all samples, was the presence of C-O in carboxyl groups and ethers. The region at 1070–1020 cm−1 describes the C-O bonds in polysaccharides, with noticeably less in the C2 and C5 samples. The presence of detected structural features describes the condensation and conjugation of organic material during composting processes.
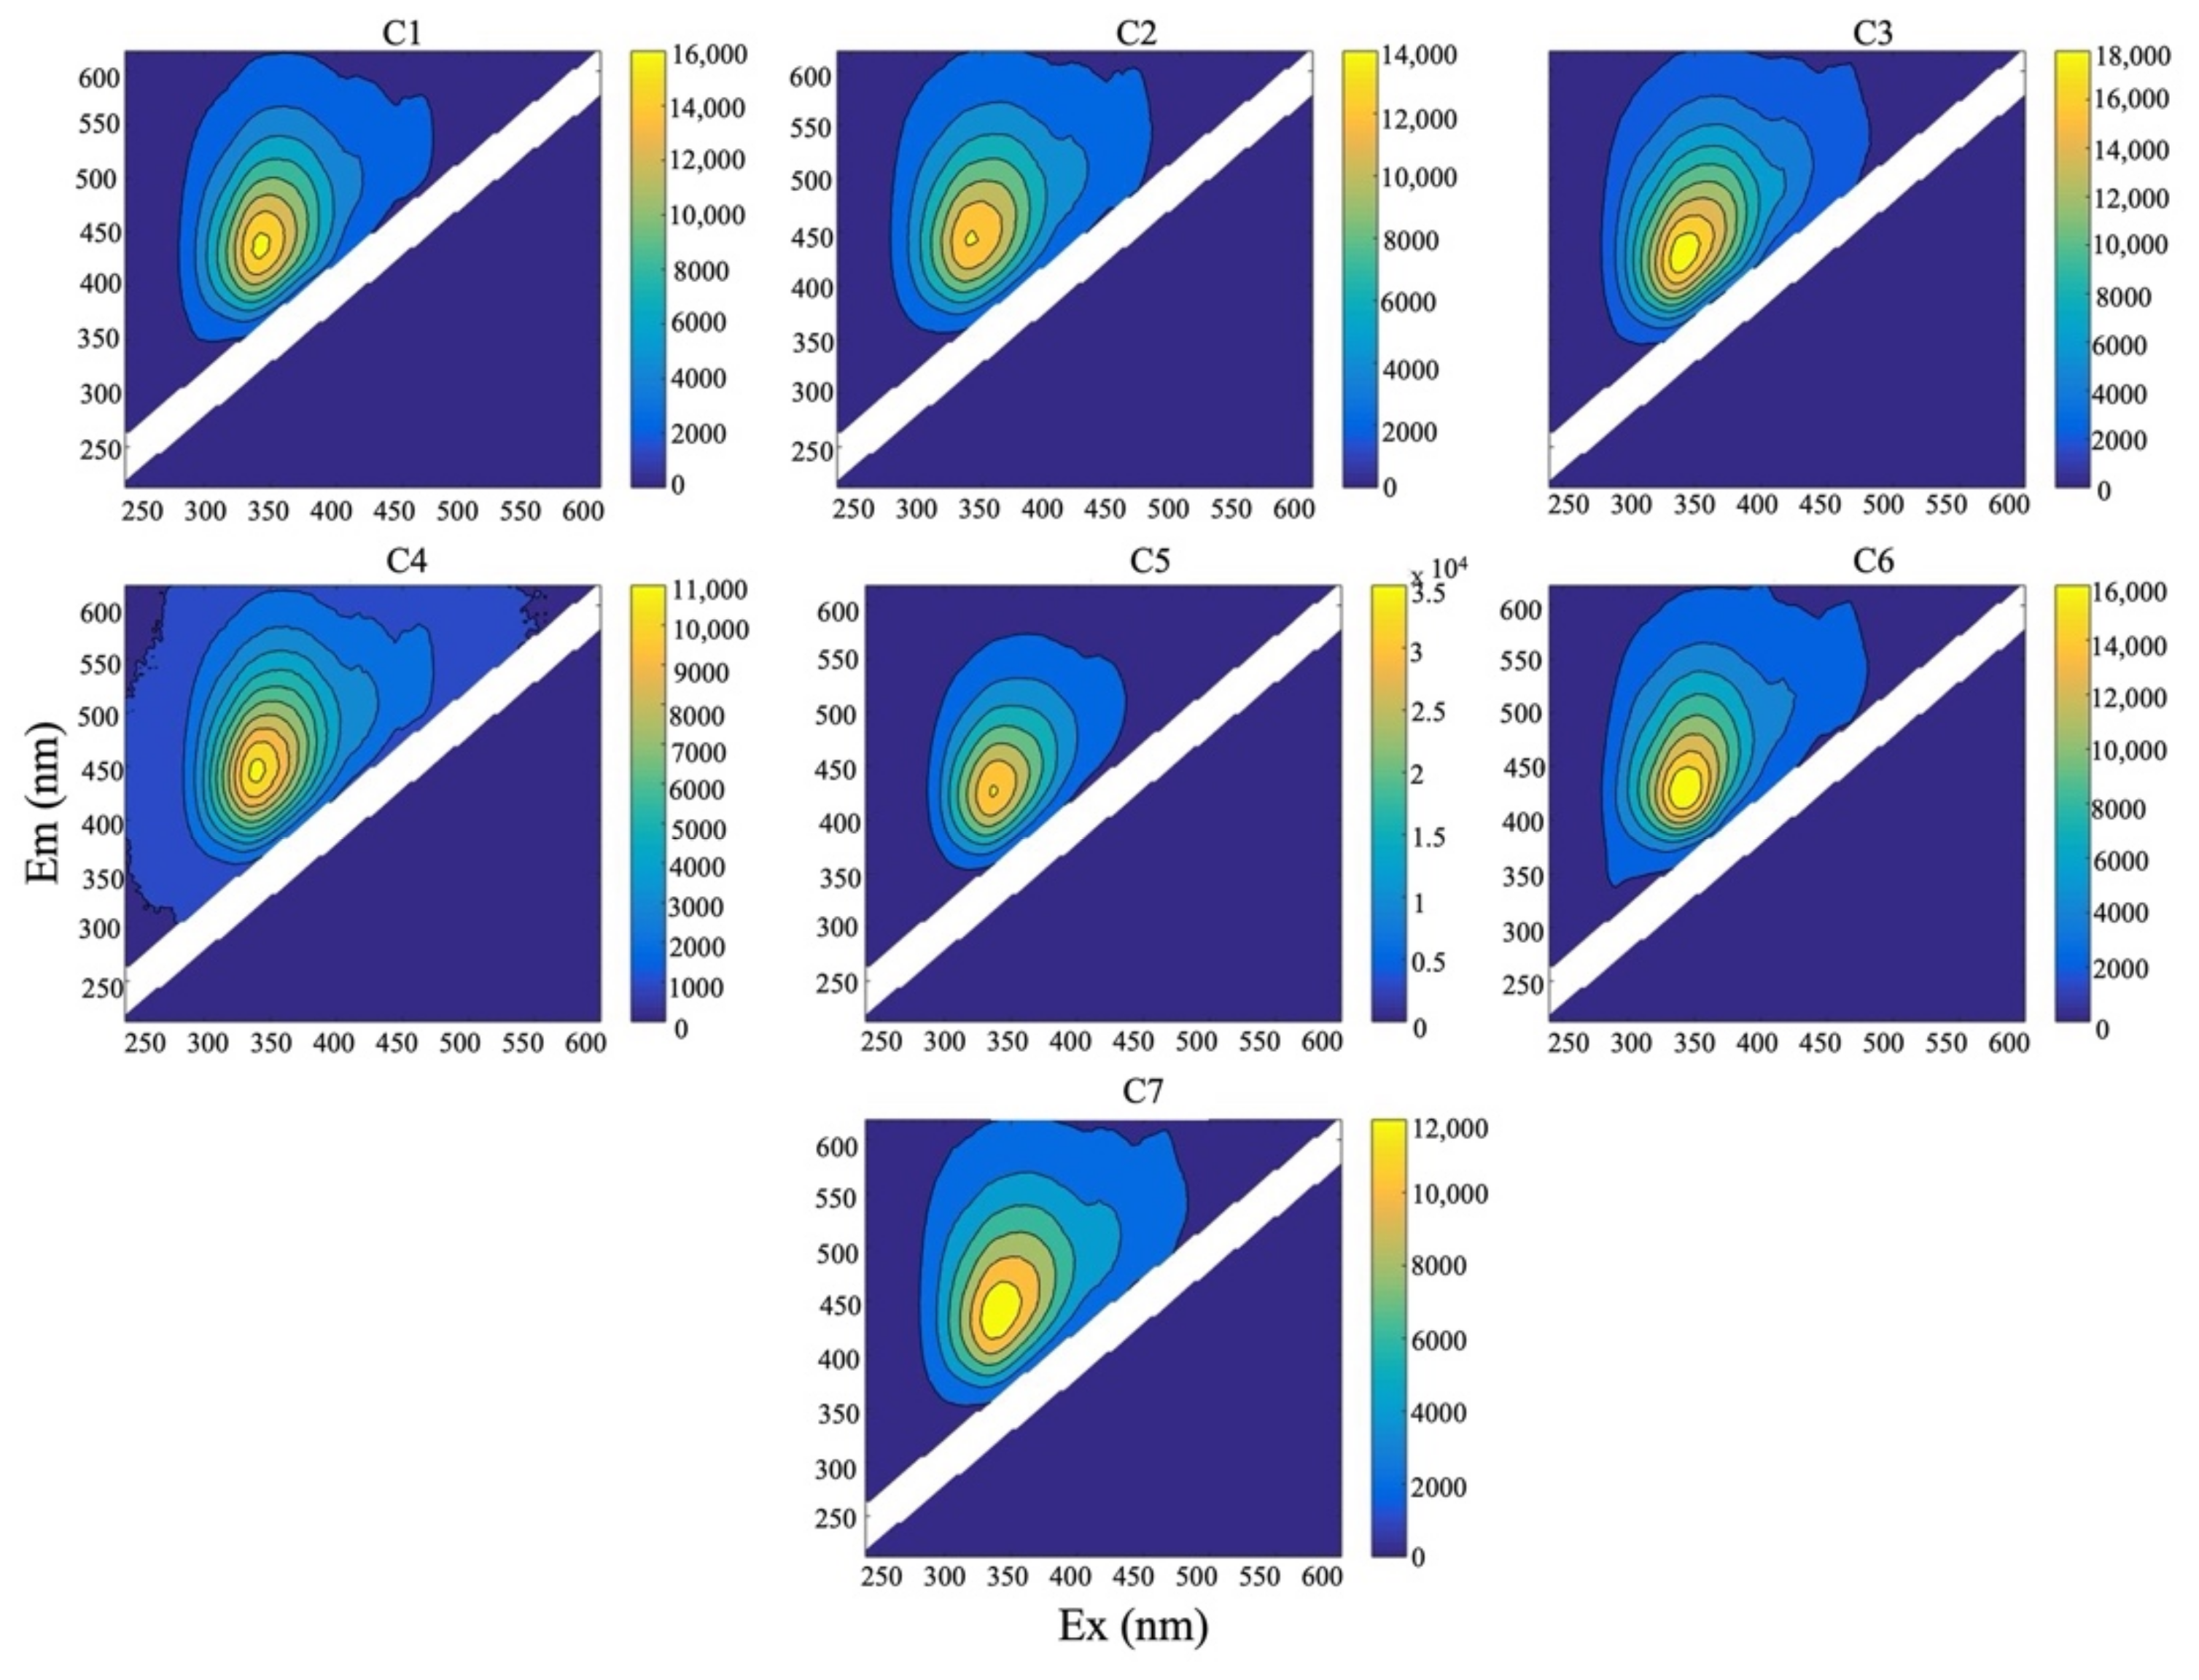
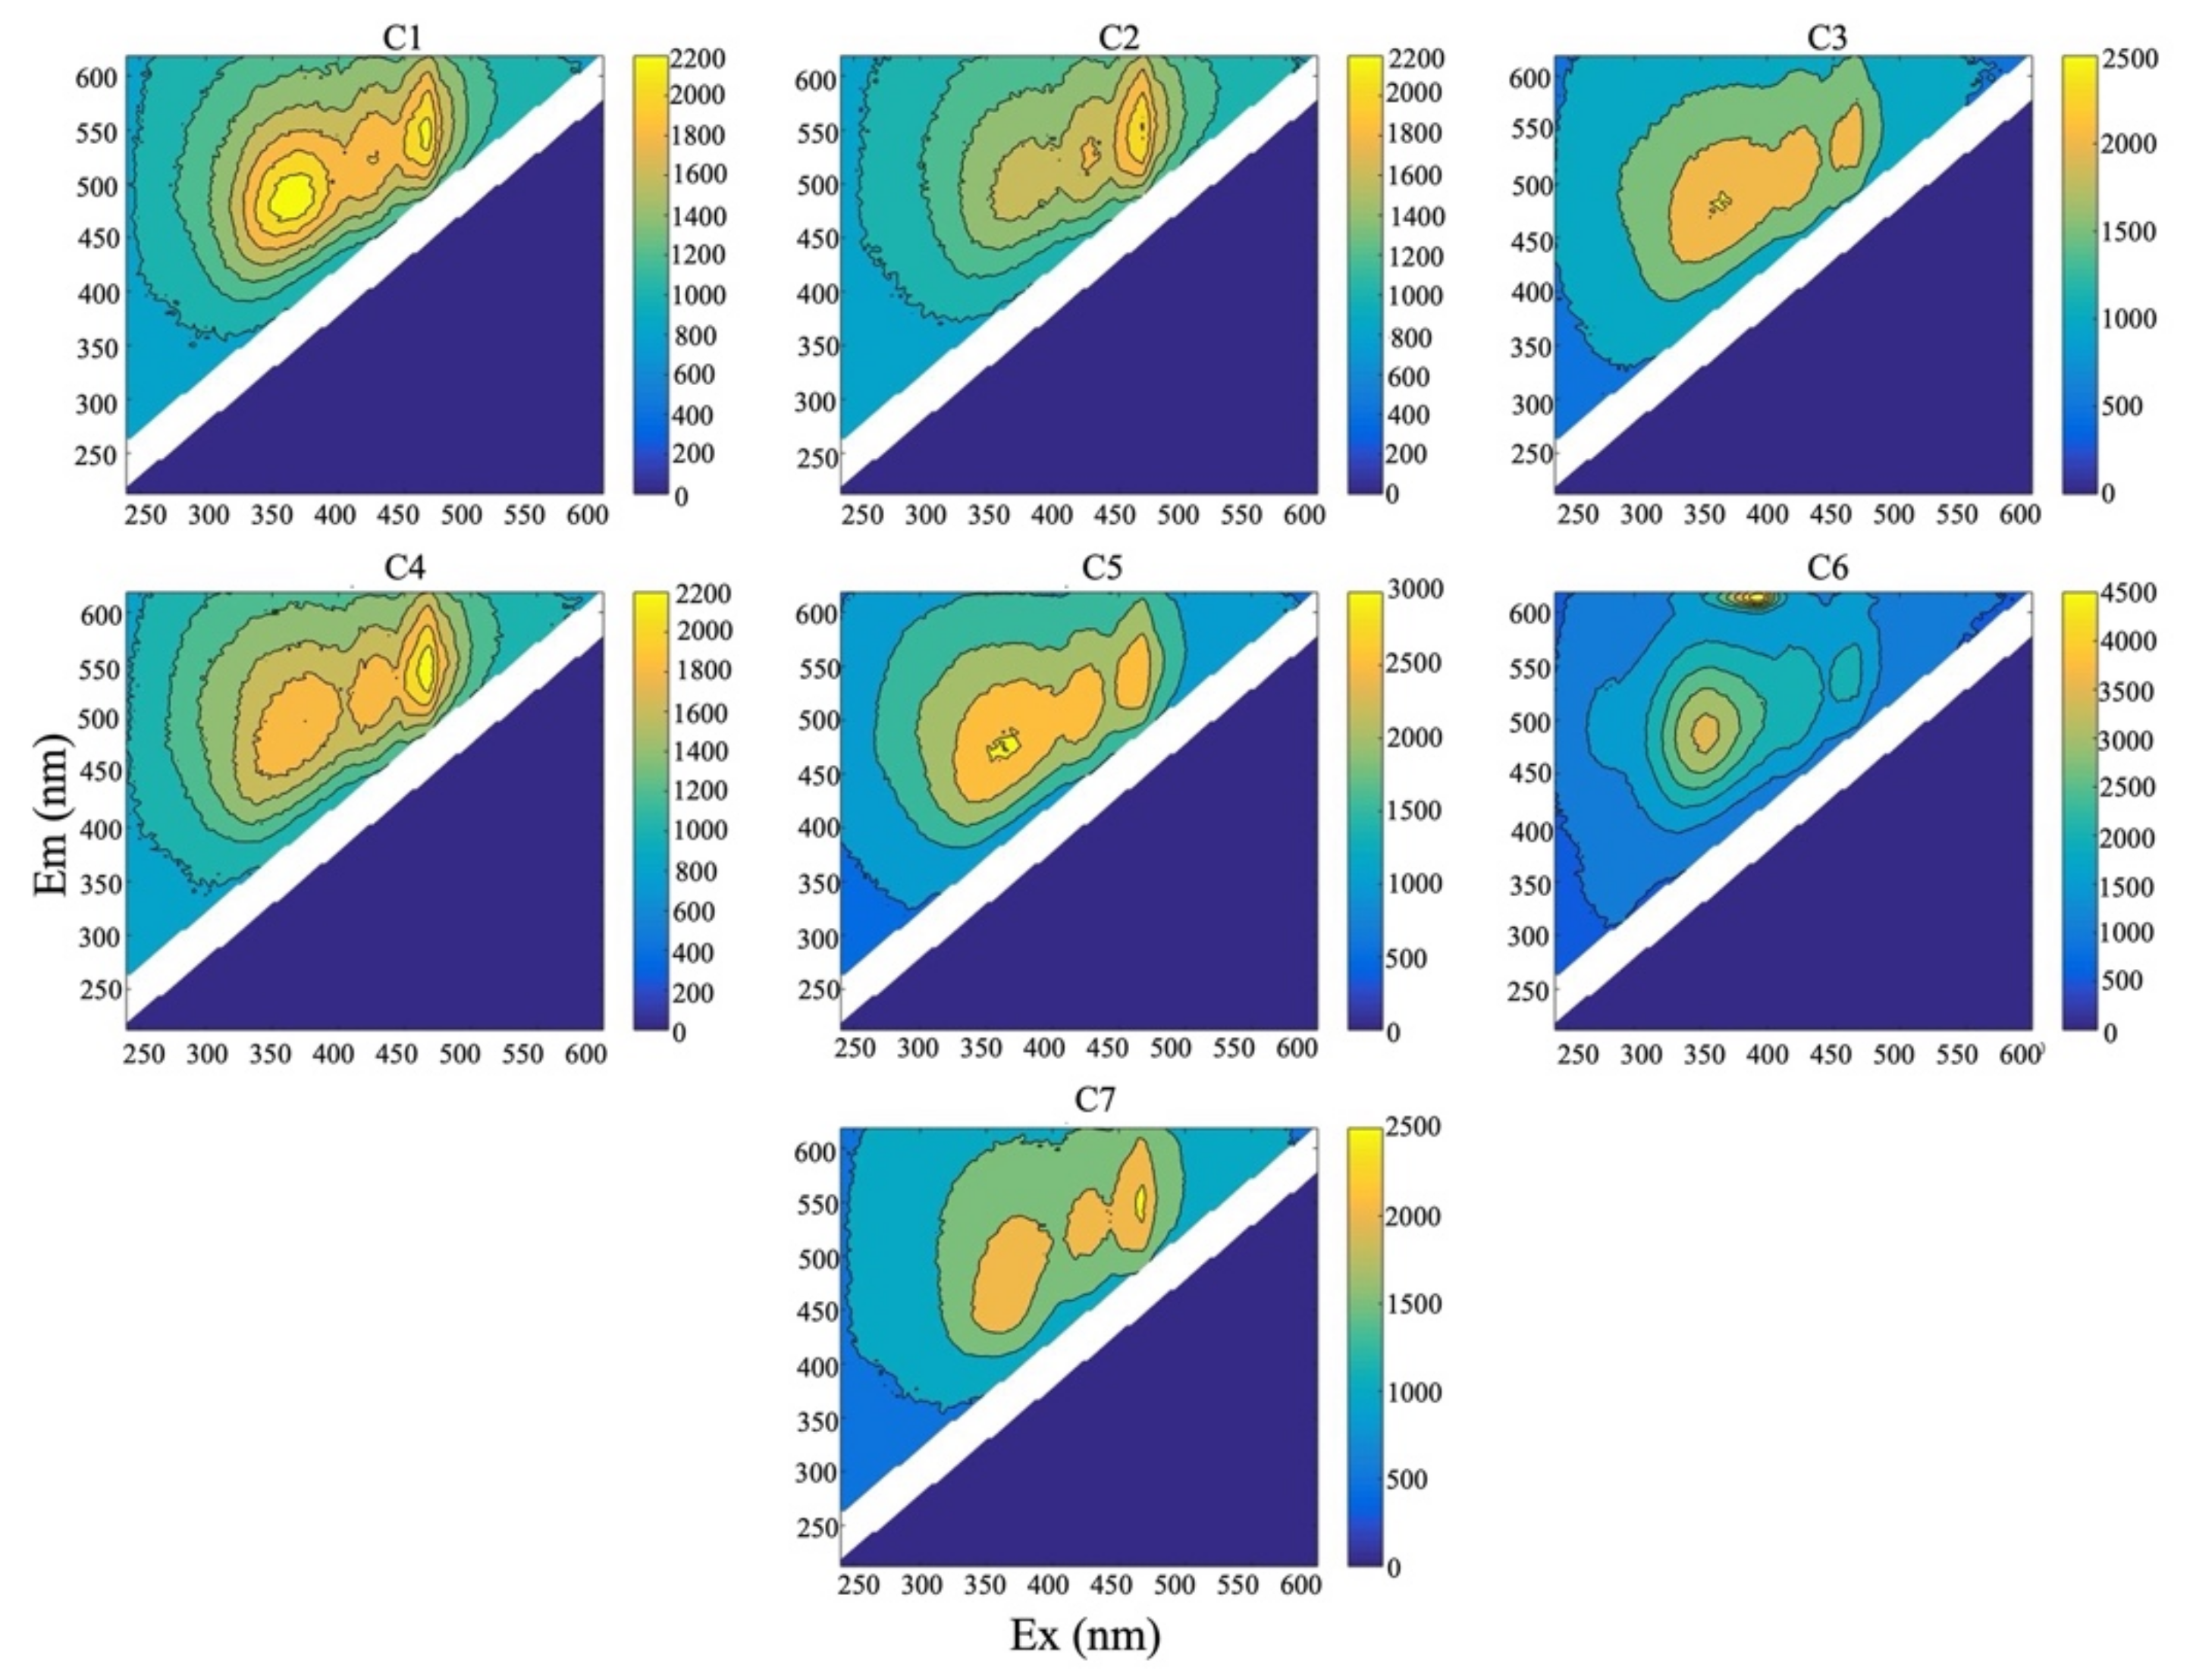
The compost EEM fluorescence spectra for FA and HA are shown in Figure 3 and Figure 4. All samples exhibited one FA peak at Ex/Em 340–350/440–450 nm, which is related to the FA visible area and associated with polysaccharides. A very small peak was present at Ex/Em 420–450/520–550 nm, representing condensed aromatic structures [44,45].
Other fractions of humic material, such as HAs, have different compositions and dominant peaks in the EEM. Common peaks vary only by dominant peak and relative height for HA, and they include Ex/Em 350–380/470–510, 430/520, and 460–470/540–560 nm. The peak Ex/Em 350–380/470–510 nm is associated with HA-like substances, which form during the humification of composting organic matter [46]. This peak dominated in samples C1, C2, and C5 and was the second largest peak in samples C4 and C6. Similar to FA, the EEM for HA was Ex/Em 430/520 nm peaks, associated with the degradation and condensation of organic material. Ex/Em 460–470/540–560 nm dominated in samples C4, C5, and C7, which probably indicates the presence of lignin from structural amendments (shredded wood, straw, paper). Treatment C6 differed from other samples, with the core of HA peaking at Ex/Em 370–410/610–630 nm. The origin of these compounds could be fresh plants and fruits added to compost and characterized by low degradation rates and chlorophyll [47].
Figure 5 illustrates the comparative evaluation of studied composts, considering both nutrient and HS indicators. On the PCA biplot, composts C1, C5, and C7 group together, mainly due to low HSs, while C3 shows elevated HSs and P, and C6 is rich in P and N with average HSs.
4. Discussion
The selected composts varied in input material, selection of treatment, and the active composting time (d). These features are known to affect the concentration and type of HSs in the final product [25,48,49].
In the treatment of organic waste, the concentration of humus-like substances and the degree of humification of hydrophilic components increases, and the structure of the substance becomes more stable [50]. HSs are biostimulants that enhance nutrition efficiency, abiotic stress tolerance, and/or crop quality traits [9,51]. All compost treatments in the present study contained HSs, including HA and FA. While all treatments presented an FA peak for polysaccharides, they differed more relative to the HA peak, showing that input materials directly influence the core structure of HA in mature compost. As shown previously, various input materials contain different amounts of basic components that form HSs [25,50]. Organic waste, rich in polyphenols, amino acids, and reducing sugars can promote overall HS production [52].
During composting, the concentration of FAs decreased, whereas the concentration of HAs increases. HAs are generated in the last stage of composting; thus, an increased concentration of HAs indicates a higher maturity of the compost. Compost is considered mature if the HA/FA ratio is higher than 1 [15,25,53,54], and the HA/FA ratio is also affected by the type of organic material. For example, the lowest HA/FA was in treatment C5, which contained a high quantity of food waste. Amino acids and sugars, e.g., polysaccharides, break down easily and are first to form FA, and then HA [55]. The highest HA/FA ratio was in treatment C2. After fermentation in animal guts, horse manure contained a high proportion of lignin from hay and grass, aromatic compounds, and older material. Lignin and aromatic compound remnants could be the core of the initial HA, and less FAs are formed [23,26].
The chemical structures of HSs were similar in the compost treatments. As shown previously, the UV–Vis spectra of hydrophilic components decreased monotonically, and the observed spectra were typical of aromatic or unsaturated compounds, such as the conjugation of quinones and ketones [50,56].
Treatments C1, C2, and C5, which contained different ABPRs (e.g., fish waste, horse manure, chicken body parts), had a dominant HA peak, reflecting the HA-like substances formed during humification. ABPRs are rich in nutrients and add microorganisms to the composting mixture. In addition to the source materials, the content of HSs depends on the amounts of nutrients (e.g., C, N) and the presence of microorganisms [57]. Humification is more intense and achieved more quickly if composting piles are inoculated with microorganisms. Composts inoculated with microorganisms stimulated the degradation of hemicellulose, cellulose, and lignin by 28%, 21%, and 25%, respectively [58]. The greater the amount of amino acids and reducing sugars produced during degradation, the higher the positive effect on HS synthesis [52].
Treatments C4, C5, and C7 had a dominant peak in the area representing lignin-like structures. These treatments contained large quantities of green waste (e.g., branches, leaves), shredded wood, straw, and paper, which are rich in cellulose and lignin. Selected bulking material affects the composting duration and product quality, as material rich in cellulose and lignin can influence the humification process [25]. These kind of materials decompose more slowly; therefore, they can slow down composting processes and humification [59].
Treatment C6 differed from other composts made from more traditional composting technologies. C6 contained frass from H. illucens larvae activity, as well as from chitin and food residues during feeding, and the core structure of HA differed compared to other treatments. Although H. illucens larvae frass can be used as an organic fertilizer, the fresh frass might have contained phytotoxins, which decrease plant growth [60]. To increase the concentration of HA and the stability of the frass, it is suggested to post-compost the frass [60,61].
It has been shown, that H. illucens treatment can increase the HA/FA ratio and improve humification [62]. Compared to other treatments, C6 had the lowest E4/E6 ratio, indicating a more advanced humification. However, the HA/FA ratio was quite low, reflecting a high FA concentration. H. illucens can also suppress pathogens and is therefore suitable for processing manure in addition to food waste [60,63].
The highest aromaticity was in compost C7, indicating that by vermicomposting, HA is a more aggregated macromolecule with a more incomplete humification processes [64]. However, it has been proposed that there is no direct relationship between aromaticity and humification, and vermicompost can be used as a soil improver [50].
The quality of composts is reflected by the content of both HSs and nutrients. Although some composts may have a lower nutrient concentration, they may still be a valuable source of HSs. The total value of compost is thus reflected by the nutrient content, the disclosure of which is currently required by regulations (Appendix A) [9,13]. Depending on the main purpose of compost application, the effects of added nutrients or added HSs can be the primary advantage of using compost. Including HS data for composts yields a better comprehensive evaluation. Composts C2 and C4 were grouped together on the PCA bioplot, considering only their nutrient content, but elevated HSs in compost C2 signified an advantage over C4 (Figure 5). Composts with a high proportion of HSs, but a relatively low nutrient content, can provide a maximum fertilizing effect when used together with mineral fertilizers. Thus, soil health and nutrient content are ensured to improve crop yield [65,66].
Although different treatments varied in HS concentrations, both HA and FA act as biostimulants and promote plant growth [67,68]. Compared to chemical fertilizers, composts increase the content of soil-available nitrogen (N) and soil organic carbon (SOC) and improve soil fertility [69]. Furthermore, using composts can decrease eutrophication risks caused by the excessive use of chemical fertilizers and the subsequent discharge into surface waters [25]. Because all composts included HSs, their use provides an advantage over using mineral fertilizers alone.
5. Conclusions
A variety of organic materials can be processed with different treatments (windrow composting, insect frass formation, vermicomposting, etc.) and durations, which all influence the properties of the final product. The present research indicates that, regardless of the input organic waste and composting technology, all studied organic fertilizers are a valuable source of HSs, including HA and FA. The presence of HSs is an advantage over mineral fertilizers alone. All samples exhibited a fluorescence EEM peak of FA associated with polysaccharides. The HA peak dominated in composts comprised of animal by-products, such as fish waste, horse manure, and kitchen biowaste. The core structure of humic acids in H. illucens larvae frass differed from other treatments.
Compost quality was assessed commercially by nutrient content and contamination criteria, without considering HSs. To improve soil health and fertility, the concentration and characteristics of HSs could serve as a comprehensive indicator for compost quality evaluation. While HSs act as important biostimulants, their presence and features affect compost’s fertilizing value. In the present study, we showed the importance of HS content and properties in a comprehensive evaluation of compost quality.
Author Contributions
Conceptualization, M.L., M.K. (Maris Klavins), O.P., M.S., A.K. and M.K. (Mait Kriipsalu); methodology, M.K. (Maris Klavins) and O.P.; software, O.P.; validation, M.K. (Maris Klavins) and O.P.; formal analysis, O.P.; investigation, M.K. (Maris Klavins) and O.P.; resources, M.K. (Maris Klavins), M.S. and M.K. (Mait Kriipsalu); data curation, M.L. and O.P.; writing—original draft preparation, M.L. and M.K. (Mait Kriipsalu); writing—review and editing, O.P., M.S., A.K. and M.K. (Mait Kriipsalu); visualization, M.L. and O.P.; supervision, M.K. (Mait Kriipsalu); project administration, M.K. (Mait Kriipsalu); funding acquisition, M.K. (Mait Kriipsalu). All authors have read and agreed to the published version of the manuscript.
Funding
This research was funded by the Estonian University of Life Sciences project PM180261MIMV “From bio-waste to high value-added products”, the European Regional Development Fund under project number 1.1.1.2/VIAA/1/16/001, post-doctoral research project number 1.1.1.2/VIAA/4/20/723 and the Doctoral School of Earth Sciences and Ecology, supported by the European Union, European Regional Development Fund (Estonian University of Life Sciences ASTRA project “Value-chain based bio-economy“).
Institutional Review Board Statement
Not applicable.
Data Availability Statement
Data is available upon request from corresponding author M.L.
Acknowledgments
We would like to thank Mark J. McCarthy for language editing and Jordi Escuer Gatius for contributing to data visualization.
Conflicts of Interest
The authors declare no conflict of interest.
Appendix A

Table A1.
“Indicators to be measured and presented.“ from the Regulation of the Republic of Estonia. “Requirements for production of compost from biodegradable waste” RT I, 18.12.2020, 23 2021. issued by the Minister of the Environment.
Table A1.
“Indicators to be measured and presented.“ from the Regulation of the Republic of Estonia. “Requirements for production of compost from biodegradable waste” RT I, 18.12.2020, 23 2021. issued by the Minister of the Environment.
| Indicator | Parameter | Measurement Unit | Assessment Result |
|---|---|---|---|
| Improvement of soil qualities | Organic substance (OM) | [% in dry matter] | ≥15% presentation |
| Fertilising qualities | Total nitrogen (N) | [% in dry matter] | presentation |
| Total phosphorus (P) | [% in dry matter] | presentation | |
| Total potassium (K) | [% in dry matter] | presentation | |
| Material qualities | Maximum size of particles | [mm] | presentation |
| Overall density | [g/L] | presentation | |
| Water content | [g/L] | ||
| Salinity/conductivity | [mS/m] | presentation | |
| pH value | presentation |
References
- Kaza, S.; Yao, L.; Bhada-Tata, P.; Van Woerden, F. What a Waste 2.0: A Global Snapshot of Solid Waste Management to 2050; World Bank Publications: Washington, DC, USA, 2018. [Google Scholar]
- Interreg Europe. The Biowaste Management Challenge. A Policy Brief from the Policy Learning Platform on Environment and Resource Efficiency 2021; Interreg Europe: Lille, France, 2021. [Google Scholar]
- Ministry of the Environment Estonian National Waste Management Plan. Riigi Jäätmekava 2014–2020 (Pikendatud Kuni 2022 Lõpuni); Ministry of the Environment Estonian: Tallinn, Estonia, 2014; p. 94. [Google Scholar]
- Nanda, S.; Berruti, F. Municipal Solid Waste Management and Landfilling Technologies: A Review. Environ. Chem. Lett. 2021, 19, 1433–1456. [Google Scholar] [CrossRef]
- European Parliament Directive (EU). 2018/850 of the European Parliament and of the Council of 30 May 2018 amending Directive 1999/31/EC on the Landfill of Waste (Text with EEA Relevance) 2018; European Parliament Directive (EU): Strasbourg, France, 2018. [Google Scholar]
- European Parliament Directive (EU). 2018/851 of the European Parliament and of the Council of 30 May 2018 amending Directive 2008/98/EC on Waste (Text with EEA Relevance) 2018; European Parliament Directive (EU): Strasbourg, France, 2018. [Google Scholar]
- Smol, M. Transition to Circular Economy in the Fertilizer Sector—Analysis of Recommended Directions and End-Users’ Perception of Waste-Based Products in Poland. Energies 2021, 14, 4312. [Google Scholar] [CrossRef]
- The European Green Deal. European Comission Communication from the Commission to the European Parliament, the European Council, the Council, The European Economic and Social Committee and the Committee of the Regions; The European Green Deal: Brussels, Belgium, 2019. [Google Scholar]
- European Parliament Regulation (EU). 2019/1009 of the European Parliament and of the Council of 5 June 2019 Laying down Rules on the Making Available on the Market of EU Fertilising Products and Amending Regulations (EC) No 1069/2009 and (EC) No 1107/2009 and repealing Regulation (EC) No 2003/2003 2019; European Parliament Directive (EU): Strasbourg, France, 2019. [Google Scholar]
- Lanno, M.; Kriipsalu, M.; Shanskiy, M.; Silm, M.; Kisand, A. Distribution of Phosphorus Forms Depends on Compost Source Material. Resources 2021, 10, 102. [Google Scholar] [CrossRef]
- Wei, Y.; Zhao, Y.; Xi, B.; Wei, Z.; Li, X.; Cao, Z. Changes in Phosphorus Fractions during Organic Wastes Composting from Different Sources. Bioresour. Technol. 2015, 189, 349–356. [Google Scholar] [CrossRef] [PubMed]
- Siebert, S. Quality Requirements and Quality Assurance of Digestion Residuals in Germany; Bundesgütegemeinschaft Kompost t e.V.: Nuremberg, Germany, 2008. [Google Scholar]
- Siebert, S.; Auweele, W.V. ECN-Qas European Quality Assurance Scheme for Compost and Digestate; Quality Manual; European Compost Network ECN e.V.: Bochum, Germany, 2014; ISBN 978-3-00-047599-3. [Google Scholar]
- Bhattacharya, S.S.; Kim, K.-H.; Das, S.; Uchimiya, M.; Jeon, B.H.; Kwon, E.; Szulejko, J.E. A Review on the Role of Organic Inputs in Maintaining the Soil Carbon Pool of the Terrestrial Ecosystem. J. Environ. Manage. 2016, 167, 214–227. [Google Scholar] [CrossRef]
- Ben Mbarek, H.; Ben Mahmoud, I.; Chaker, R.; Rigane, H.; Maktouf, S.; Arous, A.; Soua, N.; Khlifi, M.; Gargouri, K. Change of Soil Quality Based on Humic Acid with Date Palm Compost Incorporation. Int. J. Recycl. Org. Waste Agric. 2019, 8, 317–324. [Google Scholar] [CrossRef] [Green Version]
- European Commission; European Environment Agency. The State of Soil in Europe: A Contribution of the JRC to the European Environment Agency’s Environment State and Outlook Report—SOER 2010; Publications Office of the European Union: Luxembourg, 2012. [Google Scholar]
- Gao, Y.; Gao, X.; Zhang, X. The 2 °C Global Temperature Target and the Evolution of the Long-Term Goal of Addressing Climate Change—From the United Nations Framework Convention on Climate Change to the Paris Agreement. Engineering 2017, 3, 272–278. [Google Scholar] [CrossRef]
- Bot, A.; Benites, J. The Importance of Soil Organic Matter: Key to Drought-Resistant Soil and Sustained Food Production; Food & Agriculture Org.: Rome, Italy, 2005; Volume 80. [Google Scholar]
- Lakhdar, A.; Rabhi, M.; Ghnaya, T.; Montemurro, F.; Jedidi, N.; Abdelly, C. Effectiveness of Compost Use in Salt-Affected Soil. J. Hazard. Mater. 2009, 171, 29–37. [Google Scholar] [CrossRef]
- Nguyen, T.H.; Shindo, H. Quantitative and Qualitative Changes of Humus in Whole Soils and Their Particle Size Fractions as Influenced by Different Levels of Compost Application. Agric. Sci. 2011, 2, 1–8. [Google Scholar] [CrossRef] [Green Version]
- Dou, S.; Shan, J.; Song, X.; Cao, R.; Wu, M.; Li, C.; Guan, S. Are Humic Substances Soil Microbial Residues or Unique Synthesized Compounds? A Perspective on Their Distinctiveness. Pedosphere 2020, 30, 159–167. [Google Scholar] [CrossRef]
- Von Lützow, M.; Kögel-Knabner, I.; Ekschmitt, K.; Flessa, H.; Guggenberger, G.; Matzner, E.; Marschner, B. SOM Fractionation Methods: Relevance to Functional Pools and to Stabilization Mechanisms. Soil Biol. Biochem. 2007, 39, 2183–2207. [Google Scholar] [CrossRef]
- Harrison, R.B. Composting and Formation of Humic Substances; Elsevier Science, Encyclopedia of Ecology: Amsterdam, Netherlands, 2008; pp. 713–719. [Google Scholar]
- Gerke, J. Concepts and Misconceptions of Humic Substances as the Stable Part of Soil Organic Matter: A Review. Agronomy 2018, 8, 76. [Google Scholar] [CrossRef] [Green Version]
- Guo, X.; Liu, H.; Wu, S. Humic Substances Developed during Organic Waste Composting: Formation Mechanisms, Structural Properties, and Agronomic Functions. Sci. Total Environ. 2019, 662, 501–510. [Google Scholar] [CrossRef]
- Zhou, Y.; Selvam, A.; Wong, J.W.C. Evaluation of Humic Substances during Co-Composting of Food Waste, Sawdust and Chinese Medicinal Herbal Residues. Bioresour. Technol. 2014, 168, 229–234. [Google Scholar] [CrossRef]
- Zingaretti, D.; Lombardi, F.; Baciocchi, R. Soluble Organic Substances Extracted from Compost as Amendments for Fenton-like Oxidation of Contaminated Sites. Sci. Total Environ. 2018, 619–620, 1366–1374. [Google Scholar] [CrossRef]
- Minister of the Environment Regulation of the Republic of Estonia. “Requirements for Production of Compost from Biodegradable Waste” RT I, 18.12.2020, 23 2021; Environment Regulation of the Republic of Estionia: Tallinn, Estonia, 2021. [Google Scholar]
- Minister of the Environment Regulation of the Republic of Estonia. Haljastuses, Rekultiveerimisel Ja Põllumajanduses Kasutatava Reoveesette Kvaliteedi Piirväärtused Ning Kasutamise Nõuded. RT I, 06.08.2019, 7 2019; Environment Regulation of the Republic of Estionia: Tallinn, Estonia, 2019. [Google Scholar]
- Lanno, M.; Silm, M.; Shanskiy, M.; Kisand, A.; Orupõld, K.; Kriipsalu, M. Open Windrow Composting of Fish Waste in Estonia. EMU DSpace 2020, 18, 428. [Google Scholar] [CrossRef]
- Khan, M.B.; Cui, X.; Jilani, G.; Tang, L.; Lu, M.; Cao, X.; Sahito, Z.A.; Hamid, Y.; Hussain, B.; Yang, X.; et al. New Insight into the Impact of Biochar during Vermi-Stabilization of Divergent Biowastes: Literature Synthesis and Research Pursuits. Chemosphere 2020, 238, 124679. [Google Scholar] [CrossRef]
- Escuer, O.; Karp, K.; Escuer-Gatius, J.; Raave, H.; Teppand, T.; Shanskiy, M. Hardwood Biochar as an Alternative to Reduce Peat Use for Seed Germination and Growth of Tagetes patula. Acta Agric. Scand. Sect. B Soil Plant Sci. 2021, 71, 408–421. [Google Scholar] [CrossRef]
- Malińska, K.; Zabochnicka-Świątek, M.; Cáceres, R.; Marfà, O. The Effect of Precomposted Sewage Sludge Mixture Amended with Biochar on the Growth and Reproduction of Eisenia Fetida during Laboratory Vermicomposting. Ecol. Eng. 2016, 90, 35–41. [Google Scholar] [CrossRef]
- Egner, H.; Riehm, H.; Domingo, W.R. Investigations on the Chemical Soil Analysis as a Basis for Assessing the Soil Nutrient Status. II: Chemical Extraction Methods for Phosphorus and Potassium Determination. K. Lantbrukshügskolans Ann. 1960, 26, 199–215. [Google Scholar]
- Tan, K.H. Soil Sampling, Preparation, and Analysis; CRC Press: Boca Raton, FL, USA, 1995. [Google Scholar]
- Klavins, M.; Purmalis, O. Properties and Structure of Raised Bog Peat Humic Acids. J. Mol. Struct. 2013, 1050, 103–113. [Google Scholar] [CrossRef]
- Chen, Y.; Senesi, N.; Schnitzer, M. Information Provided on Humic Substances by E4/E6 Ratios. Soil Sci. Soc. Am. J. 1977, 41, 352–358. [Google Scholar] [CrossRef]
- Peuravuori, J.; Pihjala, K. Molecular Size Distribution and Spectroscopic Properties of Aquatic Humic Substances. Anal. Chim. Acta 1997, 337, 133–149. [Google Scholar] [CrossRef]
- Murphy, K.R.; Stedmon, C.A.; Graeber, D.; Bro, R. Fluorescence Spectroscopy and Multi-Way Techniques. PARAFAC Anal. Methods 2013, 5, 6557–6566. [Google Scholar] [CrossRef] [Green Version]
- R Core Team. R: A Language and Environment for Statistical Computing. R Foundation for Statistical Computing; R Core Team: Vienna, Austria, 2020. [Google Scholar]
- Mendiburu, F.D. Agricolae: Statistical Procedures for Agricultural Research, R Package Version 1.2-3. 2015. Available online: http://cran.r-project.org/package=agricolae (accessed on 3 October 2022).
- Minero, C.; Lauri, V.; Falletti, G.; Maurino, V.; Pelizzetti, E.; Vione, D. Spectrophotometric Characterisation of Surface Lakewater Samples: Implications for the Quantification of Nitrate and the Properties of Dissolved Organic Matter. Ann. Chim. 2007, 97, 1107–1116. [Google Scholar] [CrossRef]
- Verillo, M.; Salzano, M.; Cozzolino, V.; Spaccini, R.; Piccolo, A. Bioactivity and Antimicrobial Properties of Chemically Characterized Compost Teas from Different Green Composts. Waste Manag. 2021, 120, 98–107. [Google Scholar] [CrossRef]
- Wei, Z.; Zhao, X.; Zhu, C.; Xi, B.; Zhao, Y.; Yu, X. Assessment of Humification Degree of Dissolved Organic Matter from Different Composts Using Fluorescence Spectroscopy Technology. Chemosphere 2014, 95, 261–267. [Google Scholar] [CrossRef]
- Valencia, S.; Marin, J.M.; Restrepo, G.; Frimmel, F.H. Application of Excitation–Emission Fluorescence Matrices and UV/Vis Absorption to Monitoring the Photocatalytic Degradation of Commercial Humic Acid. Sci. Total Environ. 2013, 442, 207–214. [Google Scholar] [CrossRef]
- Da Silva, L.S.; Constantino, I.C.; Bento, L.R.; Tadini, A.M.; Bisinoti, M.C.; Boscolo, M.; Ferreira, O.P. Humic Extracts from Hydrochar and Amazonian Anthrosol: Molecular Features and Metal Binding Properties Using EEM-PARAFAC and 2D FTIR Correlation Analyses. Chemosphere 2020, 256, 127110. [Google Scholar] [CrossRef]
- Richard, C.; Guyot, G.; Trubetskaya, O.; Grigatti, M.; Cavani, L. Fluorescence Analysis of Humic-Like Substances Extracted from Composts: Influence of Composting Time and Fractionation. Environ. Chem. Lett. 2009, 7, 61–65. [Google Scholar] [CrossRef]
- Liang, J.; Zhao, C.; Cheng, Y.; Lei, T.; Wu, N.; Wang, X.; Xu, X. Dissolved Organic Matter Features in Black Soldier Fly Larvae Frass Derived From Two Types of Meat and Bone Meals with Straw Amendments. Waste Biomass Valorization 2022, 1–12. [Google Scholar] [CrossRef]
- Aguiar, N.O.; Olivares, F.L.; Novotny, E.H.; Dobbss, L.B.; Balmori, D.M.; Santos-Júnior, L.G.; Chagas, J.G.; Façanha, A.R.; Canellas, L.P. Bioactivity of Humic Acids Isolated from Vermicomposts at Different Maturation Stages. Plant Soil 2013, 362, 161–174. [Google Scholar] [CrossRef]
- Dores-Silva, P.R.; Landgraf, M.D.; Rezende, M.O.O. Humification Process in Different Kinds of Organic Residue by Composting and Vermicomposting: Have Microbioreactors Really Accelerated the Process? Environ. Sci. Pollut. Res. 2018, 25, 17490–17498. [Google Scholar] [CrossRef]
- Mosa, A.; Taha, A.; Elsaeid, M. Agro-Environmental Applications of Humic Substances: A Critical Review. Egypt. J. Soil Sci. 2020, 60, 211–229. [Google Scholar] [CrossRef]
- Wu, J.; Zhao, Y.; Qi, H.; Zhao, X.; Yang, T.; Du, Y.; Zhang, H.; Wei, Z. Identifying the Key Factors that Affect the Formation of Humic Substance during Different Materials Composting. Bioresour. Technol. 2017, 244, 1193–1196. [Google Scholar] [CrossRef]
- Raj, D.; Antil, R.S. Evaluation of Maturity and Stability Parameters of Composts Prepared from Agro-Industrial Wastes. Bioresour. Technol. 2011, 102, 2868–2873. [Google Scholar] [CrossRef]
- Silva, M.E.; Lemos, L.T.; Cunha-Queda, A.C.; Nunes, O.C. Co-Composting of Poultry Manure with Low Quantities of Carbon-Rich Materials. Waste Manag. Res. J. Sustain. Circ. Econ. 2009, 27, 119–128. [Google Scholar] [CrossRef]
- Stevenson, F.J. Humus Chemistry: Genesis, Composition, Reactions; John Wiley & Sons: New Jersey, NJ, USA, 1994. [Google Scholar]
- Zilong, Z.; Yu, X. Changes in the Spectral Characteristics of Hydrophilic Fraction in Compost Organic Matter. J. Phys. Conf. Ser. 2021, 2011, 012069. [Google Scholar] [CrossRef]
- Sutton, R.; Sposito, G. Molecular Structure in Soil Humic Substances: The New View. Environ. Sci. Technol. 2005, 39, 9009–9015. [Google Scholar] [CrossRef]
- Jurado, M.M.; Suárez-Estrella, F.; López, M.J.; Vargas-García, M.C.; López-González, J.A.; Moreno, J. Enhanced Turnover of Organic Matter Fractions by Microbial Stimulation during Lignocellulosic Waste Composting. Bioresour. Technol. 2015, 186, 15–24. [Google Scholar] [CrossRef]
- Kulikowska, D.; Sindrewicz, S. Effect of Barley Straw and Coniferous Bark on Humification Process during Sewage Sludge Composting. Waste Manag. 2018, 79, 207–213. [Google Scholar] [CrossRef] [PubMed]
- Lopes, I.G.; Yong, J.W.; Lalander, C. Frass Derived from Black Soldier Fly Larvae Treatment of Biodegradable Wastes. A Critical Review and Future Perspectives. Waste Manag. 2022, 142, 65–76. [Google Scholar] [CrossRef] [PubMed]
- Song, S.; Ee, A.W.L.; Tan, J.K.N.; Cheong, J.C.; Chiam, Z.; Arora, S.; Lam, W.N.; Tan, H.T.W. Upcycling Food Waste Using Black Soldier Fly Larvae: Effects of Further Composting on Frass Quality, Fertilising Effect and Its Global Warming Potential. J. Clean. Prod. 2021, 288, 125664. [Google Scholar] [CrossRef]
- Liu, T.; Awasthi, M.K.; Awasthi, S.K.; Zhang, Y.; Zhang, Z. Impact of the Addition of Black Soldier Fly Larvae on Humification and Speciation of Trace Elements during Manure Composting. Ind. Crops Prod. 2020, 154, 112657. [Google Scholar] [CrossRef]
- Phooi, C.L.; Azman, E.A.; Ismail, R. Do it Yourself: Humic Acid. Pertanika J. Trop. Agric. Sci. 2022, 45, 547–564. [Google Scholar] [CrossRef]
- Campitelli, P.; Ceppi, S. Effects of Composting Technologies on the Chemical and Physicochemical Properties of Humic Acids. Geoderma 2008, 144, 325–333. [Google Scholar] [CrossRef]
- Iqbal, J.; Sarwar, G.; Shah, S.H.; Sabah, N.-U.; Tahir, M.A.; Muhammad, S.; Zeeshan Manzoor, M.; Zafar, A.; Shehzad, I. Evaluating the Combined Effect of Compost and Mineral Fertilizers on Soil Health, Growth and Mineral Acquisition in Maize (Zea mays L.). Pak. J. Bot. 2022, 54, 1793–1801. [Google Scholar] [CrossRef]
- Issoufa, B.B.; Ibrahim, A.; Abaidoo, R.C.; Ewusi-Mensah, N. Combined Use of Millet Glume-Derived Compost and Mineral Fertilizer Enhances Soil Microbial Biomass and Pearl Millet Yields in a Low-Input Millet Cropping System in Niger. Arch. Agron. Soil Sci. 2019, 65, 1107–1119. [Google Scholar] [CrossRef]
- Klavins, M.; Grandovska, S.; Obuka, V.; Ievinsh, G. Comparative Study of Biostimulant Properties of Industrially and Experimentally Produced Humic Substances. Agronomy 2021, 11, 1250. [Google Scholar] [CrossRef]
- Savy, D.; Brostaux, Y.; Cozzolino, V.; Delaplace, P.; Jardin, P.D.; Piccolo, A. Quantitative Structure-Activity Relationship of Humic-Like Biostimulants Derived from Agro-Industrial Byproducts and Energy Crops. Front. Plant Sci. 2020, 11, 581. [Google Scholar] [CrossRef]
- Hu, C.; Xia, X.; Chen, Y.; Han, X. Soil Carbon and Nitrogen Sequestration and Crop Growth as Influenced by Long-Term Application of Effective Microorganism Compost. Chil. J. Agric. Res. 2018, 78, 13–22. [Google Scholar] [CrossRef]
Figure 1.
UV–Vis spectra. Compost labels according to the target waste: C1 fish waste; C2 horse manure; C3 sewage sludge; C4 green waste; C5 kitchen biowaste; C6 H. illucens frass; and C7 vermicompost.
Figure 1.
UV–Vis spectra. Compost labels according to the target waste: C1 fish waste; C2 horse manure; C3 sewage sludge; C4 green waste; C5 kitchen biowaste; C6 H. illucens frass; and C7 vermicompost.
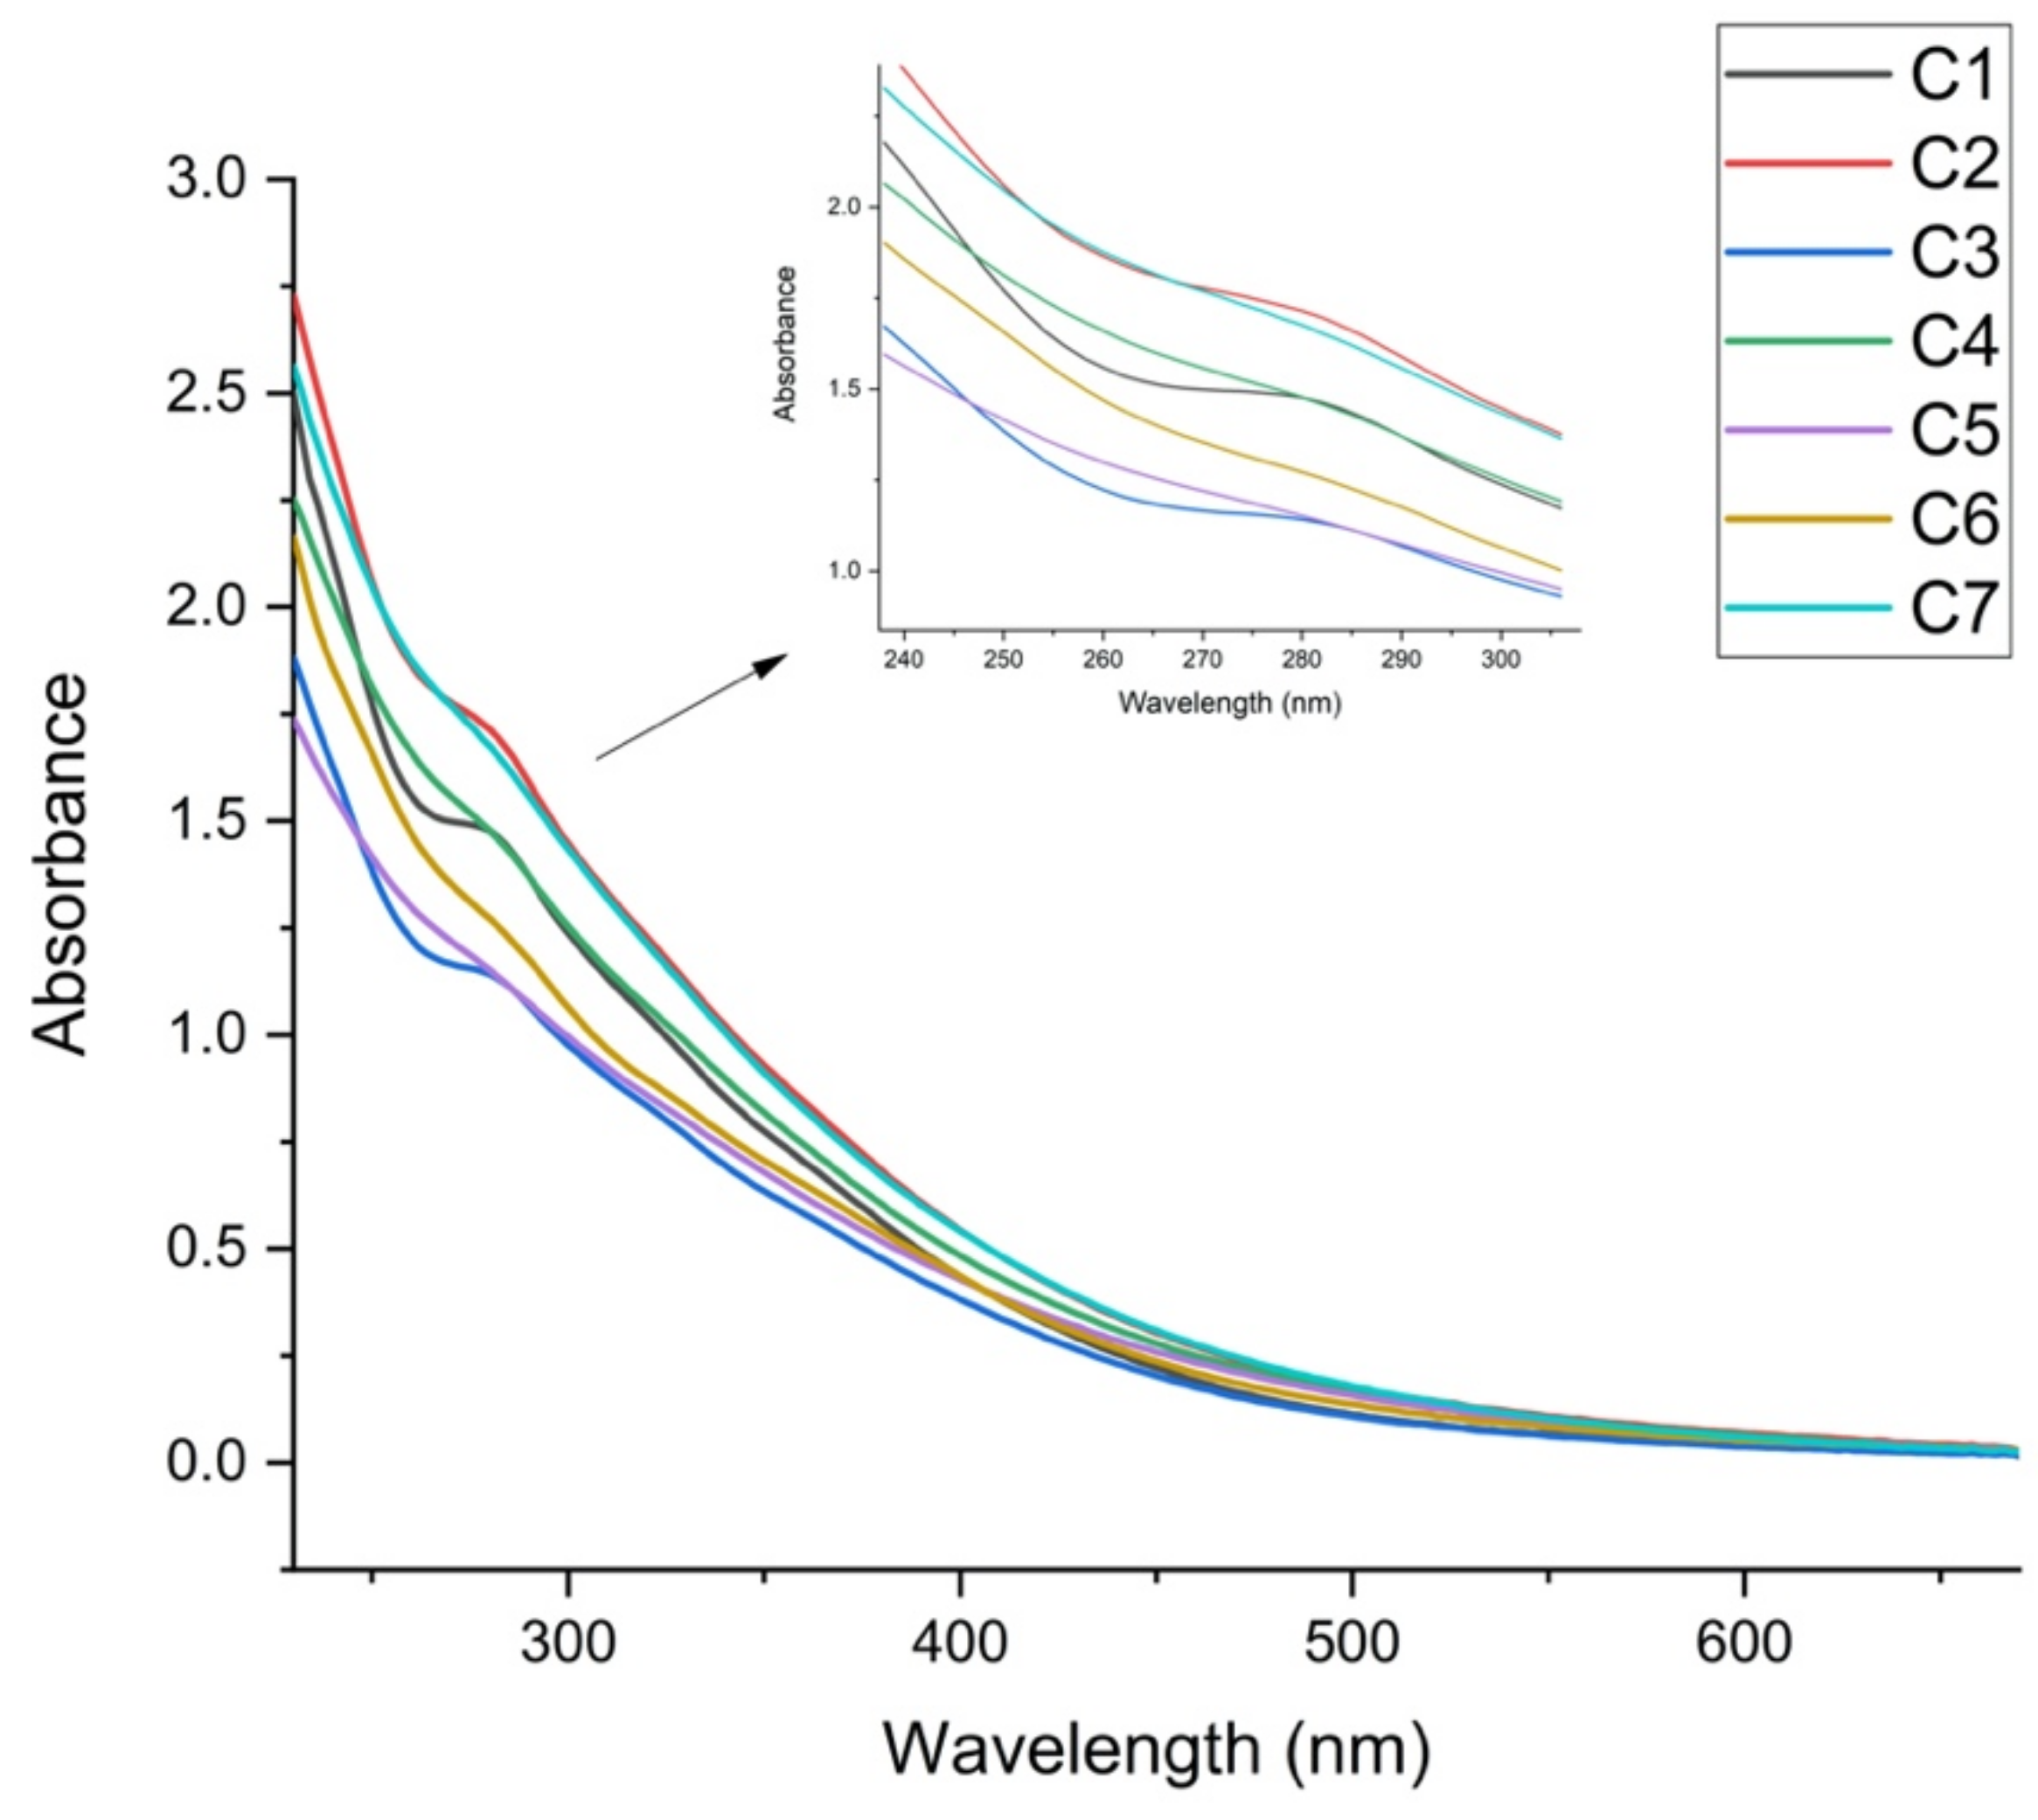
Figure 2.
Fourier-transform infrared (FTIR) spectra of humic acids from compost samples. Compost labels according to the target waste: C1 fish waste; C2 horse manure; C3 sewage sludge; C4 green waste; C5 kitchen biowaste; C6 H. illucens frass; and C7 vermicompost.
Figure 2.
Fourier-transform infrared (FTIR) spectra of humic acids from compost samples. Compost labels according to the target waste: C1 fish waste; C2 horse manure; C3 sewage sludge; C4 green waste; C5 kitchen biowaste; C6 H. illucens frass; and C7 vermicompost.

Figure 3.
Composition of fulvic acids (FAs) for different treatments. Compost labels according to the target waste: (C1) fish waste; (C2) horse manure; (C3) sewage sludge; (C4) green waste; (C5) kitchen biowaste; (C6) H. illucens frass; and (C7) vermicompost. The color scale is presented in relative units.

Figure 4.
Composition of humic acids (HAs) of different treatments. Compost labels according to the target waste: (C1) fish waste; (C2) horse manure; (C3) sewage sludge; (C4) green waste; (C5) kitchen biowaste; (C6) H. illucens frass; and (C7) vermicompost. The color scale is presented in relative units.

Figure 5.
Principal component analysis (PCA) of composts based on nutrient and humic substances’ (HSs) TOC concentrations. Axis 1 explains 48.1% of the variance, and axis 2 explains an additional 25.5% of the variance. Compost labels according to the target waste: C1 fish waste; C2 horse manure; C3 sewage sludge; C4 green waste; C5 kitchen biowaste; C6 H. illucens frass; and C7 vermicompost.
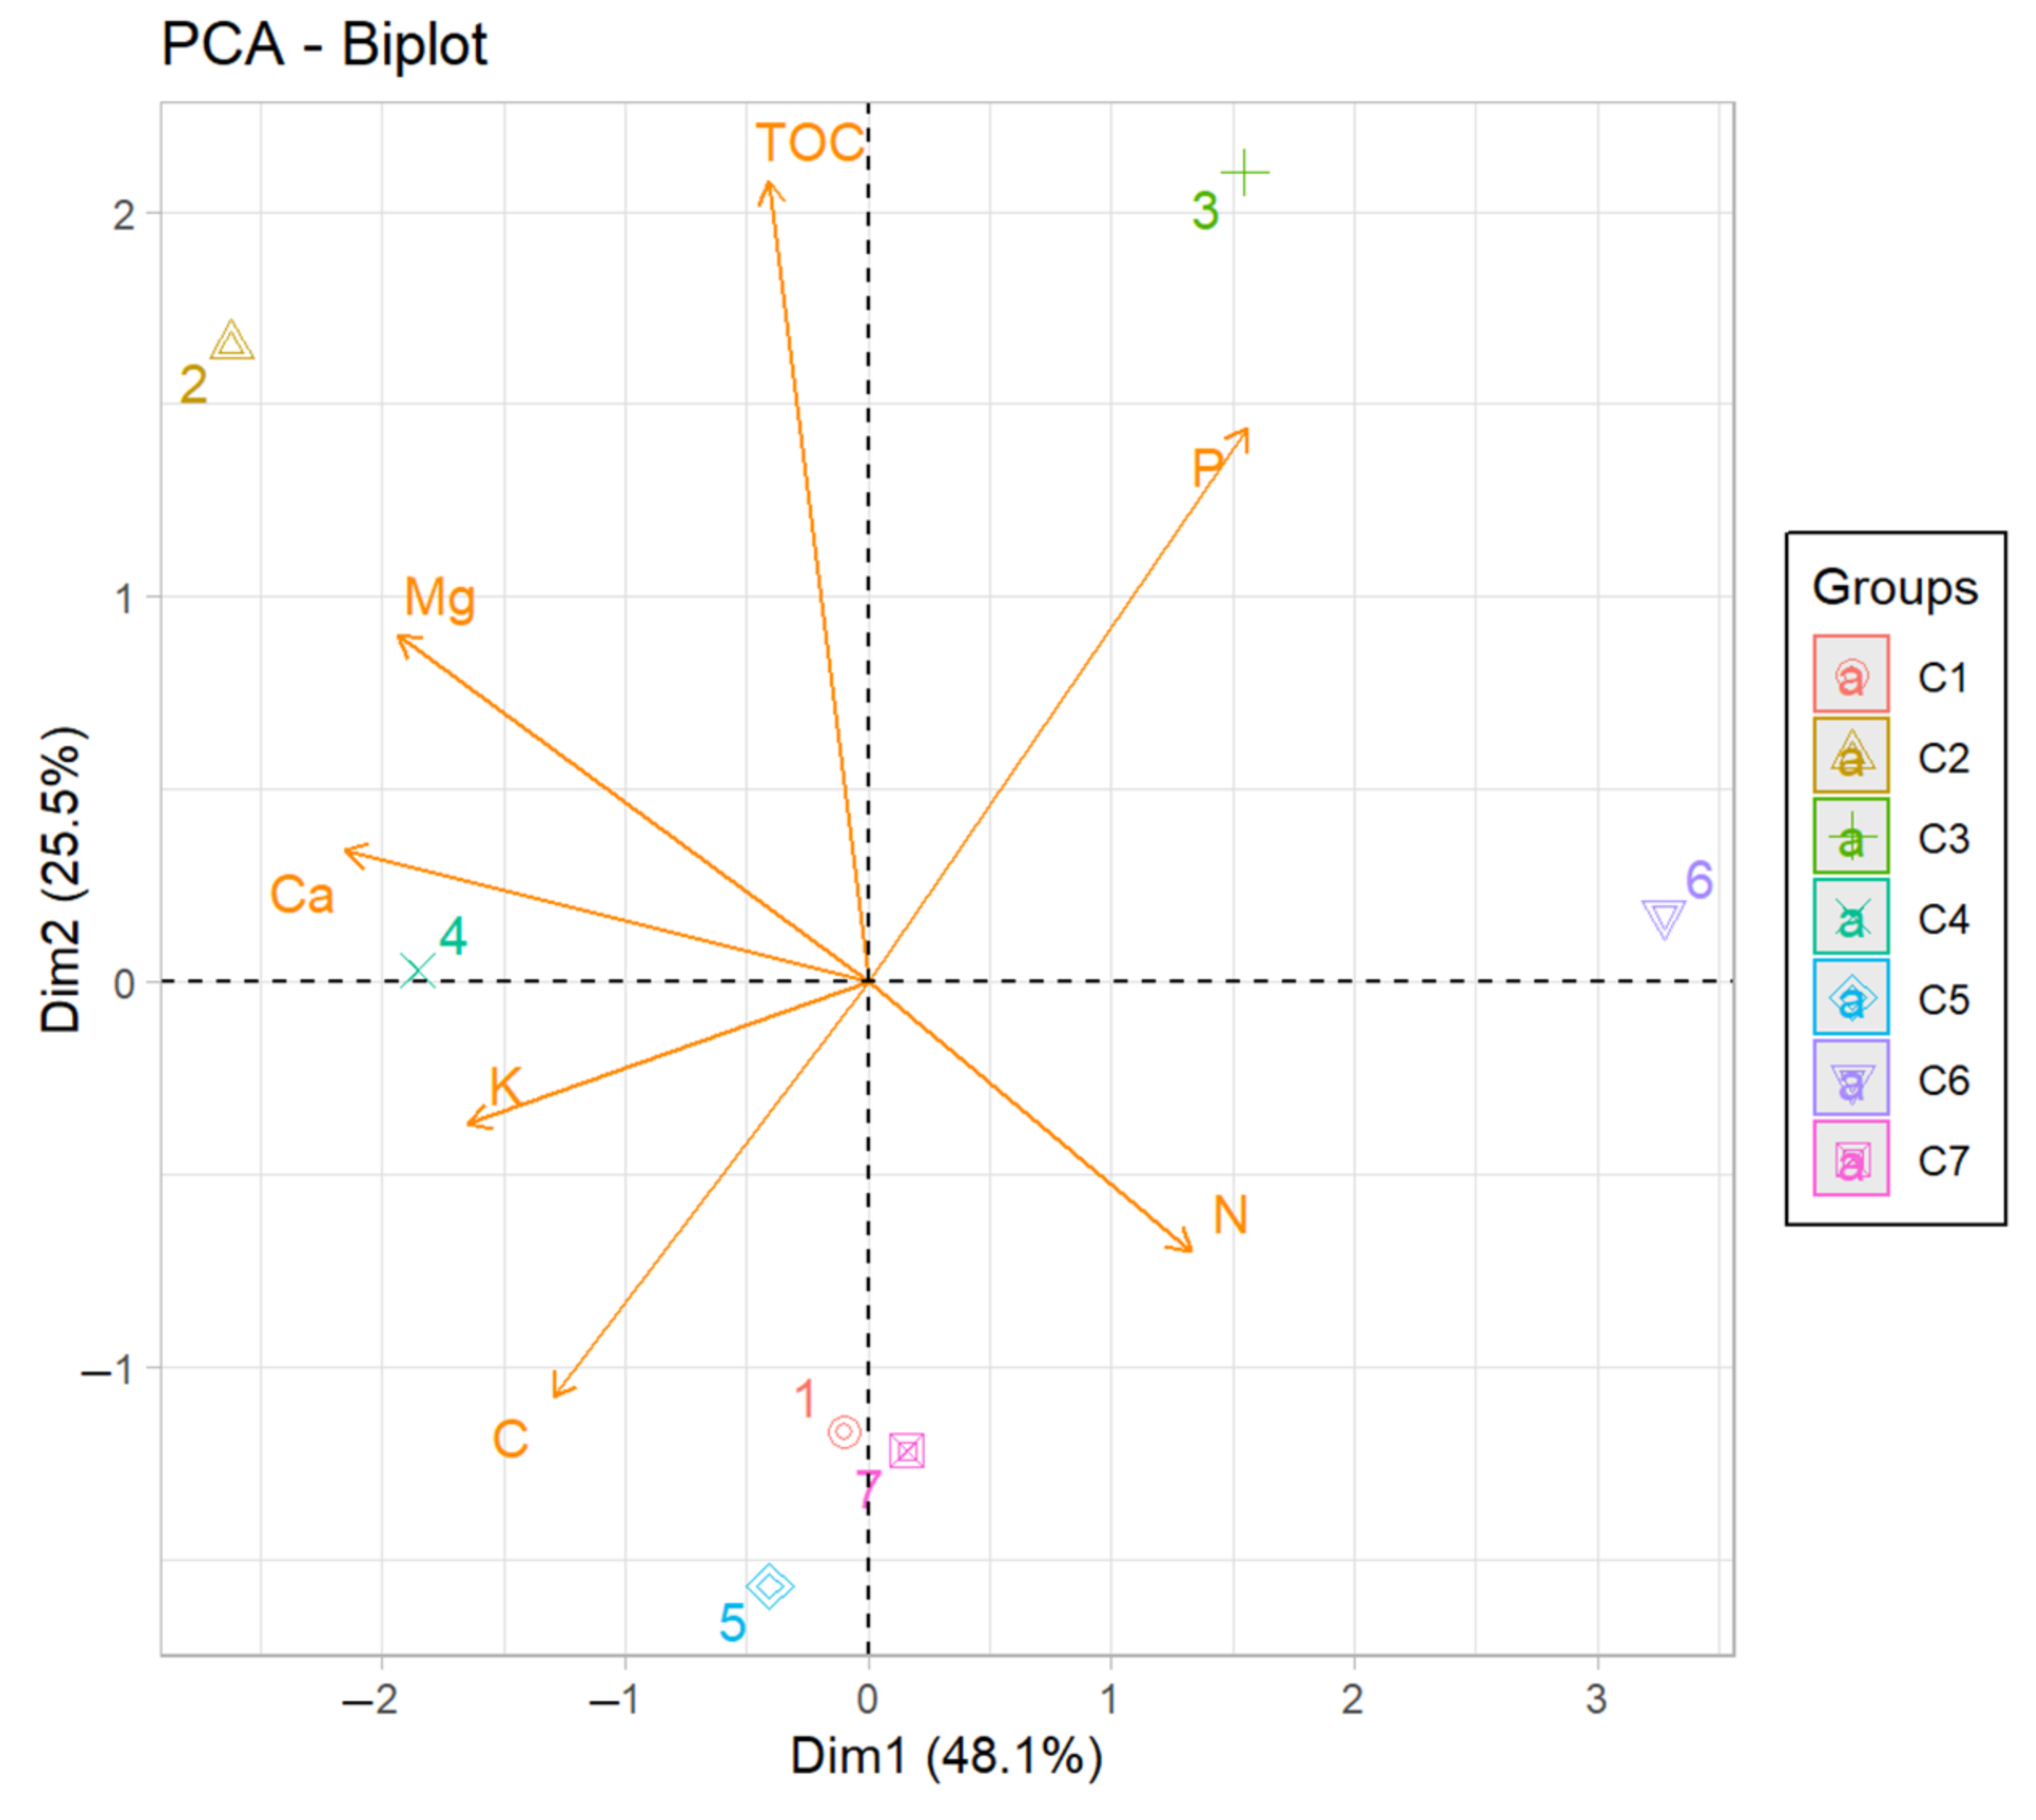
Table 1.
Characterization of composts. The active period (d) indicates the duration that composts C1–C5 were in outdoor windrows, and for C6–C7, the feeding period of H. illucens larvae or E. fetida, respectively.
Table 1.
Characterization of composts. The active period (d) indicates the duration that composts C1–C5 were in outdoor windrows, and for C6–C7, the feeding period of H. illucens larvae or E. fetida, respectively.
| Compost | Target Waste | Amendments | Scale | Certified Quality Regulations | Active Period (d) | Composting Site Location |
|---|---|---|---|---|---|---|
| C1 | Fish waste | Straw, peat, inoculum from previous composts | Industrial | No | 185 | 58°28′41.08″ N 24°49′28.66″ E |
| C2 * | Horse Manure | Straw | Industrial | Yes | 90 | 58°28′41.08″ N 24°49′28.66″ E |
| C3 * | Sewage sludge | Straw | Industrial | Yes | 120 | 58°13′37.89″ N 26°23′10.17″ E |
| C4 * | Green waste from municipal areas | None | Industrial | Yes | >180 | 59°28′14.63″ N 24°54′43.97″ E |
| C5 * | Kitchen Biowaste | Shredded wood | Industrial | Yes | 130 | 59°27′36.08″ N 25°5′17.18″ E |
| C6 | Cafeteria and grocery store biowaste | None | Pilot | No | 51 | 58°23′30.76″ N 26°41′40.43″ E |
| C7 | Kitchen biowaste | Straw, paper, green waste, biochar | Pilot | No | 365 | 58°23′30.76″ N 26°41′40.43″ E |
* Commercially produced compost.
Table 2.
Elemental composition and pH of the composts. Mean ± standard deviation (SD) of triplicate measurements compared using ANOVA with post-hoc Tukey’s HSD test.
Table 2.
Elemental composition and pH of the composts. Mean ± standard deviation (SD) of triplicate measurements compared using ANOVA with post-hoc Tukey’s HSD test.
| Compost | N | C | C/N | Ca | K | Mg | P | pH |
|---|---|---|---|---|---|---|---|---|
| % | ratio | µg/g | ||||||
| C1 | 4.3 ± 0.1 | 65.3 ± 0.3 | 15.19 | 493 ± 8 | 1910 ± 25 | 80 ± 5 | 1469 ± 18 | 5.77 |
| C2 | 4.5 ± 0.1 | 62.7 ± 0.3 | 13.93 | 1472 ± 20 | 4700 ± 30 | 234 ± 5 | 1122 ± 20 | 7.40 |
| C3 | 5.7 ± 01. | 60.5 ± 0.3 | 10.61 | 546 ± 9 | 791 ± 12 | 91 ± 5 | 2782 ± 20 | 6.29 |
| C4 | 3.8 ± 0.1 | 63.2 ± 0.3 | 16.63 | 1224 ± 12 | 4164 ± 30 | 145 ± 5 | 796 ± 12 | 7.80 |
| C5 | 8.6 ± 0.1 | 61.9 ± 0.3 | 7.20 | 947 ± 10 | 6412 ± 35 | 58 ± 5 | 120 ± 8 | 6.85 |
| C6 | 7.9 ± 0.1 | 60.5 ± 0.3 | 7.66 | <32 | 114 ± 8 | <3 | 2432 ± 20 | 8.10 |
| C7 | 6.0 ± 0.1 | 62.8 ± 0.3 | 10.47 | 759 ± 8 | 578 ± 10 | 120 ± 5 | 839 ± 12 | 7.69 |
Table 3.
Characterization of HSs in composts. TOC = total organic carbon in humic substances. TOC and lipids are presented as % of compost dry matter. Mean ± standard deviation (SD) of triplicate measurements compared using ANOVA with post-hoc Tukey’s HSD test. Connecting letters represent significantly different measurements.
| Compost | TOC | HA/FA | E2/E3 | E4/E6 | Lipids |
|---|---|---|---|---|---|
| % | % | ||||
| C1 | 12.0 ± 0.2 a | 5.70 | 2.65 | 7.78 | 1.5 ± 0.1 b |
| C2 | 27.0 ± 0.2 c | 7.88 | 2.57 | 6.95 | 1.5 ± 0.1 b |
| C3 | 25.7 ± 0.2 c | 4.73 | 2.49 | 8.33 | 1.5 ± 0.1 b |
| C4 | 18.0 ± 0.2 ab | 7.82 | 2.56 | 7.34 | 1.7 ± 0.1 b |
| C5 | 15.3 ± 0.2 a | 1.42 | 2.38 | 6.88 | 4.2 ± 0.1 a |
| C6 | 17.1 ± 0.2 a | 1.46 | 2.66 | 6.40 | 2.1 ± 0.1 b |
| C7 | 8.7 ± 0.1 d | 1.60 | 2.61 | 8.59 | 1.4 ± 0.1 b |
Publisher’s Note: MDPI stays neutral with regard to jurisdictional claims in published maps and institutional affiliations. |
© 2022 by the authors. Licensee MDPI, Basel, Switzerland. This article is an open access article distributed under the terms and conditions of the Creative Commons Attribution (CC BY) license (https://creativecommons.org/licenses/by/4.0/).
Share and Cite
MDPI and ACS Style
Lanno, M.; Klavins, M.; Purmalis, O.; Shanskiy, M.; Kisand, A.; Kriipsalu, M. Properties of Humic Substances in Composts Comprised of Different Organic Source Material. Agriculture 2022, 12, 1797. https://doi.org/10.3390/agriculture12111797
AMA Style
Lanno M, Klavins M, Purmalis O, Shanskiy M, Kisand A, Kriipsalu M. Properties of Humic Substances in Composts Comprised of Different Organic Source Material. Agriculture. 2022; 12(11):1797. https://doi.org/10.3390/agriculture12111797
Chicago/Turabian StyleLanno, Marge, Maris Klavins, Oskars Purmalis, Merrit Shanskiy, Anu Kisand, and Mait Kriipsalu. 2022. "Properties of Humic Substances in Composts Comprised of Different Organic Source Material" Agriculture 12, no. 11: 1797. https://doi.org/10.3390/agriculture12111797
Note that from the first issue of 2016, this journal uses article numbers instead of page numbers. See further details here.