1. Introduction
Lack of financial literacy and access remains a major concern in rural Bangladesh. Documented barriers to account ownership include the cost of financial services, documentation requirements that fall hardest on younger adults, and the distance to the nearest branch, alongside a reluctance among older adults to adopt unfamiliar technology (
Rahman et al., 2022). For women in particular, the
World Bank (
2018) documents supply side and social barriers in the mobile financial services market, and many low-income women save through informal collectors rather than through formal accounts (
Women’s World Banking, 2018). As education levels rise and branch networks expand, a demonstration effect is taking hold among neighbours and families. Fintech and internet diffusion have accelerated this shift, and accessible mobile money products are expanding inclusion quickly. Rural demand sits against stubbornly low literacy:
Bangladesh Bank (
2023) estimates 28% nationally, the S&P Global FinLit Survey is 24% for South Asia (
Klapper et al., 2015), and Global Findex 2025 reports 75% account ownership in low- and middle-income countries, with mobile money rising from 1% to 15% of adults worldwide (
World Bank, 2025a).
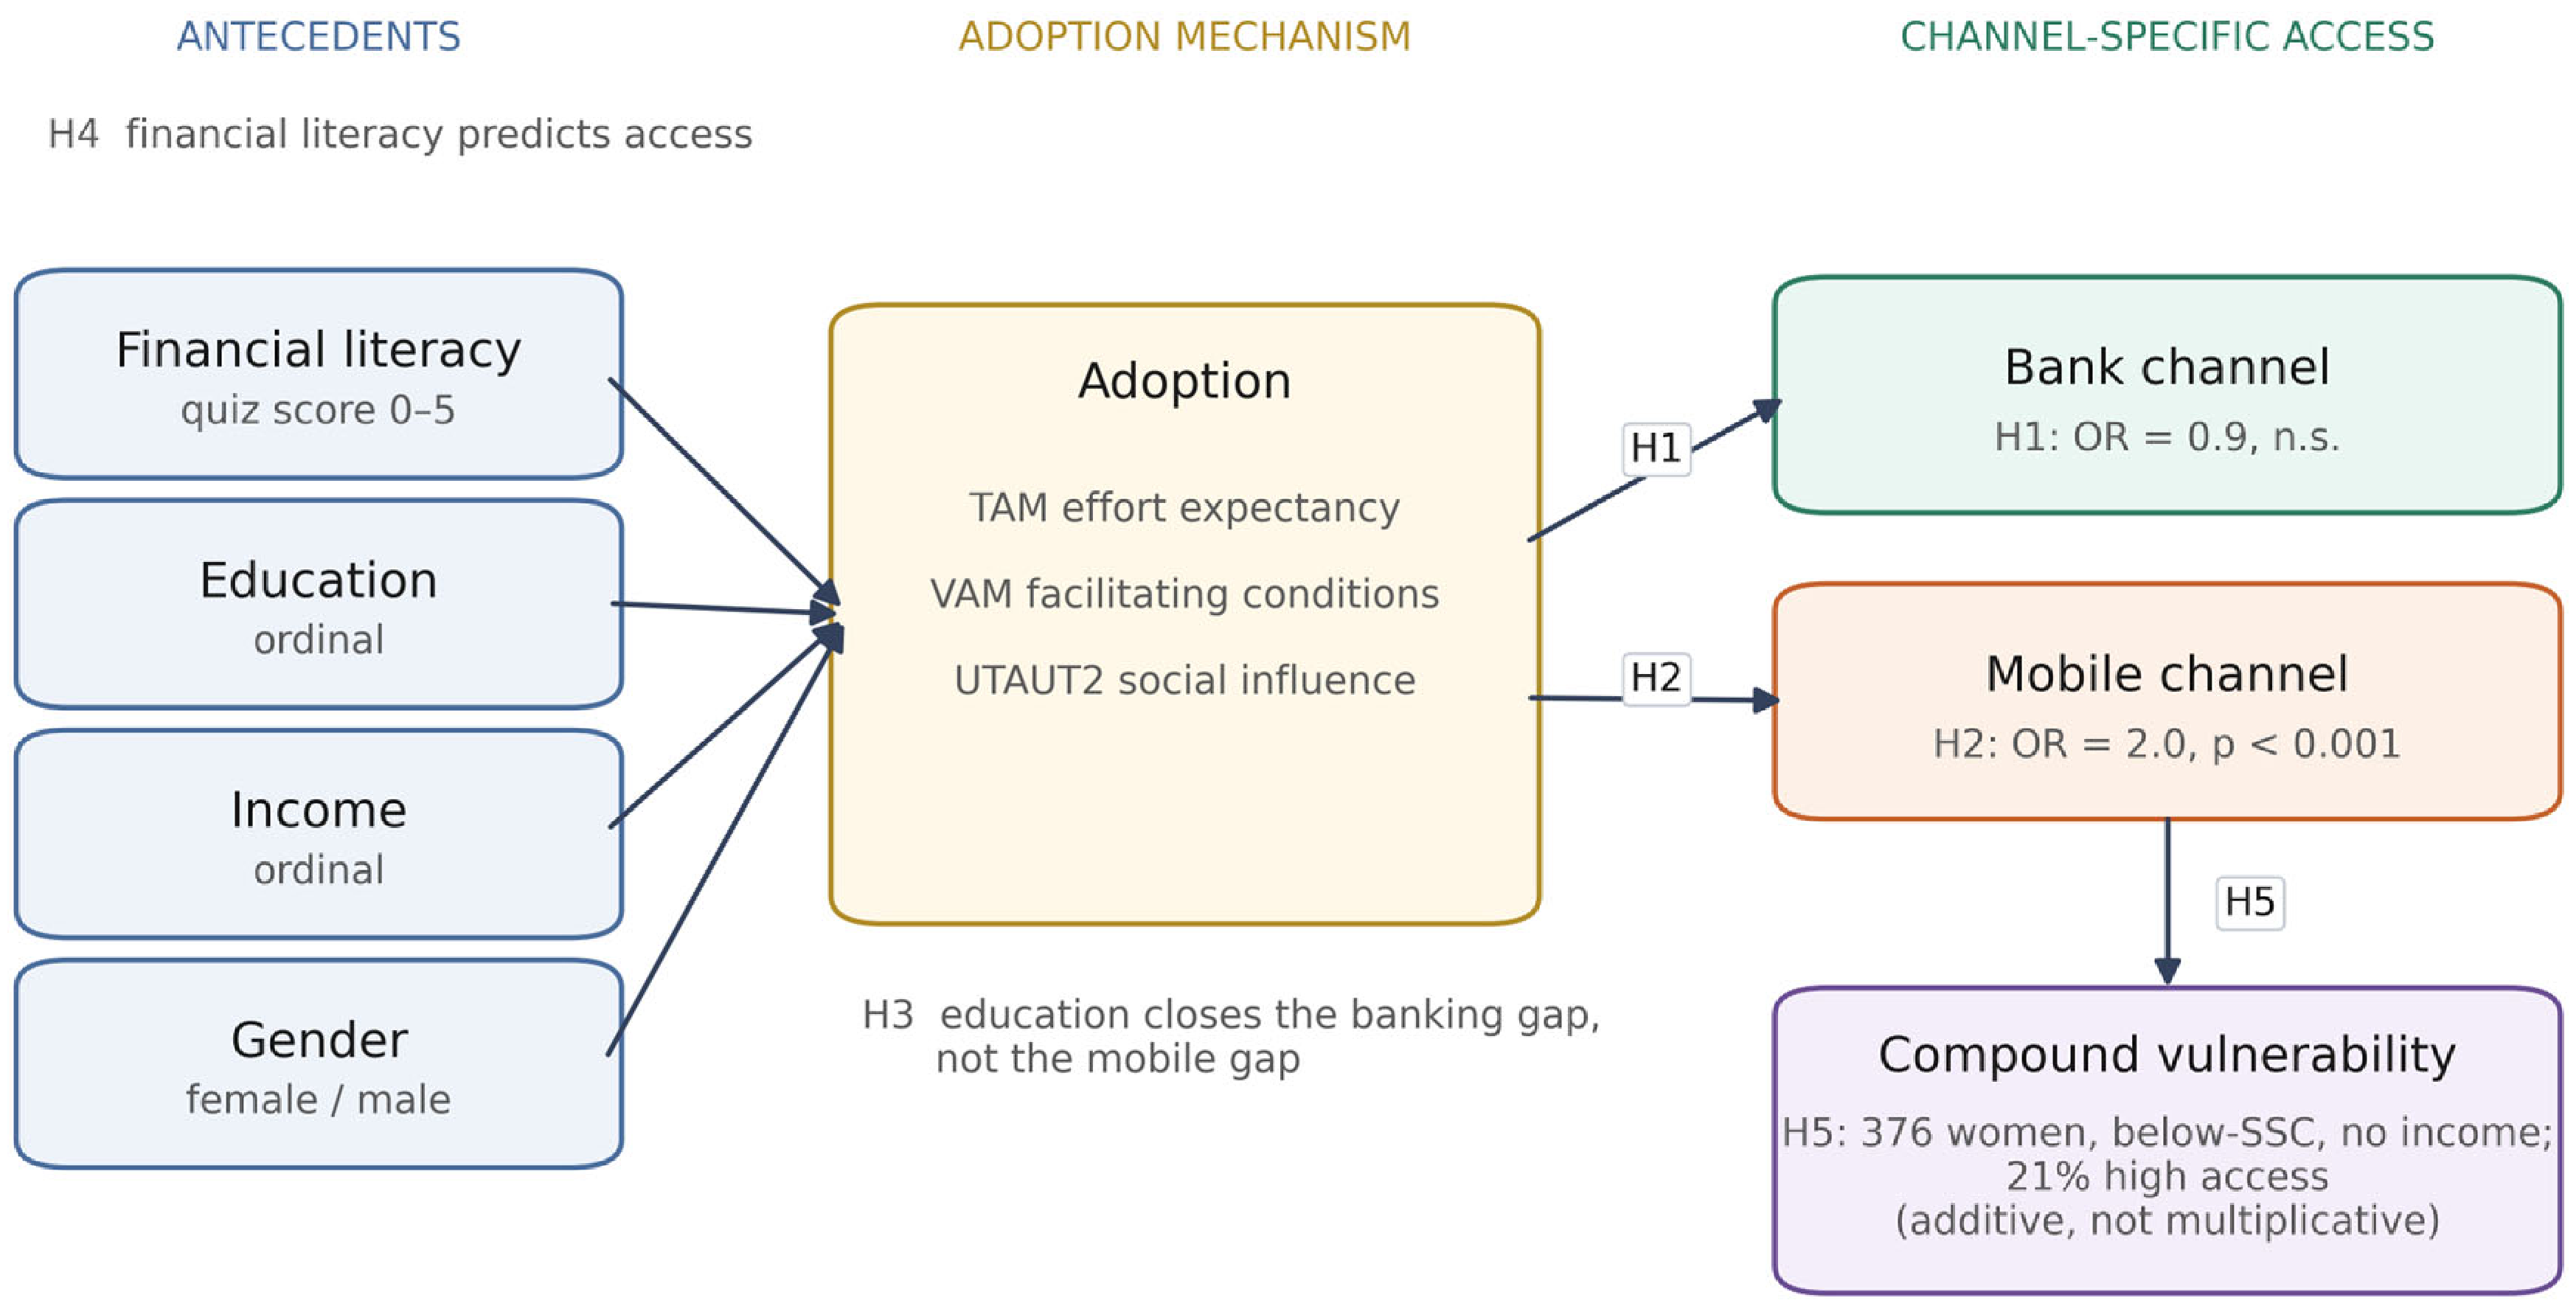
Mobile money is widely seen as the most promising channel where branch infrastructure is thin. We ask a channel-specific question: holding education and income constant, does the gender gap reside in formal banking or in mobile money, and how far below the sample average does access fall where several disadvantages intersect? The expected direction of each result is stated as hypotheses H1 to H5 in
Section 2.5, and the corresponding estimates are reported in
Section 4,
Section 5,
Section 6 and
Section 7.
This question has practical urgency. Global Findex 2025 reports that 79% of adults worldwide now hold accounts, which is up from 51% in 2011 (
World Bank, 2025a), yet ~700 million women remain unbanked (
World Bank, 2025b). Two kinds of bundling can hide reality: bundling people (a single gender main effect averages over advantaged and disadvantaged women) and bundling channels (a composite access score masks heterogeneity). Aggregates built on either bundling can mislead; interventions then reach the already-served.
The Research and Professional Development Centre (RPDC) at Brac University fielded a Financial Literacy and Financial Access Survey in November 2021, shortly after Bangladesh’s second COVID-19 wave and just before the National Financial Inclusion Strategy 2021–2026, covering all eight administrative divisions (
n = 3121) with eight-division stratified quotas.
Rahman et al. (
2022) analysed these data with chi-square and binary logit on a composite outcome. Our contribution is entirely analytical: where they treated factors as independent main effects on a composite, we decompose by channel (bank vs. mobile), preserve the 0–5 ordinal gradient, identify compound vulnerability clusters, run Oaxaca decomposition, and benchmark ML as a diagnostic, methods revealing channel-specific and intersectional structure invisible to a composite model.
We adopt an intersectional lens to test whether disadvantages compound (multiply) or simply concentrate (coexist additively). No single regression distinguishes these, so we combine baseline logit replication, ML diagnostics, ordinal 0–5 modelling, item-level correlations, K-Means clustering (validated with GMM and hierarchical clustering), subgroup cross-tabulations, channel decomposition, and Blinder–Oaxaca analysis.
We make five contributions. First, we test whether the gender gap in access is channel-specific by estimating bank and mobile money outcomes separately rather than averaging them into a composite score. Second, we ask whether disadvantage compounds multiplicatively where gender, education, and income intersect, or whether it concentrates additively, and we identify the segment in which access is lowest. Third, we examine whether education moderates the gap differently across the two channels. Fourth, we use machine learning as a diagnostic for nonlinearity rather than as a predictive instrument, and we report that diagnostic, whatever its outcome. Fifth, we separate the numeracy component of financial literacy from product awareness and ask which of the two carries the association with access. Expected directions are set out as H1 to H5 in
Section 2.5; the estimates themselves are reported in
Section 4,
Section 5,
Section 6 and
Section 7 and discussed in
Section 8.
3. Data and Methodology
3.1. The RPDC Survey
The data come from the Financial Literacy and Financial Access Survey fielded in November 2021 by the RPDC at Brac Business School, timed post-COVID second wave and pre-National Financial Inclusion Strategy 2021–2026, providing a baseline before the strategy period. Responses were collected from 3121 individuals across all eight administrative divisions (Dhaka, Chittagong, Rajshahi, Khulna, Barisal, Sylhet, Rangpur, Mymensingh) using a multi-stage stratified design with quotas for community type (large city, small city, village/rural, Dhaka proper), age, and gender. One respondent identifying as non-binary is excluded from gender-stratified analyses (
Section 5), which compare women and men directly; pooled models retain all 3121 respondents (coded in the non-male reference). We report
n = 3121 pooled and
n = 3120 gender-stratified. Sampling mirrors eight-division stratification used in nationally representative surveys, supporting comparability with Findex (see
Section 3.3 and
Section 5.1).
The sample is 72.8% male and 27.2% female (n = 849 women, including 105 at master’s level) with 71% aged 21–40. The imbalance reflects administration through business-school/professional networks, which skew male; we do not reweight because estimands are conditional relationships (gender gaps across education/income/community), not prevalence; having substantial women at each education level matters more than overall balance, and the smallest female cell (master’s) still holds 105 respondents. Any bias is conservative: our composite gap (11.7 pp) is smaller than the national Findex gap (19 pp), so compound vulnerability patterns are, if anything, understated.
This is the same dataset analysed by
Rahman et al. (
2022), who used chi-square and binary logit on a composite outcome to establish independent main effects. Our incremental contribution is entirely analytical: where they treated factors as independent predictors of a composite, we (i) decompose access by channel (bank vs. mobile), (ii) preserve the ordinal 0–5 gradient, (iii) identify compound vulnerability clusters (C0 etc.), (iv) decompose the gap via Blinder–Oaxaca, and (v) benchmark ML as a diagnostic, revealing channel-specific and intersectional structure invisible to a composite main effects model.
Evolution of the gap (
Section 3.1 continued): To test continuity beyond 2021, we replicate the channel gap in Global Findex 2021 vs. 2024 microdata (740K panel). The mobile money gender gap persists (OR 2.1 → 2.6 holds), which is consistent with
Bangladesh Bank (
2023) MFS expansion to 13 providers, with The Daily Star (
Zaman, 2024) reporting ~22 crore MFS accounts and the Global Findex 2025 recording 15% mobile money coverage in LMICs (
World Bank, 2025a). The pre-NFIS baseline thus shows trend continuity, not a 2021 artefact.
3.2. Measuring Literacy and Access
Financial Literacy (FL), 0–5. Five quiz questions on interest rates, compounding, inflation, diversification, and required returns were adapted from
Lusardi and Mitchell (
2011) and
Atkinson and Messy (
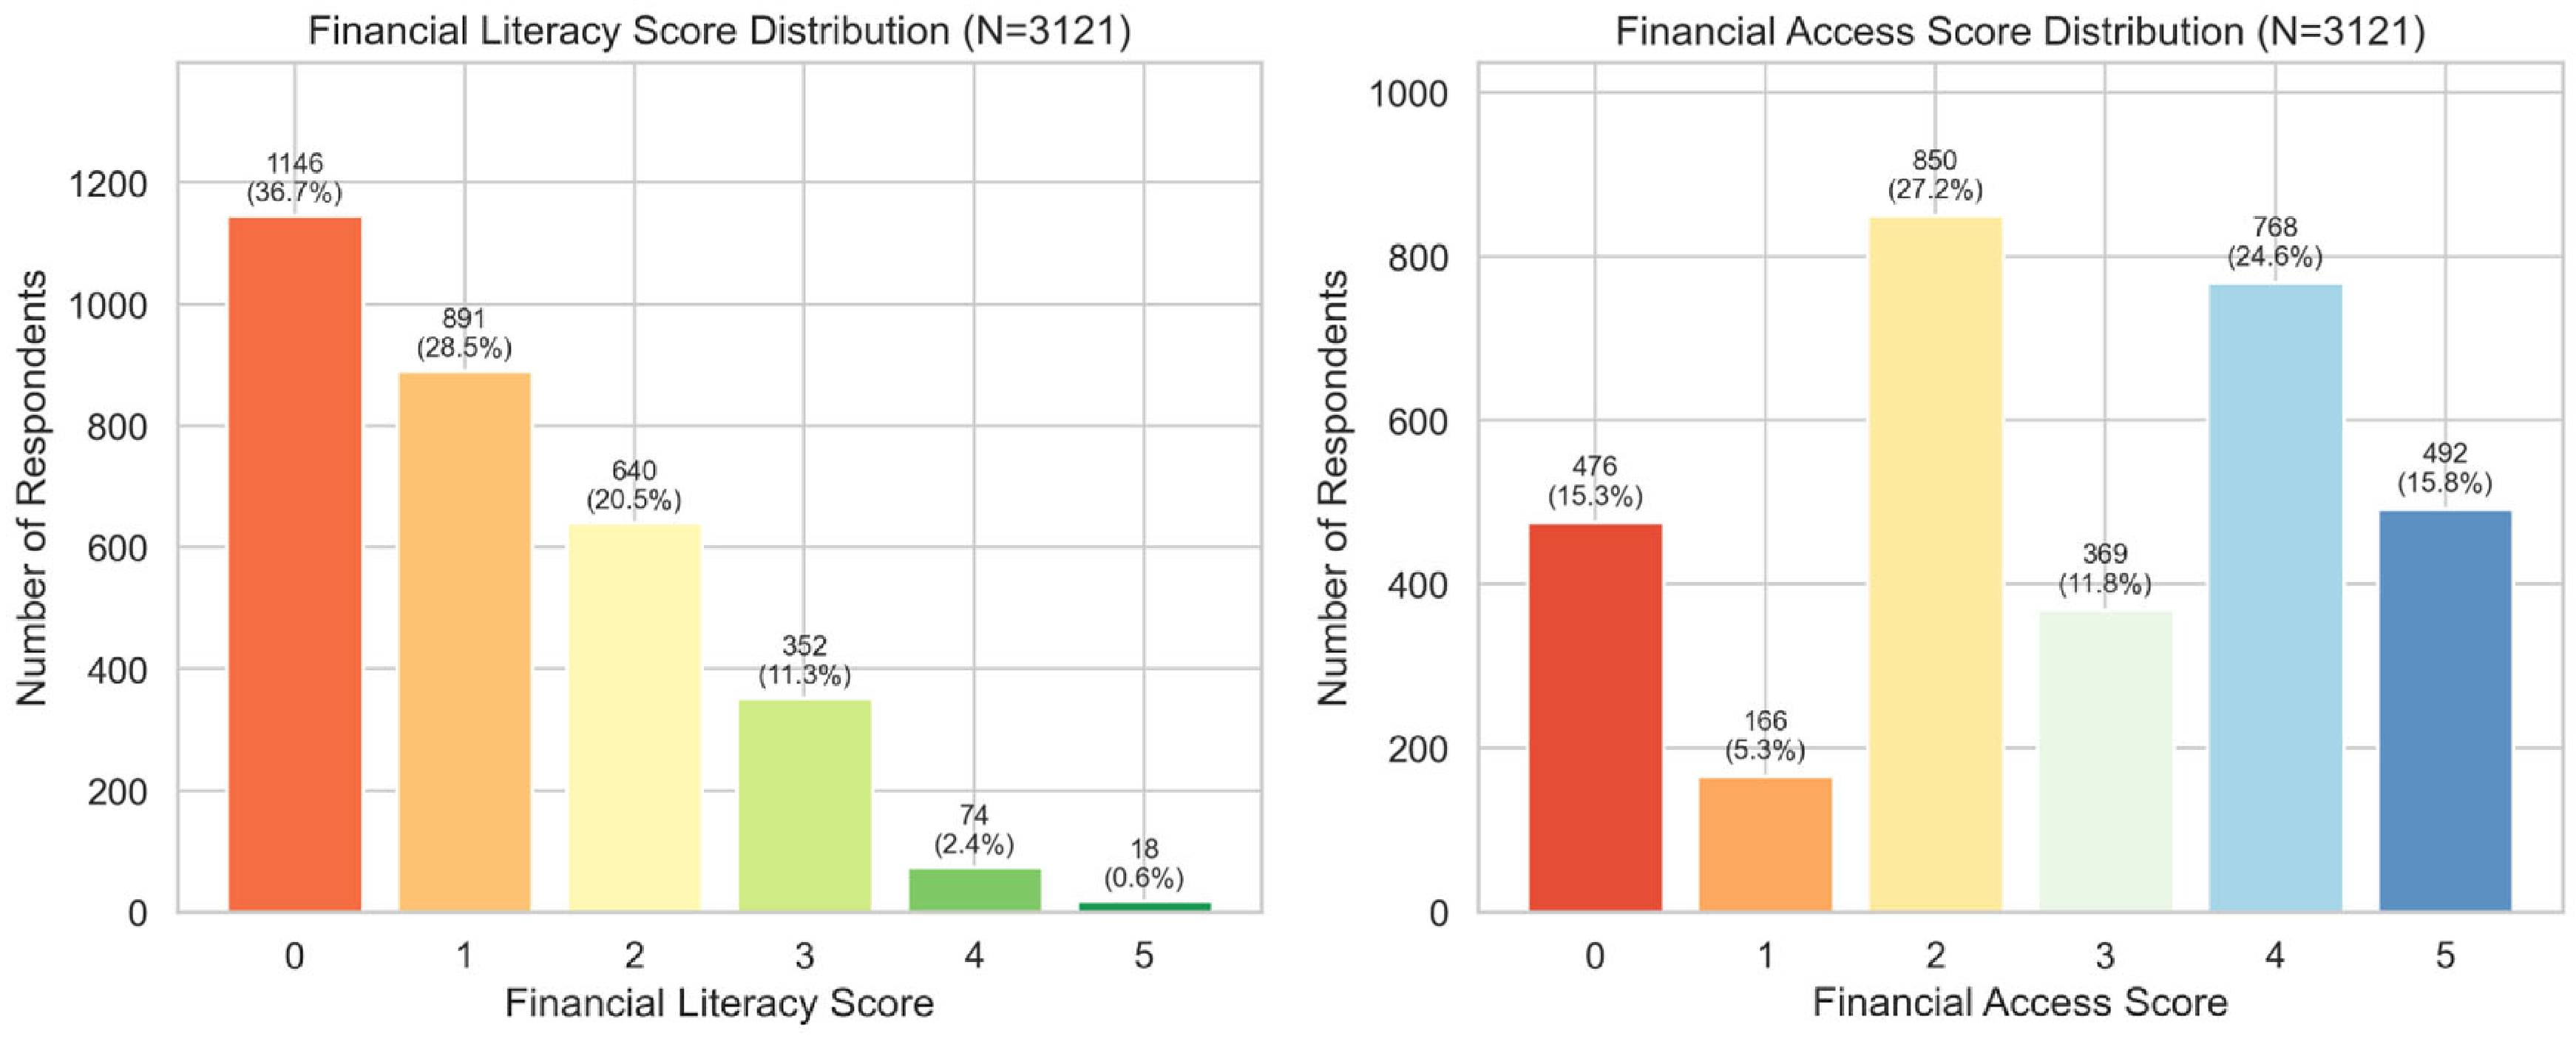
2012). Mean = 1.16 (SD = 1.19). Distribution was severely right-skewed: 36.7% scored zero.
Financial Access (FA), 0–5. Five binary indicators include bank account, regular bank usage, internet banking, mobile wallet, and regular mobile wallet usage. The score captures both breadth and depth of engagement. Mean = 2.73 (SD = 1.80). Distribution is bimodal (peaks at 0 and 5), suggesting threshold effects; the 0–5 breadth+depth measure preserves gradations lost in a binary split and supports both ordinal (0–5) and binary (FA-high) analyses.
Binary outcomes. Following
Rahman et al. (
2022), FA-high = score > 2. This outcome is used for logit and ML. The full 0–5 scale is used for the ordinal model (Brant
p = 0.170; see
Section 3.3).
3.3. Analytical Models
The analysis proceeds in six stages. Binary logit: there is FA-high (>2) on FL quiz score, gender, education (ordinal), income (ordinal), age group (ordinal), business education, community type, marital status, and occupation; all VIFs < 1.4. Ordinal logit: there is proportional odds on 0–5 FA with Brant-like test (omnibus
p = 0.170; age varies across cut points; see
Section 7.1). ML includes random forest (
n = 300) and gradient boosting (
n = 200) vs. logit, with 5-fold stratified CV, 80/20 train–test, scikit-learn defaults, and diagnostics for nonlinearity. Clustering: K-Means (
K = 5 via silhouette; score 0.203, modest) is on standardised predictors excluding FA outcome; robustness is via GMM (silhouette 0.202) and Ward hierarchical (0.171), and all recover a severely excluded female segment. Decomposition: Blinder–Oaxaca has two-fold (male coefficients reference; explained ~2/3, residual ~1/3 concentrated in mobile) and channel-specific logits. Supplementary analyses: there is a Findex 2021 versus 2024 replication (740K panel; mobile OR 2.1 to 2.6) and an ID gating check using the Findex 2024 identity module. Both draw on the public Global Findex microdata under the World Bank’s terms of use.
First, we replicate the bivariate chi-square tests and binary logistic regression of
Rahman et al. (
2022) to establish a baseline. This confirms the individual-level predictors and provides odds ratios for comparison with the intersectional findings that follow.
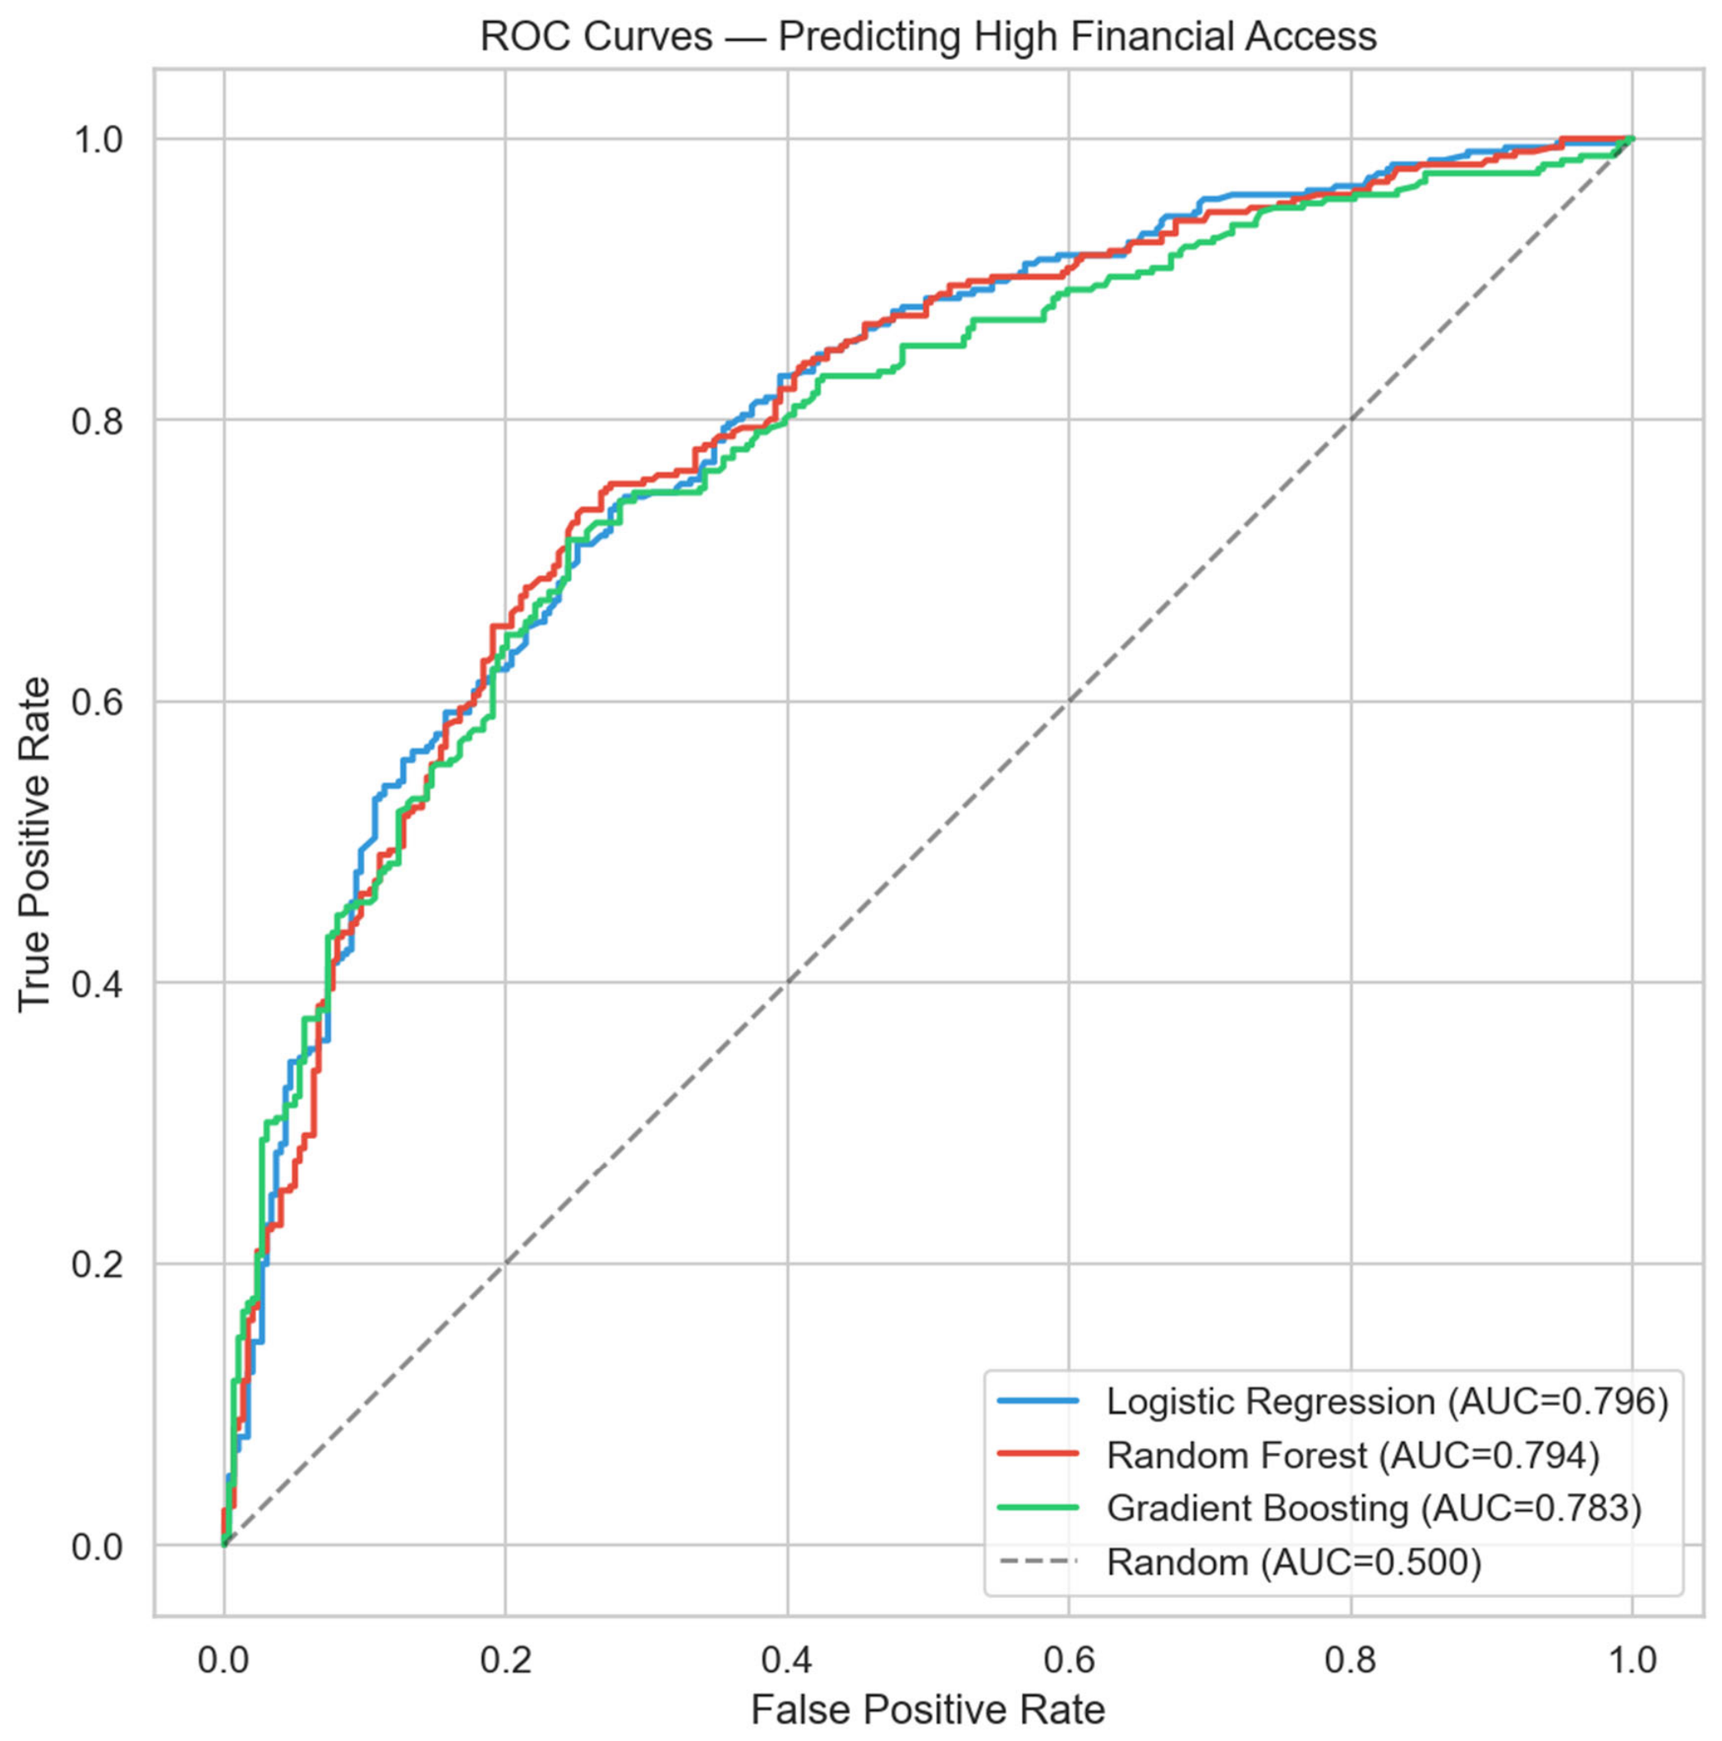
Second, we benchmark three machine learning classifiers, logistic regression, random forest, and gradient boosting, using five-fold stratified cross-validation with an 80/20 train–test split. Hyperparameters are set to scikit-learn defaults for reproducibility. The purpose is diagnostic: if tree-based methods substantially outperform the linear model, the data contain interactions or nonlinearities that the standard framework misses.
Third, we fit a proportional odds (ordinal logistic) model to the full 0–5 FA score, preserving gradations that the binary split discards. We assess the proportional odds assumption using a Brant-like test comparing separate binary logistic regressions at each cumulative cut point.
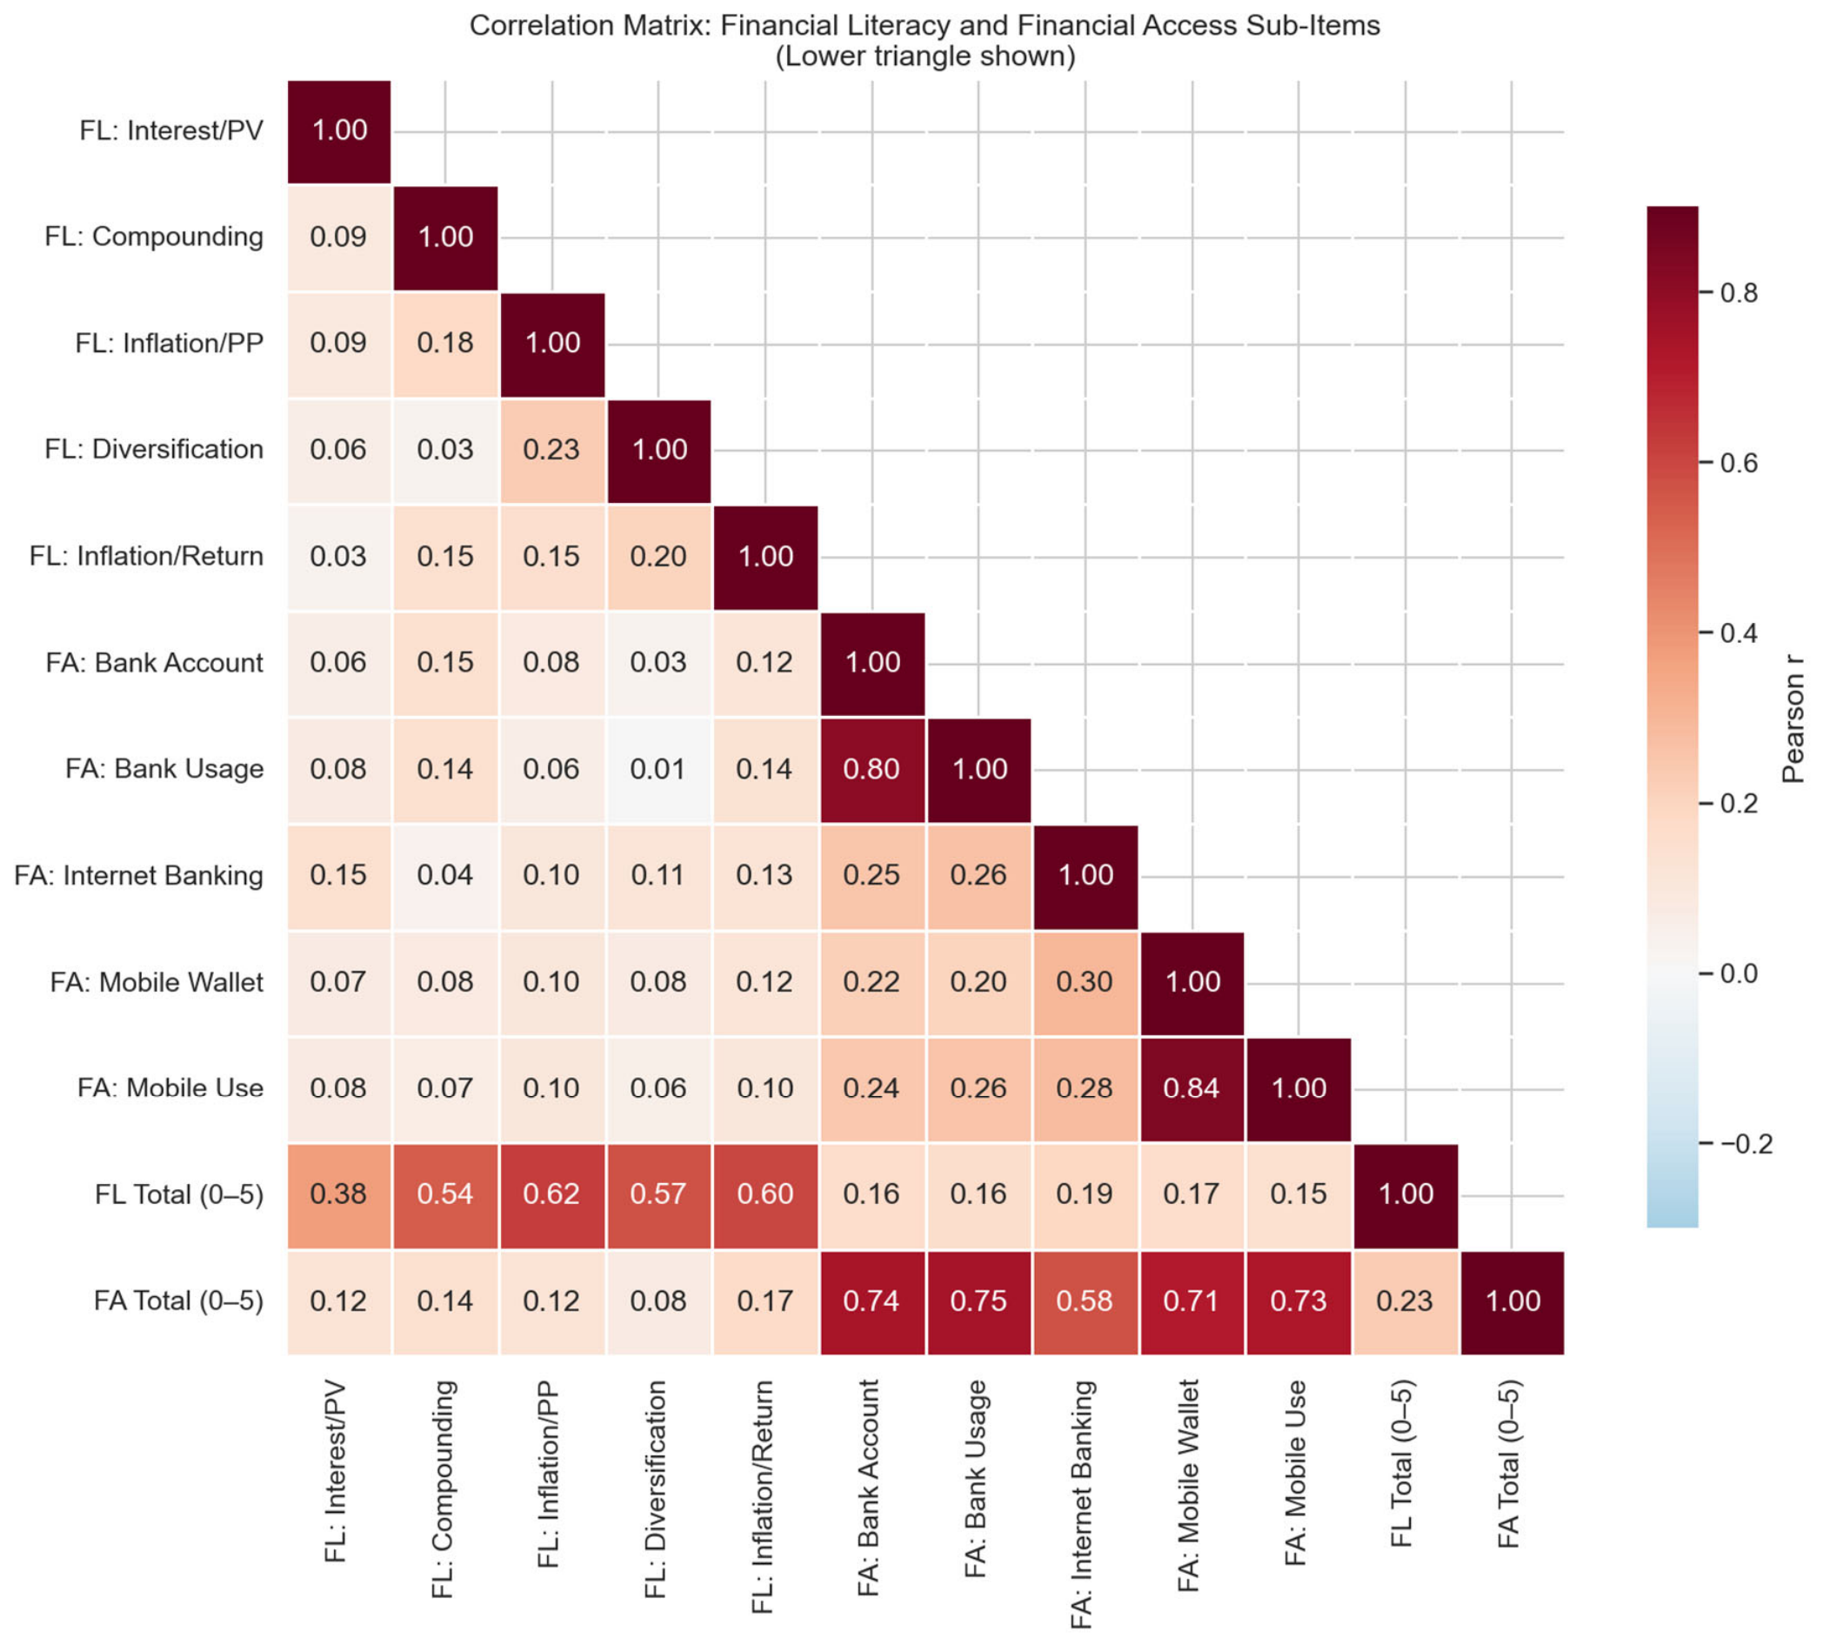
Fourth, we compute Pearson correlations among all ten sub-items (five FL and five FA) to examine how literacy and access relate at the item level.
Fifth, we apply K-Means clustering (, selected via silhouette analysis across –) to standardised predictor variables (gender, education, income, age, community type, and the literacy score). The financial access outcome is deliberately excluded from the clustering, so that each cluster’s access rate is a genuine downstream property of a demographically defined segment rather than an artefact of partitioning on the outcome itself. To check robustness, we repeat the analysis with Gaussian mixture models and hierarchical clustering (Ward linkage).
Sixth, we construct multi-way cross-tabulations: gender by education, gender by income, gender by community type, gender by age, and the three-way gender
education
income interaction. For the gender by education cross-tabulation, we also fit a logistic model with a formal gender
education interaction term to test whether the observed variation in the gender gap across education levels is statistically significant. All variance inflation factors in the regression models are below 1.4, ruling out multicollinearity. Finally, we validate the channel decomposition externally on the Global Findex 2024 microdata for Bangladesh (
), a nationally representative sample (
World Bank, 2025a).
Analyses were conducted in Python 3.12.4 using pandas 2.2.2, NumPy 1.26.4, SciPy 1.14.1, statsmodels 0.14.2, scikit-learn 1.5.2, Matplotlib 3.9.1, and seaborn 0.13.2.
5. The Gender Gap Is a Mobile Money Gap
The baseline regression found only a modest composite gender gap (
Table 2, OR = 1.38). But that composite bundles five very different channels, and the gap is far from uniform across them.
Table 4 reports the adjusted gender effect and the odds ratio for being male, controlling for education, income, age, literacy, and community type, separately for each channel. The result is striking: after controls, there is
no significant gender gap in any formal banking channel, bank account (OR = 0.87,
), bank usage (OR = 0.91,
), or internet banking (OR = 1.09,
). The entire composite gap is concentrated in mobile money, where men have roughly twice the adjusted odds of access (mobile wallet OR = 2.00; usage OR = 1.82; both
).
This inverts a common narrative. Mobile money is often described as the great equaliser for women’s financial inclusion, and in aggregate, Bangladesh’s mobile money expansion has indeed driven access upward. But
within our data, mobile money is precisely the channel where women fall furthest behind men, even after adjusting for education and income. The likely mechanism is upstream: a mobile wallet requires a phone registered in one’s own name, a national ID, and the digital confidence to transact, constraints that bind more tightly on women, which is consistent with Findex evidence that women in South Asia are markedly more likely to lack a phone or to need help using an account (
World Bank, 2025b), with GSMA data recording the world’s widest mobile gender gaps in South Asia (
GSMA, 2025). Formal bank accounts, often opened for salary, remittance, or institutional reasons, show no comparable adjusted gap. For policy, this relocates the problem: closing the gender gap in access is, concretely, closing the gender gap in mobile money adoption.
A complementary view comes from a Blinder–Oaxaca decomposition of the composite high-access gap (
Table 5). Of the 11.7-point gap, roughly two-thirds (7.9 pp, 68%) is
explained by differences in endowments. Women in the sample have lower education and income, while the remaining third (3.8 pp, 32%) is unexplained, reflecting different returns to the same characteristics or unobserved barriers. This reinforces the rest of our analysis: most of the gender gap is structural, operating through education and income, with a smaller residual that the channel result helps to localise in mobile money.
5.1. External Validation: Nationally Representative Findex Microdata
Because our sample is drawn through business and professional networks, we test the channel result against the Global Findex 2024 microdata for Bangladesh (
), which is nationally representative (
World Bank, 2025a). Findex measures account
ownership rather than our five-channel usage score, and its controls are coarser (three education levels, income quintile, age), so the comparison is one of patterns rather than point estimates.
Table 6 reports the adjusted male odds ratio for holding a financial institution account and a mobile money account.
Two results stand out. First, the mobile money gap replicates almost exactly: OR = 2.11 in the full national sample (2.34 survey-weighted), against 2.00 in our data. Second, the banking result is education-contingent in a way that both confirms our finding and bounds its scope. Among respondents with secondary education or more, the stratum comparable to our sample, the banking gap is not significant (OR = 1.37, ) while the mobile money gap widens (OR = 2.58, ), reproducing our pattern. Among those with primary education or less, the reverse holds: the banking gap is large (OR = 2.55, ) and the mobile money estimate is not significant (OR = 1.32), though mobile adoption in this stratum is too low for a well-powered test. Nationally, then, both channels show gender gaps; what distinguishes mobile money is that its gap survives education. Education closes the banking gender gap but not the mobile money gap, which is precisely why our relatively educated sample shows a banking system that is gender-neutral and a mobile money layer that is not.
The same staircase appears within our own data. Splitting the RPDC sample by education and re-estimating the adjusted gender effect channel by channel (
Table 6, bottom rows), respondents with HSC education or below show no banking gap (OR = 0.86) but a wide mobile money gap (OR = 2.26,
); among graduates, both gaps are statistically indistinguishable from zero (bank OR = 0.92; mobile OR = 1.20). Read together with the Findex strata, the full gradient is a staircase: at the lowest education levels, the gender gap sits at the first rung, holding any bank account at all; by secondary education, banking has equalised, and the gap has moved up to mobile money; only at university level does the mobile money gap, too, fade. The gender gap climbs the access ladder with education, always occupying the current adoption frontier, and mobile money is its last station before parity. This also resolves a puzzle in the next subsection: the composite gender gap narrows with education, yet the formal gender
education interaction is weak because the two channels’ education gradients run in opposite directions and partially offset when the channels are summed into one score.
Having located the gender gap in a single channel, we now ask among whom it is widest. The next two subsections disaggregate the composite gap across demographic groups, the cut a policymaker would see in headline statistics.
5.2. The Gender Gap Across Education Levels
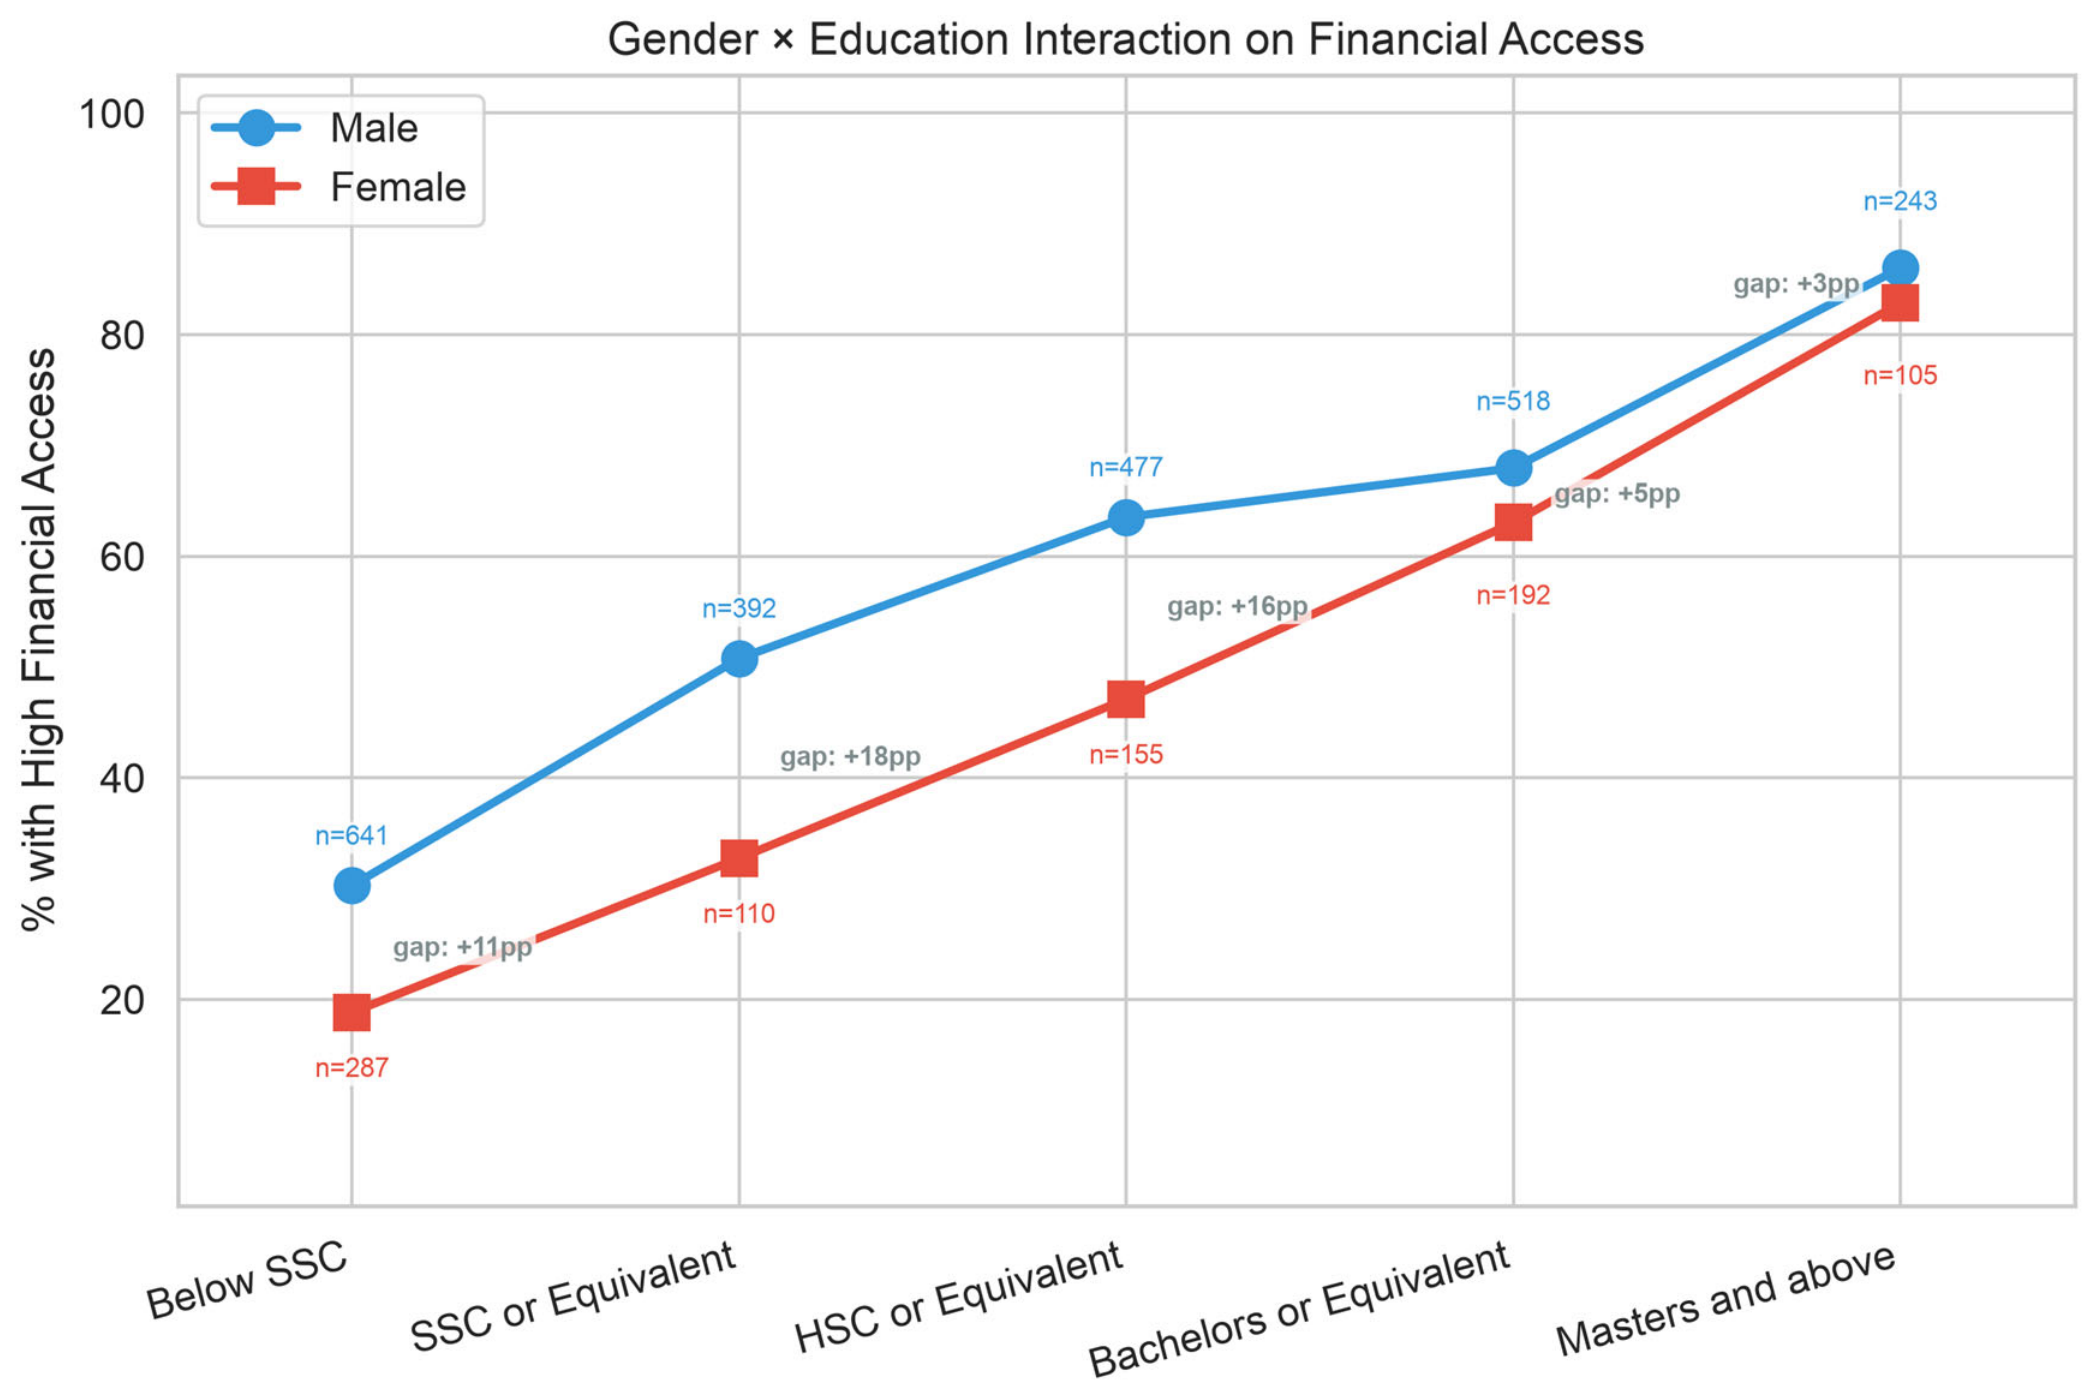
Table 7 maps the gender gap at each education level with 95% confidence intervals and per-level chi-square tests. The gap is statistically significant and substantively large at below SSC (11.5 pp,
), SSC (18.0 pp,
), and HSC (16.4 pp,
). At the bachelor’s level, it narrows to 5.0 pp and is no longer significant (
); at the master’s level, it is 3.1 pp (
).
This pattern is suggestive of an education-contingent gender gap, but we note that the formal gender
education interaction term in the logistic model does not reach significance (OR = 0.91, 95% CI [0.79, 1.05],
; likelihood ratio test
,
). The linear interaction specification may lack power with only five ordinal education categories. We, therefore, present this as a descriptive finding warranting further investigation with larger samples or alternative specifications, not as a confirmed moderating effect.
Figure 4 plots the gap across education levels.
5.3. The Gender Gap Across Income, Community, and Age
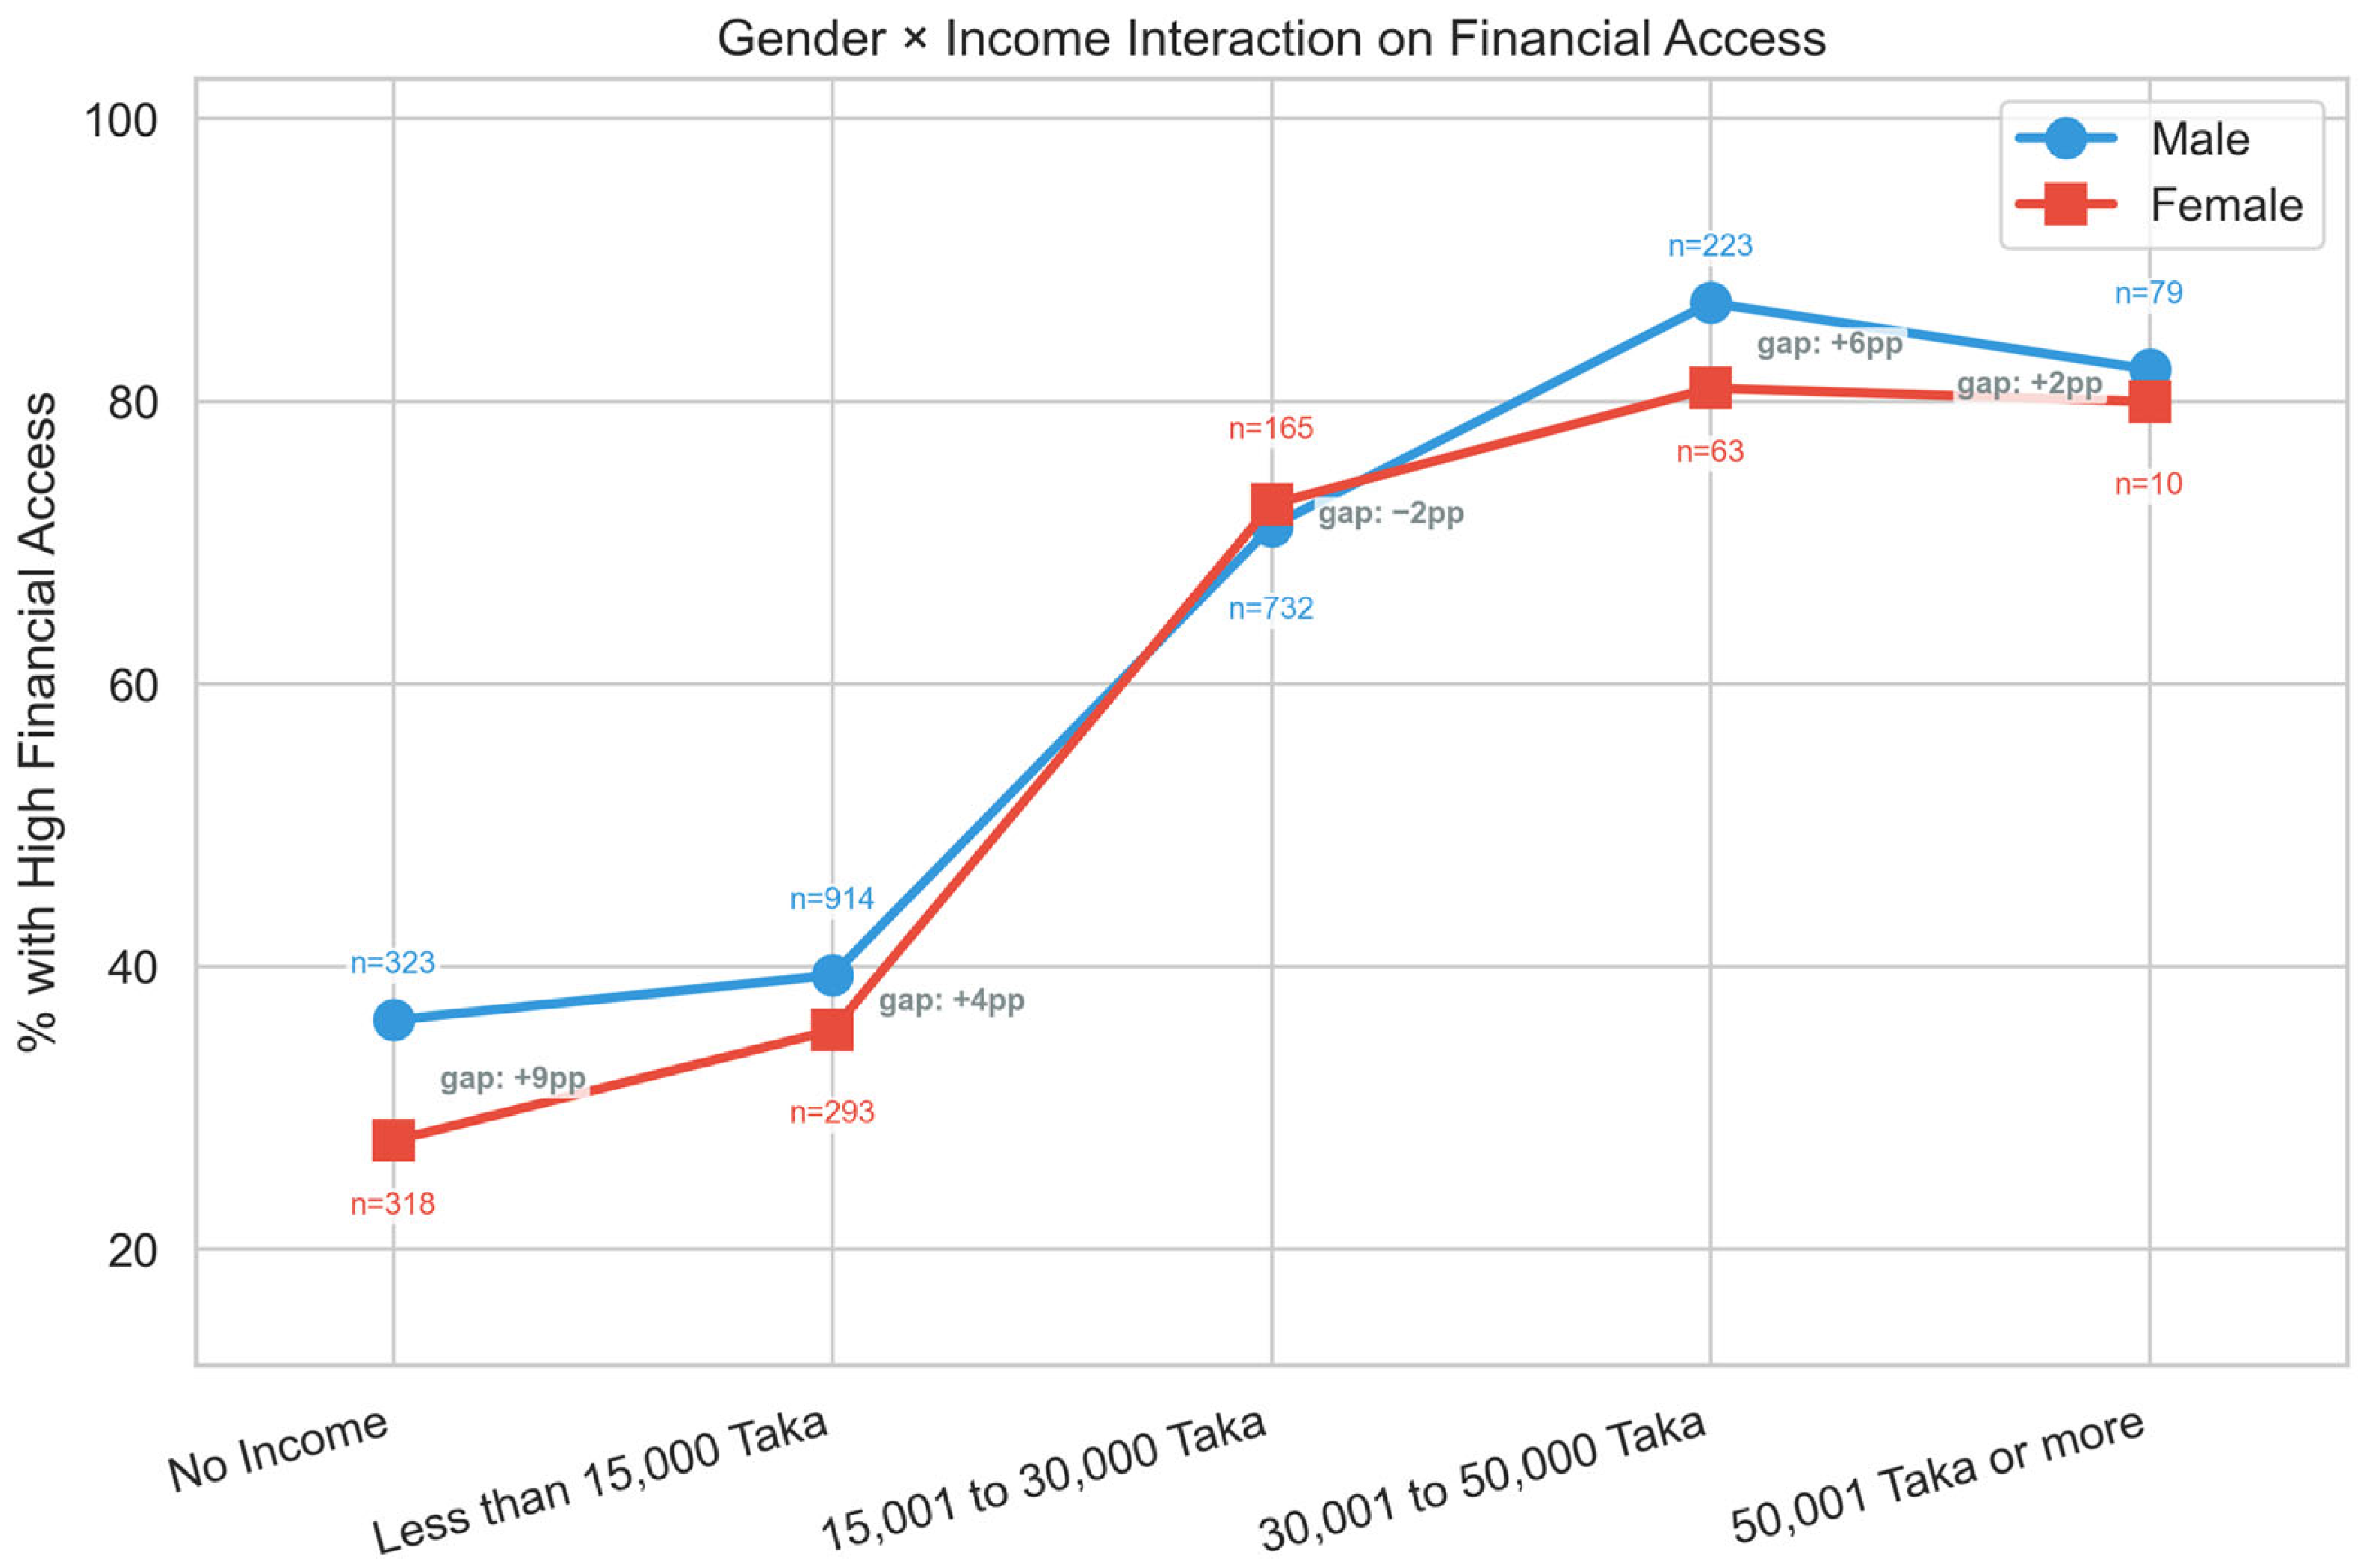
The gender gap narrows at higher incomes but does not reverse: at every bracket, men have at least as much access as women, with one apparent exception, the 15,001–30,000 BDT range, where women’s rate (72.7%) marginally exceeds men’s (71.2%). This 1.6-point difference is not statistically significant (
,
) and is best read as sampling noise. We note that microfinance lending concentrates on women in roughly this income range (
Grameen Bank, 2024), but our survey records no programme participation and cannot test whether that plays any role (
Figure 5).
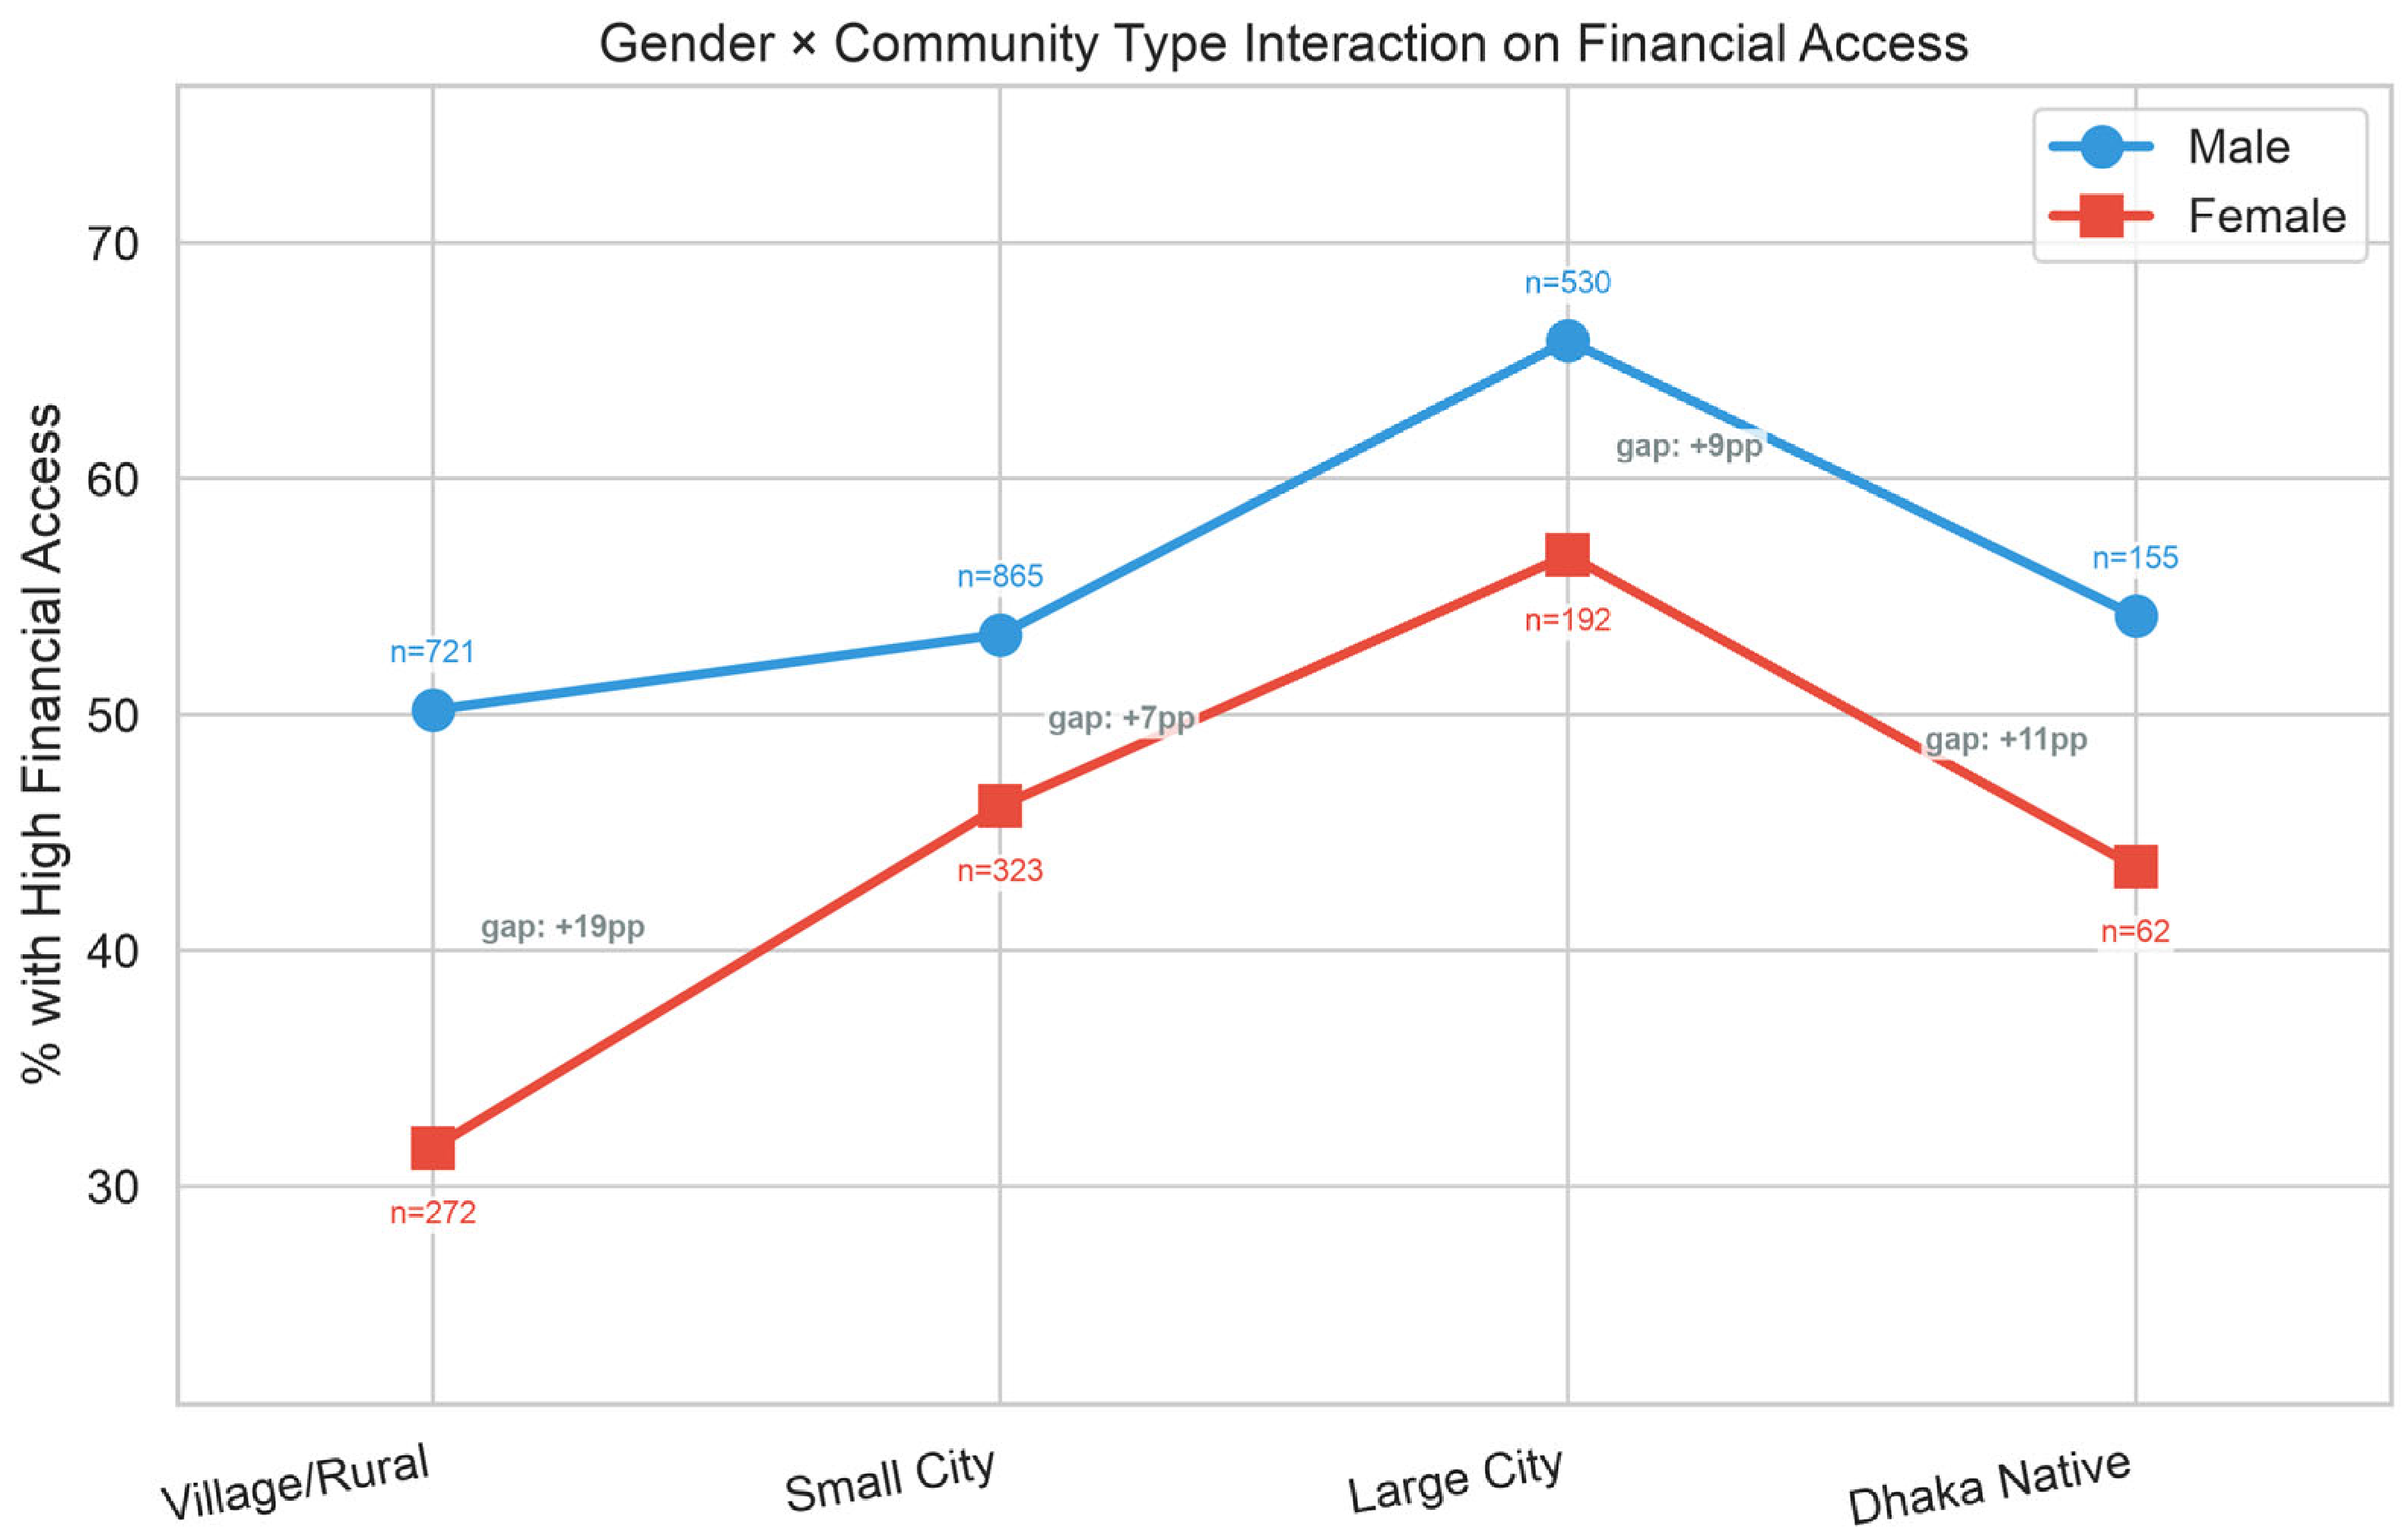
The gender gap varies substantially by community type (
Figure 6). It is largest in villages (19 pp), where traditional gender norms most strongly restrict women’s financial autonomy, a pattern documented across South Asia (
Khandker et al., 2013). Small cities show the narrowest gap (7 pp). Because the gender gap is concentrated in mobile money (
Section 5), this narrower gap most plausibly reflects more equal mobile money adoption between men and women in semi-urban areas, where mobile money agent networks are dense (
Bangladesh Bank, 2023), rather than a uniformly smaller disadvantage across channels. Dhaka residents, despite living in the country’s most economically developed setting, show a moderate gap (11 pp), suggesting that urbanisation alone does not guarantee gender equity in financial access.
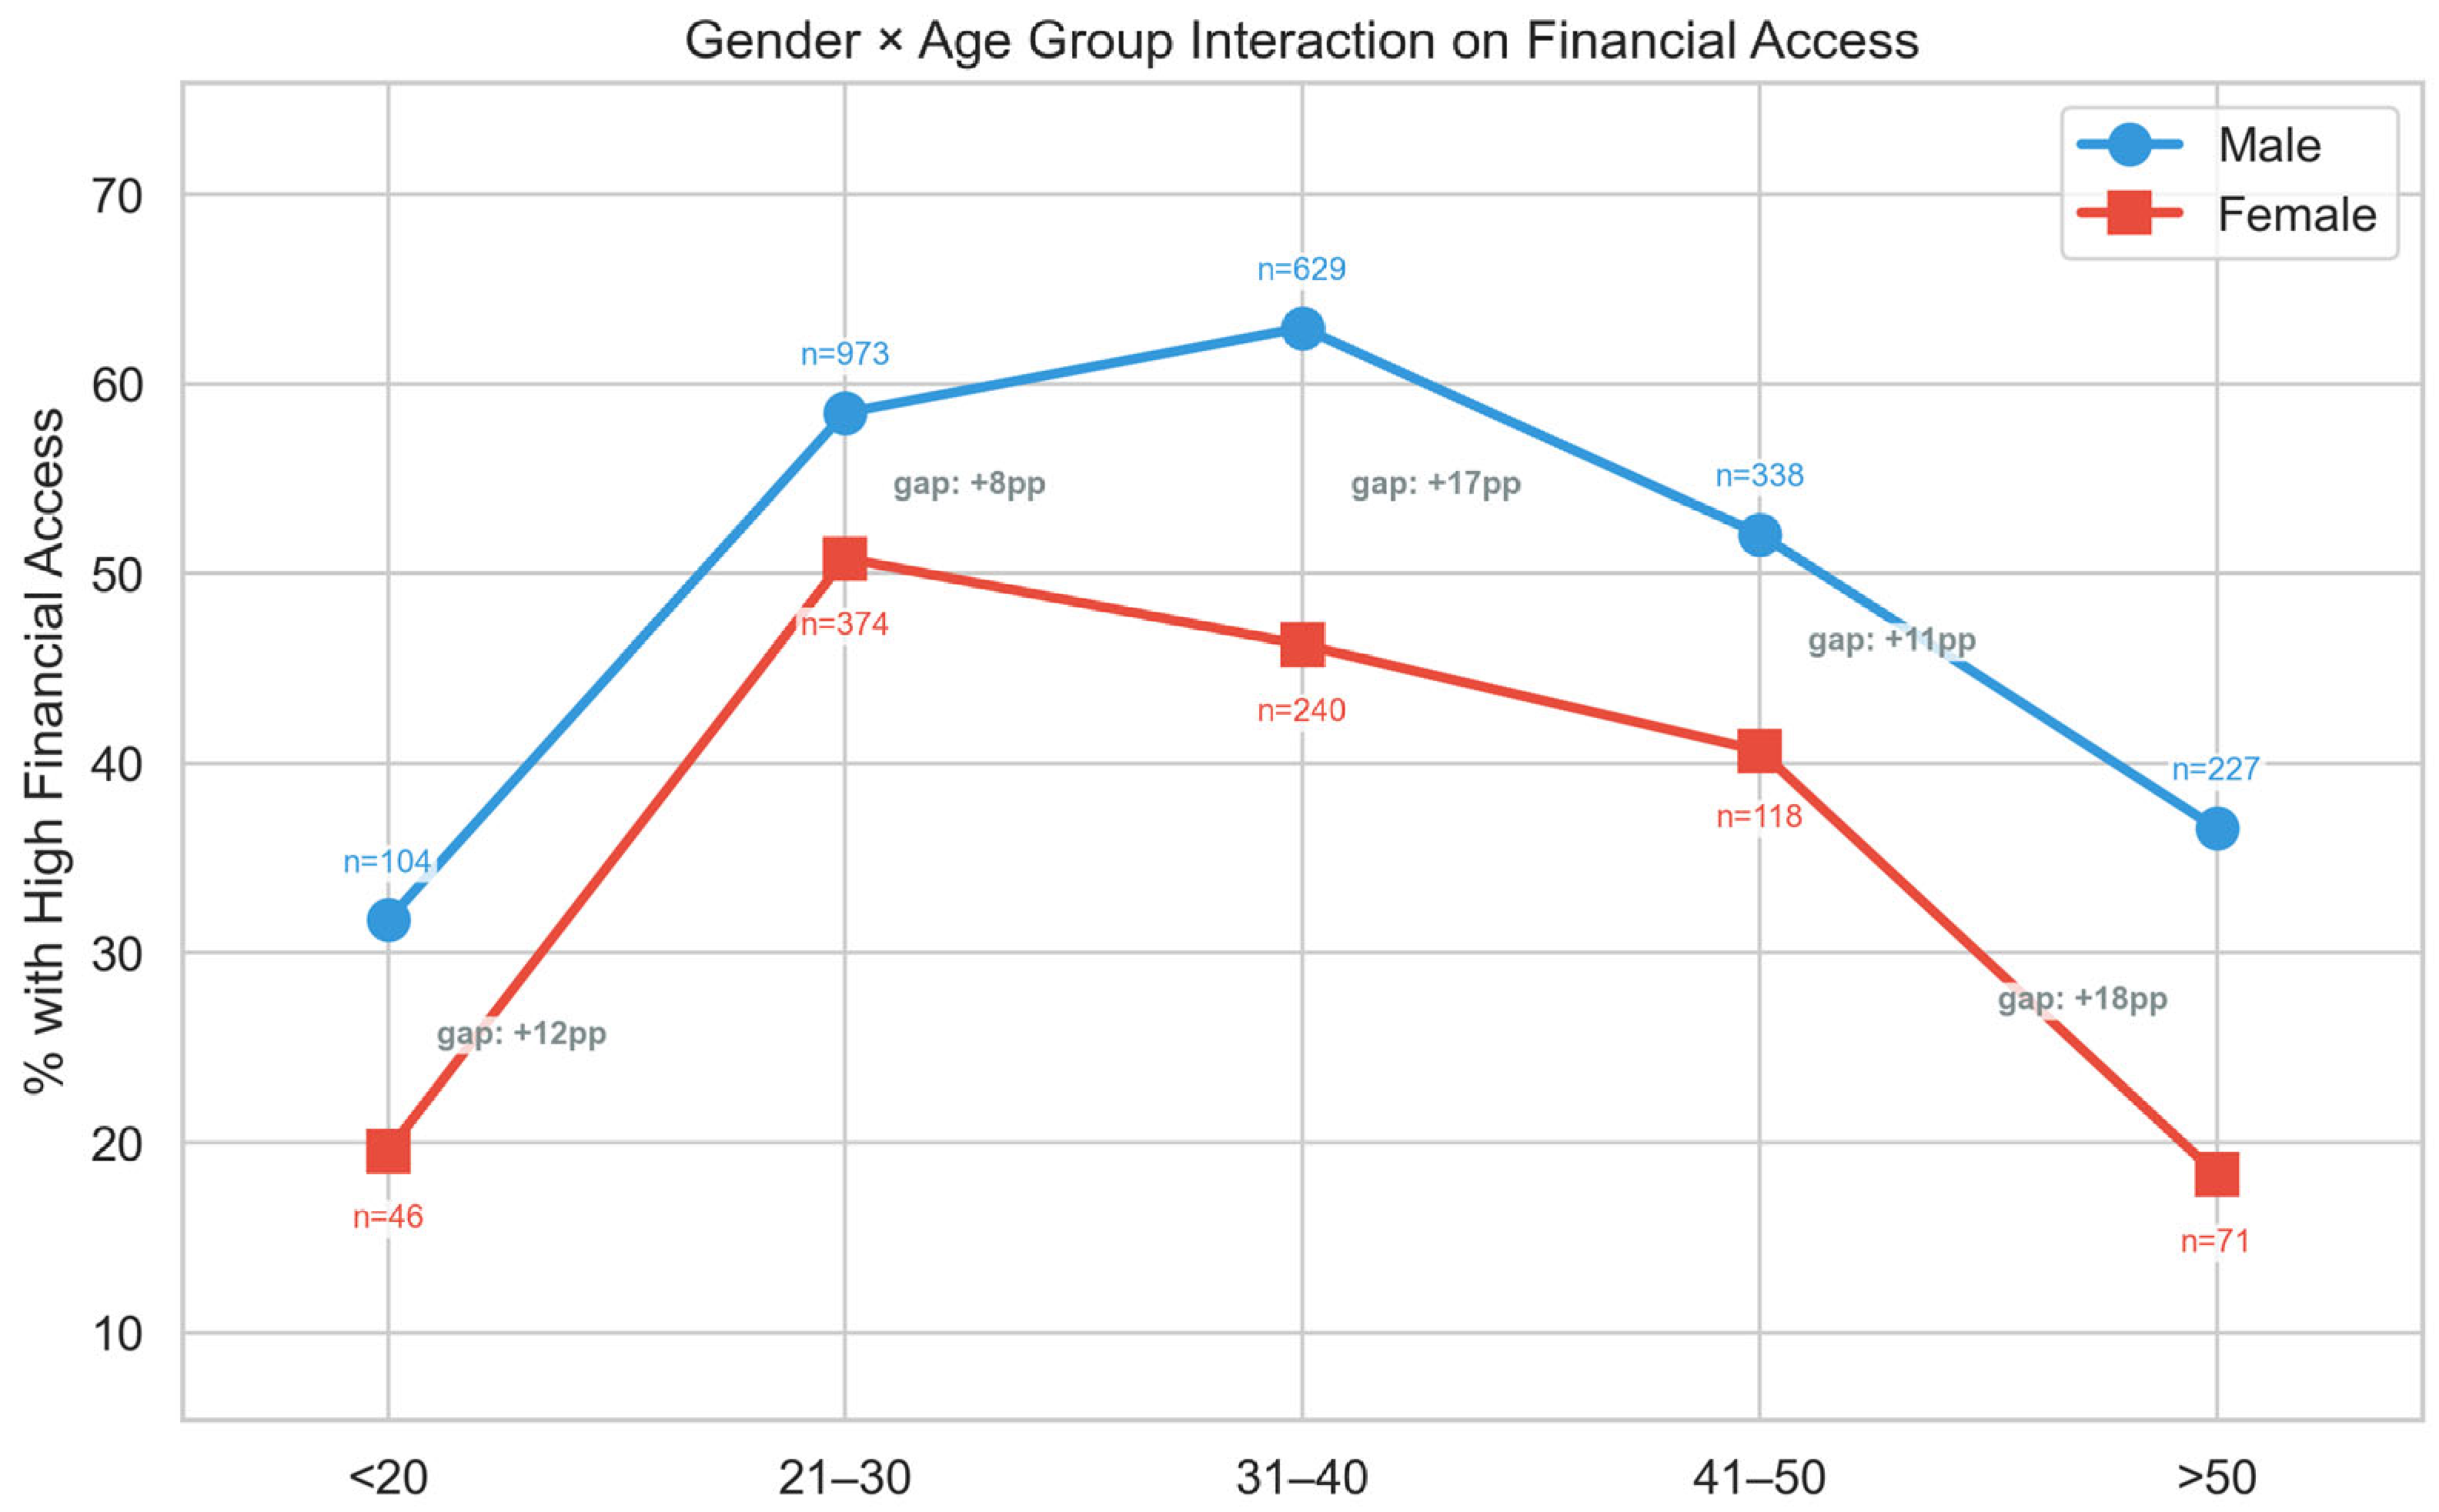
By age (
Figure 7), the gap is narrowest among 21–30-year-olds (8 pp), the generation that came of age alongside mobile money, and widest among those over 50 (18 pp). This generational pattern is consistent with the channel result in
Section 5: the overall gap is narrow where younger women have adopted mobile money on closer terms with men, and wide among older cohorts who have not (
World Bank, 2025a). Women over 50 have the lowest access of any gender–age cell at 18.3%, compared with 36.6% for men of the same age, a gap that education-based interventions are unlikely to close given the age profile of this population.
6. Who Is Most Excluded: The Concentration of Disadvantage
6.1. Compound Vulnerability Clusters
K-Means clustering (
, selected by silhouette analysis; peak score 0.203) identifies five population segments with distinct access profiles (
Table 8). To avoid circularity, the clustering uses only predictor variables, gender, education, income, age, community type, and the literacy score; the financial access outcome is
not an input, so each cluster’s access rate is a genuine downstream property of a demographically defined segment rather than an artefact of the partition. The modest silhouette score reflects the overlapping nature of demographic categories rather than an absence of structure; the key question is whether the segments are interpretable and robust.
Cluster C0: “Excluded Women” is the core finding of this paper. These 376 respondents are all female, have below SSC education on average, are predominantly housewives, and have essentially no independent income. Their financial literacy averages 0.49 out of 5, and only 21.0% achieve high financial access. This figure is roughly two-fifths of the sample average of 52.2% and 65 percentage points below C4 (“Affluent Educated Men,” 85.6%). Read one variable at a time, the individual coefficients give no sense of a gap this large; it becomes visible only when gender, education, and income disadvantage are considered jointly. As we show in
Section 6.2, this joint severity is additive rather than a special interaction effect, but it is precisely what the marginal, one-variable tables that dominate the literature fail to surface.
To test robustness, we repeated the clustering with a Gaussian mixture model (silhouette = 0.202) and hierarchical clustering with Ward linkage (silhouette = 0.171). All three methods recover essentially the same segment: K-Means isolates 378 women with 20.9% high access, the GMM isolates 344 women with 20.3%, and Ward linkage isolates 273 women with 19.0%. The segment’s size shifts modestly with the algorithm, but its defining features, 100% female, below SSC education, and no income, and its access rate near 20% are stable across all three.
The contrast between C0 and C1 (“Educated Women”) is particularly telling. C1 respondents are also all female, but they have bachelor’s-level education on average and moderate income. Their access rate is 61.2%, comparable to the overall male average and roughly three times higher than C0. The 40 percentage point gap between these two all-female clusters represents the difference that education and income make for women who share the same gender disadvantage. This is the most direct evidence in our data that education is associated with dramatically higher access among women, though the cross-sectional design prevents us from establishing the causal direction.
Cluster C3 (“Low-Education Working Men”) is the largest segment at 28.6% of the sample. These are men with below SSC education, typically employed in small business or self-employment, earning less than 15K BDT monthly. Their access rate of 39.7% is below the male average of 55.4%, demonstrating that compound vulnerability is not exclusively a women’s issue; men at the intersection of low education and low income also face severe exclusion. The difference between C3 and C4 (“Affluent Educated Men,” 85.6% access) is 46 percentage points, illustrating the enormous within-gender inequality among Bangladeshi men.
Cluster C2 (“Young Male Students”) shows an intermediate pattern: 49.7% access, reflecting their relatively high education but low income (mostly students). This segment’s access rate is likely to improve as these individuals enter the labour market, making them a lower priority for immediate intervention compared to C0 and C3.
The key insight from the cluster analysis is that the 52.2% sample average conceals a population polarised between near-universal inclusion (C4: 85.6%) and severe exclusion (C0: 21.0%), a polarisation that aggregate and marginal statistics obscure, even though it follows from the additive model once covariates are combined.
6.2. Three-Way Interactions: The Most Excluded Segments
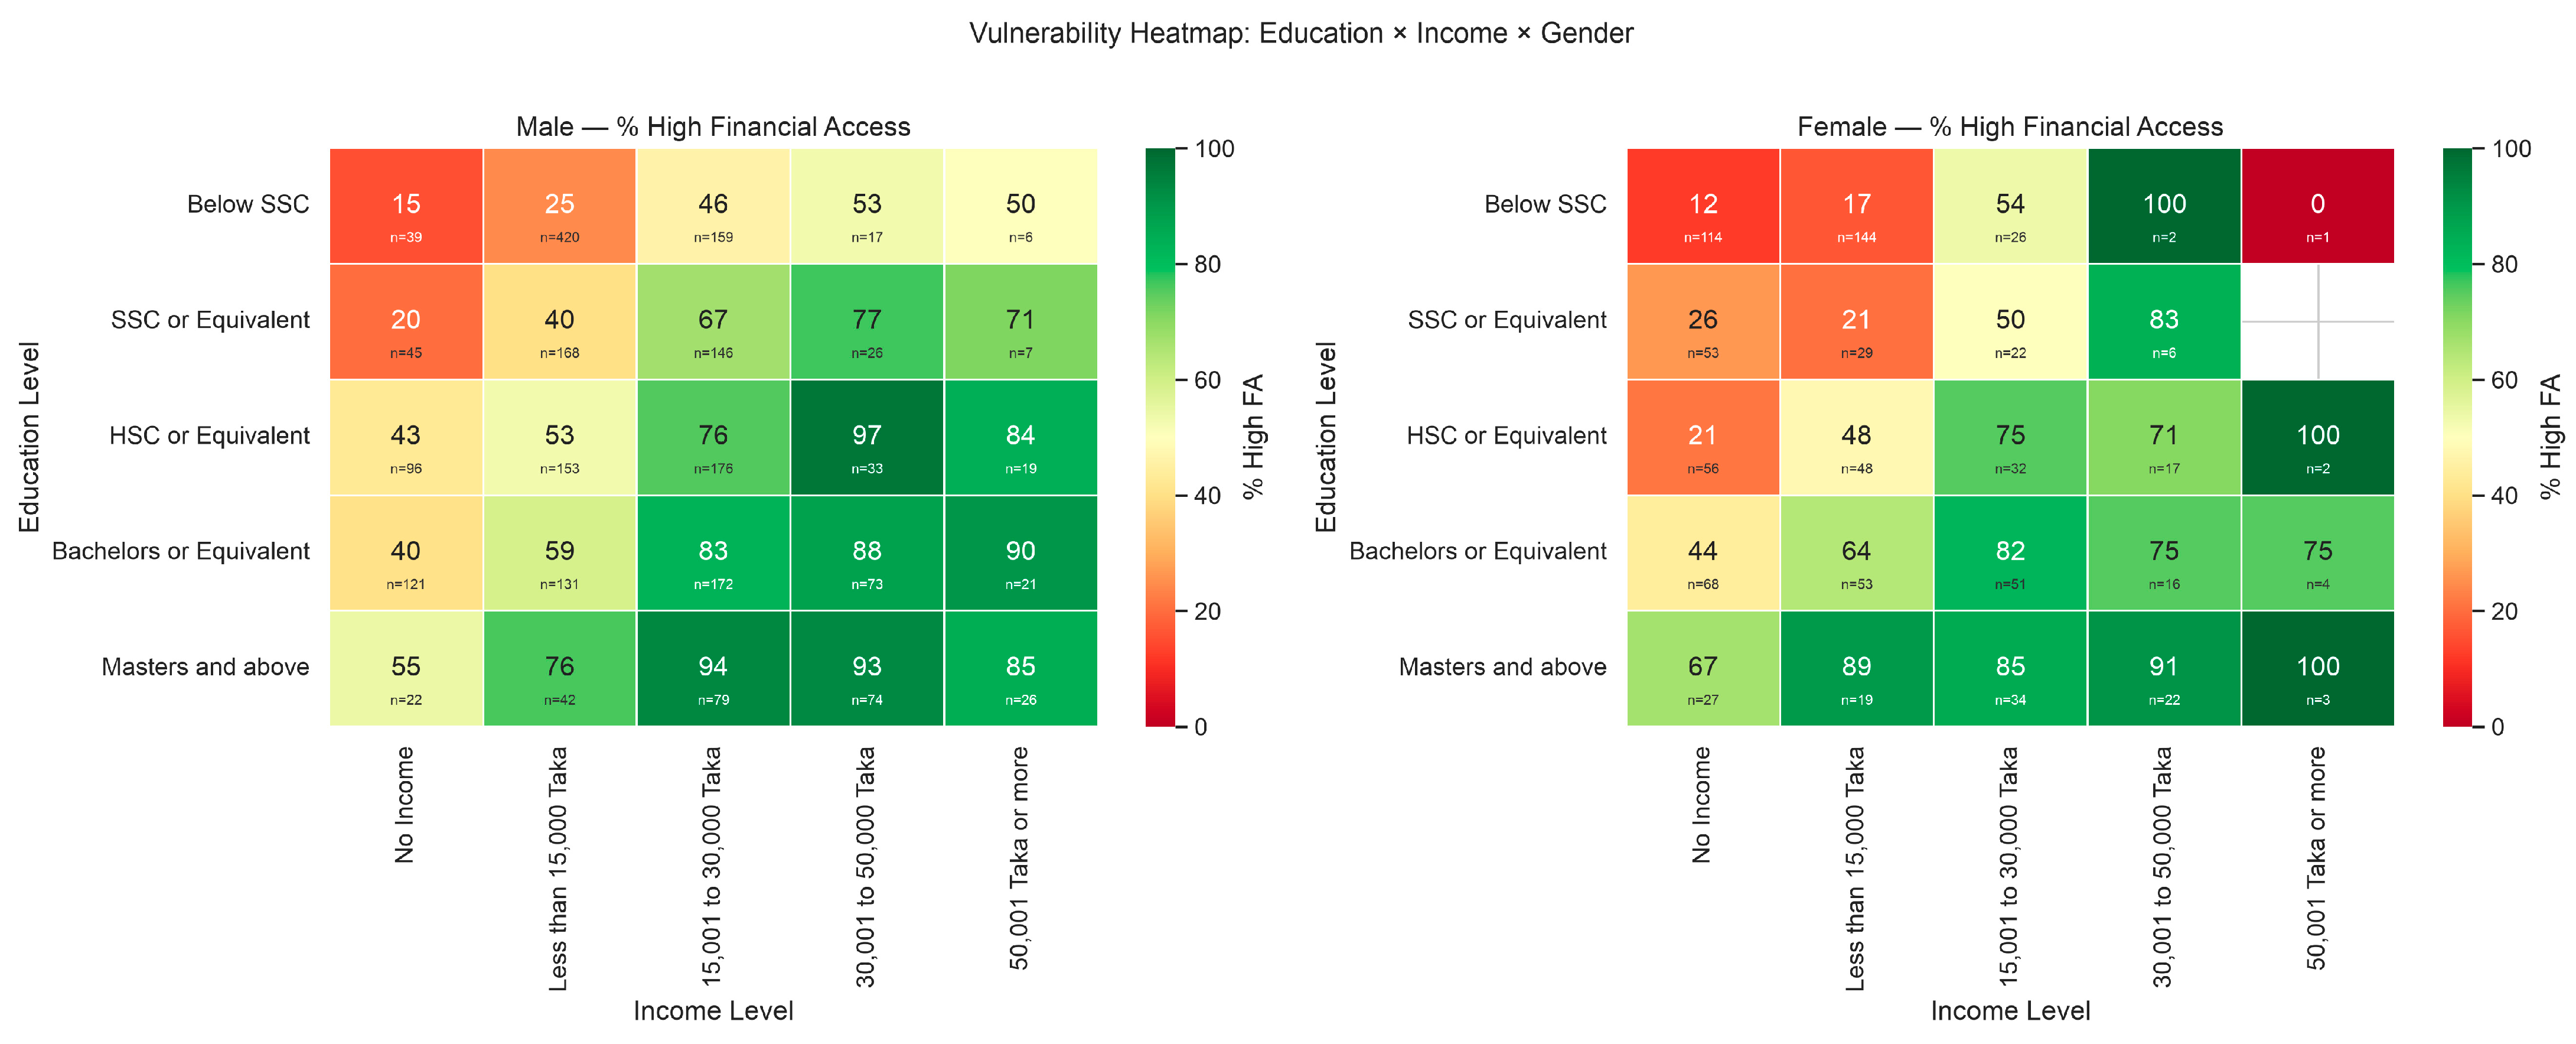
Table 9 identifies the population segments with the lowest financial access through a three-way cross-tabulation of gender, education, and income (cells with
). The worst-off group is women with below SSC education and no income: only 12.3% have high access (
), approximately one-quarter of the sample average. This cell contains 3.7% of the total sample. It is tempting to read such an extreme rate as evidence of a multiplicative or “superadditive” interaction, but our data do not support that interpretation. A main effects logistic model with no interaction terms predicts an 11.7% high-access rate for this cell, within one percentage point of the observed 12.3%, and an indicator for the cell added to that model is far from significant (OR = 1.08,
). Nor do the three two-way interactions (gender
education, gender
income, education
income) jointly improve fit (likelihood-ratio
,
,
). The severity here is, therefore, one of concentration, not compounding: the cell sits at the floor of the two strongest main effects, income and education, and an additive model reproduces it almost exactly. Indeed, naively stacking the marginal penalties on the probability scale (female −11.7, below SSC −25.5, no income −20.2 percentage points from a 52.2% base) would predict a negative rate, so if anything, the observed value is sub-additive. What a one-variable-at-a-time analysis misses is not a hidden interaction but the sheer concentration of disadvantage when the worst values of the strongest predictors coincide in the same people.
The second most excluded cell is men with below SSC education and no income (, 15.4%), followed by women with below SSC education and less than 15K BDT income (, 16.7%). The pattern across the bottom of the table is clear: regardless of gender, the combination of below SSC education with no or minimal income produces access rates in the 12–25% range. Gender adds an additional penalty within this already-excluded stratum; women are consistently worse off than comparable men, but the stratum itself is defined by the intersection of education and income.
The largest excluded group by headcount is men with below SSC education earning less than 15K BDT (
, 24.5%). This group represents 13.5% of the total sample and is larger than the C0 cluster. While their exclusion is less extreme than that of the female compound vulnerability segment, they illustrate that the benefits of Bangladesh’s mobile money revolution have not fully penetrated the low-education, low-income male population either. Policies focused exclusively on women’s financial inclusion would overlook this substantial group.
Figure 8 maps high access rates across education and income for each gender.
8. Discussion
8.1. Why Mobile Is the Source, and Theoretical Implications
The central result, adjusted gender parity in banking (OR ≈ 0.9, n.s.) alongside a robust mobile money gap (OR ≈ 2.0), replicates in nationally representative Findex microdata (mobile OR 2.1–2.6;
Section 5.1). Theoretically, this is consistent with TAM/VAM/UTAUT2 (
Section 2.5): education lowers effort expectancy for banking (closing the banking gap with schooling,
Table 6), income eases facilitating conditions (device/data costs), and gender operates via social influence, norms, ID in own name requirements, and confidence, pathways that bind mobile more tightly. Five reinforcing channels explain why mobile is the locus. (1) Technology: a ~9 pp phone-ownership gap (
GSMA, 2025) directly gates mobile adoption. (2) Costs: handset and data costs screen low-income women. (3) Gendered biases include norms, ID, and confidence (
Khandker et al., 2013;
Salman & Murthy, 2025). (4) Institutional: the
World Bank (
2018) documents mobile market barriers for women. (5) Methodological: our five-channel composite would hide this heterogeneity if not decomposed, and a single gap number conflates channels; ML AUC ≈ 0.79 with limited gains points to subgroup heterogeneity, not strong nonlinearity (see
Section 4.3). Together these imply that mobile is where the actionable gap lives, even as mobile expansion lifts aggregate inclusion.
Theoretically, the result sharpens TAM/VAM/UTAUT2: effort expectancy (education) matters for banking, and facilitating conditions (income/device) and social influence (gender norms) matter for mobile. Product awareness (OECD/INFE) is a second literacy dimension, and the framing of
Najib et al. (
2021) reinforces that literacy operates via awareness/confidence rather than numeracy alone (
Section 7). The channel result is thus not a Bangladesh anomaly but an instance of technology adoption theory where the newer, phone-gated channel carries the gendered friction.
Policy follows channel: interventions that place a phone and a registered wallet in a woman’s own hands, SIM registration drives, agent-assisted onboarding, and ID support target the documented gap; generic “women’s inclusion” programmes that do not address the mobile locus will miss it.
8.2. Comparative Literature
Our channel decomposition clarifies mixed prior findings. Studies reporting a single “gender gap in access” (e.g.,
Hasler & Lusardi, 2017;
Klapper et al., 2015) average over channels, masking offsetting banking/mobile patterns. Mobile optimistic narratives (
Suri & Jack, 2016;
World Bank, 2025a) are correct in aggregate. Mobile lifted overall access, but within our data, mobile is precisely where women fall behind once education/income are held constant, which is also a pattern in Findex.
Grohmann et al. (
2018) and
Allen et al. (
2016) link literacy to inclusion, but our ordinal and item-level results show literacy works indirectly via awareness (
Akhter & Khalily, 2020;
Reddy et al., 2025), not as a direct account-opening lever. The intersectional clustering aligns with
Whelan and Maitré (
2005) and
Sobhani et al. (
2022): disadvantages concentrate in identifiable segments rather than multiplying.
Rahman et al. (
2022)’s main effects composite is a useful baseline; our decomposition shows where that composite’s gap lives and how additive concentration produces severe tail exclusion without multiplicative compounding.
We report effects as primarily, not exclusively, mobile: among the least educated, Findex shows a banking gap persists, closing only with education; in our more educated sample, the banking gap is already closed. The framing “primarily mobile-money gap” thus respects both datasets and avoids overgeneralisation.
These findings have a methodological implication: reporting only marginal, one-variable-at-a-time effects understates the severity of exclusion among the most marginalised, even when the underlying effects are additive. The intersectional approach pioneered in European social exclusion research (
Whelan & Maitré, 2005) and now being applied to financial inclusion in Africa (
Sobhani et al., 2022) needs to become standard practice in South Asia too.
8.3. Policy Implications
Gender explains little in aggregate (2.4% importance, OR = 1.38, V = 0.11) versus income (44.7%, OR = 2.21) and education (25.1%, OR = 1.74) precisely because its effect is channel-specific, a point masked by composite reporting. This does not make gender unimportant; it is sharply important at the intersection (C0: 376 women, 21% access). The implication is targeting: not “programmes for women” generically, but phone/wallet provision for the compound vulnerability segment (C0 and the three-way worst cells in
Table 9) via community-based registration drives, agent networks, and linkage to education. A supplementary check on the Global Findex 2024 identity module, whose procedure is described in
Section 3.3, points the same way: lacking a national ID reduces bank access by 17.9 pp but mobile access by only 12.3 pp (Bangladesh: OR 4.43 for banking versus 1.40, n.s., for mobile). We treat this as corroborating context for the channel result, not as one of the study’s own estimates.
Design implications are to bundle mobile onboarding with adult education and income support where feasible, co-locate agents and ID support in villages (widest gap, 19 pp vs. 7 pp in small cities,
Figure 6), and build on the youngest cohort’s narrower gap (8 pp at 21–30) for peer demonstration effects. Where programmes must choose, allocate marginal resources to the mobile channel for low-education women, where education alone does not close the gap.
We caution that cross-sectional associations are not causal; longitudinal or experimental follow-up is needed. We generalise only to settings with similar mobile-gated, low-literacy contexts, not worldwide.
8.4. How the Gap Evolved, Findex 2021–2024 Replication
The November 2021 RPDC baseline predates the National Financial Inclusion Strategy 2021–2026. To test continuity, we replicated the channel gap in Global Findex 2021 vs. 2024 microdata (740K panel): the mobile money gender gap persists at OR 2.1 → 2.6, while the banking gap shows the education staircase documented in
Table 6. Complementary aggregates point the same way:
Bangladesh Bank (
2023) records 13 MFS providers and rapid account growth,
Zaman (
2024, Daily Star) reports ~22 crore MFS accounts, and Findex 2025 records LMIC mobile money coverage rising from 1% to 15%. Trend continuity suggests that the 2021 channel result is not a period artefact.
What, then, does literacy actually do? Our best interpretation, following
Lusardi and Mitchell (
2014)’s framework, is that it works indirectly, through general awareness that financial products exist, through confidence to walk into a bank or ask an agent for help, and through the ability to evaluate whether a product is worth the fees. It does not work by teaching people the compounding formula and watching them open a savings account the next day. Our own data bear this out: the breadth of products a respondent is merely aware of predicts access independently of the numeracy score, education, and income (
Table 11); it is awareness, not formula knowledge, that carries the signal. This distinction matters for programme design. A literacy programme should be judged by whether participants become more confident and engaged with their financial options over time, not by whether they open an account on the last day of the workshop. And literacy training is most likely to pay off when combined with concrete supply side interventions, subsidised accounts, registration drives, and agent banking, which lower the practical barriers (
Cole et al., 2011).
The strong within-domain correlations (bank account bank usage: ; mobile wallet mobile usage: ) carry a more optimistic message. They indicate that once people gain access to a financial product, they tend to use it regularly. The barrier is acquisition, getting an account opened in the first place, not sustained adoption. One-time interventions, such as registration drives, subsidised enrolment, and assisted sign-up at community centres, may therefore have lasting effects because the ownership to usage pathway is strong. For the compound vulnerability segment identified in our cluster analysis, even a single successful account opening could be the entry point to broader financial engagement.
8.5. A Replicable Multi-Method Framework
This paper demonstrates a specific analytical workflow, regression, ML diagnostics, ordinal modelling, item-level correlation, clustering with robustness checks, and systematic subgroup cross-tabulations, which other researchers can apply to their own financial inclusion data. The key insight is that these methods serve different purposes and are complementary rather than redundant. Regression identifies which variables predict access and estimates effect sizes. ML benchmarking tests whether the aggregate relationships are linear or nonlinear. Ordinal modelling captures gradations in the outcome that binary splits miss. Item-level correlations reveal the internal structure of the literacy–access relationship. Clustering identifies population segments with distinct risk profiles. And subgroup cross-tabulations map the landscape of compound vulnerability at specific demographic intersections.
No single method would have produced the full picture. The regression tells us that gender has a modest main effect (OR = 1.38); the cluster analysis tells us that 376 women at a specific intersection have a 21% access rate (with the worst cell at 12.3%); and the ML diagnostic tells us that these patterns are not hidden nonlinearities but subgroup-specific phenomena. Together, they make a stronger case for intersectional analysis than any one method alone.
8.6. Bangladesh in Global Perspective
Our sample’s literacy rate of 23% falls below the global (33%) and South Asian (24%) averages (
Klapper et al., 2015). The 11.7 pp composite gap in our data exceeds the developing economy average (9 pp) but is below Bangladesh’s national 19 pp (
Demirgüç-Kunt et al., 2022), which is consistent with conservative bias from an advantaged sample; compound vulnerability patterns are, if anything, sharper nationally. Mobile lifted aggregate access, but equity gaps persist at the mobile/low-education intersection, a pattern consistent with Findex and relevant to LMICs with similar mobile-gated landscapes. We avoid broad worldwide generalisation.
9. Conclusions
This paper set out to ask where the gender gap resides and how far access falls at the intersection of several disadvantages. The answer to the first is that, within our sample and corroborated by Findex, the adjusted gap is primarily, not exclusively, in mobile money: no significant banking gap after controls, but men have ~twice the odds of mobile money access (OR ≈ 2.0), a pattern that holds in nationally representative data. Among the least educated nationally, a banking gap remains (Findex), closing with education; education closes the banking gap, not the mobile gap.
The answer to the second is that exclusion is sharply concentrated but additively, so 376 women with below SSC education and no income (12% of sample) reach only 21% high access, and the worst three-way cell (women, below SSC, no income) is just 12.3%, which is well below the sample average. Severity is additive, not multiplicative: a main effects model reproduces even the most excluded cell, and no two-way interaction is significant. K-Means silhouette is modest (0.203), but three algorithms (K-Means, GMM, hierarchical) all recover a severely excluded female segment, supporting a cautious cluster interpretation.
What do these findings mean for policy? We draw four implications, and each is tied directly to the evidence.
First, the gender gap in access is, concretely, a gap in mobile money adoption: once education and income are controlled, men and women in our sample are equally likely to hold and use formal bank accounts, but men remain twice as likely to hold and use a mobile wallet (
Section 5), a pattern confirmed among the secondary-educated in nationally representative data (
Section 5.1). This relocates the policy target. Programmes aimed at women’s financial inclusion should address the upstream barriers specific to mobile money, a phone registered in a woman’s own name, national ID registration, and the digital confidence to transact, rather than generic account-opening drives or literacy workshops in a banking system where we find no adjusted gender gap. It also cautions against treating the headline expansion of mobile money as automatically gender-equalising: in our data, it is the channel where the gap is widest.
Second, one-size-fits-all financial inclusion programmes, generic literacy workshops, and nationwide awareness campaigns are poorly suited to the problem we document. The compound vulnerability segments identified here are not excluded because of a single missing ingredient that a universal programme could supply. They face simultaneous barriers of gender, education, and income that reinforce one another. Reaching them requires interventions designed for their specific intersection, not for the average citizen.
Third, the compound vulnerability cluster we identify (C0: 376 women, below SSC education, no income, predominantly housewives) is not an abstraction; it is a concrete, identifiable target population. These women could be reached through community-based mobile wallet registration drives conducted at the household level, through financial education embedded in existing community health worker visits, or through deliberate linkage to microfinance networks that already operate in their villages. The strong ownership-to-usage correlations in our data () suggest that even a single successful account opening could serve as an entry point to broader financial engagement.
Fourth, the descriptive evidence that the gender gap narrows at higher education levels, while not confirmed by the formal interaction test (), is consistent with the possibility that women’s secondary education is associated with substantially better financial outcomes. If confirmed by longitudinal research, this would identify education investment not as a substitute for financial inclusion programmes but as a structural complement that addresses the root conditions under which gender becomes a barrier to access.
9.1. Limitations
The cross-sectional design precludes causal inference. The survey was not designed for intersectional analysis; a purpose-built study could stratify to ensure adequate power at all gender–education–income cells. The formal gender × education interaction is not significant, so education contingency is descriptive pending confirmation. The literacy measure captures only the knowledge component of OECD/INFE. The sample over-represents men (72.8%) and is more educated/affluent than nationally; direction is conservative (11.7 pp vs. 19 pp national gap), so compound patterns are understated. Findex validation measures ownership vs. our five-channel usage and lacks our literacy/community controls, testing qualitative persistence. One non-binary respondent was excluded from gender-stratified analyses. Brant omnibus
p = 0.170 (age varies across cut-points). K-Means silhouette 0.203 indicates modest separation; we, therefore, interpret clusters cautiously and report robustness across three methods. The 0–5 FA breadth+depth measure is justified by a bimodal 0/5 distribution and an ordinal Brant result; binary FA-high is retained for comparability with
Rahman et al. (
2022). Blinder–Oaxaca is two-fold and explained ~2/3 (endowments), with residual ~1/3 concentrated in mobile.
9.2. Future Research
The compound vulnerability framework developed here can be applied wherever disaggregated financial inclusion data exist. Several directions seem particularly promising. First, replicating this analysis in other countries with mature microfinance sectors, such as India, Kenya, and the Philippines, would test whether the compound patterns we find are a universal feature of developing country financial exclusion or specific to the Bangladeshi context. Second, longitudinal or panel data would allow researchers to establish the direction of causality between education and access: does education lead to higher access, does access lead to further education seeking, or are both driven by unobserved household characteristics? Our cross-sectional design cannot answer this question. Third, our financial literacy measure captures only the knowledge component of the OECD/INFE framework; incorporating attitudes and behaviour could reveal which dimension of literacy is most consequential for access among different population segments. Fourth, the survey dates to November 2021, and the mobile financial services landscape in Bangladesh has evolved rapidly since then. A replication with post-2023 data would show whether the compound vulnerability patterns have shifted as digital access has broadened, or whether the most excluded segments have been left behind even as aggregate numbers improve.