1. Introduction
Central bank communication has become an operating instrument of monetary policy. Policy decisions affect asset prices not only through unexpected changes in the current policy rate but also through information about the future policy path, the central bank’s assessment of the economy, and the uncertainty surrounding both. The distinction is economically important because an unchanged rate decision can still generate substantial repricing when the accompanying message alters expectations.
Gürkaynak et al. (
2005) show that Federal Open Market Committee (FOMC) announcements contain separate target and policy path factors, with the path component accounting for much of the explainable movement in longer-term yields.
Swanson (
2021) further distinguishes conventional policy, forward guidance, and asset purchase news. Communication is therefore part of the monetary policy shock rather than a neutral explanation delivered after the decision (
Blinder et al., 2008).
Most empirical research initially treated communication as text. Statements, minutes, speeches, and press reports have been analysed for sentiment, policy stance, uncertainty, novelty, and disagreement.
Hansen and McMahon (
2016) distinguish forward guidance language from information about economic conditions.
Ehrmann and Talmi (
2020) find that material changes in central bank wording are associated with greater market volatility, while semantically similar statements are processed more smoothly.
Jarociński and Karadi (
2020) demonstrate that central bank announcements can combine monetary policy shocks with information shocks about the economic outlook.
Cieslak and Schrimpf (
2019) similarly show that non-monetary news is particularly prevalent in contextual forms of communication. Such findings make clear that market reactions cannot be attributed to tone or delivery unless policy news, economic information, and textual content are represented separately.
The post-meeting press conference creates a particularly informative setting. Prepared remarks remain tightly controlled, but the question-and-answer session requires the Chair to respond in real time, interpret incoming questions, acknowledge uncertainty, and reconcile the Committee’s position with rapidly changing conditions.
Acosta et al. (
2025) show that press conferences contain economically important news independent of the associated policy statements.
Narain and Sangani (
2026) document frequent reversals between statement window- and press conference-related market movements, together with substantially higher press conference-related equity volatility during the Powell era.
Byun et al. (
2026) find that statements provide comparatively coarse policy signals, while press conferences communicate more graduated information that is related to future policy rates and intraday asset price changes. Live interaction can therefore refine, qualify, or partially reverse the written message.
Live communication contains lexical, acoustic, and visual information.
Gorodnichenko et al. (
2023) report market relations for acoustic vocal emotion, while
Marchal (
2020) reports relations for visual behaviour. These studies motivate a strict separation between transcript-derived lexical measures and non-verbal measures. The present paper studies the lexical channel only. Acoustic and visual results therefore provide neighbouring evidence, not proxies for the variable estimated here.
Risk-related wording also has an ambiguous economic meaning. A response might reveal a new concern, acknowledge a known concern, qualify earlier guidance, or resolve uncertainty through clarification. A conference-level dictionary count therefore mixes communicative functions with different expected market effects. The empirical question in the present study asks whether the net lexical signal retains any association with cross-asset response magnitude after policy news and event characteristics enter the model.
Existing research leaves a narrower lexical question open. Prior studies document monetary policy surprises, semantic novelty, policy stance, uncertainty language, acoustic emotion, and visual behaviour. Less evidence tests whether a transparent risk-word measure adds event-level predictive content after policy surprise controls across several asset classes. Conference aggregation also raises a measurement issue because risk revelation and risk resolution might occur within the same Q&A session.
The study asks whether risk-related words in FOMC press conferences predict the magnitude of financial market responses after conventional monetary policy surprises and observed event characteristics enter the specification. The design compares prepared remarks with Q&A speech, separates lexical content from policy news, and evaluates in-sample fit together with out-of-sample prediction. The analysis does not treat transcript words as a measure of the Chair’s voice.
The dataset contains 93 official FOMC press conference transcripts from April 2011 to June 2026. The prespecified estimation sample contains 90 scheduled conferences. Chair responses are separated into opening remarks and Q&A speech. A transparent lexical risk index combines standardised frequencies of negative, uncertainty, and weak modal terms from the Loughran–McDonald financial dictionary (
Loughran & McDonald, 2011). The principal dependent variable is an equal weight index of absolute S&P 500 returns, two-year and ten-year Treasury yield changes, and US dollar returns during the 70 min press conference window. Policy surprise magnitude, Chair word count, Summary of Economic Projections meetings, Chair tenure, the 2020 period, and calendar trend enter as controls. Predictive comparisons, influence diagnostics, alternative outcome constructions, and asset-specific models supplement HC3 inference.
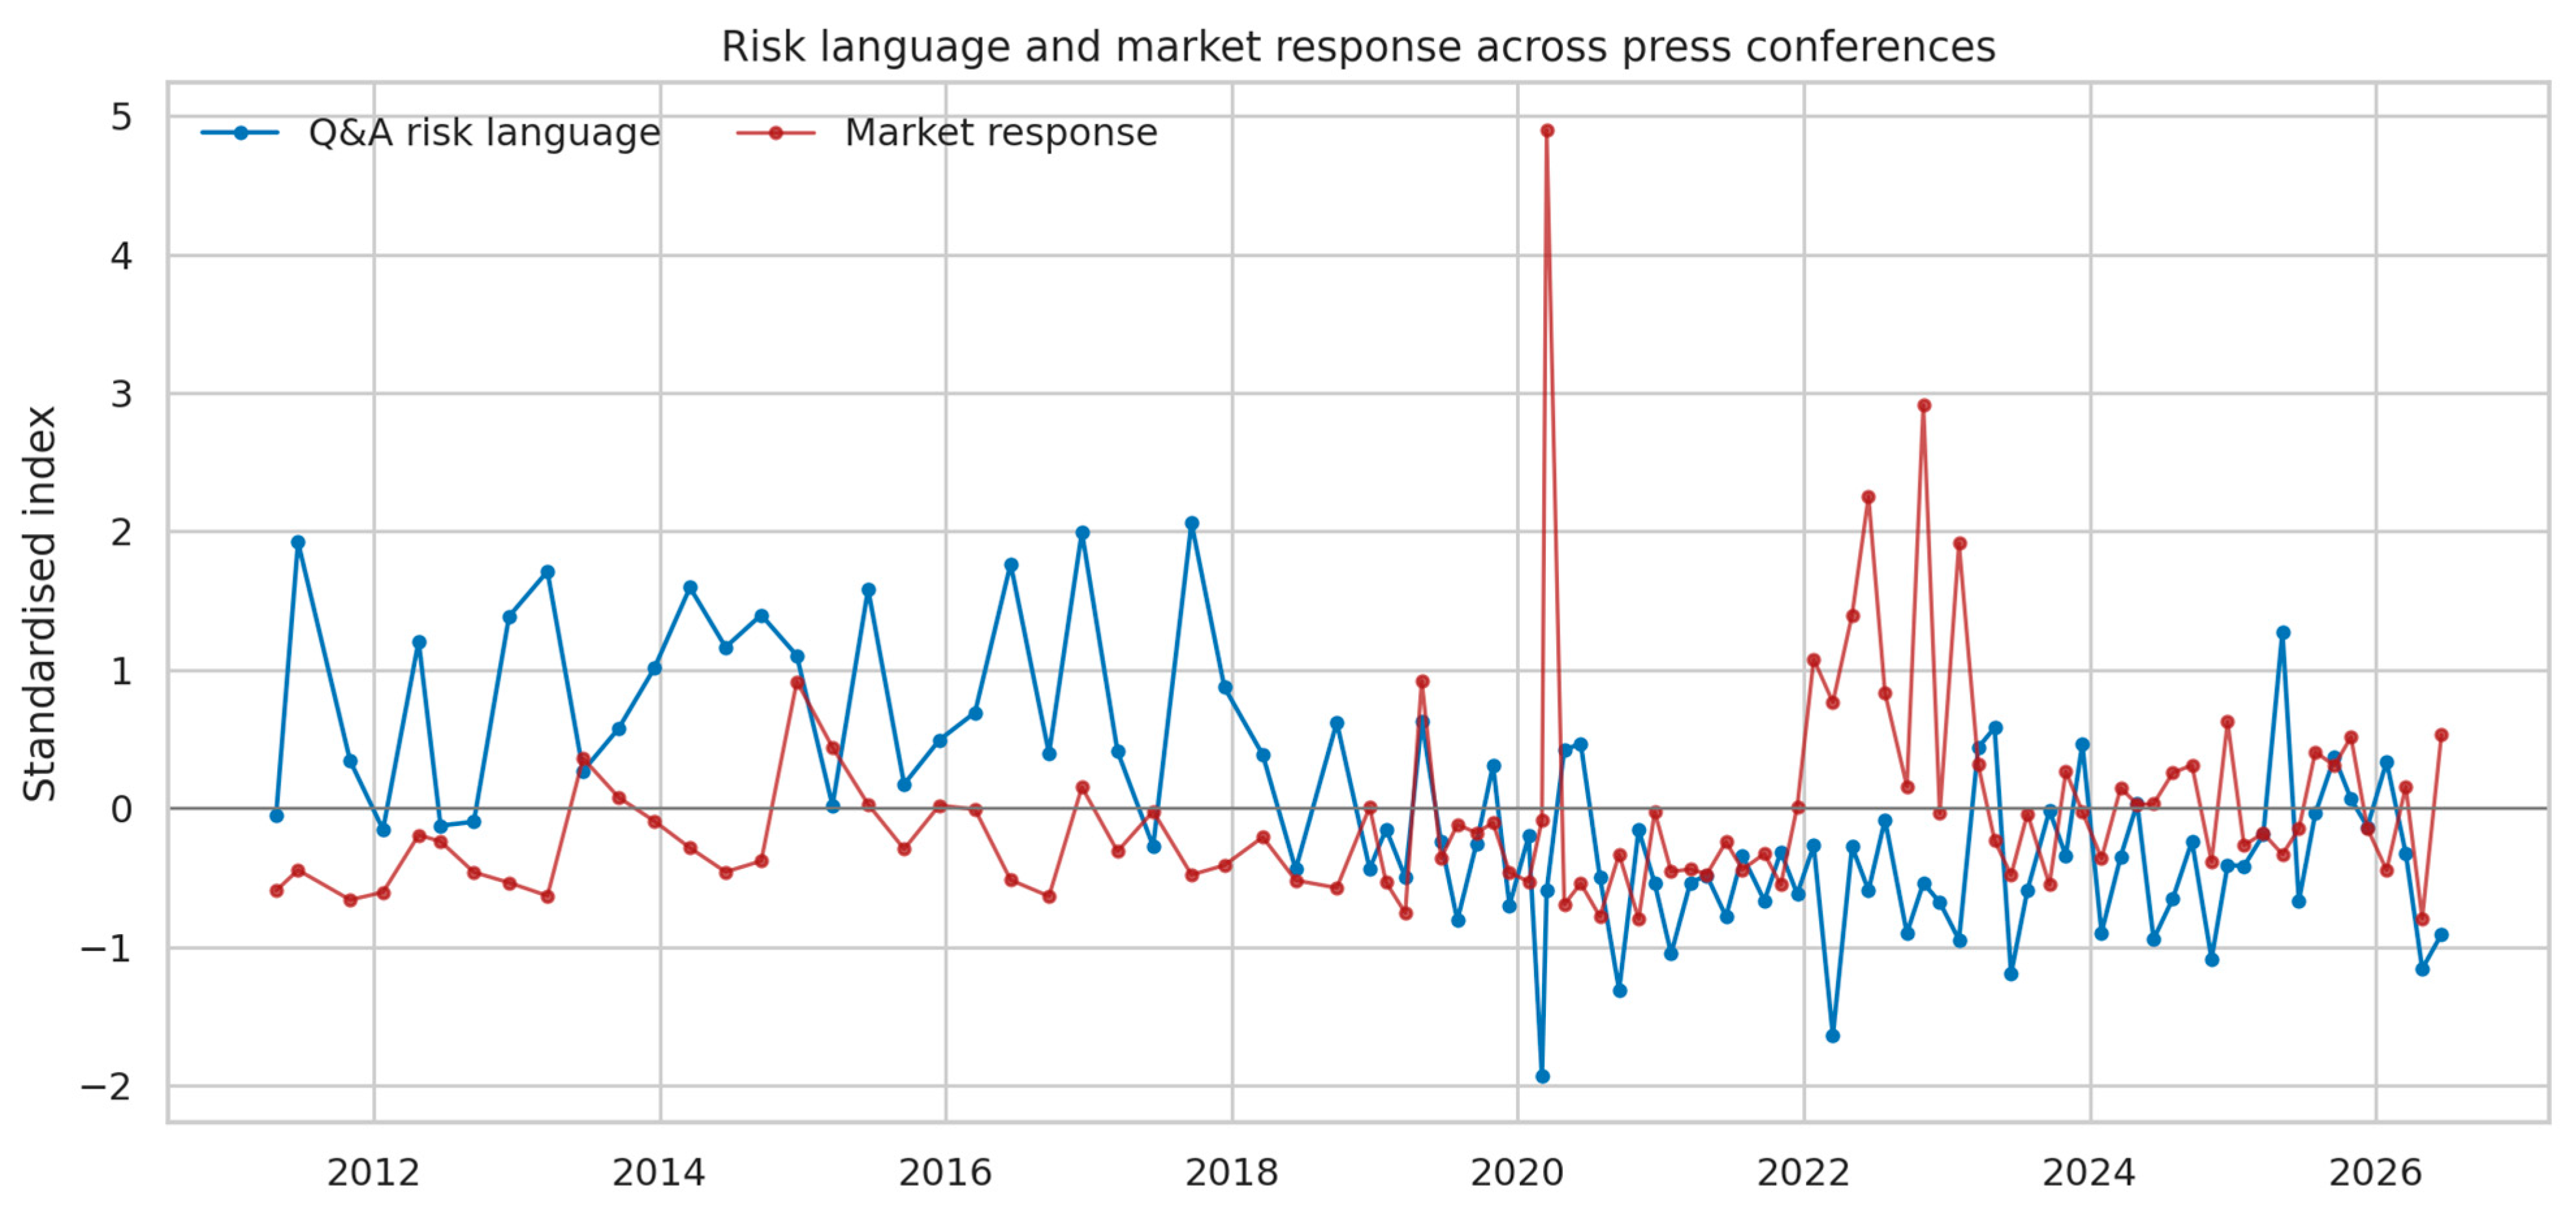
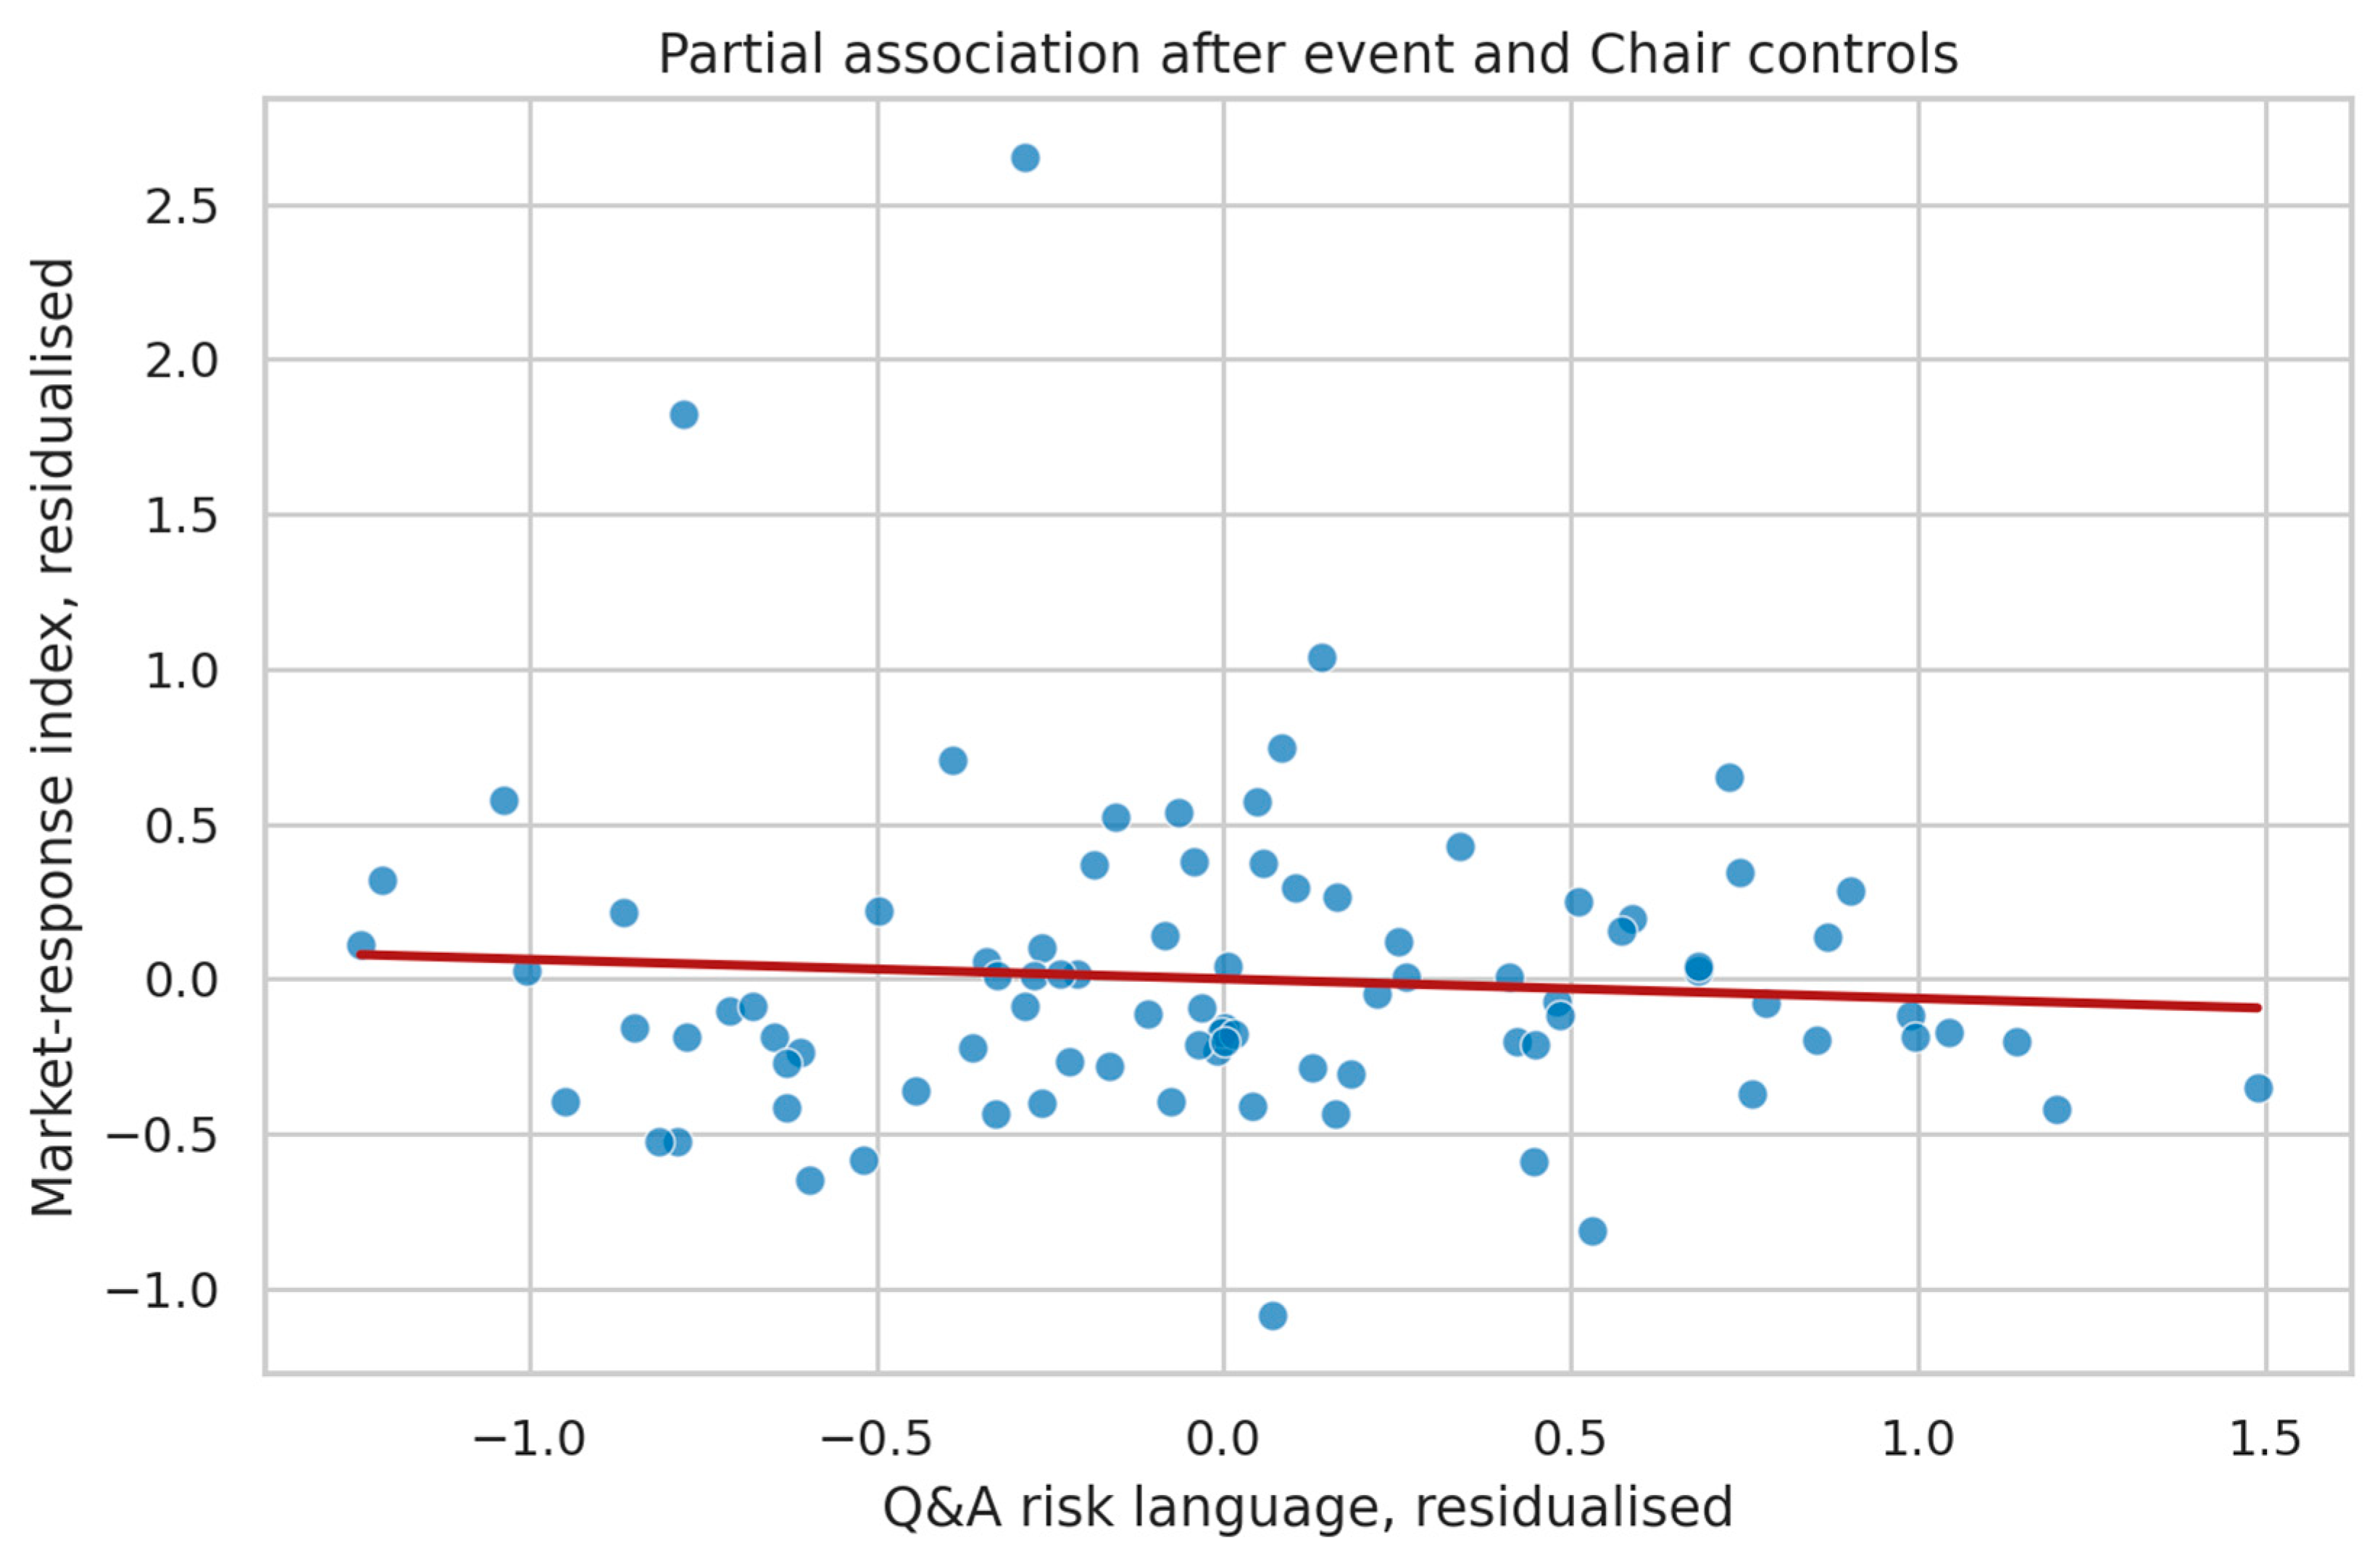
Results from the lexical benchmark do not support the predicted positive relationship. The full-model coefficient on Q&A risk language is −0.063, with an HC3 standard error of 0.082 and a two-sided p-value of 0.444. Its 95% confidence interval ranges from −0.226 to 0.100. Adding the risk index increases in-sample R2 by only 0.0034 and produces a partial R2 of 0.0072. Leave-one-out cross-validation worsens prediction error by 0.60% relative to the control model. No asset-specific coefficient is statistically significant, and the conclusion remains unchanged under Newey–West inference, winsorisation, alternative composite measures, rank-based estimation, or restriction to audio-linked events. Policy surprise magnitude, rather than lexical risk, is the consistently important predictor of absolute market movement.
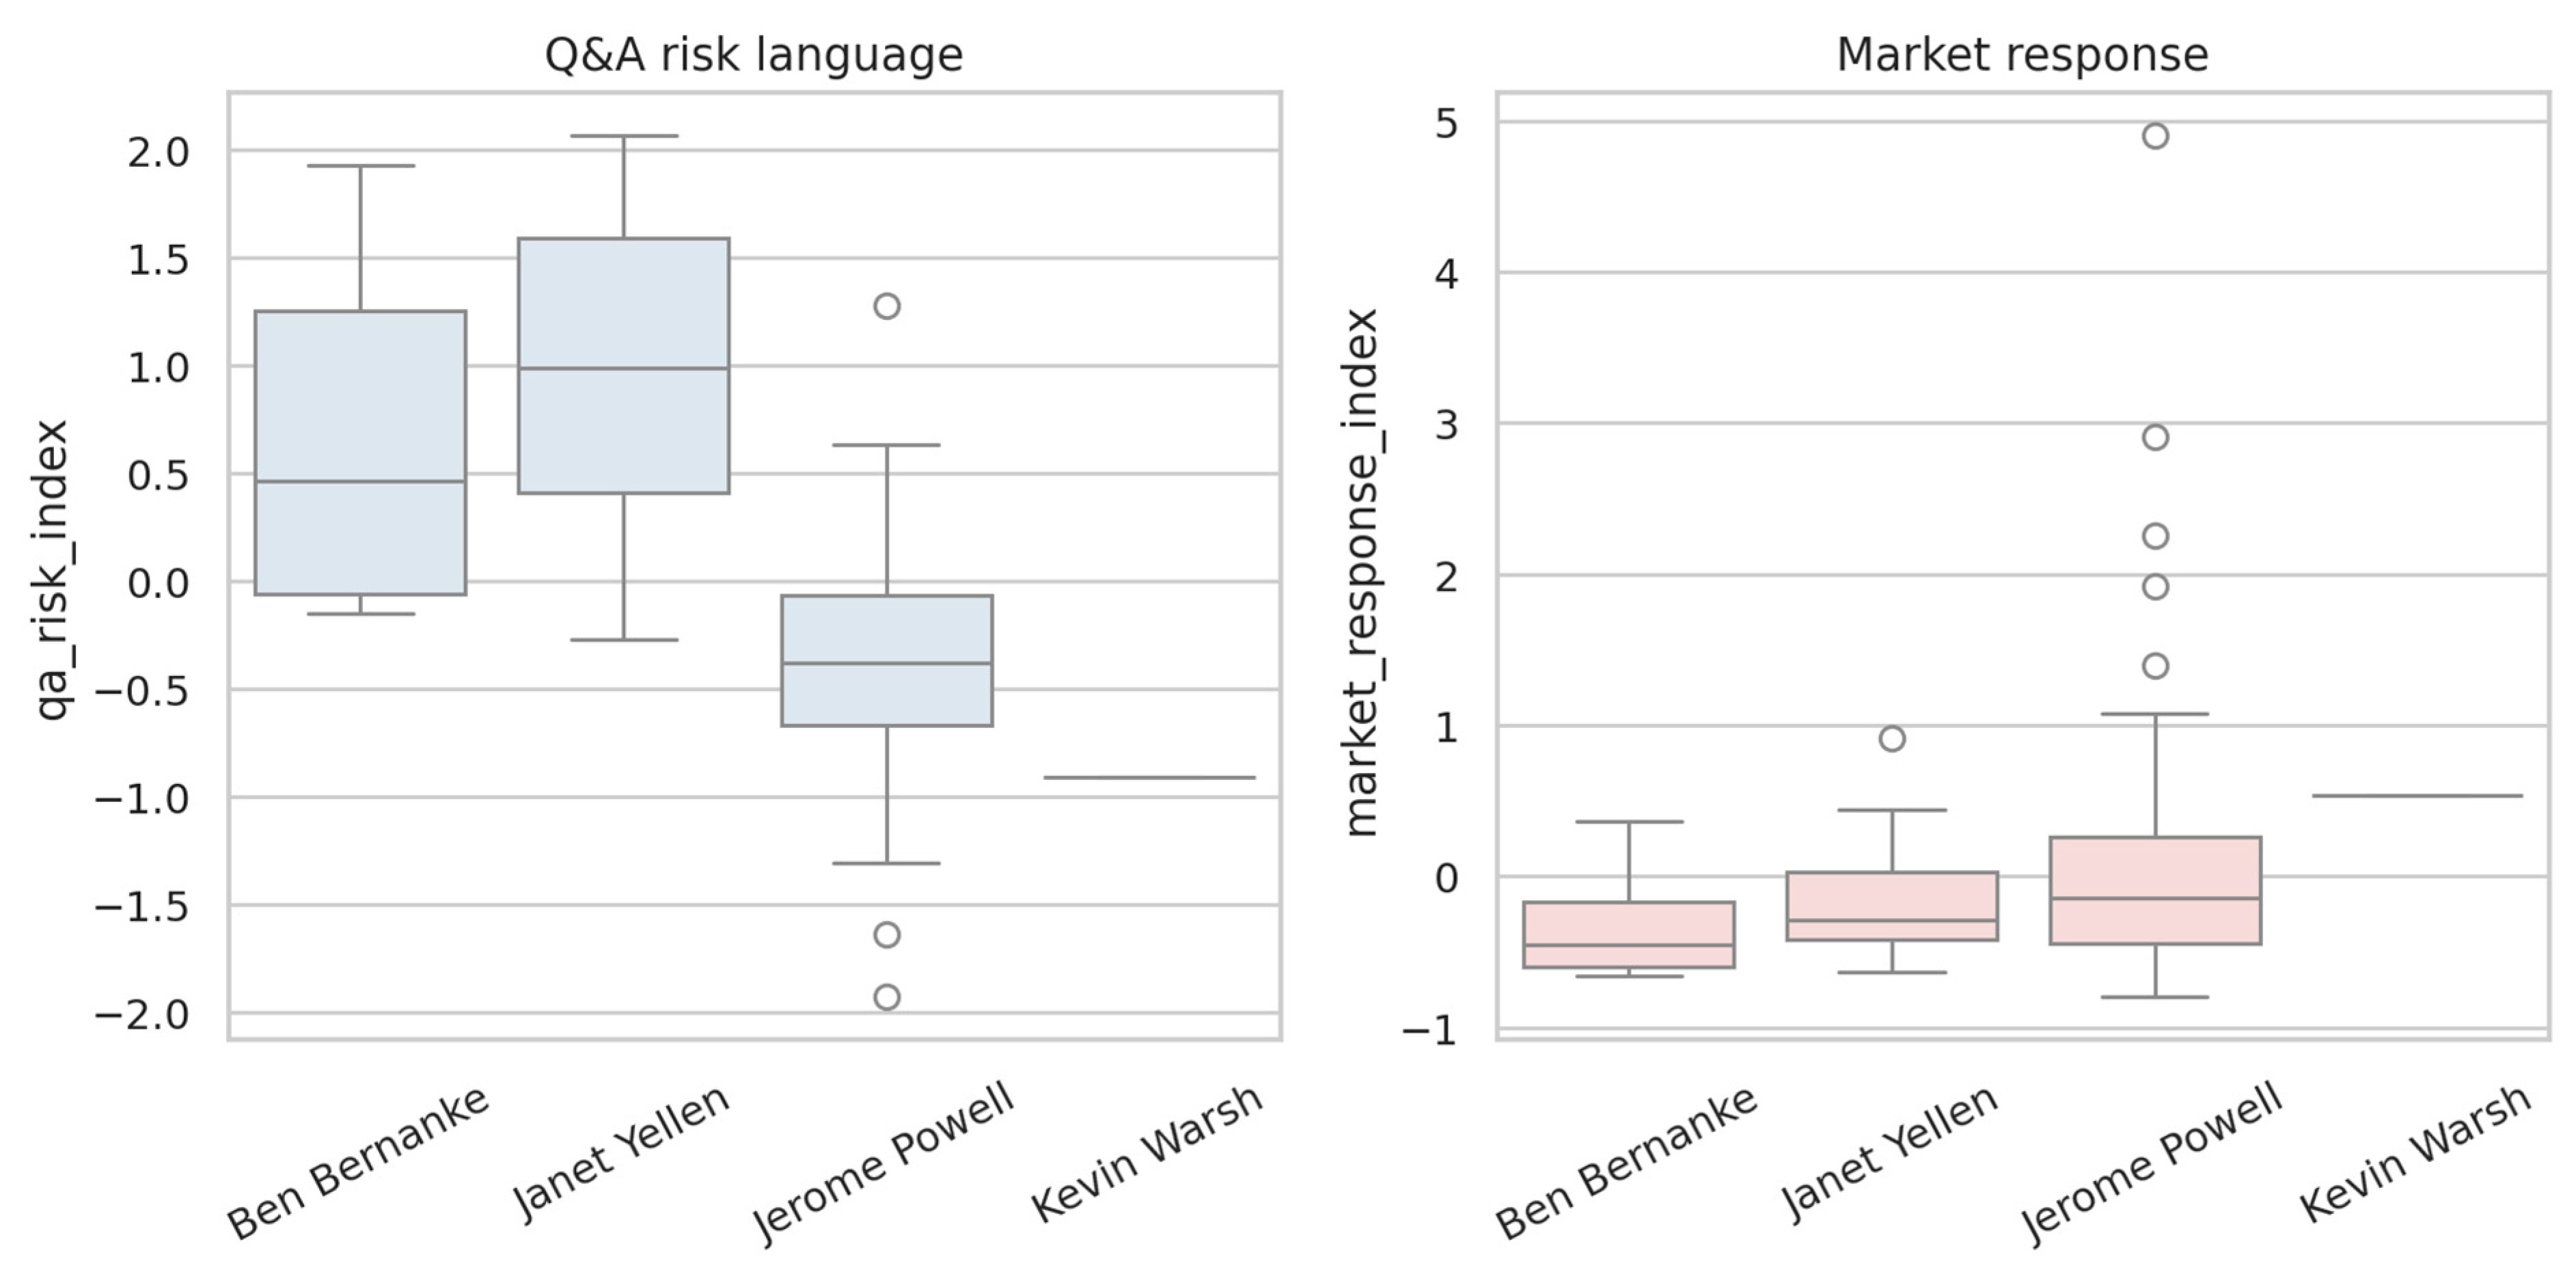
Prepared and unscripted communication also fail to display the expected ordering. A model containing both speech sections estimates a Q&A coefficient of −0.023 and an opening statement coefficient of −0.213. The difference between them is not statistically significant. Chair-specific lexical distributions differ substantially, but a risk-by-Powell interaction provides no evidence of a distinct Powell-era slope. Exploratory measures based on explicit risk terms, semantic novelty, and changes between opening remarks and Q&A do not survive false discovery rate correction.
The paper makes three contributions. First, it isolates a lexical construct and avoids labelling transcript counts as vocal signals. Second, it evaluates incremental information across four asset classes with effect sizes, confidence intervals, permutation testing, influence checks, and leave-one-out prediction. Third, it treats the null result as evidence of the limits of conference-level dictionary measures. The result sets a reproducible benchmark for later answer-level semantic or acoustic work without extending the conclusion beyond the measure observed here.
The contribution is also methodological. Communication studies often face a high-dimensional set of plausible signals, outcomes, windows, and interactions. The present framework separates confirmatory tests from exploratory tests, reports effect sizes and confidence intervals, applies false discovery rate correction, and evaluates predictive performance. Such discipline is important because isolated marginal associations can emerge easily in a sample of fewer than one hundred press conferences. Robustness across asset classes, feature constructions, inference methods, and held-out events provides a more demanding standard for claims of predictive content.
The literature-derived hypotheses are developed in
Section 2. The remainder of the manuscript proceeds as follows.
Section 2 reviews evidence on central bank communication, press conferences, textual information, and non-verbal signals.
Section 3 describes the FOMC corpus, market data, variable construction, and empirical strategy.
Section 4 presents the primary results, predictive tests, diagnostics, and robustness analysis.
Section 5 discusses the implications of the lexical benchmark and specifies the answer-level acoustic extension.
Section 6 provides the conclusion.
2. Literature Review and Hypothesis Development
2.1. Central Bank Communication as a Monetary Policy Instrument
Modern monetary policy operates through expectations as well as through changes in administered interest rates and balance sheet instruments. Communication can affect the expected path of short-term rates, beliefs about inflation and output, perceptions of the central bank’s reaction function, and the compensation investors demand for bearing risk.
Blinder et al. (
2008) describe communication as an integral part of policy implementation rather than a supplementary exercise in transparency. Their synthesis also identifies an enduring empirical difficulty: a central bank message can clarify policy and reduce uncertainty, but it can also reveal previously unknown information and generate immediate repricing. Lower volatility is therefore not an automatic indicator of effective communication, and higher volatility is not necessarily evidence of failure. The direction of the response depends on what the market learns and how far that information departs from prior beliefs.
High-frequency research established that the information released at Federal Open Market Committee (FOMC) events cannot be represented by the unexpected change in the current federal funds rate alone.
Gürkaynak et al. (
2005) identify separate target and path factors in intraday asset price changes around FOMC announcements. The target factor captures news about the current policy rate, while the path factor is closely associated with the accompanying statement and expectations of future policy. Their estimates indicate that the statement-related factor accounts for more than three-quarters of the explainable movement in five- and ten-year Treasury yields around FOMC meetings. Communication therefore moves markets partly because it changes the expected sequence of future decisions even when the current decision is fully anticipated.
Equity market evidence reinforces the economic importance of policy surprises.
Bernanke and Kuttner (
2005) estimate that an unexpected 25-basis-point reduction in the federal funds rate is associated, on average, with an equity market increase of approximately 1%. Their decomposition points towards changes in expected excess returns and, to a lesser extent, expected dividends and real interest rates. Later work extends the set of policy instruments that must be represented in event studies.
Swanson (
2021) separates conventional policy, forward guidance, and large-scale asset purchases, showing that the latter two dimensions have distinct effects on financial markets. Vocal signal research must consequently control for multiple forms of monetary news rather than use a single rate-surprise variable as a sufficient representation of the FOMC event.
Written communication also contains information about the central bank’s assessment of economic conditions.
Hansen and McMahon (
2016) use computational linguistics methods to distinguish statements about the expected policy path from statements about the economic outlook. Their results assign a larger role to forward guidance language in explaining yields, although the estimated effects on real variables are comparatively limited.
Shapiro and Wilson (
2022) take a different approach, using FOMC language to infer the relative weights placed on inflation and economic slack. Taken together, these studies show that market participants can learn both about prospective policy and about the policymaker’s objectives or economic assessment. An observed association between vocal delivery and market volatility may therefore represent policy path news, macroeconomic information, a change in perceived confidence, or some combination of these channels.
2.2. Written Language, Novelty, Sentiment, and Uncertainty
The textual literature demonstrates that market reactions depend on how a message is framed and how far it departs from established communication.
Ehrmann and Talmi (
2020) measure semantic similarity across successive central bank statements. More similar statements are absorbed with lower financial market volatility after controlling for content, while material changes in wording produce higher volatility. The result provides a direct connection between communicative novelty and the cost of interpretation. It also implies that a vocal risk coefficient can be biased if unusual delivery coincides with an unusually novel statement. Textual novelty should therefore enter the empirical design separately from hawkishness, dovishness, or general sentiment.
Text-based uncertainty measures supply a second set of relevant controls.
Baker et al. (
2016) construct an economic policy uncertainty index from newspaper coverage and validate it against human-coded articles and identifiable policy events. Broad policy uncertainty can influence both the language used by policymakers and the volatility prevailing before an FOMC event. Controlling for such uncertainty helps distinguish a genuinely event-specific vocal signal from the possibility that the Chair and the market are responding to the same difficult macroeconomic environment.
Banerjee et al. (
2025) show that the financial press provides an informative interpretive layer between official communication and market response. Their policy-specific dictionaries distinguish conventional policy, quantitative easing, and forward guidance. Surprises in the resulting sentiment index explain movements across major asset classes beyond market-based monetary policy surprises, including during the post-COVID period. The finding is important for vocal analysis because investors do not necessarily react to raw acoustic information in isolation. Media interpretation can amplify, translate, or stabilise the signal, and the response may continue after the press conference as coverage circulates.
Recent language model research expands the range of semantic measures available for FOMC documents.
Shah et al. (
2023) introduce a large annotated dataset of FOMC speeches, minutes, statements, and press conference transcripts and formulate hawkish–dovish classification as a finance-specific task.
Nakayama and Sawaki (
2023) apply zero-shot textual entailment to statements, minutes, press conferences, and speeches, illustrating how transformer models can detect policy tone without relying solely on fixed dictionaries.
Kim et al. (
2023) compare VADER, FinBERT, and a trial application of GPT-4, reporting both improved domain sensitivity and persistent difficulties arising from formulaic, deliberately unemotional FOMC language.
Peskoff et al. (
2024) use GPT-based measurement to study hawkish–dovish disagreement and find that public statements suppress much of the diversity visible in minutes and transcripts. These results support the use of modern semantic controls, but they also warn against treating any single model-generated score as ground truth.
Transparency creates an additional institutional complication.
Hansen et al. (
2018) use a natural experiment and computational linguistics methods to examine how greater transparency altered FOMC deliberation. Their evidence is consistent with both discipline and conformity effects. Public communication may become more careful and uniform when participants expect disclosure, meaning that written text can understate internal disagreement or uncertainty. Vocal delivery during live questioning may be less completely standardised and may therefore reveal information not preserved in edited statements or delayed minutes.
2.3. The Press Conference as a Distinct Information Event
The post-meeting press conference is not a verbal restatement of the FOMC announcement. Its prepared opening remarks remain highly controlled, but the question-and-answer segment requires the Chair to respond in real time to unexpected prompts, reconcile the Committee’s position with personal interpretation, and explain uncertainty that may have been compressed in the written statement. The institutional separation between the statement window and the press conference window permits researchers to test whether the later event contains independent information.
Acosta et al. (
2025) provide the most comprehensive recent infrastructure for such analysis through the US Monetary Policy Event-Study Database. Their database covers statements, minutes, and press conferences and includes a broad set of risk-free rates and risky asset prices. Their results show that press conferences contain important monetary news independent of the associated statements. Conference surprises have strong effects on Treasury yields and risky assets, and excluding them can omit a substantial part of the market’s response to FOMC communication. The result directly supports separate outcome windows for the statement and the press conference.
Narain and Sangani (
2026) document a marked change under Chair Jerome Powell. Squared S&P 500 returns during Powell’s press conferences are more than three times their average level during the Bernanke and Yellen conferences despite similar volatility around the preceding statement release. Reversals are especially informative. Market movements during the press conference often run in the opposite direction to the initial response to the statement. Textual analysis links these reversals partly to language that departs from the statement, while Treasury option evidence suggests weaker resolution of uncertainty about the future path of rates. Their interpretation remains appropriately qualified because greater flexibility and clearer recognition of uncertainty may be valuable during rapidly changing conditions even when volatility increases.
Byun et al. (
2026) reach a related conclusion using a finance-specific language model. FOMC statements often provide coarse hawkish, neutral, or dovish signals, whereas press conferences contain a more graduated mixture of policy language. The additional variation is correlated with future federal funds rates and with intraday asset price changes that reverse the statement window-related movement. Press conferences therefore fine-tune the policy message and help investors revise expectations about future policy. A vocal signal should be evaluated against that granular semantic information rather than against statement sentiment alone.
Cross-speaker evidence shows that consistency within the institution also affects transmission.
Djourelova et al. (
2025) analyse 481 time-stamped speeches by FOMC members and measure their textual alignment with the Chair’s recent communication. Average market responses to individual speeches are modest, but the conditional pattern is pronounced. Closely aligned speeches raise short-term rates, reduce breakeven inflation, and transmit like conventional monetary policy shocks. Divergent speeches lift the yield curve, inflation expectations, and equity prices, suggesting that investors read them as news about economic fundamentals rather than as a straightforward policy signal. Coordination strengthens monetary transmission, while visible disagreement can dilute it.
Schmanski et al. (
2023) broaden the communication system further by examining official messages alongside news and social media discussion. Their framework draws attention to propagation and disagreement outside the immediate release window.
Bauer and Wasserburger (
2026) similarly emphasise that surprises around FOMC statements and post-meeting press conferences affect inflation expectations. The implication for the present study is that vocal delivery can influence volatility directly within the event window and indirectly through subsequent interpretation. Intraday outcomes provide the cleanest initial test, while longer windows can capture slower processing at the cost of greater exposure to confounding news.
2.4. Vocal and Non-Verbal Information
Gorodnichenko et al. (
2023) provide the closest empirical foundation for analysing Federal Reserve voice. They apply deep learning to audio from the Q&A portions of FOMC press conferences and classify emotional tone using a large set of acoustic features, including Mel-frequency cepstral coefficients, chromagram information, and Mel-scaled spectral measures. Their design controls for policy actions and textual sentiment. A more positive vocal tone is associated with higher share prices, lower perceived interest rate risk, lower expected volatility, lower inflation expectations, and exchange rate movements. High-frequency estimates show an immediate stock price response at answer level, while part of the broader reaction develops more slowly as investors and media interpret the signal. Bond market responses are less uniform.
The economic interpretation of vocal positivity is not unique. A confident or positive delivery may operate as informal forward guidance by indicating a low probability of near-term tightening. It may communicate favourable private information about economic conditions. It may also reduce ambiguity by increasing perceived confidence in the policy path.
Gorodnichenko et al. (
2023) explicitly recognise these competing explanations. Their evidence establishes that voice contains incremental market-relevant information, but it does not convert vocal tone into a pure structural monetary policy shock.
Marchal (
2020) provides complementary evidence from video rather than audio. Computer vision methods identify how frequently the Chair consults internal documents while answering reporters, producing an attention-based measure of discussion complexity. More complex discussions are associated with higher equity returns and a reduction in realised volatility from before to after the conference. The result is consistent with uncertainty resolution. Difficult questions can initially signal complexity, yet a substantive answer can release valuable information and lower residual uncertainty. Non-verbal intensity should therefore not be mechanically interpreted as risk increasing. The market response depends on whether the behaviour exposes unresolved uncertainty or helps resolve it.
Ahrens et al. (
2025) extend communication research beyond scheduled FOMC meetings. Their time-stamped dataset of Federal Reserve speeches and supervised multimodal language model maps speech content into implied revisions of forecasts for inflation, output, and unemployment. Speech-implied forecast revisions explain realised volatility and tail risk in equity and bond markets. Chair speeches generate larger revisions and are unconditionally associated with stronger volatility and tail risk responses. Evidence that hawkishness systematically changes these effects is weaker and appears regime dependent. The paper demonstrates that market risk responds to the economic information embedded in speech, but it also underscores the need to separate semantic forecast news from acoustic delivery.
The combined evidence establishes three points. First, live communication contains information that is absent from written policy documents. Second, non-verbal cues can have economically meaningful effects after textual content and policy actions are controlled. Third, the sign of the volatility response is conditional rather than universal. Positive vocal tone can reduce perceived risk, complex interaction can resolve uncertainty, and forecast revisions can increase or decrease volatility depending on their content and the macroeconomic regime. A risk-specific vocal construct must capture the relevant acoustic state without assuming that all deviations from neutral delivery are destabilising.
2.5. Economic Mechanisms Linking Risk Communication to Market Responses
Four mechanisms organise the empirical evidence. The first is a policy path channel. Vocal tension, hesitation, or reduced confidence may cause investors to widen the distribution of expected future policy rates even when the modal path is unchanged.
Gürkaynak et al.’s (
2005) path factor,
Swanson’s (
2021) forward guidance factor, and the press conference evidence of
Byun et al. (
2026) all show that information about future policy can dominate news about the current rate decision. A vocal risk signal may alter the precision of the communicated path rather than its average hawkish or dovish direction.
The second is a central bank information channel.
Jarociński and Karadi (
2020) demonstrate that an announcement simultaneously conveys policy news and information about the central bank’s economic outlook. Their identification uses the sign of high-frequency interest rate and equity price comovement. A tightening shock raises rates and lowers equities, while favourable information raises both.
Cieslak and Schrimpf (
2019) likewise find that non-monetary news is present in approximately 40% of Fed and European Central Bank policy announcements and is even more prevalent in contextual communications such as press conferences. Vocal risk may therefore reveal concern about growth, inflation, financial stability, or model uncertainty rather than a planned policy action.
The third is an uncertainty resolution channel. Similar written statements are processed with less volatility, while material wording updates are harder to absorb (
Ehrmann & Talmi, 2020). Complex Q&A interactions can nevertheless reduce realised volatility when they provide information that resolves previously unsettled questions (
Marchal, 2020). Vocal arousal may increase volatility when it signals unresolved concern, but it may reduce volatility when it accompanies a candid and informative explanation. The net coefficient can be small if these opposing cases are aggregated at conference level.
The fourth is a credibility and coordination channel. A delivery style that appears inconsistent with the literal content may weaken the credibility of the message. Similarly, a speech that diverges from the Chair’s prior communication changes how markets classify the shock (
Djourelova et al., 2025). The economically relevant variable may therefore be acoustic–semantic congruence rather than vocal tone alone. A calm delivery attached to risk-heavy language can reassure investors, while a strained delivery attached to reassuring words can indicate concealed uncertainty. Such mismatch offers a plausible explanation for why purely lexical risk measures or conference-level average tone may have limited predictive power.
2.6. Measurement of Lexical and Non-Verbal Communication
Vocal risk measurement must remain conceptually separate from textual sentiment. Acoustic features such as pitch level and dispersion, intensity, speaking rate, pause frequency, jitter, shimmer, spectral balance, and harmonics-to-noise characteristics describe delivery. They do not possess invariant economic meaning on their own. Speaker anatomy, age, microphone placement, room acoustics, compression, illness, and recording technology can shift these measures independently of policy concern. Speaker standardisation, recording quality controls, meeting fixed effects where feasible, and sensitivity tests across acoustic feature families are necessary before interpreting a composite index.
The deep learning approach of
Gorodnichenko et al. (
2023) shows the value of learning nonlinear relationships across many acoustic features. Its use of general emotion-recognition datasets also identifies a limitation relevant to the proposed study. Generic categories such as happy, sad, angry, fearful, or neutral are not identical to economically meaningful vocal risk. A Chair can sound serious without conveying uncertainty, and a technically calm answer can introduce highly destabilising information. Construct validity improves when acoustic features are calibrated against manually coded FOMC answers that distinguish concern, uncertainty, confidence, urgency, and ordinary formality.
Semantic controls should also be plural rather than model dependent. Dictionary-based risk counts are transparent but can miss negation, conditionality, and domain-specific context. Finance-tuned transformers improve contextual classification but may be unstable across prompts, training periods, or document types. The evidence in
Shah et al. (
2023),
Nakayama and Sawaki (
2023),
Kim et al. (
2023), and
Peskoff et al. (
2024) supports a validation strategy that compares dictionary, transformer, and human-coded measures. Agreement across methods strengthens interpretation. Disagreement should be reported rather than hidden through a single composite score.
Granularity is equally important. Conference averages combine prepared remarks, straightforward questions, difficult follow-ups, and answers addressing different economic topics.
Gorodnichenko et al. (
2023) estimate answer-level responses and also examine cumulative information during the conference. Their distinction is well suited to vocal risk. Answer-level models preserve local changes in delivery and permit alignment with minute-by-minute returns or realised variance. Conference-level models provide a lower-noise summary but risk cancelling episodes with opposite effects. A hierarchical design can use answers nested within conferences, with conference, Chair, topic, and time controls.
2.7. Identification and Market Response Outcomes
Narrow event windows reduce reverse causality because the policy decision precedes the market response, but they do not automatically identify the content of the shock.
Jarociński and Karadi (
2020) show that policy and information shocks can occur in the same announcement.
Cieslak and Schrimpf (
2019) further separate monetary, growth, and risk premium news.
Bauer and Swanson (
2023) document that high-frequency monetary policy surprises are correlated with macroeconomic and financial information available before the event. Their Fed-response-to-news interpretation implies that market participants may underpredict how strongly the FOMC reacts to public information. Orthogonalising surprises against pre-event data changes macroeconomic estimates materially, although high-frequency asset price estimates remain comparatively stable.
The identification problem is particularly relevant for vocal risk. Difficult macroeconomic conditions can generate both a strained delivery and high market volatility. A credible design should condition on the pre-conference volatility state, scheduled macroeconomic news, policy surprise factors, statement window returns, textual policy stance, textual risk, semantic novelty, and the economic topics discussed. Chair and era controls are also necessary because communication practice, press conference frequency, and recording technology differ across Bernanke, Yellen, and Powell.
Event window construction requires similar care.
Lucca and Moench (
2015) document a sizeable pre-FOMC equity drift, showing that FOMC day returns are not confined to the announcement itself.
Acosta et al. (
2025) separate statement, minutes, and press conference surprises and demonstrate that each event carries distinct information. Statement window outcomes should not be mixed with press conference outcomes when voice is the treatment of interest. A clean design can use statement window movements as controls and measure volatility from the beginning of the Chair’s spoken communication, ideally at answer or sub-answer frequency.
Realised volatility, implied volatility, absolute returns, squared returns, and tail risk measures capture different responses.
Narain and Sangani (
2026) focus on squared intraday returns and Treasury implied volatility.
Marchal (
2020) studies changes in realised equity volatility before and after the conference.
Ahrens et al. (
2025) examine realised volatility and tail risk across equity and bond markets.
Gorodnichenko et al. (
2023) analyse stock prices, the VIX and VIX futures, inflation expectations, exchange rates, and bond market variables. A multi-outcome design is therefore preferable, but the primary outcome and horizon should be prespecified to limit specification search.
Broader comparative evidence cautions against assuming that findings transfer mechanically across institutions.
Aguilar and Pérez-Cervantes (
2022) use natural language processing and market data to study communication in Mexico, while
Goodhead and Kolb (
2025) separate communication shocks from conventional policy actions and trace their macroeconomic consequences. Institutional credibility, communication conventions, market depth, and press conference design can all affect the response. Focusing on Federal Reserve communications improves internal consistency, although it narrows external validity.
2.8. Research Gap and Contribution
Prior evidence shows that FOMC policy news, textual stance, semantic novelty, acoustic emotion, and visual behaviour relate to financial market outcomes. A narrower empirical issue remains open: does conference-level risk-related language add information about absolute market response magnitude after policy surprise controls? The question differs from tests of realised volatility and from tests of acoustic delivery.
Three points motivate the design. Risk dictionaries offer transparent replication and weak contextual interpretation. Conference averages combine answers with different communicative functions. Small event samples also make in-sample associations vulnerable to influential meetings and specification search. The present study therefore gives priority to construct clarity, policy surprise controls, effect-size reporting, and out-of-sample prediction.
The present study addresses the lexical part of the problem. It constructs a conference-level Q&A lexical risk index, compares it with an opening statement index, controls for press conference policy surprises and event characteristics, and evaluates predictive performance. Answer-level acoustic features, sentence-level semantic coding, realised volatility, and acoustic–semantic disagreement fall outside the reported estimates.
The coefficient therefore has an associational interpretation. Policy surprises, Chair effects, event controls, and narrow windows reduce several sources of confounding. They do not identify a causal effect of wording. Omitted pre-event volatility, same-day macroeconomic news, statement window reactions, and topic-specific information remain plausible common causes.
2.9. Study Hypotheses
H1. Higher Q&A lexical risk intensity is associated with larger cross-asset market response magnitude during the press conference window.
Risk-related wording might accompany new information, uncertainty, or larger policy path revisions. The directional hypothesis provides a direct test of the lexical measure used in the reported models.
H2. Q&A lexical risk intensity adds explanatory and out-of-sample predictive information beyond policy surprise magnitude and the prespecified event controls.
The hypothesis concerns incremental information after policy news enters the model. In-sample R2, partial R2, permutation inference, and leave-one-out prediction provide separate tests.
H3. The association between lexical risk and market response magnitude is stronger for unscripted Q&A speech than for prepared opening remarks.
Q&A answers involve spontaneous clarification and a wider range of topics. A joint model containing the Q&A and opening statement indices tests the proposed difference directly.
2.10. Synthesis of the Closest Empirical Evidence
Table 1 synthesises the closest empirical evidence and shows how prior findings on policy signals, semantic content, vocal delivery, and press-conference dynamics inform the empirical design of the present study.
3. Materials and Methods
3.1. Study Design and Evidential Scope
The dataset supports an event-level analysis of lexical risk derived from official press conference transcripts and absolute financial market responses in a 70 min window. The reported variables do not include pitch, intensity, speech rate, pauses, disfluency, jitter, shimmer, or voice quality. Sixty-nine events have links to official recordings without speaker-segmented acoustic measurements in the analysis archive.
The paper therefore tests lexical risk and market response magnitude. It does not test acoustic vocal risk or realised intraday volatility. Terms such as lexical risk, market response magnitude, and absolute market movement describe the reported evidence throughout the revised text.
The principal empirical result is a bounded null. Q&A lexical risk does not add detectable explanatory or predictive information after policy surprise magnitude and event characteristics enter the model. The coefficient remains imprecise, the confidence interval spans negative and small positive values, and the 90-event sample offers limited sensitivity to small effects.
3.2. Event Universe
The event panel contains 93 Federal Reserve press conferences or closely related communications from 27 April 2011 to 17 June 2026. The corpus includes 93 official transcript files in both PDF and text form. Official recording links were matched to 69 events.
The prespecified main sample contains 90 scheduled press conferences. Two emergency communications in March 2020 and one Kevin Warsh event are excluded from the primary specification because their institutional setting differs from the regular press conference process. The main sample ends on 29 April 2026 because the final event in the full panel was not part of the scheduled estimation sample at the time of construction. Sixty-eight main-sample events have matched official audio links.
3.3. Speech Segmentation and Lexical Measures
Each transcript was divided into the Chair’s prepared opening statement and question-and-answer responses. Risk language measures were computed only from the Chair’s words. Counts use the Loughran–McDonald financial dictionary (
Loughran & McDonald, 2011) and are normalised per 1000 words.
The primary Q&A risk index is
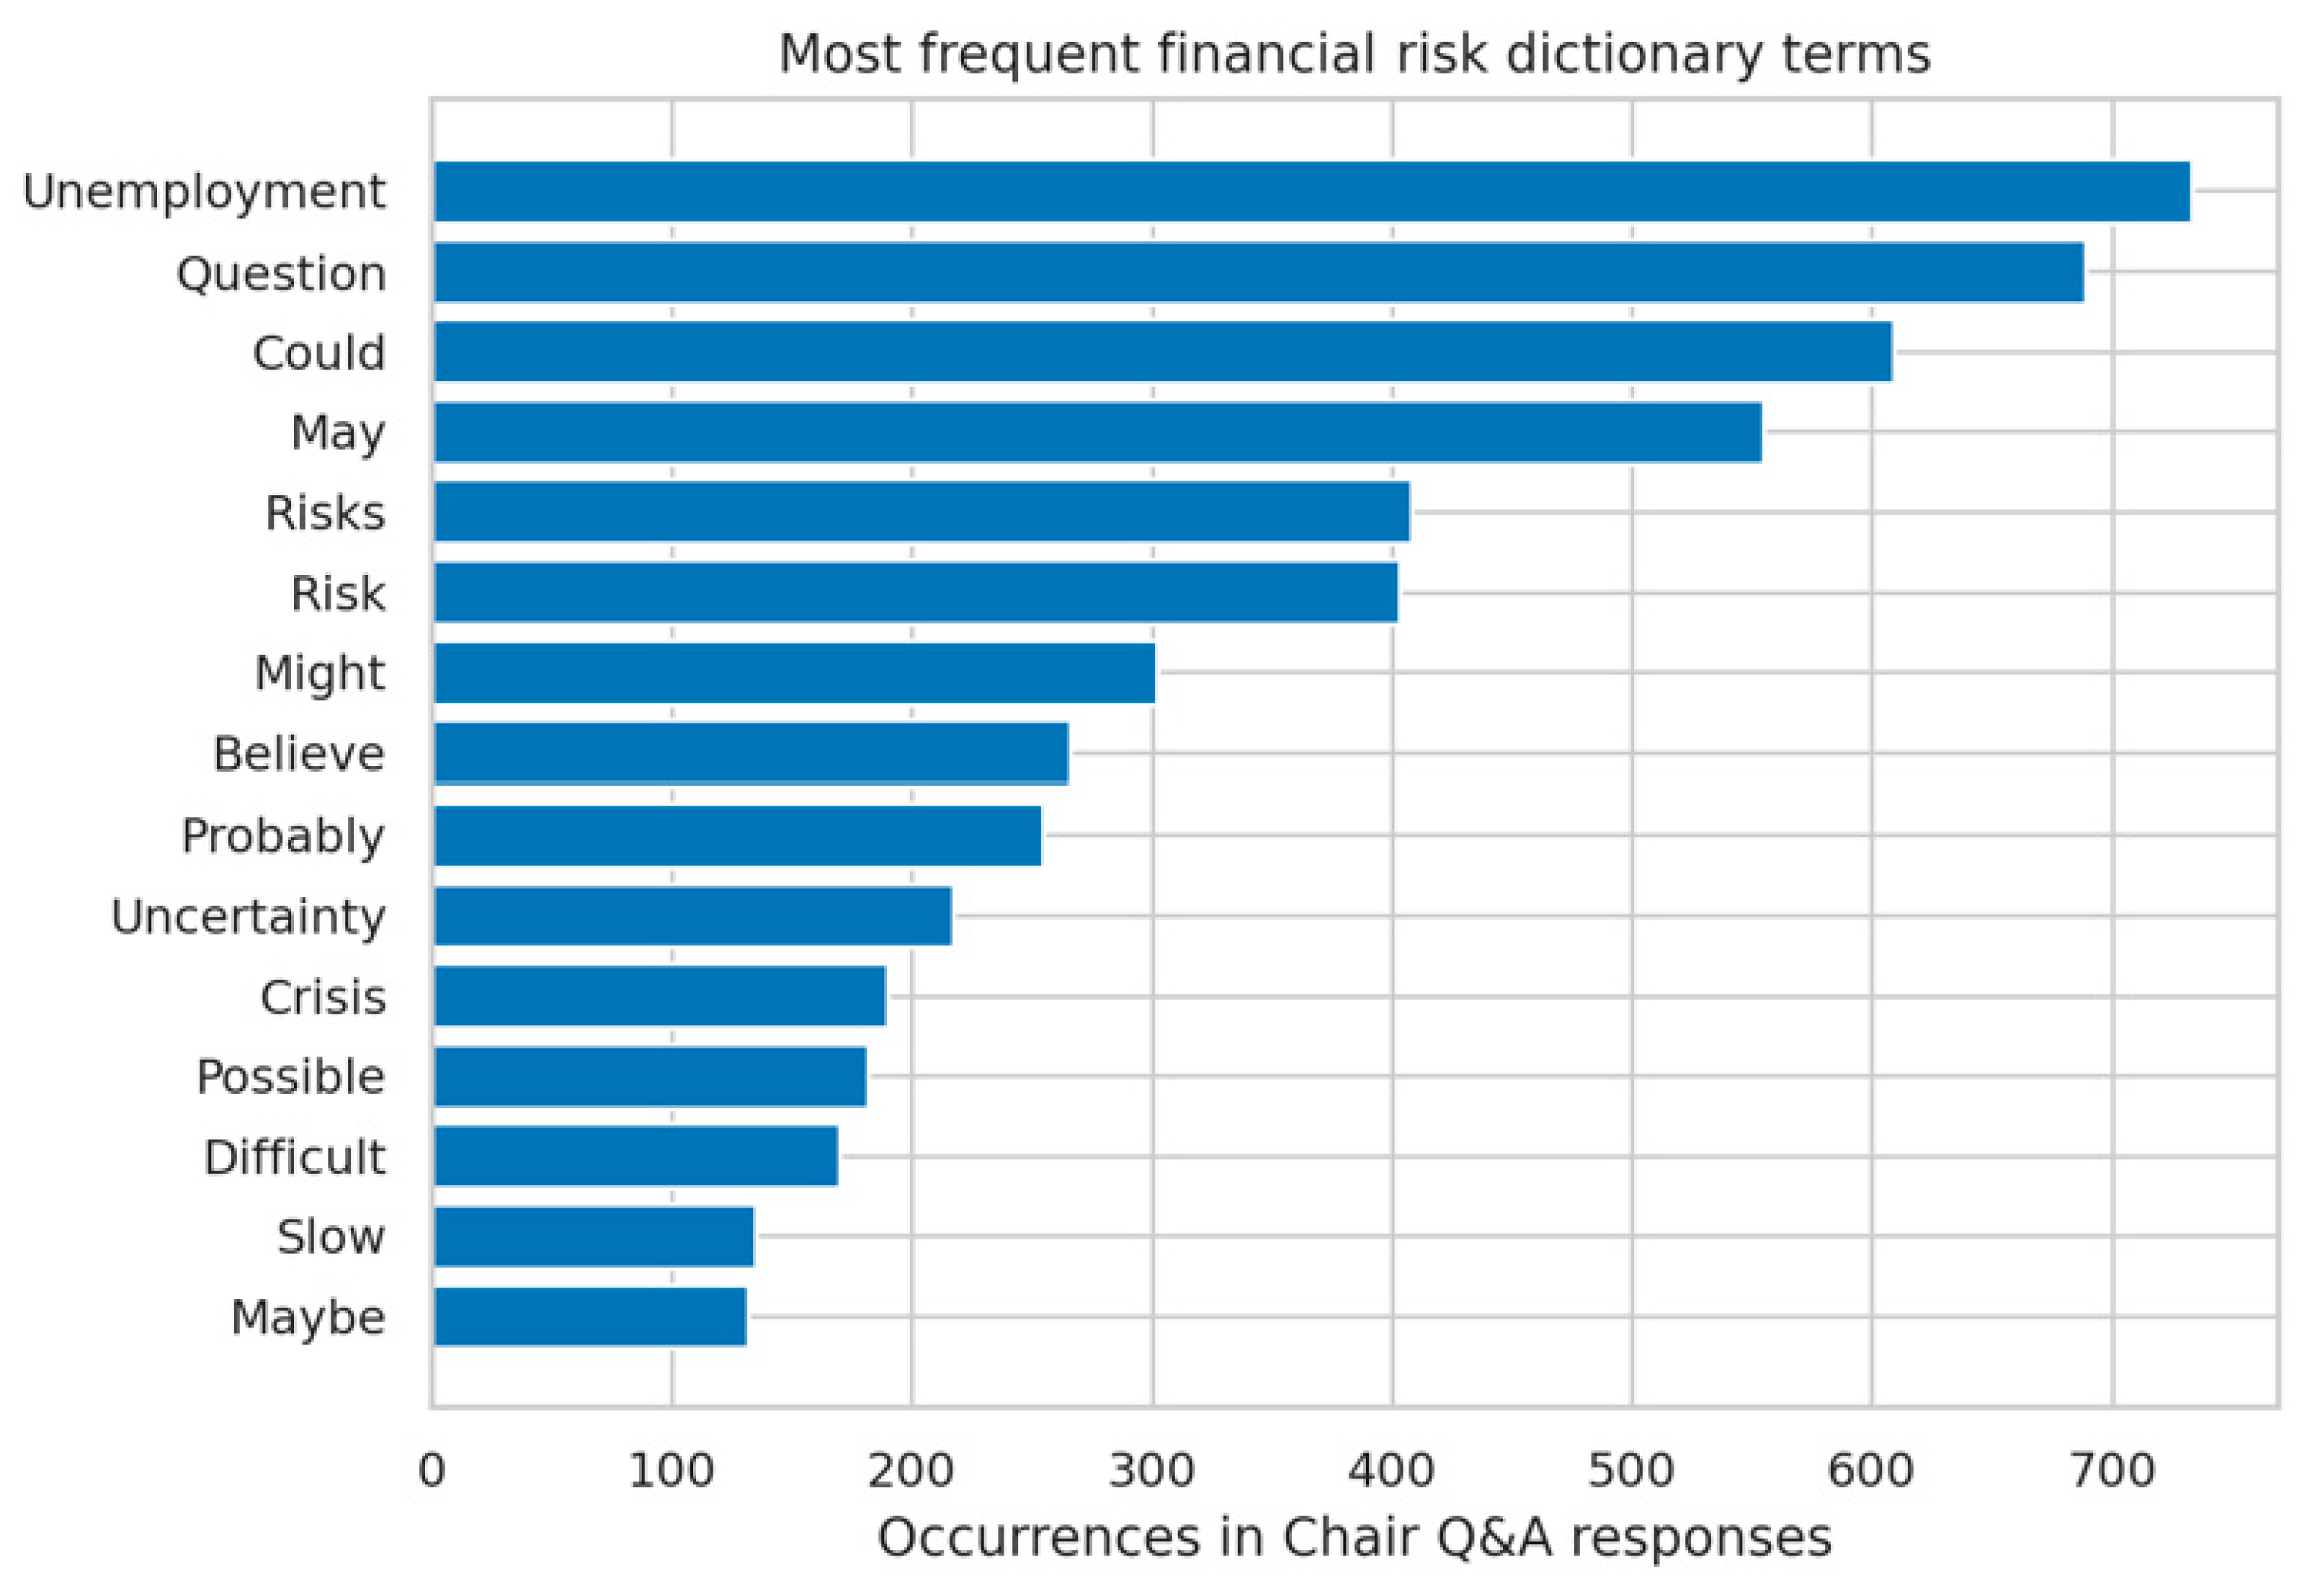
An analogous index was constructed for the opening statement. Standardisation was performed across events before averaging. A separate explicit risk measure counts direct terms such as risk, risks, uncertain, uncertainty, crisis, and recession. The most frequent explicit terms in the full corpus were RISKS (408 occurrences), RISK (403), UNCERTAINTY (217), CRISIS (190), UNCERTAIN (116), and RECESSION (111).
Dictionary counts provide transparent replication and limited semantic resolution. The index classifies terms by dictionary category and frequency. It does not infer whether a sentence negates a risk, places it in a conditional clause, refers to a past episode, or describes risk resolution. Expressions such as “risks have increased”, “risks have diminished”, and “risks are contained” therefore need not receive economically distinct treatment when the same risk terms appear. The study treats the index as a lexical frequency measure, not a sentence-level interpretation of communicative function.
3.4. Market Response Measures
Market data come from the US Monetary Policy Dataset press conference window. Four absolute responses are used:
absolute S&P 500 return;
absolute two-year US Treasury yield change;
absolute ten-year US Treasury yield change;
absolute US dollar index return.
The primary outcome is an equal weight composite:
Each component captures the response magnitude over the 70 min press conference window. Yield changes are expressed in percentage points in the source data. The composite avoids selecting a single asset after inspecting the results and captures the common magnitude of the cross-asset response. Principal component analysis provides an alternative data-driven aggregation.
3.5. Policy Surprise and Control Variables
The magnitude of the monetary policy surprise is calculated from the first two press conference window surprise factors:
The measure is standardised for regression analysis. The full control vector contains policy surprise magnitude, the Chair’s word count, an indicator for Summary of Economic Projections meetings, Chair indicators for Janet Yellen and Jerome Powell, a 2020 indicator, and a standardised linear time trend. Ben Bernanke forms the omitted Chair category.
The coefficient of interest is β. A positive estimate aligns with H1. X
i contains the Chair word count, the Summary of Economic Projections indicator, Yellen and Powell indicators, the 2020 indicator, and the standardised time trend. Ben Bernanke forms the omitted Chair category. The coefficient describes conditional association after the listed controls. The design does not identify a causal effect of lexical wording.
Figure 1 presents the most frequent explicit financial risk terms identified in the Chair’s Q&A responses, showing the relative prevalence of uncertainty, risk, and economic-condition language across the corpus.
3.6. Estimation, Inference, and Validation
The analysis estimates nested ordinary least squares specifications. M1 contains the Q&A lexical risk index alone. M2 adds policy surprise magnitude and Chair word count. M3 adds the Summary of Economic Projections indicator and Chair indicators. M4 adds the 2020 indicator and a standardised linear time trend. M5 includes both the Q&A and opening statement lexical risk indices. HC3 standard errors form the primary inference procedure because the event sample contains 90 scheduled conferences and several influential observations. Newey–West covariance estimates with one and four lags provide sensitivity checks.
Robustness tests exclude 2020, restrict the sample to audio-linked events, truncate the sample through 2025, remove the five largest Cook’s distance observations, restore emergency events, and winsorise the outcome. Alternative models use principal component, log-scaled, and rank-based outcomes. Leave-one-out cross-validation compares the control model with the model containing Q&A lexical risk. A 5000-draw permutation test evaluates incremental performance under random reassignment of the risk signal. False discovery rate adjustment applies to exploratory signal families. All reported tests use two-sided p-values.
3.7. Pre-Event Volatility Environment and Regime Specification
Pre-event volatility represents a plausible common driver of risk-related language and market response. Daily VIXCLS from FRED provides a public measure of near-term option-implied equity volatility (
Chicago Board Options Exchange, n.d.). A reproducible regime extension follows
Tong’s (
1983) threshold autoregressive framework. The daily VIX series is fitted with a three-regime self-exciting threshold autoregression. Two estimated thresholds classify the previous trading day into low-, medium-, or high-volatility states before each press conference.
The event-level extension uses regime indicators and interactions with Q&A lexical risk:
Residual distributions from M4 are also compared across the three states. The current reproducibility archive does not contain the merged event-level VIX field, so the reported results do not include regime coefficients. The paper therefore treats pre-event volatility as an unmeasured contextual factor and avoids attributing the observed association to a causal communication channel.
3.8. Reproducibility
The analysis uses the event panel, transcript corpus, audio manifest, US Monetary Policy Event-Study Database workbook, and Loughran–McDonald dictionary supplied with the project. Core estimates were regenerated from the project analysis script. Extended diagnostics and sensitivity tests were saved as machine-readable CSV and JSON outputs. Numerical values are rounded for presentation. The VIX regime specification in
Section 3.7 requires a separate event-level merge before estimation.
5. Discussion
5.1. Main Findings and Scope
Q&A lexical risk does not predict larger cross-asset market responses after policy surprise magnitude and event characteristics enter the full specification. The estimate equals −0.063 with p = 0.444 and a 95% confidence interval from −0.226 to 0.100. Incremental R2 equals 0.0034, and leave-one-out prediction error rises by 0.60% after adding the lexical index.
The result concerns transcript-derived lexical frequency and an index of absolute market movement. Acoustic delivery, realised intraday volatility, implied volatility, and answer-level reactions remain outside the reported tests. The paper therefore draws no conclusion about pitch, intensity, timing, pauses, disfluency, or other non-verbal features.
The null result still sets a useful benchmark. Any richer semantic or acoustic measure should add information beyond policy surprises and the transparent dictionary score, and it should improve performance for unseen events. The result also shows why lexical risk, acoustic emotion, policy stance, and non-verbal behaviour require separate labels.
5.2. Hypotheses and Predictive Evidence
H1 receives no support. The full coefficient has the opposite sign from the directional prediction and wide sampling uncertainty. Sign reversals after influence exclusions and after restoring emergency events also argue against a stable directional relationship. See
Table 12 below.
H2 receives no support from either fit or prediction. Adding Q&A lexical risk raises in-sample R2 from 0.396 to 0.399, produces partial R2 of 0.0072, lowers out-of-sample R2 from 0.2913 to 0.2828, and raises leave-one-out RMSE from 0.5341 to 0.5373. The permutation p-value equals 0.438.
H3 receives no support from the prepared-versus-unscripted comparison. In M5, the Q&A coefficient equals −0.023 and the opening statement coefficient equals −0.213. Their difference equals 0.190 with p = 0.124. Conference-level lexical frequency therefore does not identify a stronger Q&A relation.
5.3. Policy Information, Volatility Environment, and Identification
Policy surprise magnitude remains the strongest empirical predictor. Its full-model coefficient equals 0.368 with p < 0.001, and the asset-specific coefficients remain positive across equities, two-year and ten-year Treasury yields, and the dollar. The large two-year response fits the close link between short maturity yields and revisions in the expected policy path.
The attenuation of the lexical risk coefficient after policy controls enter the model illustrates the identification problem. Its magnitude falls from −0.126 in the bivariate model to −0.047 after policy surprise magnitude and word count are included. Communication content and policy news therefore overlap empirically in the event window.
Pre-event volatility remains an additional common cause. High VIX conditions might coincide with more risk-related wording, larger policy surprises, and larger market responses.
Section 3.7 formalises a three-regime SETAR extension using the previous trading day’s VIXCLS close (
Chicago Board Options Exchange, n.d.;
Tong, 1983). The current archive lacks the merged event-level VIX field, so no regime interaction enters the reported coefficient. The estimates should therefore be read as conditional associations under the available control set.
5.4. Lexical Measurement and Conference Aggregation
Negative point estimates do not establish a stabilising effect. Risk discussion might coincide with clarification, acknowledgement of already priced information, or policy explanations that reduce residual uncertainty. Sampling error also remains substantial.
Dictionary frequency does not recover communicative function. Negation, conditional clauses, temporal references, comparisons, and risk resolution statements alter meaning around the same vocabulary. A finance-specific transformer or a manually coded answer sample would provide a stronger contextual validation layer than raw counts alone.
Conference aggregation also mixes local reactions. One answer might reveal a concern, and a later answer might resolve it. Assigning one 70 min outcome to the full Q&A session removes the temporal order needed to separate those functions. Answer-level observations nested within conferences would preserve local variation and permit conference-level controls.
The 90-event sample further limits interaction tests and small effect detection. The approximate 80% minimum detectable effect of 0.230 response index units should guide interpretation of null coefficients. The absence of evidence for small associations does not supply evidence about unmeasured acoustic or sentence-level semantic effects.
5.5. Relation to Acoustic and Non-Verbal Evidence
The lexical result addresses a different construct from the acoustic result of
Gorodnichenko et al. (
2023). Their measure draws on audio features and broad vocal emotion. The present index draws on transcript categories for negative, uncertainty, and weak modal language. Evidence from one channel should not be assigned to the other.
Marchal (
2020) and
Ahrens et al. (
2025) also show why economic content and non-verbal behaviour require separate measurement. Visual interaction, forecast information, and acoustic delivery each differ from a dictionary count. The present null result therefore sets a lexical boundary without testing those channels.
A later multimodal design should align each Chair’s answer with audio, transcript text, topic labels, and one-minute or finer market data. Speaker-standardised acoustic variables and contextual semantic measures should enter the same temporal unit before any acoustic–semantic interaction is estimated.
5.6. Limitations and Next-Stage Analysis
Five limitations define the current evidence. The study measures lexical risk, not acoustic delivery. The outcome measures absolute market movement, not realised volatility. Conference aggregation hides answer-level timing. The 90-event sample limits precision for small effects and interactions. The available control vector omits pre-event VIX, same-day macroeconomic announcements, statement window returns, and topic-specific information.
Future text validation should combine a manually coded answer sample with finance-specific transformer measures, semantic novelty, and hawkishness or dovishness. Human coding should distinguish risk revelation, risk resolution, reassurance, conditional statements, and historical references. A hierarchical answer-level model should nest answers within conferences and align each answer with the market movements observed immediately afterwards.
Future acoustic work should use matched official recordings, speaker segmentation, within-speaker standardisation, recording quality controls, and features covering pitch, intensity, speech rate, pauses, disfluency, jitter, shimmer, and harmonics-to-noise ratio. A completed VIX merge should also implement the SETAR regime specification in
Section 3.7 and compare M4 residuals across low-, medium-, and high-volatility states.
6. Conclusions
The study examines whether risk-related words in Federal Reserve press conferences predict the magnitude of financial market responses. The primary sample contains 90 scheduled FOMC press conferences. The Q&A lexical risk index combines negative, uncertainty, and weak modal frequencies, while the outcome combines absolute movements in the S&P 500, two-year and ten-year Treasury yields, and the US dollar over the 70 min press conference window.
The full-model Q&A coefficient equals −0.063 with p = 0.444 and a 95% confidence interval from −0.226 to 0.100. Incremental R2 equals 0.0034, partial R2 equals 0.0072, and leave-one-out prediction error rises by 0.60%. Asset-specific models and the reported sensitivity checks give the same substantive result. The 90-event sample leaves limited precision for small effects.
Policy surprise magnitude remains the strongest predictor across the composite and asset-specific models. The estimates therefore support a narrow conclusion: conference-level lexical risk adds little information about absolute market response magnitude after the available policy and event controls enter the model.
The study does not identify a causal effect of wording. It also does not test acoustic vocal signals or realised intraday volatility. Pre-event volatility and other contextual variables remain incompletely measured, and conference aggregation might combine risk revelation with later risk resolution. The
Supplementary Materials provide the supporting documentation, reproducibility files, and additional material associated with the empirical analysis reported in the study.
Future work should move to answer-level timing, contextual text validation, acoustic measurement, and a merged pre-event VIX series. The three-regime SETAR specification in
Section 3.7 provides a reproducible test of volatility state heterogeneity once the event-level VIX field enters the analysis archive.