Article

Earnings, Book Value and the Limits of the Credibility Argument: Evidence from Non-Financial Listed Firms in Vietnam (2009–2024)


by
Phuong Thi Khanh Nguyen
1,
Thanh Thi Le Nguyen
2,*,
Anh Thi Lam Nguyen
3,
Linh Dieu Nguyen
1 and
Tue Thi Minh Pham
4
1
Banking Research Institute, Banking Academy of Vietnam, Hanoi 100000, Vietnam
2
Department of Testing and Quality Assurance, Banking Academy of Vietnam, Hanoi 100000, Vietnam
3
Faculty of Finance, Banking Academy of Vietnam, Hanoi 100000, Vietnam
4
Faculty of Accounting–Auditing, Banking Academy of Vietnam, Hanoi 100000, Vietnam
*
Author to whom correspondence should be addressed.
J. Risk Financ. Manag. 2026, 19(9), 686; https://doi.org/10.3390/jrfm19090686
Submission received: 13 July 2026 / Revised: 29 August 2026 / Accepted: 1 September 2026 / Published: 4 September 2026
(This article belongs to the Special Issue Behavioral Influences on Financial Decisions)

Abstract

Two arguments in the literature bear on how accounting information should be priced in emerging markets. The first holds that where enforcement of financial reporting is weak, investors favour book value over earnings because book value depends less on managerial judgement. The second holds that value relevance falls when macroeconomic uncertainty rises. Vietnam offers an informative setting for both because reporting enforcement is uneven and measurable, individual investors supply more than eighty per cent of trading value, and the sample period contains unusually wide macroeconomic variation. Using 631 non-financial listed firms over 2009 to 2024 and 7982 firm-year observations, we find no supporting evidence for either prediction. Earnings carry more than twice the economic weight of book value, and the earnings result withstands selection on unobservables more than four times that on observables, against approximately one for book value. Value relevance is no weaker among small firms, where full disclosure compliance is roughly 50 per cent, than among large firms, where it is roughly 85 per cent. Testing state dependence item by item through interaction terms rather than through aggregate explanatory power, the valuation weights on earnings and book value are statistically indistinguishable across favourable and adverse states under two independent definitions, while the weights on operating cash flow and firm size shift significantly. The results hold under lagged, dynamic and logarithmic specifications.

1. Introduction

Two arguments in the literature bear on how accounting information should be priced in a market such as Vietnam. The first is that reporting incentives and enforcement, rather than accounting standards themselves, determine the properties of reported numbers, so that where enforcement is weak investors should place less weight on earnings and more on book value (Ball et al., 2003; Leuz et al., 2003). The second is that the value relevance of accounting information falls when macroeconomic uncertainty rises (Barth & Landsman, 2010; Dunham & Grandstaff, 2022; Liu & Sun, 2022). Vietnam offers an informative setting for both, and this paper reports evidence on each.
The first argument requires more care than it is usually given, and the reason is an accounting one. Under the clean surplus relation that underlies the Ohlson (1995) framework, book value of equity is the cumulation of past earnings net of distributions. If earnings are subject to managerial discretion, that discretion therefore enters book value as well, and book value cannot be more credible simply because it is a balance sheet item. Any prediction that investors shift weight from earnings to book value under weak enforcement must rest on something that distinguishes the two beyond their position in the financial statements. One candidate is the reversing property of accruals: discretionary accruals recognised in one period unwind in later ones (Dechow & Dichev, 2002), so the distortion in a single period’s earnings is larger than the distortion surviving in the cumulated stock, where successive reversals partly offset. A second is that audit procedures verify the existence and valuation of recorded assets directly, whereas the timing of recognition that determines periodic earnings is harder to verify. Both considerations are matters of degree rather than of kind, and neither delivers an unambiguous theoretical prediction about which measure should carry the larger valuation weight. That is precisely why the question is worth addressing empirically.
We find no supporting evidence for either prediction. Earnings carry more than twice the economic weight of book value, and the earnings result is the more robust of the two: the degree of selection on unobservable factors required to overturn it exceeds four times the selection on observable ones, against approximately one for book value. Value relevance is no weaker among the small firms where disclosure compliance is lowest than among the large firms where it is highest. And the valuation weights on earnings and book value are statistically indistinguishable between favourable and adverse macroeconomic states under two independent definitions of the state. These results do not establish that either argument is wrong. They establish that neither receives support in a setting that appears well suited to generating it, which is informative about the conditions under which the arguments are likely to hold.
The study uses 631 non-financial firms listed in Vietnam between 2009 and 2024. Three features of this market make it informative for these questions, and each corresponds to a design requirement rather than to novelty of data.
The first is that reporting enforcement varies sharply within a single regulatory regime, and that the variation is measured. The Securities Law of 2019 and Circular 96/2020/TT-BTC (Ministry of Finance of Vietnam, 2020a) impose disclosure obligations broadly consistent with international principles, but supervision relies on administrative penalties that are modest relative to the private benefit of delay. Independent surveys of disclosure practice place full compliance at roughly 85 per cent among large-capitalisation firms and roughly 50 per cent among small and micro-capitalisation firms. This matters for research design. Value relevance is known to vary with firm characteristics for reasons that have nothing to do with compliance, including differences in earnings persistence, growth and risk (Ball et al., 1993), and the cross-country literature relating value relevance to institutional quality cannot separate enforcement from the many other national characteristics with which it is correlated. A setting in which compliance varies by a documented and large margin while the legal framework, the accounting standards and the enforcement agency are held constant allows the magnitude of the compliance channel to be estimated rather than inferred.
The second is the composition of the investor base. Individual investors have supplied more than 80 per cent of trading value on the Vietnamese exchanges continuously since 2016, and close to 90 per cent in some recent years, against 40 to 50 per cent in developed markets (FiinGroup, 2025). Analyst coverage is thin outside the largest listings. The relevant theoretical dimension here is the cost of processing information rather than the speed at which a signal changes. Where a substantial share of investors allocates limited attention, prices reflect salient and readily processed summary measures more heavily than measures that must be assembled from disaggregated statements (Hirshleifer & Teoh, 2003). Earnings per share is the most salient single figure a listed firm report, whereas assessing book value requires attention to the composition and recoverability of recorded assets. This literature therefore points in the opposite direction to the enforcement argument set out above, which is a further reason the relative weight of the two measures is an empirical question in this setting.
The third is the extent of macroeconomic variation within the sample. Macroeconomic conditions matter to capital markets in general, so the question is not whether they matter but whether their effect on the pricing of accounting information can be measured with adequate power. Vietnam over 2009 to 2024 provides that power. Annual real GDP growth ranges from 2.6 to 8.0 per cent and annual inflation from 0.2 to 18.1 per cent, a span that developed markets did not experience over the same period, and the window contains the recovery from the global financial crisis, a phase of stable growth, the COVID-19 shock and the monetary tightening of 2022 to 2024. Because all of this occurs under one legal and reporting framework, state dependence can be tested without confounding it with institutional change, which cross-country and long-horizon designs cannot avoid.
A fourth feature is contextual rather than a design requirement. FTSE Russell confirmed at its March 2026 interim review that Vietnam meets all criteria for secondary emerging market status, with reclassification from frontier status effective from 21 September 2026 (FTSE Russell, 2026). Evidence on how prices currently use accounting information provides a baseline against which the effect of that transition, and of the associated change in the investor base, can later be assessed.
Four findings emerge. (1) Accounting information is strongly value relevant, and the model explains about 35 per cent of within-firm variation in prices, which is comparable to estimates from developed markets. (2) Earnings rather than book value carry the larger valuation weight, and the ordering holds within both firm size classes and across eight of the nine industries with estimable samples. (3) The valuation weights on earnings and book value do not vary with the macroeconomic state, while the weights on operating cash flow and firm size do, so state dependence operates on the supplementary information set rather than on the core accounting variables. (4) The earnings result survives a battery of endogeneity checks, reported in Section 4.7, that the book value result survives less comfortably.
These findings carry implications for regulators, for investors and for the design of reporting reform in emerging markets.
For securities regulators, the evidence bears on where supervisory effort is most productive. Value relevance in Vietnam is not materially weaker among the firms whose filing compliance is lowest, which suggests that the margin captured by compliance monitoring, namely whether complete statements are filed on time, is not the margin on which the informativeness of reported numbers currently turns. Supervisory attention directed at the substance of measurement and at audit quality is therefore likely to yield more than further extension of filing requirements. The finding that the pricing of operating cash flow disappears in adverse macroeconomic states points to a specific target: disclosure that helps investors distinguish sustainable from transitory cash generation is least informative under current practice precisely when it would be most useful.
For investors and for the intermediaries who serve them, the result that earnings carry more than twice the weight of book value, and that this ordering is stable across macroeconomic states, indicates that the reported earnings figure remains the primary accounting input to valuation in this market even under stress. The corresponding caution is that the book value result is the less robust of the two under the endogeneity checks reported in Section 4.7, so valuation approaches that lean on the balance sheet warrant more care than the baseline estimates alone would suggest.
For the sequencing of reporting reform, the results are relevant to Vietnam’s programme of convergence towards International Financial Reporting Standards under Decision 345/QD-BTC (Ministry of Finance of Vietnam, 2020b) and to comparable programmes elsewhere. Accounting information is already substantially priced under the present standards, so the case for convergence rests on comparability and on access to international capital rather than on a presumption that current reported numbers are disregarded by the market.
The remainder of the paper is organised as follows. Section 2 reviews the literature, sets out the institutional setting and states the research gap. Section 3 develops the theoretical framework, the hypotheses and the empirical design. Section 4 reports the results. Section 5 discusses them and Section 6 concludes.

2. Research Overview, Research Gaps and Contribution of This Research

2.1. Overview of Previous Research Studies

Theoretical Foundations of the Value Relevance of Accounting Information:
Research on the relationship between accounting information and stock prices originates from Fama’s (1970) Efficient Market Hypothesis (EMH), which posits that financial asset prices fully and promptly incorporate all available information. Within this framework, accounting information—particularly earnings and book value—is considered an important signal that enables the market to update expectations regarding firms’ future cash flows.
Early empirical studies provided strong evidence supporting the informational role of accounting data in capital markets. Ball and Brown (1968), in their pioneering work, documented that accounting earnings are associated with stock price movements around the time of financial statement announcements. Similarly, Beaver (1968) demonstrated that earnings announcements lead to increases in both trading volume and price volatility, thereby confirming the informational content of financial statements.
Building upon these foundational studies, Ohlson (1995) developed the residual income valuation model, in which firm value is expressed as a function of book value and expected future earnings. Ohlson’s framework subsequently became a central theoretical foundation for value relevance research, as it established a direct economic linkage between accounting variables and market valuation.
Subsequent studies further refined this line of inquiry. Easton and Harris (1991) extended the analysis by jointly examining the effects of both the level of earnings and changes in earnings on stock returns. Collins et al. (1997) provided additional evidence suggesting that, over time, the importance of book value in explaining firm value has increased, while the explanatory power of earnings has declined. This shift has been partly attributed to the growing role of intangible assets and structural changes in modern economies.
Read together, these studies establish three propositions that structure the analysis below. Accounting earnings and book value are associated with prices, but the association is a joint product of the accounting system and the information environment rather than a property of the accounting system alone. The relative weight of the two varies across settings, and the direction of that variation is contested: some studies find book value dominant where reporting quality is weaker, others find earnings dominant wherever earnings are persistent. And the weights are not necessarily fixed over time, which raises the question of what determines them. The literature reviewed in the remainder of this section addresses that question from three directions: the properties of individual accounting items, the characteristics of the reporting firm, and the state of the economy in which the pricing occurs.
The role of specific accounting indicators in stock valuation:
Book Value Per Share (BVPS): Book value is widely regarded as an important determinant of firm valuation. Barth et al. (2001) argue that book value tends to exhibit stronger value relevance in industries characterized by substantial tangible assets or when firms face higher bankruptcy risk. Under conditions of heightened uncertainty, investors may rely more heavily on book value as a valuation anchor. Similarly, Penman (2013) emphasizes that book value reflects the scale of accumulated investment and constitutes a fundamental component of residual income-based valuation models.
Earnings Per Share (EPS) and Return on Assets (ROA): Earnings are generally considered a central measure of a firm’s operating performance and profitability. However, Kothari (2001) emphasizes that the relationship between earnings and stock prices depends critically on earnings quality, persistence, and the extent of accounting adjustments. Dechow et al. (2010) further demonstrate that earnings possess strong informational value when they reliably reflect firms’ future cash flows. Conversely, in high-risk environments or in the presence of earnings management, the explanatory power of earnings measures such as EPS may decline substantially.
Earnings quality is the mechanism linking these measures to prices. Dechow et al. (2010) show that the informational value of earnings depends on how faithfully reported earnings summarise the cash flows they represent, and that no single proxy captures this property. The distinction matters here because earnings can fail to be priced for two different reasons: because the reported figure is a poor summary of future cash flows, which is a measurement problem, or because investors doubt the figure is free of managerial discretion, which is a credibility problem. Where the constraint is credibility, investors may shift weight towards items that are harder to manage. As Section 1 sets out, however, book value is not straightforwardly such an item, since under clean surplus it cumulates the same earnings; the case rests on the reversing property of accruals and on the verifiability of recorded assets and is therefore one of degree. Hribar et al. (2006) provide a related result by showing that markets distinguish earnings growth achieved through operations from growth achieved through repurchases, which indicates that the pricing of earnings responds to its perceived source rather than to its level alone. The prediction that follows from the credibility argument, that book value should carry the larger weight where enforcement is weak, receives no support in the results reported in Section 4.
Dividends Per Share (DPS): According to signaling theory, dividend payments convey information regarding firms’ future cash flow prospects and financial stability (Bhattacharya, 1979; Miller & Rock, 1985). Dividend announcements may therefore influence investor expectations and stock prices. However, in emerging markets where dividend policies may be influenced by liquidity constraints, ownership concentration, or corporate governance issues, the impact of dividends on stock valuation is not always consistent.
Cash Flow: Cash flow information is also considered relevant for equity valuation. Livnat and Zarowin (1990) show that cash flow measures may provide incremental explanatory power for stock returns beyond accounting earnings. However, Sloan (1996) argues that financial markets may misprice the accrual component of earnings, leading to what is commonly referred to as the “accrual anomaly.” This suggests that investors may sometimes over-rely on accrual-based earnings while underweighting cash flow information.
Overall, the international literature suggests that no single accounting indicator dominates stock valuation. Instead, the relative importance of accounting metrics depends on factors such as market structure, financial reporting quality, and prevailing economic conditions.
The role of firm characteristics and capital structure:
Firm characteristics also shape valuation. Modigliani and Miller (1958, 1963) established that capital structure is irrelevant to firm value in perfect markets, but once taxes, bankruptcy costs and financial distress are admitted, higher leverage raises the risk borne by equity holders and may depress market valuations. Firm size operates through a related channel: Fama and French (1992, 1993) identify size as a systematic risk factor, and larger firms typically display greater transparency, more stable operations and lower information asymmetry. In emerging markets size may also proxy for the capacity to absorb an adverse shock, which is relevant to the state-dependence tests reported in Section 4.5.
Macroeconomic conditions and the “state dependence” of information value:
Recent studies emphasize that the relationship between accounting information and stock prices is not constant but may vary depending on macroeconomic conditions—a phenomenon often referred to as state-dependent value relevance. Kothari and Shanken (1997) argue that during periods of high market volatility, increased noise in financial markets may weaken the explanatory power of accounting variables.
Empirical evidence from major economic crises supports this perspective. During the global financial crisis of 2008, several studies documented a decline in the value relevance of accounting information due to heightened uncertainty and systemic risk (Barth & Landsman, 2010). More recently, the COVID-19 pandemic generated an unprecedented surge in economic uncertainty. Albulescu (2021) and Baker et al. (2020) show that economic uncertainty and market volatility increased sharply during the pandemic, often exceeding the impact of firm-level fundamentals.
These findings suggest that in high-risk environments, accounting information may become partially overshadowed by investor sentiment, macroeconomic uncertainty, and systemic risk factors. Consequently, the extent to which accounting variables are reflected in stock prices may vary significantly across different macroeconomic states.
Recent work has sharpened this line of enquiry. Dunham and Grandstaff (2022) review the value relevance literature and identify the role of economic conditions as its least developed strand, noting that most studies treat the accounting-to-price mapping as stable and attribute its movement over time to changes in the composition of the economy rather than to the state of the economy. Barth et al. (2023) reach a related conclusion from the opposite direction: once a wider set of reported items is considered, combined value relevance in the United States shows no secular decline between 1962 and 2018, which shifts the question from whether accounting has lost relevance to when and for whom it is relevant. Direct evidence on state dependence has come mainly from the pandemic. Liu and Sun (2022) find that both the explanatory power and the slope coefficient of earnings fell in the United States between 2019 and 2020, and Chae and Moon (2025) report a decline in the explanatory power of the Ohlson model in Korea across the same transition. Emerging-market evidence is more mixed. Chehade and Procházka (2024) find that accounting information remains value relevant in Saudi Arabia, and Srivastava and Muharam (2022) report the same for India and Indonesia during IFRS convergence, but neither study conditions on the macroeconomic state, and neither distinguishes the core valuation variables from the supplementary ones.
Evidence from emerging markets:
In emerging markets, the institutional environment and financial reporting infrastructure often differ substantially from those of developed economies. Lower levels of information transparency, weaker investor protection, and evolving regulatory frameworks may influence how accounting information is incorporated into stock prices (La Porta et al., 1998).
On the one hand, accounting information may play a more prominent role in stock valuation because investors rely heavily on publicly available financial statements to reduce information asymmetry. On the other hand, concerns regarding reporting quality and earnings management may weaken the credibility of accounting data. Empirical studies in Asian and ASEAN markets often find that book value plays a more important role than earnings in explaining stock prices, particularly during periods of high market volatility. Nevertheless, empirical findings remain mixed across countries, suggesting that institutional factors and the level of market development significantly influence the value relevance of accounting information.

2.2. The Vietnamese Institutional Setting

Disclosure by listed firms in Vietnam is governed by the Securities Law of 2019 and by Circular 96/2020/TT-BTC (Ministry of Finance of Vietnam, 2020a), which specify the content and timing of quarterly statements, reviewed half-year statements, audited annual statements, the annual report, and the explanatory statements required when performance changes abnormally. Responsibility rests in the first instance with the issuer, with oversight by the board and the supervisory board or audit committee, and with independent auditors expected to raise the reliability of the statements before they reach the market. Supervision is exercised by the State Securities Commission and the exchanges, which may require explanation and impose administrative penalties. Measured against IOSCO principles, the design of this framework is not the binding constraint; enforcement is. Penalties are administrative and modest relative to the private benefit of delayed or selective disclosure, and supervisory resources have not kept pace with the growth in the number of listed firms.
Compliance is uneven in a systematic way. Independent surveys of disclosure practice covering 2020 to 2024 show general improvement, with the proportion of firms meeting the full standard reaching its highest recorded level in 2024, but they also show a persistent gradient. Large-capitalisation firms moved from about 75 to about 85 per cent compliance over the period, medium-capitalisation firms from about 50 to about 65 per cent, and small and micro-capitalisation firms from about 30 to about 50 per cent. The gradient is also visible across industries: regulated financial sectors report the highest compliance, while construction and real estate report the lowest. This variation is what makes the setting useful for measurement. Value relevance varies across firms for many reasons unrelated to compliance, including differences in earnings persistence, growth and risk (Ball et al., 1993), so the question is not whether the two are distinct but how much of the cross-sectional variation the compliance channel accounts for. If it accounted for a large share, value relevance should be markedly stronger among large firms than among small ones.
The composition of the investor base determines who processes this information. Individual investors have accounted for more than 80 per cent of trading value continuously since 2016 and for close to 90 per cent in some recent years. Institutional and foreign participation is limited, foreign investors have been net sellers since 2023, analyst coverage is concentrated in the largest listings, and daily turnover is low relative to regional peers. Prior Vietnamese evidence is consistent in finding both earnings and book value priced. Nguyen and Dang (2023) report both to be significant over 2010 to 2020, with earnings explaining more variation than book value, although they document a declining trend that the 2014 accounting reform did not reverse. Nasir et al. (2021) show that the domestic macroeconomic environment, and monetary and credit conditions in particular, is a first-order driver of the Vietnamese market.
The market is also at a point of transition. FTSE Russell confirmed at its March 2026 interim review that Vietnam meets all criteria for secondary emerging market status under its country classification framework, with reclassification effective from 21 September 2026 and phased index inclusion continuing into 2027 (FTSE Russell, 2026). The reforms that made this possible, in particular the removal of the pre-funding requirement for foreign institutional investors, are expected to raise institutional participation. Evidence on how accounting information is priced under the present investor structure provides a benchmark against which the consequences of that change can be evaluated.
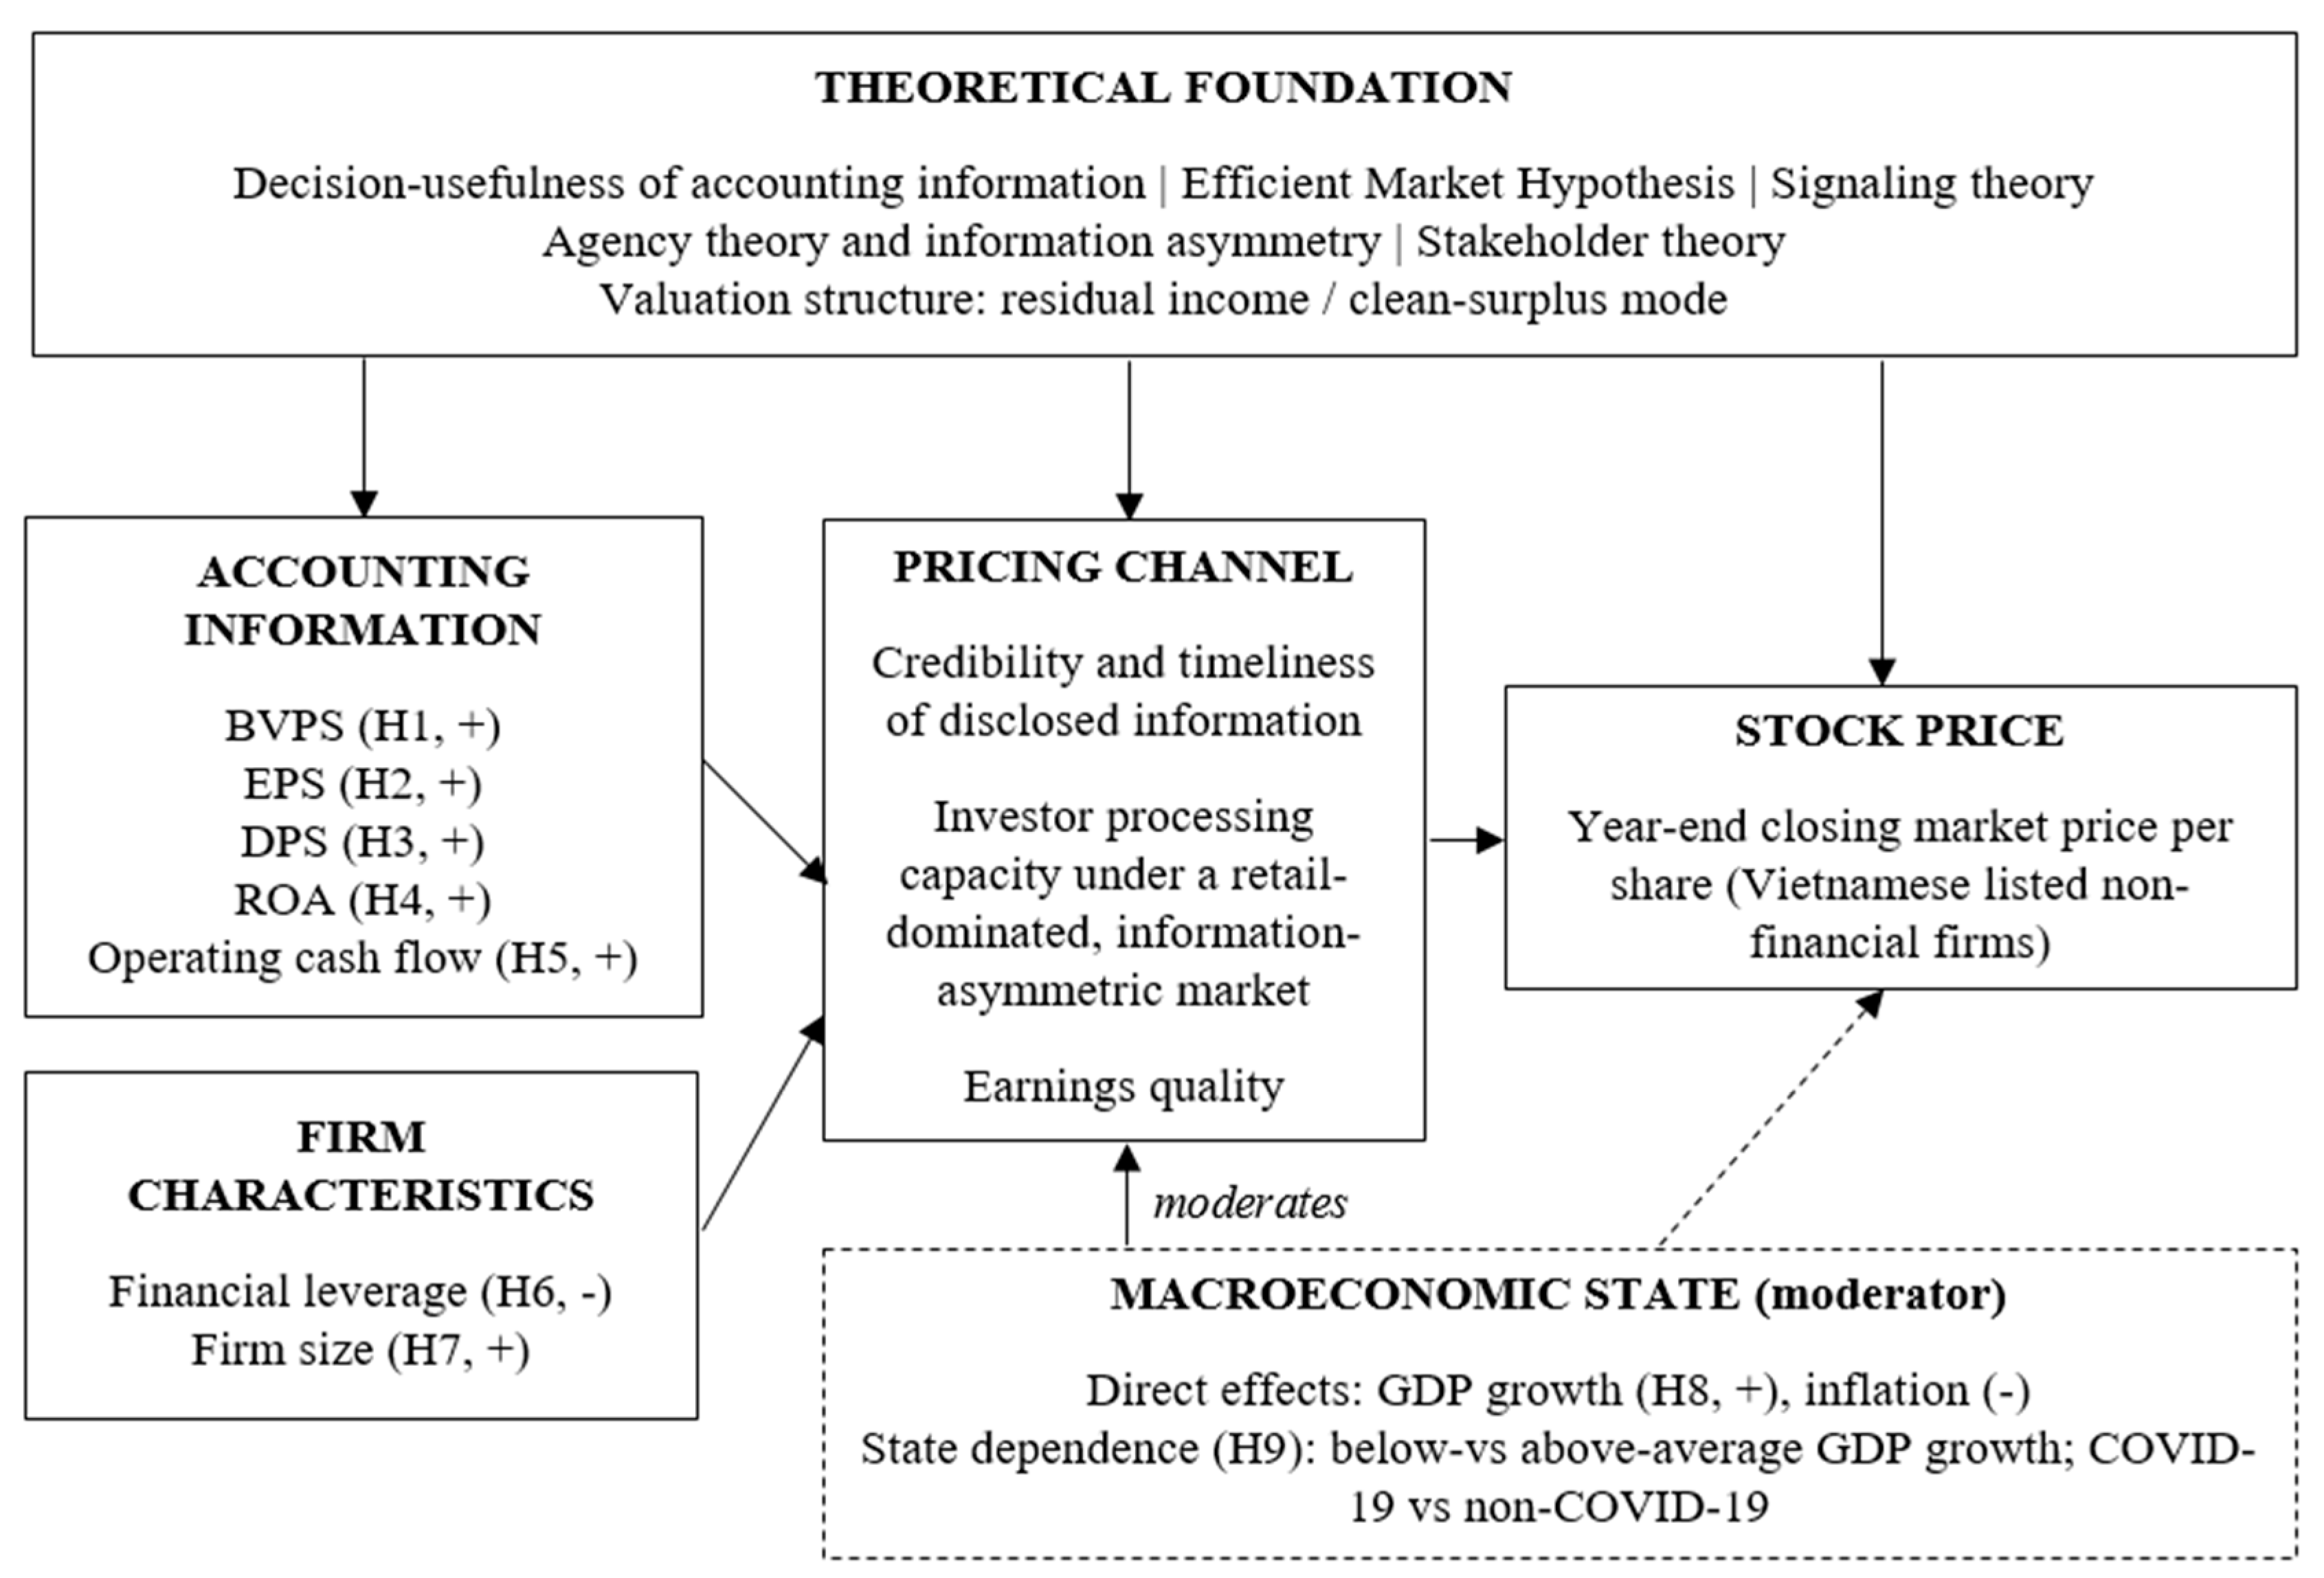
Figure 1 draws these elements together. The theoretical foundation set out in Section 3.1 supplies the valuation structure and the reasons that structure may not hold exactly. Accounting items and firm characteristics enter prices through a transmission channel whose efficiency depends on the credibility of disclosure and on the processing capacity of the marginal investor. The macroeconomic state enters twice: directly, through GDP growth and inflation, and indirectly, by moderating the strength of the transmission channel. The second of these is what Hypothesis 9 tests, and the results distinguish between the core valuation variables and the supplementary ones.

2.3. Research Gaps

The first gap is conceptual. The value relevance literature has largely treated the mapping from accounting numbers to prices as a structural relation and has explained its movement over time by reference to changes in the composition of the economy, in particular the rising share of intangible assets (Collins et al., 1997; Barth et al., 2023). Far less is known about whether the mapping is conditional on the state of the economy in which it is estimated, and Dunham and Grandstaff (2022) identify this as the least developed strand of the literature. The stake is not incidental. If value relevance were state dependent, then any estimate obtained from a given sample period would be an average over the macroeconomic states that period contains, and comparisons across countries, standards regimes or time would not be identified unless the state composition of the samples were comparable. Establishing whether that condition binds therefore bears on how the existing body of evidence should be read.
The second gap concerns which coefficients are at risk. The available evidence on state dependence comes mainly from developed markets and from a single episode, either the 2008 crisis or the pandemic (Barth & Landsman, 2010; Liu & Sun, 2022), and it typically reports a single summary measure such as the explanatory power of the Ohlson regression. A decline in that measure is consistent with two very different underlying patterns: uniform attenuation of every accounting coefficient, or stability of the core valuation variables combined with instability of the supplementary ones. The two carry different implications for financial reporting policy and distinguishing them requires a specification that estimates item-specific coefficients in each state and tests the differences formally rather than comparing explanatory power alone.
The third gap is empirical. Vietnamese evidence on value relevance is limited, and the most directly comparable study ends in 2020 and estimates a price model containing earnings and book value alone (Nguyen & Dang, 2023). No study covers the monetary tightening of 2022 to 2024, examines accounting items jointly with firm characteristics and macroeconomic variables, or tests whether the relation differs between favourable and adverse macroeconomic states.

2.4. Contributions of This Study

This study makes four contributions. The first is methodological and applies beyond this setting; the remaining three are empirical and arise from the Vietnamese context.
First, it tests state dependence item by item rather than through aggregate explanatory power and shows that the distinction changes the conclusion. Studies of value relevance under macroeconomic stress typically report the change in the explanatory power of a price regression estimated separately in each period. A fall in that measure is consistent with two very different underlying patterns: uniform attenuation of every accounting coefficient, or stability of the core valuation variables combined with instability of the supplementary ones. In this sample the joint restriction on the interaction terms is rejected, but the rejection is driven by operating cash flow and firm size, while the interactions involving earnings and book value are statistically indistinguishable from zero under both definitions of the state. A study reporting only aggregate explanatory power would record state dependence here and would attribute it to the variables the Ohlson framework places at the centre, which the item-level test does not support. The design point is general and does not depend on the setting.
Second, it estimates the magnitude of the compliance channel in a setting where compliance varies sharply within one regulatory regime. That value relevance and reporting compliance are distinct constructs is established: Ball et al. (1993) show that the association between earnings and returns varies predictably with firm characteristics such as earnings persistence, growth and risk, so two firms that comply equally well may differ substantially in the value relevance of their earnings. What is less established is how much of the observed cross-sectional variation in value relevance the compliance channel accounts for, because the cross-country literature relating value relevance to institutional quality uses aggregate indices that cannot separate enforcement from the other national characteristics with which it is correlated. Vietnam permits that estimate: full disclosure compliance is roughly 85 per cent among large-capitalisation firms and roughly 50 per cent among small and micro-capitalisation firms, while the legal framework, the accounting standards and the supervisory agency are common to both groups. The within R-squared is 0.335 for small and medium firms against 0.348 for large firms, earnings carry almost identical coefficients in the two groups, and book value is larger among the smaller firms. The compliance gradient does not map into a value relevance gradient of comparable size in this market. We report this as evidence on magnitude rather than as a conceptual distinction, and we do not claim that it generalises beyond settings with a similar enforcement profile.
Third, it applies bounds on selection to a value relevance regression, which is unusual in this literature, and which discriminates between two results that a conventional table presents as equally secure. The coefficient on earnings requires selection on unobservables more than four times that on observables to be overturned and remains large and positive after bias adjustment. The coefficient on book value requires selection of approximately one and adjusts to approximately zero. The conclusion that earnings dominate book value in this market is therefore a statement about which of the two estimates is the more secure as well as about magnitudes.
Fourth, it provides evidence from a market that has not previously been examined over this window. The sample extends through the monetary tightening of 2022 to 2024 and covers accounting items, firm characteristics and macroeconomic conditions jointly, whereas the closest prior study ends in 2020 and estimates a price model containing earnings and book value alone.

3. Research Methodology

3.1. Theoretical Framework

The relationship between disclosed financial information and stock prices cannot be fully explained by valuation models alone but should be understood within a multidimensional theoretical framework that incorporates perspectives from corporate governance, information economics, and market mechanisms. Accordingly, this study builds its theoretical foundation on five key pillars: (1) stakeholder theory, (2) agency theory, (3) the decision-usefulness theory of accounting information, (4) the efficient market hypothesis, and (5) signaling theory.
Stakeholder theory suggests that firms are not solely responsible for maximizing shareholder value but must also address the interests of a broader group of stakeholders, including creditors, employees, customers, suppliers, and regulators. In capital markets, financial disclosure serves as a critical mechanism through which firms maintain legitimacy and trust among stakeholders. The stock market functions not only as a platform for capital raising and allocation but also as an information-processing mechanism within the economy. Stock prices reflect the aggregation of economic and financial information as well as investors’ expectations regarding future firm performance. Within this framework, information disclosure plays a central role in enabling stakeholders to assess firm value and make informed decisions. Moreover, firm characteristics, institutional environments, and macroeconomic conditions may influence both the level of disclosure and the extent to which information is incorporated into stock prices. This implies that the relationship between financial information and stock prices is systemic and shaped by multiple stakeholder interests.
Agency theory emphasizes the separation between ownership and control within modern corporations, which creates agency costs and information asymmetry between managers and shareholders. Managers often possess more detailed and timely information about the firm’s operations than external investors, giving rise to potential moral hazard and opportunistic behavior. High-quality financial disclosure helps mitigate these agency problems by improving transparency and reducing information asymmetry. As transparency increases, stock prices are more likely to reflect the firm’s intrinsic value. Conversely, limited transparency may increase the risk of stock price crashes and reduce firm valuation. From this perspective, information disclosure functions not only as a regulatory requirement but also as an important governance mechanism that helps reduce agency costs and improve market efficiency.
The decision-usefulness theory of accounting information posits that the primary objective of financial reporting is to provide information that is useful for economic decision-making. The usefulness of financial information is typically evaluated based on its relevance and reliability, particularly its ability to assist investors in predicting future cash flows and assessing risk. When financial information is both relevant and reliable, investors can make more accurate judgments about firm value, which are subsequently reflected in stock prices. High-quality financial reporting therefore reduces information asymmetry and enhances the usefulness of accounting information in the valuation process.
The efficient market hypothesis (EMH) suggests that stock prices fully and rapidly incorporate publicly available information. In the presence of information asymmetry, financial disclosure acts as a mechanism that enables markets to move closer to an efficient equilibrium. Uneven distribution of information may lead to mispricing, undervaluation, and higher investment risk. When information is not disclosed in a timely and transparent manner, market prices may fail to accurately reflect firms’ underlying fundamentals. Empirical evidence provided by Healy and Palepu (2001) indicates that capital markets function more efficiently when firms disclose financial information in a comprehensive and reliable manner. Thus, from an efficient market perspective, the degree to which accounting information is reflected in stock prices depends on the transparency, credibility, and timeliness of financial disclosures.
Signaling theory explains how firms communicate private information about their quality and future prospects to the market through observable actions that may involve significant costs. In financial markets, signals such as dividend payments, voluntary disclosures, and investments in high-quality projects can convey positive information about a firm’s financial health and growth prospects. Effective signals must involve credible costs or commitments, making them difficult for lower-quality firms to imitate. Signaling theory is therefore closely related to agency theory in explaining corporate disclosure behavior. Investors’ reactions to such signals—particularly negative signals—may significantly influence stock price movements and volatility. Consequently, financial indicators such as earnings per share (EPS), dividends per share (DPS), and other disclosure-related variables may affect stock prices through signaling mechanisms.
These five perspectives are not competing explanations to be tested against one another. They describe successive stages of a single process, and the study uses them in that order. Stakeholder theory establishes why firms disclose at all; agency theory explains why disclosure is incomplete and why its quality varies with governance; the decision-usefulness criterion specifies what makes disclosed information capable of changing an investment decision; signalling theory identifies the items costly enough to be credible; and the efficient market hypothesis supplies the condition under which credible information reaches prices. The empirical model tests the last link in that chain, and no hypothesis below is presented as discriminating between the theories.

3.2. Applicable Pricing Models

The Dividend Discount Model (DDM) represents one of the earliest theoretical foundations in asset pricing. According to this model, the intrinsic value of a stock equals the present value of all expected future dividends discounted at the investor’s required rate of return. The theoretical implication of the DDM is that stock prices reflect investors’ expectations regarding future distributions of benefits to shareholders. Consequently, factors that influence a firm’s dividend-paying capacity—such as profitability, cash flow generation, and growth prospects—can indirectly affect stock valuation.
The Residual Income Model (RIM) extends the traditional dividend valuation approach by expressing firm value in terms of accounting-based measures. Under this framework, the market value of equity equals the current book value of equity plus the present value of expected future residual income. Residual income is defined as the portion of accounting earnings that exceeds the required return on equity capital. This model is particularly important because it establishes a direct connection between accounting variables—such as book value and earnings—and firm valuation, thereby providing a theoretical basis for value relevance research.
Building on the residual income framework, Ohlson (1995) expresses price as a linear function of current book value, current earnings and other information about future earnings, linked by the clean surplus relation under which changes in book value are explained by earnings and dividends. Three properties make this framework suitable here. It establishes a direct correspondence between accounting variables and market valuation, it maps readily onto a panel regression in which book value per share and earnings per share are the principal explanatory variables, and it accommodates the periodic rather than continuous nature of accounting disclosure. The framework is therefore adopted as the theoretical basis for the empirical model specified in Section 3.4.

3.3. Research Hypotheses

Based on the theoretical foundations and empirical evidence discussed above, this study develops a set of hypotheses concerning the value relevance of accounting information in an emerging market and under different macroeconomic conditions. Hypotheses 1 to 5 concern accounting items, Hypotheses 6 and 7 concern firm characteristics, Hypothesis 8 concerns the direct effect of macroeconomic conditions, and Hypothesis 9 concerns their moderating effect on the pricing of accounting information.

3.3.1. Four Propositions

The theoretical discussion above yields four propositions, which the hypotheses stated in this section operationalise. Setting them out first makes clear which of the hypotheses test competing predictions and which are auxiliary.
Proposition 1.
Concerns the relative weight of the two core valuation variables. The Ohlson framework and the literature on earnings persistence imply that earnings should carry the larger weight where earnings are informative about future cash flows. The credibility argument set out in Section 2.2 implies the opposite where enforcement is weak, because book value depends less on managerial judgement. Both predict that the two variables are priced; they differ on which dominates. Hypotheses 1 and 2 operationalise this proposition, and the test that discriminates between the two predictions is the comparison of economic magnitudes in Section 4.2.1 together with the bounds on selection in Section 4.7.
Proposition 2.
Concerns information overlap. If earnings per share summarises what accounting profitability and operating cash flow convey about value, then those measures should be significant when entered on their own and insignificant when entered alongside earnings. Hypotheses 3 to 5 operationalise this proposition.
Proposition 3.
Concerns firm characteristics. Leverage should be negatively and size positively associated with prices, through risk and information asymmetry channels, respectively. Hypotheses 6 and 7 operationalise this proposition.
Proposition 4.
Concerns the macroeconomic state. If value relevance is state dependent, the valuation weights should differ between favourable and adverse states. The proposition is tested item by item, because a decline in aggregate explanatory power is consistent both with uniform attenuation of every coefficient and with stability of the core variables combined with instability of the supplementary ones, and the two carry different implications. Hypotheses 8, 9a and 9b operationalise this proposition.

3.3.2. Hypothesis Development

Book Value and Stock Prices
According to the valuation framework proposed by Ohlson (1995), the market value of equity is determined by book value and expected future earnings. Book value represents the accumulated value of a firm’s net assets and may serve as a valuation anchor when uncertainty is high (Penman, 2013). Collins et al. (1997) also document that the importance of book value in explaining firm value tends to increase over time, particularly when earnings become less stable. In emerging markets, where information asymmetry is typically higher (La Porta et al., 1998), investors may rely more heavily on fundamental asset-based indicators such as book value.
H1. 
Book value per share (BVPS) has a positive impact on stock prices.
Earnings and Stock Prices
Accounting earnings are widely regarded as one of the most important sources of information for investors. Ball and Brown (1968) and Beaver (1968) provide early evidence that earnings announcements contain significant informational content for capital markets. Easton and Harris (1991) further demonstrate that both the level of earnings and changes in earnings help explain stock returns. However, the informational value of earnings depends on earnings quality and persistence (Kothari, 2001; Dechow et al., 2010). Under the efficient market hypothesis (Fama, 1970), if earnings provide credible signals about future cash flows, stock prices are expected to respond positively.
H2. 
Earnings per share (EPS) have a positive impact on stock prices.
Dividends and Stock Prices
According to signaling theory, dividend policy can convey information about firms’ future cash flow prospects and financial stability (Bhattacharya, 1979; Miller & Rock, 1985). Higher dividend payouts may therefore be interpreted by investors as a signal of sustainable profitability. However, in emerging markets, dividend policies may also be influenced by liquidity constraints, ownership concentration, or corporate governance structures, potentially weakening the consistency of dividend signals.
H3. 
Dividends per share (DPS) have a positive impact on stock prices.
Profitability and Stock Prices
Return on assets (ROA) reflects the efficiency with which a firm utilizes its assets to generate profits and is often used as an indicator of operational performance. A higher ROA indicates more efficient asset utilization and stronger profitability, which may enhance investors’ expectations regarding future cash flows and dividends. Consequently, firms with higher profitability may receive higher market valuations. Although empirical evidence on the relationship between ROA and stock prices varies across contexts, many studies suggest a generally positive association (Choiriyah et al., 2021).
H4. 
Return on assets (ROA) has a positive impact on stock prices.
Cash Flow and Stock Prices
Cash flow from operating activities provides important information about firms’ actual financial performance. Livnat and Zarowin (1990) show that cash flow contains incremental informational value beyond accounting earnings in explaining stock returns. Sloan (1996) further argues that financial markets may price accrual and cash flow components differently. In situations where earnings are affected by accounting adjustments or potential earnings management, operating cash flow may serve as a more reliable indicator of firm performance.
H5. 
Operating cash flow has a positive impact on stock prices.
Financial Leverage and Stock Prices
Financial leverage influences the risk profile of equity. According to Modigliani and Miller (1958, 1963), capital structure is irrelevant to firm value in perfect markets. However, when taxes, bankruptcy costs, and financial distress risks are considered, higher leverage may increase firm risk. As a result, investors may require a higher expected return, leading to lower market valuations. Empirical asset pricing studies such as Fama and French (1993) also highlight the importance of risk-related factors in determining stock returns.
H6. 
Financial leverage has a negative impact on stock prices.
Firm Size and Stock Prices
Firm size has long been recognized as an important factor in explaining stock returns. Fama and French (1992) identify a size effect, indicating that firm size is associated with differences in risk and expected returns. Larger firms generally exhibit greater transparency, more stable operations, and better access to external financing. In emerging markets, firm size may also reflect stronger governance structures and higher credibility of disclosed information.
H7. 
Firm size has a positive impact on stock prices.
GDP Growth and Stock Prices
Macroeconomic conditions play an important role in shaping stock market performance. In asset pricing frameworks, GDP growth is often interpreted as a signal of overall economic expansion and business prospects. When the economy grows rapidly, firms are more likely to experience higher profitability and improved growth opportunities, which may positively influence stock prices. This perspective is consistent with the efficient market hypothesis (Fama, 1970), which suggests that stock prices incorporate macroeconomic information. Empirical studies in emerging economies such as Nigeria (Olawale, 2024) also document a positive association between GDP growth and stock market performance, although that study treats GDP as the dependent variable.
H8. 
GDP growth has a positive impact on stock prices.
Macroeconomic Conditions and State Dependence
The preceding hypotheses treat the coefficients on accounting variables as constants. Section 2.2 argued that they may instead vary with the macroeconomic state, and two mechanisms point in the same direction. An increase in aggregate uncertainty raises the discount-rate component of the variance of prices and mechanically reduces the share attributable to cash-flow news (Kothari & Shanken, 1997). Separately, an adverse shock raises doubt about whether reported numbers remain informative about near-term prospects, which reduces the weight investors place on them (Barth & Landsman, 2010; Liu & Sun, 2022; Al-Khasawneh et al., 2024).
The two mechanisms are distinguishable. A discount-rate effect attenuates all accounting coefficients in proportion, whereas a credibility effect should bear most heavily on the items whose measurement depends most on managerial judgement. The hypothesis is therefore stated as a restriction on slope coefficients and is tested item by item rather than through a single measure of explanatory power. It is divided into two parts corresponding to two independent definitions of the state, and Section 3.4.2 sets out how each is estimated.
H9a. 
The association between accounting information and stock prices is weaker in years in which GDP growth is below its sample mean than in years in which it is above the sample mean.
H9b. 
The association between accounting information and stock prices is weaker during the COVID-19 period (2020 and 2021) than outside it.

3.4. Empirical Model and Estimation Strategy

This section sets out the baseline specification, the design used to test state dependence, the measurement of each variable, and the reasoning behind the choice of estimator.

3.4.1. Baseline Specification

Following the residual income structure of Ohlson (1995), share prices are modelled as a linear function of accounting items, firm characteristics and macroeconomic conditions. The baseline specification is
SharePriceit = β0 + β1BVPSit + β2EPSit + β3DPSit + β4ROAit + β5Cashflowit + β6Leverageit + β7Sizeit + β8GDPt + β9Inflationt + μi + εit
where i indexes firms and t indexes years, μi denotes the firm-specific effect and εit the idiosyncratic error. Year effects are excluded from Equation (1) because GDPt and Inflationt are constant within a year and would be perfectly collinear with them; the specification with year effects added, in which the two macroeconomic variables are dropped.

3.4.2. Testing State Dependence (Hypothesis 9)

Hypothesis 9 concerns slope coefficients, so it cannot be tested by adding GDP growth or a pandemic indicator to Equation (1). Such terms shift the intercept and leave the accounting coefficients unchanged. Two complementary designs are therefore used, and both are reported because they have different strengths.
The first is a fully interacted specification. Let Statet be an indicator equal to one when the economy is in the adverse state and zero otherwise, and let Xk,it denotes the k-th element of the vector of accounting and firm-level variables. Then
SharePriceit = β0 + ΣkβkXk,it + Σkδk(Xk,it × Statet) + μi + λt + εit
Under H9 the interaction coefficients δk are negative for those Xk carrying a positive coefficient in the favourable state, and the joint restriction δ1 = … = δK = 0 is rejected by a Wald test. Because Statet varies only over time it is absorbed by the year effects λt and enters only through the interactions, which is the correct restriction given that the hypothesis concerns slopes rather than levels. This specification delivers a formal test of the difference in each coefficient.
The second design estimates Equation (1) separately within each state, giving state-specific coefficient vectors that can be compared directly:
SharePriceit = β0(s) + Σkβk(s)Xk,it + μi(s) + εit, s ∈ {adverse, favourable}
The split-sample form allows the firm effects and the error variance to differ across states, which the interacted form restricts to be common, and it is directly interpretable. Its weakness is that it does not test whether the state-specific coefficients differ from one another: a coefficient may be significant in one subsample and insignificant in the other simply because the second subsample is smaller. Section 4.5 shows that this distinction is decisive for the pandemic split, where the adverse subsample contains only two years. Both designs are therefore reported, and inference about H9 rests on the interaction test.
The state is defined in two independent ways. The first is cyclical: Statet equals one in years in which annual GDP growth falls below its 2009 to 2024 sample mean of 5.885 per cent, and zero otherwise. Using the sample mean rather than an externally chosen threshold avoids selecting a cut-off with knowledge of the results, and it divides the panel into 2834 and 5148 observations. The second is event-based: Statet equals one in 2020 and 2021 and zero in all other years. The two definitions produce different partitions, so agreement between them is informative.

3.4.3. Variable Measurement

SharePrice is the market price of one ordinary share at the end of the firm’s fiscal year, expressed in Vietnamese dong. This is a price-level rather than a returns specification, which follows the Ohlson structure and is the standard design in the value relevance literature. Measuring price at the fiscal year end means that the annual financial statements for that year are not yet public at the measurement date, so the specification estimates the association between price and contemporaneous fundamentals rather than the market’s reaction to their release.
BVPS is book value of equity divided by shares outstanding, where shares outstanding equals listed shares less treasury shares. EPS is basic earnings per share as reported. DPS is total cash dividends declared to ordinary shareholders divided by the number of ordinary shares. ROA is profit after tax divided by total assets. Cashflow is net cash flow from operating activities scaled by total assets. Leverage is total liabilities divided by total assets. Size is the natural logarithm of total assets. GDP is annual real GDP growth and Inflation is annual consumer price inflation, both as decimals.
Two measurement choices require comment. All continuous firm-level variables are winsorised at the first and ninety-ninth percentiles before estimation, so the estimates are not driven by a small number of extreme observations; the minima and maxima are the winsorised values. The dependent variable is retained in levels rather than logarithms, because a logarithmic transformation would change the object being estimated from the amount of price associated with one additional dong of book value, which is the quantity the Ohlson structure delivers and which is directly interpretable, into an elasticity. The levels form is therefore retained throughout.
Market-to-book is deliberately excluded from the controls. Because market-to-book is the ratio of the dependent variable to BVPS, including it on the right-hand side of a price-level regression that already contains BVPS would place the dependent variable among the regressors and make the estimates mechanically endogenous. This is a structural objection rather than an empirical one, and it applies regardless of what the estimated coefficient turns out to be.
Table 1 defines every variable used in the analysis, together with its operational measurement and source. Section 3.4.4 then sets out the treatment applied to the data before estimation (see Table 1).

3.4.4. Data Treatment

Outlier treatment and winsorization. All continuous variables, including the dependent variable, are winsorised at the first and ninety-ninth percentiles before estimation. Values below the first percentile are set to the first percentile and values above the ninety-ninth percentile to the ninety-ninth, so that no observation is deleted and the sample size is unaffected. Table 2 reports the minimum and maximum of each variable before and after the procedure, together with the proportion of observations altered. The proportion is 2.0 per cent for every continuous variable, as the rule implies, and 0.9 per cent for dividends per share, where a large number of legitimate zero values fall below the first percentile. The effect is material: unwinsorised earnings per share ranges from −17,249 to 73,001 dong, against −3056 to 14,407 after treatment.
Functional form and transformation. The baseline specification is estimated in levels rather than logarithms, because a logarithmic transformation changes the object being estimated from the amount of price associated with one additional dong of book value or earnings, which is the quantity the Ohlson structure delivers and which Section 4.2.1 interprets, into an elasticity. Since the paper reports and compares those valuation weights, the levels form is the appropriate baseline. A logarithmic specification is nevertheless estimated for the strictly positive variables, and the substantive conclusions are unchanged: the elasticities of price with respect to book value and earnings are 0.474 and 0.105, respectively, both significant at the 1 per cent level, and the within R-squared is 0.357 against 0.348 for the levels form. These results are reported in Section 4.6.
Scaling. Monetary variables are expressed in dong per share rather than deflated by an index, because the Ohlson structure relates price per share to book value and earnings per share. Firm size enters as the logarithm of total assets, which is already a scale-free measure. Macroeconomic variables enter as decimals (see Table 2).

3.4.5. Choice of Estimator

The choice of estimator is guided by the structure of the panel and not by specification tests alone. Share prices differ across firms for reasons that are persistent and largely unobserved, including ownership structure, the quality of internal governance, franchise value and industry membership. If these are correlated with the regressors, which is likely given that governance quality plausibly affects both leverage and reported earnings, then pooled ordinary least squares is inconsistent, and the random effects estimator is inconsistent as well because it requires the unobserved effect to be orthogonal to the regressors. The fixed effects estimator does not require that assumption and removes all time-invariant firm heterogeneity, whether observed or not. The cost is that coefficients are identified only from within-firm variation over time and that time-invariant regressors cannot be estimated, neither of which is restrictive for the question addressed here.
The formal tests are consistent with this reasoning. The F test rejects the null of common intercepts, the Breusch and Pagan Lagrange multiplier test rejects the null of zero variance in the firm-specific component, and the Hausman test rejects equality of the fixed and random effects coefficient vectors. The fixed effects estimator is therefore both theoretically preferred and empirically supported.
Post-estimation diagnostics reject homoskedasticity and reject the absence of first-order autocorrelation. Standard errors are therefore clustered at the firm level, which is robust to heteroskedasticity and to arbitrary correlation of the errors within a firm over time. The Pesaran test also rejects the absence of cross-sectional dependence, and Section 4.6 reports how that is addressed.
Two limitations of this design should be stated. The fixed effects estimator removes time-invariant omitted variables but not time-varying ones. And the specification is static, so it does not accommodate partial adjustment of prices to information.

3.4.6. Dynamic Panel Estimation

A dynamic panel specification estimated by the generalised method of moments is a natural extension of this design, and it is worth setting out why it is not adopted as the baseline.
The Arellano and Bond and Blundell and Bond estimators instrument the lagged dependent variable with its own further lags under the assumption that the series is not close to a unit root. Share prices are close to a random walk at annual frequency, so the correlation between the level of price and its lagged differences is weak. Under those conditions the instruments are weak, the system estimator is biased towards the pooled ordinary least squares estimate, and the reported standard errors understate the true uncertainty. With sixteen time periods and 631 firms the instrument count also grows quadratically in T and would exceed the number of cross-sectional units unless the instrument matrix is collapsed, which reintroduces weak identification.
A more fundamental point is that the object of a value relevance study is the contemporaneous association between reported numbers and price under the Ohlson valuation structure, not the dynamic adjustment path of price. Introducing a lagged dependent variable changes the estimand: the coefficient on BVPS would then measure the short-run association conditional on last year’s price, which is close to zero by construction for a near random walk, rather than the valuation weight the literature seeks to estimate. The static fixed effects specification is retained for that reason.

3.4.7. Tests for Endogeneity and Reverse Causality

Value relevance research estimates the association between reported accounting numbers and market prices under the Ohlson valuation structure. That association is an equilibrium relation rather than a causal effect, and the coefficients are valuation weights rather than treatment effects. This is the standard interpretation in the literature, but it is worth stating explicitly, because it defines what the estimates can and cannot support and it determines which threats to identification matter.
Three such threats are relevant here, and each is addressed in Section 4.7. The first is simultaneity. The dependent variable and the accounting variables are measured at the same fiscal year end, so a contemporaneous specification cannot separate the pricing of reported information from any influence prices exert on reporting. The second is reverse causality specifically. Share prices may affect subsequent accounting numbers through several channels: a high price facilitates equity issuance, which changes book value per share; a price fall below carrying value can trigger impairment testing, which affects reported earnings; and price pressure may influence discretionary accruals and the timing of recognition. The third is omitted variables that vary over time and are therefore not absorbed by the firm fixed effects.
The design addresses these in four ways. A lagged specification regresses price at the end of year t on accounting information from year t minus one. This makes the regressors predetermined with respect to the dependent variable, and it also removes the timing objection raised in Section 3.4.3, since the annual statements for year t minus one are public before the price is measured. A dynamic specification adds the lagged share price, so the accounting coefficients are identified from information not already impounded in the previous year’s price. An Arellano and Bond difference generalised method of moments estimator instruments the differenced lagged price and the two endogenous accounting variables with their own lagged levels. And bounds on selection following Oster (2019) quantify how much selection on unobservable factors, relative to selection on the observable controls, would be required to drive each coefficient to zero.
The direction of any feedback is also tested directly. Section 4.7 reports first-difference regressions of price changes on lagged accounting changes and of accounting changes on lagged price changes, with the coefficients standardised so that the two directions are comparable. Reporting both directions is more informative than asserting that reverse causality is absent, and Section 4.7 states what the evidence shows rather than what would be convenient.

3.5. Research Sample and Data Sources

The research sample consists of 631 non-financial firms listed on the Vietnamese stock market during the period 2009–2024. The dataset is obtained from the FiinPro database, which provides publicly disclosed financial statements, stock price data, and macroeconomic indicators such as GDP growth and inflation. Using a single consistent data source helps ensure data reliability and comparability across firms and time periods.
Financial institutions—including banks, insurance companies, and securities firms—are excluded from the sample due to their distinct regulatory frameworks, specialized financial reporting structures, and significantly different capital structures compared with non-financial firms. In particular, financial firms typically operate with substantially higher leverage and follow industry-specific accounting standards, which may affect the comparability of financial indicators.
The selected period (2009–2024) covers several important economic phases in Vietnam, including the post-global financial crisis recovery period, a phase of relatively stable economic growth, the macroeconomic shock associated with the COVID-19 pandemic, and the period of monetary tightening from 2022 to 2024. Examining a relatively long-time horizon enables the study to better capture stock market dynamics and evaluate how investors incorporate financial information into stock prices across different economic conditions.
The sample is drawn from FiinPro and covers 631 non-financial firms listed on the Ho Chi Minh and Hanoi exchanges over 2009 to 2024. Financial institutions are excluded because their regulatory framework, capital structure and reporting standards differ from those of non-financial firms. The panel is unbalanced because firms enter as they list and because some items are not reported in every year; listwise deletion across all model variables gives the 7982 firm-year observations used in estimation.
The share price series requires explanation. The price field extracted in the original download was incomplete for the years before 2024, with a substantial proportion of firm-years returned as blank and the remainder inconsistent with published closing prices. The series used here is therefore reconstructed as the product of the price-to-book ratio and book value per share, both taken from the same FiinPro extract and both measured at the fiscal year end. The reconstruction was validated against the 2024 price field, which is complete and matches published closing prices: across the 627 firms available in that year the correlation between the reconstructed and the reported price is 0.953, the median ratio of the two is 0.96, and 89.6 per cent of firms lie within 30 per cent. The reconstructed series is used for all years so that the measurement basis is uniform across the sample period. Because the price-to-book ratio is reported to a finite number of significant digits, the reconstructed price contains rounding error; this is classical measurement error in the dependent variable, which inflates the residual variance and biases the estimated coefficients towards zero, so the estimates reported below are conservative.(see Table 3).
Mean book value per share of 16,963 dong and mean share price of 22,949 dong give a market-to-book ratio of about 1.35 for the average firm-year, which is consistent with a market trading at a modest premium to conservatively measured net assets. Mean EPS of 2436 dong with a standard deviation of 2794 dong and a minimum of −3056 dong shows that loss firms are present throughout the sample. GDP growth averages 5.9 per cent with a standard deviation of 1.4 percentage points and inflation averages 5.0 per cent with a maximum of 18.1 per cent, so the sample period contains genuine macroeconomic variation rather than a single regime (see Table 4).
Share prices correlate most strongly with earnings per share and book value per share, which is the ordering the regression results confirm. The highest correlation among the regressors is 0.776 between EPS and ROA, followed by 0.667 between BVPS and EPS. These are overlapping measures of related constructs, and Section 4.6 reports the variance inflation factors and the specifications entering each profitability measure separately.

4. Research Results

4.1. Selection of the Estimation Method

Before performing baseline regression, the authors conducted tests to select a suitable estimation method. Table 5 reports the results of these tests.
Based on the panel dataset, several model selection tests were conducted to determine the appropriate estimation approach. The results of the F-test, Breusch–Pagan Lagrange Multiplier (LM) test, and Hausman test all yielded statistically significant results (with very small p-values), indicating that the fixed effects model (FEM) was the most appropriate specification for the analysis.
Following the estimation of the fixed effects model, diagnostic tests were performed to examine potential econometric issues. The results indicated no evidence of autocorrelation; however, the assumption of homoskedasticity was violated, suggesting the presence of heteroskedasticity in the error terms. To address this issue and ensure more reliable statistical inference, the study employed cluster-robust standard errors at the firm level, which account for heteroskedasticity and within-firm error correlation. Table 6 reports these post-estimation diagnostic tests.

4.2. Baseline Regression Results

The regression results indicate that BVPS, firm size, and GDP growth have a positive and statistically significant impact on stock prices at the 1% significance level. In contrast, financial leverage and inflation exhibit negative effects on stock prices and are statistically significant at the 5% level.
The regression results indicate that book value per share, earnings per share and firm size are positively and significantly associated with share prices, while inflation is negatively associated with them. Earnings per share carries the largest economic weight of the accounting variables. Dividends per share, return on assets, operating cash flow and financial leverage are not statistically significant once earnings are controlled for, and Section 4.6 shows that for return on assets and operating cash flow this reflects the overlap of their information content with earnings rather than an absence of association with prices.
Table 7 reports the baseline fixed effects estimates. Book value per share, earnings per share and firm size are positively and significantly associated with share prices, and inflation is negatively associated with them. Dividends per share, return on assets, operating cash flow and financial leverage are not significant. Hypotheses 1, 2 and 7 are therefore supported, and Hypotheses 3, 4, 5 and 6 are not (see Table 7).

4.2.1. Economic Significance of the Estimates

Statistical significance alone does not establish that a variable matters for valuation, so the estimated coefficients are also assessed against the dispersion of the variables in Table 3 and the mean share price of 22,949 dong.
The coefficient on EPS of 3.211 implies that one additional dong of reported earnings per share is associated with 3.21 dong of share price, which corresponds to a capitalisation multiple of roughly three within a firm over time. Evaluated at one standard deviation of EPS, which is 2794 dong, this corresponds to 8973 dong, or 39.1 per cent of the mean share price. The coefficient on BVPS of 0.460 implies that the market capitalises about 46 per cent of an incremental dong of recorded book equity; at one standard deviation of 8568 dong this is 3938 dong, or 17.2 per cent of the mean price. A one standard deviation increase in the logarithm of total assets is associated with 2611 dong, or 11.4 per cent, and a one standard deviation increase in inflation with a fall of 2475 dong, or 10.8 per cent.
The ordering is the substantive result. Earnings carry more than twice the economic weight of book value. This provides no support for the expectation, common in the emerging-market literature and discussed in Section 1, that investors facing weaker reporting credibility should rely mainly on the balance sheet. As Section 1 notes, that expectation is weaker than it is often taken to be, because book value cumulates past earnings under the clean surplus relation and therefore inherits any discretion exercised in them. The magnitudes reported here are consistent with investors weighting the most salient reported figure most heavily, which is what the limited attention literature would predict for a market in which individual investors supply the majority of trading volume.

4.2.2. Explanatory Power of the Model

The within R-squared of 0.348 indicates that the model explains about 35 per cent of the variation in share prices that occurs within a firm over time, after every time-invariant difference between firms has been absorbed by the fixed effects. This is a demanding benchmark: the fixed effects transformation removes the cross-sectional scale variation that dominates pooled Ohlson price regressions, and what remains is the year-to-year movement of a given firm’s price around its own mean, which contains a large component attributable to changes in discount rates and market-wide sentiment.
The explanatory power is also stable. The results show that adding year effects, which absorb every shock common to all firms in a given year, reduces the within R-squared only from 0.348 to 0.307 and leaves the coefficients on earnings and book value almost unchanged. Excluding any single year from the sample leaves the within R-squared between 0.332 and 0.365 and the coefficients on EPS between 3.076 and 3.402 and on BVPS between 0.388 and 0.492. The result is therefore not attributable to any particular year.

4.2.3. Dividends, Profitability and Operating Cash Flow

DPS, ROA and operating cash flow are not significant in the baseline model, and the robustness tests identify why.
We re-estimates Equation (1) entering each profitability measure on its own. ROA alone is strongly positive and significant, and operating cash flow alone is positive and significant. Both therefore carry information about prices; they lose significance in the full model because that information is already contained in earnings per share. This is not a collinearity pathology in the usual sense, since the variance inflation factors reported in Section 4.6 are all below seven and the mean is 2.49. It is a substantive result about the information content of the three measures: reported earnings per share subsumes what accounting profitability and operating cash flow convey about value in this market.
The coefficient on BVPS rises from 0.460 in the full model to 0.958 when ROA replaces the three profitability measures and to 1.134 when operating cash flow does, which is the expected consequence of removing a correlated regressor rather than evidence against the baseline. Dividends per share remain insignificant in every specification, which is consistent with the Miller and Modigliani proposition that payout policy conveys no information beyond the earnings that fund it, once earnings are controlled for.

4.3. Results by Industry

Table 8 estimates Equation (1) separately for nine industries. The telecommunications sector is excluded because it contains a single listed firm (see Table 8).
Book value and earnings are jointly priced in most industries, and the within R-squared ranges from 0.301 in basic materials to 0.553 in oil and gas, so the model performs at least as well within industries as in the pooled sample. What varies is the relative weight of the two measures, and it varies in an interpretable way.
Book value carries the larger relative weight in utilities, consumer goods and consumer services, and earnings are insignificant in utilities. These are industries with a high proportion of tangible, long-lived assets and comparatively stable demand, and they are the setting in which an unrevalued historical cost balance sheet comes closest to a meaningful measure of recoverable value. Earnings carry the larger weight, and book value is insignificant, in pharmaceuticals and healthcare and in oil and gas. In the first, value depends on research capability and product portfolios that the balance sheet does not record; in the second, the recorded carrying value of reserves and infrastructure is a weak guide to their economic value at prevailing commodity prices. Information technology is the one industry in which neither measure attains conventional significance, which is consistent with the same logic taken further: the assets that generate value there are almost entirely unrecorded, and reported earnings are a poor proxy for them.
The pattern therefore follows the extent to which recorded assets capture the source of value in each industry, rather than the extent to which disclosure compliance differs across industries. Real estate and construction, which report the lowest compliance in the disclosure surveys discussed in Section 2.2, show book value and earnings both significant and a within R-squared of 0.430, above the pooled figure.

4.4. Results by Firm Size

Table 9 splits the sample by total assets, using 300 billion dong as the threshold that separates large firms from small and medium firms in Vietnamese practice (see Table 9).
The two groups are more similar than the institutional argument of Section 2.2 would predict. Earnings are significant in both, with almost identical coefficients of 2.888 for large firms and 2.791 for small and medium firms. Book value is significant in both and is in fact larger among small and medium firms, at 0.767 against 0.411. The within R-squared is 0.348 for large firms and 0.335 for small and medium firms.
This bears on the compliance channel discussed in Section 2.2. Disclosure compliance among small and micro-capitalisation firms was roughly 50 per cent in 2024 against roughly 85 per cent among large-capitalisation firms, so if compliance accounted for a large share of the cross-sectional variation in value relevance, the smaller group should price accounting information markedly less. The difference we observe is small relative to that gap. The one difference is in dividends, which attract a positive and marginally significant coefficient among large firms and an insignificant negative one among small and medium firms, consistent with a payout signal being read differently where reinvestment opportunities are more constrained. We report this as a magnitude rather than as evidence on which mechanism governs pricing, since the design does not identify the mechanism.

4.5. Results by Macroeconomic State: Testing Hypothesis 9

Table 10 reports the split-sample estimates and Table 11 the fully interacted specification with the Wald test of the joint restriction. Columns 2 and 3 of Table 10 split the sample at the sample mean of GDP growth, which corresponds to H9a; columns 4 and 5 split it at the COVID-19 years, which corresponds to H9b.
The split-sample estimates show earnings and book value significant in every state except one. Book value carries a coefficient of 0.481 in above-average growth years and 0.469 in below-average growth years, and earnings 3.467 and 2.536, respectively. The exception is the pandemic subsample, in which book value carries a coefficient of −0.031 with a t statistic of −0.08 while earnings remain significant at 1.836. Read on its own, that column would suggest that book value ceases to be priced during the pandemic. Table 10 reports these split-sample estimates.
The interaction tests in Table 11 do not support that reading. Under the cyclical definition the interaction between book value and the adverse state is 0.028 with a p value of 0.63, and the interaction with earnings is −0.665 with a p value of 0.13. Under the pandemic definition the corresponding interactions are 0.086 with a p value of 0.28 and −0.384 with a p value of 0.45. In neither case can the null of no difference be rejected. The apparent collapse of book value in the pandemic column of Table 10 reflects the imprecision of a subsample containing 1234 observations drawn from two years, not a reliable change in the valuation weight. H9a and H9b are therefore not supported for the two core accounting variables.
The joint restriction is nevertheless rejected under both definitions, with a chi-squared statistic of 60.53 on seven degrees of freedom for the cyclical split and 36.17 for the pandemic split, both significant beyond the 0.1 per cent level. The rejection is driven by two variables. Operating cash flow carries a positive and significant coefficient in the favourable state and a significantly negative interaction in both specifications, so its pricing disappears when conditions deteriorate. Firm size carries a significantly positive interaction in both, so scale matters more in adverse states than in favourable ones.
State dependence is therefore present, but it operates on the supplementary information set rather than on the core valuation variables. The pattern is consistent with a shift in what investors use as a secondary signal rather than with a general loss of confidence in financial reporting. When aggregate conditions are favourable, a firm generating cash from operations is rewarded for it beyond what its earnings already convey; when conditions deteriorate, that premium disappears and investors instead pay for size, which proxies for the capacity to absorb a shock. Earnings and book value continue to be priced at the same weights throughout. Table 11 reports the fully interacted specification and the associated Wald test.

4.6. Diagnostic Tests and Robustness

This subsection reports the diagnostic tests requested in review and the robustness analysis of the profitability measures. The full results are in Table 12.
Multicollinearity. Variance inflation factors were computed for every regressor in Equation (1). The largest is 6.85 for earnings per share and the next largest 5.10 for return on assets, with a mean of 2.49. All lie below the conventional threshold of 10 for secondary financial data, so the insignificance of the profitability measures in the baseline model is not attributable to collinearity in the technical sense. Columns 2 to 4 of Table 12 confirm this by entering each measure separately.
Cross-sectional dependence. Because all sample firms are exposed to the same macroeconomic and market-wide shocks, the errors may be correlated across firms within a year. The Pesaran test rejects the null of no cross-sectional dependence in the baseline specification, with a statistic of 116.23 and a mean pairwise residual correlation of 0.074. Adding year fixed effects, which absorb any shock common to all firms in a given year, reduces the mean pairwise correlation to 0.020, a reduction of 73 per cent, and the statistic to 31.96. The residual dependence is therefore small in magnitude, and the Pesaran statistic remains large mainly because it scales with the number of firms. Column 5 of Table 12 reports the specification with year effects and column 6 reports Driscoll and Kraay standard errors, which are robust to cross-sectional and temporal dependence as well as to heteroskedasticity. Earnings and book value remain significant at the 1 per cent level under both.
Robustness of the profitability results. Equation (1) is re-estimated entering earnings per share, return on assets and operating cash flow one at a time. Each is significant on its own, which establishes that their joint insignificance in the baseline reflects the overlap of their information content with earnings rather than an absence of association with prices. Table 12 reports these robustness specifications and Table 13 reports the variance inflation factors referred to above.

4.7. Results of Endogeneity and Reverse Causality Tests

Table 14 reports the four specifications described in Section 3.4.6, and the results separate cleanly.
Column 2 adds the lagged share price. Both core variables remain significant at the 1 per cent level, with book value at 0.244 and earnings at 2.375, and the within R-squared rises to 0.482. Because the lagged price already impounds all information available at the previous year end, this specification identifies the accounting coefficients from information that is new within the year, and both survive.
Columns 3 and 4 use accounting information from year t minus one. Both core variables remain significant, with book value at 0.165 and earnings at 2.014, and the pattern is unchanged when year fixed effects are added. The coefficients are smaller than in the baseline, which is expected: prices at the end of year t reflect information that is one year more recent than the regressors. Two variables that are insignificant in the baseline become significant when lagged. Dividends per share carries a coefficient of 1.786 and operating cash flow of 5215, both significant at the 1 per cent level. This is interpretable rather than anomalous: a dividend declared in respect of year t minus one is known to the market well before the end of year t, whereas the contemporaneous figure is not, and the same applies to realised operating cash flow.
Column 5 reports the difference generalised method of moments estimator. Here the two core variables are not significant. The specification diagnostics are nevertheless satisfactory: the test for second-order serial correlation in the differenced residuals does not reject, the Hansen test of the overidentifying restrictions does not reject, and the instrument count of 29 is well below the number of firms. The estimate of the coefficient on the lagged price also passes the check proposed by Bond (2002), lying between the pooled ordinary least squares estimate of 0.659, which is biased upwards, and the fixed effects estimate of 0.418, which is biased downwards.
The loss of significance in the generalised method of moments column should be read as a property of that estimator in this setting rather than as evidence against the baseline. Section 3.4.5 argued on prior grounds that share prices are close to a random walk at annual frequency, so lagged levels are weak instruments for differences; the estimate of 0.494 on the lagged price is consistent with that argument. The relevant comparison is with column 2, which retains the lagged dependent variable but estimates it in levels with firm fixed effects, and in which both core variables are strongly significant. Every specification that preserves within-firm variation in levels supports the baseline; the single specification that does not is the one whose identifying assumptions the data do not satisfy (see Table 14).
Table 15 reports the direction of feedback, with coefficients standardised so that the two directions are comparable. Changes in earnings predict subsequent changes in price, with a standardised coefficient of 0.096. Changes in price also predict subsequent changes in earnings, with a standardised coefficient of 0.110. The two are of similar magnitude, and the same pattern holds for book value at 0.023 and 0.046, respectively. Feedback from prices to accounting numbers is therefore present in this market and is not of second-order importance. We report this rather than treating reverse causality as a formality, and it is the reason the paper interprets its coefficients as valuation weights in an equilibrium relation rather than as causal effects. What the lagged and dynamic specifications establish is that the association is not an artefact of simultaneous determination, since it survives when the regressors are predetermined (see Table 15).
Table 16 reports the bounds on selection. For earnings, the ratio of selection on unobservables to selection on observables required to drive the coefficient to zero is 4.38 in the baseline specification and 7.98 in the lagged specification, and the bias-adjusted coefficients under the assumption of equal selection remain large and positive at 2.478 and 1.762. For book value the corresponding ratios are 0.95 and 0.66, and the bias-adjusted coefficients are approximately zero. Applying the conventional benchmark, the earnings result is robust to plausible degrees of selection on unobservables, and the book value result is not.
This asymmetry is reported because it qualifies one of the paper’s results, and Section 6 records it among the limitations. Three explanations are consistent with it and cannot be separated here. Book value varies less within firms over time than earnings do, and the fixed effects estimator uses only within-firm variation, so its coefficient is estimated from a narrower base. Book value is correlated with earnings at 0.667, so its incremental contribution is smaller. And the reconstruction of the price series described in Section 3.5 uses book value per share, so any rounding error in that series is correlated with the book value regressor in a way that it is not with earnings. The first and third of these are features of the data rather than of the market. What the result does establish is that the ordering documented throughout the paper, in which earnings dominate book value, is not an artefact of magnitude alone: it also holds when the two coefficients are compared on robustness (see Table 16).
Table 17 reports the logarithmic specification described in Section 3.4.4 alongside the levels form. The elasticities of price with respect to book value and earnings are 0.474 and 0.105 respectively, both significant at the 1 per cent level, and the within R-squared is 0.357 against 0.348 for the levels form, so the substantive conclusions are unchanged by the transformation (see Table 17).

4.8. Overall Assessment of Research Propositions

Table 18 summarises the evidence against the four propositions set out in Section 3.3.1.

5. Discussion and Recommendations

5.1. Discussion of Research Results

The empirical results indicate that both earnings and book value are associated with stock valuation in Vietnam, which is consistent with the framework proposed by Ohlson (1995) and with the empirical evidence in Collins et al. (1997). Earnings carry the larger weight, at more than twice the economic effect of book value evaluated at one standard deviation.
This ordering is the finding that most requires comment. It provides no support for the expectation that investors in emerging markets rely mainly on the balance sheet where enforcement is weak, but as Section 1 noted, that expectation is less firmly grounded than it is often taken to be. Under clean surplus, book value cumulates past earnings, so discretion exercised in earnings propagates into book value; the case for book value being the more credible measure rests on the reversing property of accruals and on the verifiability of recorded assets, both of which are matters of degree. Set against this, the limited attention literature predicts that where a large share of investors face high processing costs, prices reflect the most salient summary figure more heavily (Hirshleifer & Teoh, 2003), and earnings per share is that figure. Our result is consistent with the second mechanism dominating the first in this market. It holds within both firm size classes and across eight of the nine industries with estimable samples.
The endogeneity analysis in Section 4.7 bears on how these findings should be read. Feedback from prices to accounting numbers is present and is of similar magnitude to the association running in the conventional direction, which is why the coefficients are interpreted as valuation weights in an equilibrium relation rather than as causal effects. The substantive conclusions do not depend on that interpretation. Earnings and book value remain significantly priced when the regressors are predetermined, when the lagged price is included, and when the model is estimated in logarithms, and the ordering between them is unchanged in every case.
The bounds on selection add a distinction that the baseline table does not convey. The coefficient on earnings is robust to a degree of selection on unobservables several times that on the observed controls, whereas the coefficient on book value is not. Taken with the economic magnitudes reported in Section 4.2.1, this means the finding that earnings dominate book value in Vietnam rests on the more secure of the two estimates, which is the opposite of what the credibility argument would lead one to expect. If investors were discounting reported earnings because enforcement is weak, the earnings coefficient should be the fragile one.
The central empirical result is that accounting information is strongly and stably priced in the Vietnamese market, and that earnings rather than book value carry the larger valuation weight. Both findings bear on the emerging-market literature.
On the first, the model explains about 35 per cent of within-firm variation in prices after absorbing all time-invariant firm heterogeneity. That is not the profile of a market in which reported numbers are broadly disregarded. The finding is consistent with Chehade and Procházka (2024) for Saudi Arabia and with Srivastava and Muharam (2022) for India and Indonesia, and with Nguyen and Dang (2023), who report both earnings and book value priced in Vietnam over 2010 to 2020 with earnings explaining more variation. The present study extends their window through the monetary tightening of 2022 to 2024, adds profitability, cash-flow and macroeconomic variables, and reaches the same ordering of the two core measures.
On the second, the result provides no support for a widely invoked argument, although it does not refute it. Where reporting credibility is weaker, investors are expected to favour the balance sheet, on the reasoning that book value accumulates past transactions under historical cost and is bounded below by verifiable net assets, whereas earnings are exposed to accrual discretion. Vietnam has the institutional features that argument invokes, set out in Section 2.2. Yet earnings carry more than twice the economic weight of book value, the ordering holds among small firms as well as large ones, and value relevance is no weaker in the size class where disclosure compliance is roughly 50 per cent than in the class where it is roughly 85 per cent. One reading consistent with the evidence is that the enforcement gap documented in the disclosure surveys affects the timeliness and completeness of filing without proportionately affecting the informativeness of the reported earnings figure. We offer this as an interpretation rather than as a demonstration, since the design identifies the association between compliance and value relevance across size classes but does not isolate the mechanism.
The industry results support that reading. Where book value dominates, in utilities and consumer goods, the balance sheet records most of the assets generating value. Where earnings dominate, in pharmaceuticals and oil and gas, it does not. The relative weight of the two measures follows the economics of the asset base rather than the compliance gradient across industries: real estate and construction report the lowest compliance in the surveys yet return a within R-squared of 0.430, above the pooled figure.
The state-dependence results refine rather than confirm the existing literature. Liu and Sun (2022) find that both the explanatory power and the slope coefficient of earnings declined in the United States between 2019 and 2020, and Chae and Moon (2025) report a fall in the explanatory power of the Ohlson model in Korea across the same transition. The Vietnamese evidence agrees that something changes under macroeconomic stress but locates the change elsewhere. The valuation weights on earnings and book value are statistically indistinguishable across states under two independent definitions. What changes is the pricing of operating cash flow, which is rewarded in favourable states and not in adverse ones, and of firm size, which is rewarded more in adverse states.
This distinction has methodological consequences. A study that reported only the change in explanatory power between two periods would record state dependence in this sample and would naturally attribute it to the variables the Ohlson framework places at the centre. The item-by-item interaction test shows that attribution would be wrong. It also shows why split-sample evidence alone is insufficient: the pandemic column of Table 10 returns an insignificant coefficient on book value, but the interaction test cannot reject equality with the non-pandemic coefficient, because a two-year subsample cannot estimate the weight precisely. Reporting both designs, as recommended by the discussion in Section 3.4.2, is what makes the difference visible.
Substantively, the pattern is consistent with investors adjusting their secondary signal rather than abandoning financial reporting. In favourable conditions, cash generation beyond what earnings already convey is treated as evidence of quality. When conditions deteriorate, that premium disappears and scale is rewarded instead, which is what one would expect if investors shift from assessing performance to assessing the capacity to survive a shock. Neither shift requires them to revise their assessment of how much a dong of earnings or of book equity is worth.
The negative coefficient on inflation is economically the third largest effect in the model and is consistent across specifications. Inflation raises nominal discount rates and compresses real margins for firms unable to pass on input costs, and both channels depress the price at which a given stream of accounting fundamentals is capitalised. The coefficient on GDP growth is negative in the baseline. Because GDP growth and inflation are both constant within a year and the specification contains no year effects, these two coefficients are identified from sixteen annual observations and should be interpreted as describing the joint effect of the aggregate environment rather than as separate causal estimates; the specification with year effects in Table 12 absorbs both.

5.2. Practical Implications

Based on the empirical findings, several important implications can be derived for investors, listed companies, and regulatory authorities to improve the efficiency with which information is incorporated into stock prices and to enhance the overall functioning of the stock market.
Implications for Investors: The stock market functions as a mechanism for processing information and transforming it into prices through the trading behavior of market participants. However, due to the prevalence of information asymmetry, particularly in emerging markets, investors should avoid relying solely on individual accounting indicators such as earnings. Instead, investors should conduct a more comprehensive evaluation that includes the quality, transparency, and timeliness of financial disclosures. When financial information is both relevant and reliable, stock prices are more likely to reflect the intrinsic value of firms. Conversely, high levels of information asymmetry may increase investment risk and the cost of capital, potentially leading to undervaluation or excessive price volatility. Therefore, investors should integrate accounting analysis with assessments of corporate governance and macroeconomic conditions, especially during periods of elevated market uncertainty.
Implications for Listed Companies: For listed companies, high-quality financial disclosure plays a crucial role in reducing agency costs, limiting opportunistic managerial behavior, and strengthening investor confidence. Improved transparency allows stock prices to more accurately reflect the firm’s underlying value. Conversely, insufficient transparency may increase the risk of price crashes and firm undervaluation. In addition, voluntary disclosure practices and strong corporate governance mechanisms may serve as positive signals regarding firm quality and long-term prospects. However, disclosure practices and reporting quality often vary across firms depending on their size and industry characteristics. Therefore, enhancing financial reporting quality, strengthening internal control systems, and improving corporate governance should be considered not only regulatory obligations but also long-term strategies for increasing firm value in capital markets.
Implications for Regulators: In emerging markets, capital markets often face high levels of information asymmetry and evolving institutional frameworks. Under these conditions, improving the legal and regulatory framework for financial disclosure is essential for ensuring efficient market functioning. Regulatory authorities should therefore emphasize the enforcement of timely, accurate, and comprehensive information disclosure. At the same time, strengthening supervisory mechanisms and standardizing corporate governance practices are necessary because governance quality directly influences the reliability of financial reporting. Enhancing external monitoring mechanisms and reducing information asymmetry can improve the efficiency with which information is reflected in stock prices, thereby promoting more efficient capital allocation and supporting the sustainable development of the stock market.
Overall, these recommendations share a common objective: enhancing transparency, reducing information asymmetry, and strengthening market confidence, thereby improving pricing efficiency and contributing to financial market stability.

6. Conclusions

Using panel data from 631 non-financial listed firms in Vietnam over the period 2009 to 2024, this study examines the value relevance of accounting information under different macroeconomic conditions. Earnings per share and book value per share are both strongly priced, with earnings carrying the larger weight, and firm size is positively while inflation is negatively associated with prices. Dividends per share, return on assets, operating cash flow and leverage are not significant once earnings are controlled for. The model explains about 35 per cent of within-firm variation in prices. Testing the state-dependence restriction item by item shows that the valuation weights on earnings and book value do not differ between favourable and adverse macroeconomic states under either a cyclical or a pandemic definition, while the weights on operating cash flow and firm size do.
More importantly, the findings indicate that during periods of economic slowdown and heightened uncertainty, such as the COVID-19 period, stock prices respond less strongly to disclosed financial information. This result highlights the role of macroeconomic risk conditions in determining the value relevance of accounting information.
Three implications follow for the value relevance literature more generally.
The first concerns what should be reported when testing state dependence. The literature has asked whether value relevance declines under macroeconomic stress and has answered using the explanatory power of a price regression estimated separately in each period. The evidence here shows that a decline in that measure can coexist with complete stability in the coefficients on earnings and book value, because the movement is concentrated in the supplementary variables. Testing the restriction item by item, through interaction terms rather than through subsample comparison, is therefore not a refinement but a requirement, since the two approaches support different conclusions in this sample.
The second concerns the magnitude of the compliance channel. That reporting compliance and value relevance are conceptually distinct is established in the literature (Ball et al., 1993). What this study adds is an estimate of how much the compliance channel accounts for in a setting where compliance varies by a large and documented margin under one regulatory regime. The answer here is little: value relevance does not weaken in the size class where compliance is lowest. This suggests that the dimensions of disclosure quality captured by compliance surveys, which concern the timeliness and completeness of filing, and the informativeness of the reported numbers may be governed by different determinants in this market, and that measures of the former should not be used as proxies for the latter without evidence. Whether the same holds in settings with a different enforcement profile is an open question.
The third concerns identification. Because the hypothesis concerns slope coefficients rather than levels, adding a macroeconomic variable or a crisis indicator to a price regression does not test it, since such terms shift the intercept only. The split-sample and fully interacted designs set out in Section 3.4.2 are the appropriate tests, and the use of two independent definitions of the state, one cyclical and one event-based, provides a check that the result is not an artefact of a single episode or threshold.
For practice, the results carry a different message from the one a finding of general state dependence would carry. Because the valuation weights on earnings and book value are stable across macroeconomic states, there is no case for treating financial reporting as less useful to investors during downturns, and therefore no case for relaxing reporting requirements when conditions deteriorate. What does change is that supplementary signals lose their information content: operating cash flow ceases to be rewarded in adverse states. Disclosure that helps investors distinguish sustainable from transitory cash generation is accordingly most valuable precisely when it is least informative under current reporting practice, which argues for improving the quality of cash-flow reporting and its accompanying disclosure rather than extending the volume of what must be filed.
A fourth implication is methodological. Value relevance regressions are routinely estimated on contemporaneous data and interpreted without reference to simultaneity, on the reasoning that the estimand is an association rather than a causal effect. That reasoning is correct as far as it goes, but it does not establish that the reported association is invariant to the timing convention. Here it is: the ordering of earnings and book value survives when the regressors are lagged, when the lagged price is included and when the functional form is changed. Reporting those checks costs little and settles a question that is otherwise left open.
Despite these contributions, the study has several limitations. First, the empirical model focuses primarily on conventional accounting variables and may not fully capture other relevant determinants of stock prices. Second, the use of year-end stock prices may not adequately reflect short-term market reactions around financial statement announcement dates. Third, the analysis does not incorporate market risk indicators such as volatility, liquidity, or investor sentiment, which may play an important role in explaining the weakening of value relevance during crisis periods.
Fourth, the share price series is reconstructed from the price-to-book ratio and book value per share, for the reasons given in Section 3.5. The reconstruction is validated against complete 2024 data, but it carries rounding error that biases the estimated coefficients towards zero. Fifth, the analysis establishes that the weights on earnings and book value are stable across macroeconomic states without decomposing why the weights on operating cash flow and firm size are not; doing so would require a firm-level proxy for financial constraint that varies over time.
Sixth, the bounds on selection reported in Section 4.7 indicate that the coefficient on book value is less robust to unobserved confounding than the coefficient on earnings, and the analysis cannot separate the three explanations offered there. Seventh, feedback from prices to accounting numbers is present in the data and of similar magnitude to the association in the conventional direction, so the estimates are valuation weights in an equilibrium relation and should not be read as causal effects.
Future research could extend the analysis in several directions. First, event-based studies could examine market reactions around financial statement announcement dates. Second, incorporating market risk variables such as volatility and liquidity could help quantify the uncertainty channel through which macroeconomic shocks affect the informational value of accounting data. Third, future studies may explore nonlinear relationships or structural breaks in the association between accounting information and stock prices under different macroeconomic regimes.
Fourth, the reclassification of Vietnam to secondary emerging market status effective from September 2026 provides a natural setting in which to test whether a change in the composition of the investor base alters the pricing of accounting information, since the legal and reporting framework will be held approximately constant while institutional participation rises.

Author Contributions

Conceptualization, P.T.K.N.; Methodology, A.T.L.N.; Validation, P.T.K.N.; Resources, L.D.N.; Data curation, A.T.L.N. and L.D.N.; Writing—original draft, A.T.L.N.; Writing—review & editing, P.T.K.N., T.T.L.N., T.T.M.P. and L.D.N.; Visualization, T.T.M.P.; Supervision, T.T.L.N. All authors have read and agreed to the published version of the manuscript.

Funding

The authors gratefully acknowledge the financial support from the Banking Academy of Vietnam (40,000,000 VND–50,000,000 VND).

Institutional Review Board Statement

Not applicable.

Informed Consent Statement

Not applicable.

Data Availability Statement

The data presented in this study is available on request from the corresponding author.

Acknowledgments

We thank all contributing authors for their rigorous research. Special thanks go to the Editorial team at JRFM for their unwavering support in bringing this Special Issue to fruition. And many thanks to Reviewers for having especially useful comments for the authors to improve the quality of this research.

Conflicts of Interest

The authors declare no conflicts of interest.

References

  1. Albulescu, C. T. (2021). COVID-19 and the United States financial markets’ volatility. Finance Research Letters, 38, 101699. [Google Scholar] [CrossRef] [Scilit] [PubMed]
  2. Al-Khasawneh, J. A., Ali, H., & Hassanein, A. (2024). How do stock markets react to dividend announcements during the COVID-19 pandemic? Evidence from the GCC markets. International Journal of Islamic and Middle Eastern Finance and Management, 17, 746–769. [Google Scholar] [CrossRef] [Scilit]
  3. Baker, S. R., Bloom, N., Davis, S. J., Kost, K., Sammon, M., & Viratyosin, T. (2020). The unprecedented stock market impact of COVID-19. Review of Asset Pricing Studies, 10, 742–758. [Google Scholar] [CrossRef] [Scilit]
  4. Ball, R., & Brown, P. (1968). An empirical evaluation of accounting income numbers. Journal of Accounting Research, 6, 159–178. [Google Scholar] [CrossRef] [Scilit]
  5. Ball, R., Kothari, S. P., & Watts, R. (1993). Economic determinants of the relation between earnings changes and stock returns. The Accounting Review, 68, 622–638. [Google Scholar] [CrossRef] [Scilit]
  6. Ball, R., Robin, A., & Wu, J. S. (2003). Incentives versus standards: Properties of accounting income in four East Asian countries. Journal of Accounting and Economics, 36, 235–270. [Google Scholar] [CrossRef] [Scilit]
  7. Barth, M. E., Beaver, W. H., & Landsman, W. R. (2001). The relevance of the value relevance literature for financial accounting standard setting. Journal of Accounting and Economics, 31, 77–104. [Google Scholar] [CrossRef] [Scilit]
  8. Barth, M. E., & Landsman, W. R. (2010). How did financial reporting contribute to the financial crisis? European Accounting Review, 19, 399–423. [Google Scholar] [CrossRef] [Scilit]
  9. Barth, M. E., Li, K., & McClure, C. G. (2023). Evolution in value relevance of accounting information. The Accounting Review, 98, 1–28. [Google Scholar] [CrossRef] [Scilit]
  10. Beaver, W. H. (1968). The information content of annual earnings announcements. Journal of Accounting Research, 6, 67–92. [Google Scholar] [CrossRef] [Scilit]
  11. Bhattacharya, S. (1979). Imperfect information, dividend policy, and “the bird in the hand” fallacy. Bell Journal of Economics, 10, 259–270. [Google Scholar] [CrossRef] [Scilit]
  12. Bond, S. R. (2002). Dynamic panel data models: A guide to micro data methods and practice. Portuguese Economic Journal, 1, 141–162. [Google Scholar] [CrossRef] [Scilit]
  13. Chae, S.-J., & Moon, B. (2025). Value relevance of accounting information in the New Normal era: Effects of the COVID-19 pandemic. Investment Management and Financial Innovations, 22, 358–366. [Google Scholar] [CrossRef] [Scilit]
  14. Chehade, S., & Procházka, D. (2024). Value relevance of accounting information in an emerging market: The case of IFRS adoption by non-financial listed firms in Saudi Arabia. Journal of Accounting in Emerging Economies, 14, 220–246. [Google Scholar] [CrossRef] [Scilit]
  15. Choiriyah, C., Fatimah, F., Agustina, S., & Ulfa, U. (2021). The effect of return on assets, return on equity, net profit margin, earning per share, and operating profit margin on stock prices of banking companies in Indonesia stock exchange. International Journal of Finance Research, 1(2), 103–123. [Google Scholar] [CrossRef] [Scilit]
  16. Collins, D. W., Maydew, E. L., & Weiss, I. S. (1997). Changes in the value-relevance of earnings and book values over the past forty years. Journal of Accounting and Economics, 24, 39–67. [Google Scholar] [CrossRef] [Scilit]
  17. Dechow, P. M., & Dichev, I. D. (2002). The quality of accruals and earnings: The role of accrual estimation errors. The Accounting Review, 77, 35–59. [Google Scholar] [CrossRef] [Scilit]
  18. Dechow, P. M., Ge, W., & Schrand, C. M. (2010). Understanding earnings quality: A review of the proxies, their determinants and their consequences. Journal of Accounting and Economics, 50, 344–401. [Google Scholar] [CrossRef] [Scilit]
  19. Dunham, L. M., & Grandstaff, J. L. (2022). The value relevance of earnings, book values, and other accounting information and the role of economic conditions in value relevance: A literature review. Accounting Perspectives, 21, 237–272. [Google Scholar] [CrossRef] [Scilit]
  20. Easton, P. D., & Harris, T. S. (1991). Earnings as an explanatory variable for returns. Journal of Accounting Research, 29, 19–36. [Google Scholar] [CrossRef] [Scilit]
  21. Fama, E. F. (1970). Efficient capital markets: A review of theory and empirical work. Journal of Finance, 25, 383–417. [Google Scholar] [CrossRef] [Scilit]
  22. Fama, E. F., & French, K. R. (1992). The cross-section of expected stock returns. Journal of Finance, 47, 427–465. [Google Scholar] [CrossRef]
  23. Fama, E. F., & French, K. R. (1993). Common risk factors in the returns on stocks and bonds. Journal of Financial Economics, 33, 3–56. [Google Scholar] [CrossRef] [Scilit]
  24. FiinGroup. (2025). Vietnam securities sector report. FiinGroup. [Google Scholar]
  25. FTSE Russell. (2026). FTSE russell announces results of March 2026 semi-annual country classification review for equities and fixed income. London Stock Exchange Group. [Google Scholar]
  26. Healy, P. M., & Palepu, K. G. (2001). Information asymmetry, corporate disclosure and the capital markets: A review of the empirical disclosure literature. Journal of Accounting and Economics, 31(1–3), 405–440. [Google Scholar] [CrossRef] [Scilit]
  27. Hirshleifer, D., & Teoh, S. H. (2003). Limited attention, information disclosure, and financial reporting. Journal of Accounting and Economics, 36, 337–386. [Google Scholar] [CrossRef] [Scilit]
  28. Hribar, P., Jenkins, N. T., & Johnson, W. B. (2006). Stock repurchases as an earnings management device. Journal of Accounting and Economics, 41, 3–27. [Google Scholar] [CrossRef] [Scilit]
  29. Kothari, S. P. (2001). Capital markets research in accounting. Journal of Accounting and Economics, 31, 105–231. [Google Scholar] [CrossRef] [Scilit]
  30. Kothari, S. P., & Shanken, J. (1997). Book-to-Market, dividend yield, and expected market returns: A time-series analysis. Journal of Financial Economics, 44(2), 169–203. [Google Scholar] [CrossRef] [Scilit]
  31. La Porta, R., Lopez-de-Silanes, F., Shleifer, A., & Vishny, R. (1998). Law and finance. Journal of Political Economy, 106, 1113–1155. [Google Scholar] [CrossRef] [Scilit] [PubMed]
  32. Leuz, C., Nanda, D., & Wysocki, P. D. (2003). Earnings management and investor protection: An international comparison. Journal of Financial Economics, 69, 505–527. [Google Scholar] [CrossRef] [Scilit]
  33. Liu, G., & Sun, J. (2022). The impact of COVID-19 pandemic on earnings management and the value relevance of earnings: US evidence. Managerial Auditing Journal, 37, 850–868. [Google Scholar] [CrossRef] [Scilit]
  34. Livnat, J., & Zarowin, P. (1990). The incremental information content of cash-flow components. Journal of Accounting and Economics, 13, 25–46. [Google Scholar] [CrossRef] [Scilit]
  35. Miller, M. H., & Rock, K. (1985). Dividend policy under asymmetric information. Journal of Finance, 40, 1031–1051. [Google Scholar] [CrossRef]
  36. Ministry of Finance of Vietnam. (2020a). Circular no. 96/2020/TT-BTC of 16 November 2020 guiding the disclosure of information on the securities market. Ministry of Finance of Vietnam.
  37. Ministry of Finance of Vietnam. (2020b). Decision no. 345/QD-BTC of 16 March 2020 approving the scheme for the application of international financial reporting standards in Vietnam. Ministry of Finance of Vietnam.
  38. Modigliani, F., & Miller, M. H. (1958). The cost of capital, corporation finance and the theory of investment. American Economic Review, 48, 261–297. Available online: https://pesquisa-eaesp.fgv.br/sites/gvpesquisa.fgv.br/files/arquivos/terra_-_the_cost_of_capital_corporation_finance.pdf (accessed on 1 June 2026).
  39. Modigliani, F., & Miller, M. H. (1963). Corporate income taxes and the cost of capital: A correction. American Economic Review, 53, 433–443. Available online: https://www.homeworkforyou.com/static_media/uploadedfiles/1709683177_8295598__878.pdf (accessed on 15 May 2026).
  40. Nasir, M. A., Shahbaz, M., Mai, T. T., & Shubita, M. (2021). Development of Vietnamese stock market: Influence of domestic macroeconomic environment and regional markets. International Journal of Finance & Economics, 26, 1435–1458. [Google Scholar] [CrossRef] [Scilit]
  41. Nguyen, H. A., & Dang, T. T. G. (2023). Accounting reform and value relevance of financial reporting from non-financial listed firms on the Vietnam stock market. Cogent Business & Management, 10, 2220193. [Google Scholar] [CrossRef] [Scilit]
  42. Ohlson, J. A. (1995). Earnings, book values, and dividends in equity valuation. Contemporary Accounting Research, 11, 661–687. [Google Scholar] [CrossRef] [Scilit]
  43. Olawale, A. (2024). The impact of capital market on the economic growth of Nigeria. GSC Advanced Research and Reviews, 21, 13–26. [Google Scholar] [CrossRef] [Scilit]
  44. Oster, E. (2019). Unobservable selection and coefficient stability: Theory and evidence. Journal of Business & Economic Statistics, 37, 187–204. [Google Scholar] [CrossRef] [Scilit]
  45. Penman, S. H. (2013). Financial statement analysis and security valuation. McGraw-Hill. Available online: https://www.mheducation.com/highered/product/financial-statement-analysis-and-security-valuation-penman.html?viewOption=student (accessed on 1 May 2026).
  46. Sloan, R. G. (1996). Do stock prices fully reflect information in accruals and cash flows? Accounting Review, 71, 289–315. Available online: https://www.cuhk.edu.hk/acy2/workshop/June2009Wasley/1996TAR).pdf (accessed on 12 March 2026). [CrossRef] [Scilit]
  47. Srivastava, A., & Muharam, H. (2022). Value relevance of accounting information during IFRS convergence period: Comparative evidence between India and Indonesia. Accounting Research Journal, 35, 276–291. [Google Scholar] [CrossRef] [Scilit]
Figure 1. Conceptual framework: accounting information, the pricing channel and the macroeconomic state. Source: (Fama, 1970; Ohlson, 1995).
Jrfm 19 00686 g001
Table 1. Variable definitions and measurement.
VariableDefinition and MeasurementSource
SharePriceMarket price of one ordinary share at the fiscal year end, in Vietnamese dong. Constructed as the price-to-book ratio multiplied by book value per share; see Section 3.5.FiinPro
BVPSBook value of ordinary equity divided by shares outstanding, where shares outstanding equals listed shares less treasury shares, in dong per share.FiinPro
EPSBasic earnings per share as reported in the audited financial statements, in dong per share.FiinPro
DPSTotal cash dividends declared to ordinary shareholders divided by the number of ordinary shares, in dong per share.FiinPro
ROAProfit after tax divided by total assets, expressed as a decimal.FiinPro
CashflowNet cash flow from operating activities divided by total assets, expressed as a decimal.FiinPro
LeverageTotal liabilities divided by total assets, expressed as a decimal.FiinPro
SizeNatural logarithm of total assets in dong.FiinPro
GDPAnnual real gross domestic product growth rate, expressed as a decimal.General Statistics Office
InflationAnnual consumer price inflation rate, expressed as a decimal.General Statistics Office
Source: Compiled by the authors.
Table 2. Effect of winsorization at the 1st and 99th percentiles.
VariableBefore: MinBefore: MaxAfter: MinAfter: MaxObservations Altered
price200.00360,143.442289.60128,000.162.0%
bvps−66,741.80157,528.003064.3254,893.622.0%
eps−17,249.3073,001.00−3056.2514,406.832.0%
dps0.0066,000.000.004500.000.9%
roa−0.790.84−0.120.362.0%
cashflow−1.371.90−0.350.482.0%
leverage0.001.290.040.912.0%
size22.9434.3623.8831.772.0%
Note: Winsorization replaces values beyond the stated percentiles with the percentile value; no observation is deleted. Source: Authors’ calculations.
Table 3. Descriptive statistics.
VariableObs.MeanStd. dev.Min.Max.
SharePrice814922,948.93221,917.6052289.597128,000.164
BVPS911516,962.8938568.1083064.31954,893.625
EPS91082436.3832794.238−3056.24714,406.834
DPS10,092689.624880.1140.0004500.000
ROA87120.0660.074−0.1210.357
Cashflow90990.0580.136−0.3540.478
Leverage91220.4770.2200.0360.911
Size910927.3801.62423.88331.775
GDP10,0920.0590.0140.0260.080
Inflation10,0920.0500.0440.0020.181
Note: All firm-level variables are winsorised at the 1st and 99th percentiles. Monetary variables are in Vietnamese dong. Source: Authors’ calculations from FiinPro.
Table 4. Correlation matrix.
Variable(1)(2)(3)(4)(5)(6)(7)(8)(9)(10)
(1) SharePrice1.000
(2) BVPS0.555 *1.000
(3) EPS0.690 *0.667 *1.000
(4) DPS0.419 *0.391 *0.535 *1.000
(5) ROA0.542 *0.336 *0.776 *0.507 *1.000
(6) Cashflow0.201 *0.104 *0.277 *0.269 *0.372 *1.000
(7) Leverage−0.105 *−0.114 *−0.069 *−0.108 *−0.380 *−0.166 *1.000
(8) Size0.199 *0.108 *0.028 *−0.032 *−0.102 *−0.059 *0.314 *1.000
(9) GDP−0.056 *−0.0030.0160.025 *0.027 *−0.002−0.004−0.0081.000
(10) Inflation−0.092 *0.029 *0.090 *−0.049 *0.080 *−0.0040.043 *−0.117 *0.205 *1.000
Note: * denotes statistical significance at p < 0.05. Source: Authors’ calculations.
Table 5. Selection of the appropriate estimation method.
TestStatisticp-ValueConclusion
F test (H0: pooled OLS)F(630, 7342) = 12.320.0000Reject pooled OLS
Breusch-Pagan LM (H0: no panel effect)chi2(1) = 8130.780.0000Reject pooled OLS
Hausman (H0: RE consistent)chi2(9) = 387.130.0000Reject RE, select FE
Source: Authors’ calculations.
Table 6. Post-estimation diagnostic tests.
TestStatisticp-ValueConclusion
Wooldridge test for AR(1) (H0: no autocorrelation)F(1, 626) = 232.300.0000Autocorrelation present
Modified Wald test (H0: homoskedasticity)chi2(627) = 303,563,2600.0000Groupwise heteroskedasticity
Pesaran CD, firm effects only (H0: no CSD)CD = 116.230.0000Cross-sectional dependence; mean rho = 0.074
Pesaran CD, firm and year effects (H0: no CSD)CD = 31.960.0000Dependence largely absorbed; mean rho = 0.020
Source: Authors’ calculations.
Table 7. Results of the baseline regression model.
VariableBaseline
BVPS0.460 ***
(5.93)
EPS3.211 ***
(9.56)
DPS0.347
(0.94)
ROA−7347.3
(−0.80)
Cashflow337.705
(0.32)
Leverage2658.9
(1.23)
Size1607.8 ***
(3.43)
GDP−45,171.9 ***
(−5.61)
Inflation−56,788.6 ***
(−13.68)
Observations7982
Within R-squared0.348
Note: Firm fixed effects with standard errors clustered at the firm level. *** denote significance at the 1% levels. t-statistics in parentheses. Source: Authors’ calculations.
Table 8. Baseline regression by industry.
VariableFull
Sample
Real EstateIndustrialsITPharma. &
Health
Oil & GasCons.
Services
Cons.
Goods
Basic
Materials
Utilities
BVPS0.460 ***0.369 ***0.509 ***0.302−0.422−0.0360.744 **0.710 ***0.331 **0.880 ***
(5.93)(2.93)(4.38)(1.28)(−1.48)(−0.04)(2.08)(3.02)(2.18)(4.84)
EPS3.211 ***3.642 ***3.025 ***1.4826.536 ***3.986 ***2.672 *3.551 ***2.268 ***0.923
(9.56)(6.46)(5.74)(1.23)(4.75)(3.49)(1.92)(4.31)(2.85)(1.19)
DPS0.347−0.7730.082−1.6802.2562.1490.0360.2771.0430.734
(0.94)(−0.67)(0.15)(−1.15)(1.48)(0.77)(0.03)(0.28)(0.93)(0.88)
ROA−7347.3−16,381.7−12,018.743,012.8 **−60,123.0 **−22,364.712,616.0−3185.85802.739,644.2 *
(−0.80)(−0.91)(−0.75)(2.19)(−2.34)(−0.95)(0.35)(−0.14)(0.27)(1.84)
Cashflow337.705−5770.7 *876.7093079.5−9319.6 *−2481.71704.2559.3662134.74844.1 **
(0.32)(−1.79)(0.53)(1.08)(−1.89)(−0.48)(0.34)(0.20)(0.82)(2.17)
Leverage2658.95668.9424.325−14,748.6−5363.314,758.29912.05265.311,015.3−13,983.3 ***
(1.23)(1.62)(0.11)(−1.56)(−0.56)(1.20)(1.37)(0.99)(1.64)(−2.86)
Size1607.8 ***256.9082151.1 ***10,184.0 ***744.827−14,070.3 **−2279.71832.31203.68220.1 ***
(3.43)(0.40)(2.79)(3.30)(0.65)(−2.15)(−1.08)(1.38)(0.96)(5.62)
GDP−45,171.9 ***−174,352.1 ***−34,842.7 ***−29,035.7−45,600.5−28,538.8−14,831.0−11,073.5−57,490.4 ***−8051.0
(−5.61)(−6.57)(−2.68)(−1.10)(−1.00)(−1.02)(−0.51)(−0.46)(−3.08)(−0.65)
Inflation−56,788.6 ***−21,332.5 **−49,945.9 ***11,723.2−91,710.3 ***−97,941.8 ***−76,856.2 ***−91,909.0 ***−41,909.4 ***−39,687.0 ***
(−13.68)(−2.50)(−7.94)(0.80)(−3.00)(−3.57)(−4.51)(−8.12)(−3.88)(−5.32)
Observations798288628532313486762512261060678
Within
R-squared
0.3480.4300.3430.3340.4180.5530.3150.4200.3010.512
Note: Telecommunications is omitted because it contains a single listed firm. ***, ** and * denote significance at the 1%, 5% and 10% levels, respectively. t-statistics in parentheses. Source: Authors’ calculations.
Table 9. Baseline regression by firm size.
VariableFull SampleSmall and Medium FirmsLarge Firms
BVPS0.460 ***0.767 ***0.411 ***
(5.93)(3.24)(5.28)
EPS3.211 ***2.791 ***2.888 ***
(9.56)(3.45)(7.46)
DPS0.347−0.9170.814 *
(0.94)(−1.38)(1.84)
ROA−7347.3−20,203.416,463.2
(−0.80)(−1.17)(1.34)
Cashflow337.7051715.6−599.643
(0.32)(1.18)(−0.42)
Leverage2658.91579.54652.2 *
(1.23)(0.29)(1.78)
Size1607.8 ***463.2542414.5 ***
(3.43)(0.26)(4.14)
GDP−45,171.9 ***40,602.0 ***−73,038.5 ***
(−5.61)(3.11)(−7.73)
Inflation−56,788.6 ***−53,053.1 ***−54,231.7 ***
(−13.68)(−7.24)(−10.84)
Observations798222695713
Within R-squared0.3480.3350.348
Note: Large firms are those with total assets above VND 300 billion. *** and * denote significance at the 1% and 10% levels, respectively. t-statistics in parentheses. Source: Authors’ calculations.
Table 10. Baseline regression by macroeconomic state (split samples).
VariableFull SampleGDP Growth
Above Mean
GDP Growth
Below Mean
COVID-19
Period
Non-COVID-19
Period
BVPS0.460 ***0.481 ***0.469 ***−0.0310.475 ***
(5.93)(5.57)(4.10)(−0.08)(5.84)
EPS3.211 ***3.467 ***2.536 ***1.836 **3.382 ***
(9.56)(8.78)(5.19)(2.36)(9.27)
DPS0.3470.3840.340−0.1810.388
(0.94)(0.87)(0.54)(−0.22)(0.96)
ROA−7347.3−16,309.37057.610,241.6−12,976.2
(−0.80)(−1.55)(0.50)(0.49)(−1.33)
Cashflow337.7052466.2 *−3771.9 *2907.71877.2 *
(0.32)(1.94)(−1.83)(0.94)(1.70)
Leverage2658.93571.5−515.674−646.1692837.3
(1.23)(1.47)(−0.18)(−0.09)(1.25)
Size1607.8 ***820.062 *2311.1 ***5942.0 **1180.7 **
(3.43)(1.70)(3.27)(2.30)(2.49)
GDP−45,171.9 ***−60,651.5 *−67,600.8 **−903,673.0 ***−4832.1
(−5.61)(−1.89)(−2.21)(−5.81)(−0.34)
Inflation−56,788.6 ***−56,304.9 ***−76,531.0 *** −57,990.8 ***
(−13.68)(−13.56)(−4.30) (−14.21)
Observations79825148283412346748
Within R-squared0.3480.3690.3310.1690.358
Note: Columns 2 and 3 split the sample at the sample mean of annual GDP growth (5.885%). Columns 4 and 5 split at the COVID-19 years 2020 and 2021. Inflation is not estimable in the COVID-19 subsample because it is collinear with the sample split. ***, ** and * denote significance at the 1%, 5% and 10% levels. t-statistics in parentheses. Source: Authors’ calculations.
Table 11. Fully interacted specification and Wald test of the state-dependence restriction.
VariableBelow-Average
GDP Growth: Base
COVID-19
Period: Base
Below-Average GDP
Growth: × State
COVID-19
Period: × State
BVPS0.475 ***0.474 ***0.0280.086
(5.56)(5.84)(0.48)(1.08)
EPS3.322 ***3.148 ***−0.665−0.384
(8.50)(8.59)(−1.50)(−0.76)
DPS0.4480.513−0.089−0.599
(1.04)(1.29)(−0.17)(−1.01)
ROA−10,670.1−11,247.15652.014,625.3
(−1.04)(−1.15)(0.46)(0.89)
Cashflow3137.8 **2494.4 **−6348.2 ***−8684.2 ***
(2.51)(2.27)(−3.03)(−3.27)
Leverage4215.1 *4034.056.0012288.1
(1.70)(1.63)(0.04)(1.10)
Size514.816656.813988.435 ***1044.0 ***
(0.97)(1.24)(5.35)(4.24)
Observations7982798279827982
Within R-squared−0.537−0.212−0.537−0.212
Wald test, all interactions = 0chi2(7) = 60.53chi2(7) = 36.17p = 0.0000p = 0.0000
Note: Firm and year fixed effects; standard errors clustered at the firm level. State equals one in the adverse state. The macroeconomic variables are absorbed by the year effects. ***, ** and * denote significance at the 1%, 5% and 10% levels. t-statistics in parentheses. Source: Authors’ calculations.
Table 12. Robustness tests.
Variable(1) Baseline(2) EPS Only(3) ROA Only(4) Cash Flow
Only
(5) Firm and
Year Effects
(6) Driscoll-
Kraay SE
BVPS0.460 ***0.489 ***0.958 ***1.134 ***0.479 ***0.479 ***
(5.93)(6.71)(12.36)(14.53)(5.97)(6.52)
EPS3.211 ***3.133 *** 3.108 ***3.108 ***
(9.56)(16.59) (8.85)(9.39)
DPS0.3470.2651.132 ***3.075 ***0.4180.418
(0.94)(0.73)(2.72)(7.23)(1.11)(1.55)
ROA−7347.3 77,114.2 *** −9006.5−9006.5
(−0.80) (13.33) (−0.93)(−1.49)
Cashflow337.705 6175.3 ***1221.61221.6
(0.32) (4.77)(1.15)(0.94)
Leverage2658.93881.4 **11,969.0 ***7005.7 ***4386.3 *4386.3 **
(1.23)(1.96)(6.11)(3.30)(1.81)(2.07)
Size1607.8 ***1263.7 ***1347.6 ***459.341917.278 *917.278 ***
(3.43)(2.75)(2.59)(0.89)(1.73)(2.64)
GDP−45,171.9 ***−47,743.1 ***−45,439.8 ***−46,374.8 ***
(−5.61)(−5.91)(−5.49)(−5.39)
Inflation−56,788.6 ***−57,711.9 ***−57,052.3 ***−49,382.4 ***
(−13.68)(−13.89)(−13.08)(−11.30)
Observations798281187982812079827982
Within R-squared0.3480.3580.3040.2380.3070.307
Note: Columns 1 to 4 use firm fixed effects with firm-clustered standard errors. Column 5 adds year fixed effects, which absorb the macroeconomic variables. Column 6 repeats column 5 with Driscoll and Kraay standard errors. ***, ** and * denote significance at the 1%, 5% and 10% levels. t-statistics in parentheses. Source: Authors’ calculations.
Table 13. Variance inflation factors.
VariableBVPSEPSDPSROACashflowLeverageSizeGDPInflation
VIF2.616.851.625.101.191.721.181.061.09
Note: Computed from the pooled specification. Mean VIF = 2.49. Source: Authors’ calculations.
Table 14. Specifications addressing simultaneity and reverse causality.
Variable(1) Baseline FE(2) Dynamic FE(3) Lagged Regressors(4) Lagged + Year FE(5) Difference GMM
Lagged SharePrice 0.418 *** 0.494 ***
(20.75) (7.50)
BVPS0.460 ***0.244 ***0.165 **0.186 **−0.298
(5.93)(4.48)(2.06)(2.25)(−0.80)
EPS3.211 ***2.375 ***2.014 ***1.943 ***0.096
(9.56)(8.47)(6.32)(5.98)(0.06)
DPS0.3470.2091.786 ***1.863 ***0.581
(0.94)(0.70)(4.23)(4.21)(1.20)
ROA−7347.3−6896.11682.25307.461.364
(−0.80)(−0.97)(0.18)(0.57)(1.50)
Cashflow337.7052936.7 ***5215.1 ***4251.6 ***2.326 **
(0.32)(3.14)(4.28)(3.38)(1.98)
Leverage2658.93738.5 **2609.66092.4 **11.685 **
(1.23)(2.06)(1.19)(2.51)(2.17)
Size1607.8 ***967.122 ***972.987 **−288.8640.130
(3.43)(3.05)(2.05)(−0.54)(0.10)
GDP−45,171.9 ***−71,703.9 ***−34,434.1 *** 2.463 ***
(−5.61)(−8.96)(−3.95) (3.81)
Inflation−56,788.6 ***−65,918.7 ***−74,093.0 *** −105.908 ***
(−13.68)(−20.41)(−15.62) (−5.54)
Observations79827488761076106708
Within R-squared0.3480.4820.1910.122
Note: Columns 1 to 4 are firm fixed effects with standard errors clustered by firm. Column 3 and 4 use accounting information from year t − 1. Column 5 is a one-step Arellano-Bond difference GMM estimator with collapsed instruments, treating BVPS and EPS as endogenous, with robust standard errors; monetary variables are scaled to thousands of dongs in that column. GMM diagnostics: AR(1) z = −15.013, p < 0.001; AR(2) z = −0.232, p = 0.8168; Hansen J = 5.47, df = 6, p = 0.4855; 29 instruments for 622 firms. Bond (2002) check: pooled OLS 0.6593 > GMM 0.4941 > fixed effects 0.4181. *** and ** denote significance at the 1% and 5% levels. t- or z-statistics in parentheses. Source: Authors’ calculations.
Table 15. Direction of association between prices and accounting numbers.
Specification (First Differences, Firm Fixed Effects)Coefficientt-StatisticStandardised CoefficientObservations
Accounting → price: ΔPrice(t) on ΔEPS(t − 1)0.5875 ***5.860.09576879
Accounting → price: ΔPrice(t) on ΔBVPS(t − 1)0.08031.080.02306881
Price → accounting: ΔEPS(t) on ΔPrice(t − 1)0.0177 ***5.610.11026884
Price → accounting: ΔBVPS(t) on ΔPrice(t − 1)0.0140 **2.270.04636886
Price → accounting: ΔROA(t) on ΔPrice(t − 1)0.0000 ***5.150.07096748
Price → accounting: ΔLeverage(t) on ΔPrice(t − 1)−0.0000−1.47−0.01866886
Note: Each regression controls for the lagged first difference of the dependent variable. The standardised coefficient rescales by the ratio of standard deviations so that the two directions are comparable. *** and ** denote significance at the 1% and 5% levels. Source: Authors’ calculations.
Table 16. Bounds on selection on unobservables (Oster, 2019).
CoefficientUncontrolled BetaUncontrolled R-Sq.Controlled BetaControlled R-Sq.R-Sq. MaxDelta *Bias-Adjusted Beta
BVPS (baseline)1.22230.18340.45960.34790.45230.950−0.0242
EPS (baseline)3.64630.28603.21140.34790.45234.3802.4782
BVPS (lagged)0.71840.06440.16460.19130.24870.657−0.0858
EPS (lagged)2.31410.12302.01380.19130.24877.9801.7615
Note: R-squared max is set to 1.3 times the controlled within R-squared, following the convention proposed by Oster (2019). Delta * is the ratio of selection on unobservables to selection on observables that would be required to drive the coefficient to zero; a value above one indicates that the result is robust to equal selection. The bias-adjusted beta assumes delta equals one. Source: Authors’ calculations.
Table 17. Logarithmic specification.
VariableLevels: CoefficientLevels: tLog-Log: CoefficientLog-Log: t
BVPS0.460 ***(5.93)0.4744 ***(10.53)
EPS3.211 ***(9.56)0.1051 ***(10.75)
DPS0.347(0.94)0.0000 **(2.23)
ROA−7347.3(−0.80)2.6354 ***(13.24)
Cashflow337.705(0.32)−0.1264 ***(−2.70)
Leverage2658.9(1.23)0.3216 ***(4.21)
Size1607.8 ***(3.43)0.0626 ***(3.01)
GDP−45,171.9 ***(−5.61)−3.2834 ***(−9.86)
Inflation−56,788.6 ***(−13.68)−2.6881 ***(−16.35)
Observations7982 7505
Within R-squared0.348 0.357
Note: The logarithmic specification takes natural logarithms of price, book value per share and earnings per share; Size is already a logarithm. Coefficients are elasticities. *** and ** denote significance at the 1% and 5% levels. Source: Authors’ calculations.
Table 18. Summary of Empirical Evidence for the Research Propositions.
PropositionCompeting or Expected PredictionEvidenceOutcome
P1. Relative weight of the core valuation variables (H1, H2)Ohlson and earnings persistence: earnings dominate. Credibility argument: book value dominates.EPS 3.211 *** (39.1% of mean price at one SD); BVPS 0.460 *** (17.2%). Oster delta * of 4.38 for EPS against 0.95 for BVPS.Both priced; the Ohlson prediction is supported, and the credibility prediction receives no support and the Ohlson prediction is
P2. Information overlaps among performance measures (H3, H4, H5)EPS subsumes ROA and operating cash flow; the latter are significant alone and not jointly.ROA and cash flow significant when entered separately (Table 12); insignificant alongside EPS. Both significant when lagged (Table 14).Supported
P3. Firm characteristics (H6, H7)Leverage negative, size positive.Size 1607.8 ***; Leverage 2658.9, not significant.Supported for size, not for leverage
P4. State dependence of valuation weights (H8, H9a, H9b)Weights differ between favourable and adverse macroeconomic states.Interaction with BVPS: p = 0.6334 (GDP) and 0.2814 (COVID-19). Interaction with EPS: p = 0.1338 and 0.4468. Joint Wald chi2(7) = 60.53 and 36.17, both rejected, driven by cash flow and size.Not supported for the core variables; supported for the supplementary variables
Note: Full results are in Table 5, Table 6, Table 7, Table 8, Table 9, Table 10, Table 11, Table 12, Table 13, Table 14, Table 15, Table 16, Table 17 and Table 18. Coefficients are elasticities. *** and * denote significance at the 1% and 10% levels. Source: Authors’ calculations.
Disclaimer/Publisher’s Note: The statements, opinions and data contained in all publications are solely those of the individual author(s) and contributor(s) and not of MDPI and/or the editor(s). MDPI and/or the editor(s) disclaim responsibility for any injury to people or property resulting from any ideas, methods, instructions or products referred to in the content.