1. Introduction
The International Monetary Fund (IMF) and the World Bank (WB), founded at the Bretton Woods conference in 1944, are the leading international financial institutions (IFIs) tasked with ensuring global financial stability and promoting economic development. Both institutions maintain significant active programs across many of their member countries, which reach 191 in the IMF and 189 in the WB at the beginning of 2026. The Inter-American Development Bank (IDB) is one of the leading sources of development financing for Latin America and the Caribbean (LAC), providing loans, grants, and technical cooperation to 26 borrowing member countries. These institutions share a common mission, which is to promote economic prosperity while ensuring financial stability in the international markets. To comply with this aim, these institutions maintain a constant dialogue with the economic authorities of their member countries to cover potential financial needs with several conditional loans, such as fiscal policy-based loans (fPBL). Through these loans, these institutions provide and disseminate best practices on government management to their member countries, which include guidelines on fiscal responsibility, transparency, and effective resource allocation. During the process of negotiation, fPBLs are tailored to countries’ needs based on specific themes, such as consolidating government spending, increasing tax stability, controlling debt financing, reducing inflation, or achieving financial stability, with the intention of maximizing the likelihood of a suitable loan implementation while increasing the benefits and spillovers from the executed reforms.
Over the years, many countries in the LAC region have come to these financial institutions when facing economic crises so as to restore liquidity shortfalls in the balance of payments. In these cases, the IMF, the IDB, and the WB usually provide loans that are contingent upon the borrower country meeting specific fiscal policy conditions, which include implementing structural reforms in government operations such as enhancing fiscal discipline and improving public sector efficiency. These practices are critical because the purpose of these conditional loans is to improve the borrowing country’s balance of payments, enabling the country to make repayments and avoid arrears while ensuring the successful implementation of the program to overcome the financial crisis. Selection of structural reforms is also critical. According to
Bal et al. (
2013), since the 2000s, the IMF has made efforts to transfer the primary responsibility for selecting, designing, and implementing the policies of the program to the borrower country, counting on the oversight and technical assistance from experts at the IMF. The aim of this effort is to guarantee that the conditionality is “macro-critical”—that is, according to Bal, “critical to the achievement of the program’s macroeconomic goals—and tailored to a country’s individual circumstances.” (
Bal et al., 2013).
Despite the implementation of conditional loans in many LAC countries, a consensus on their impact on macroeconomic performance remains elusive. Decades of applied research have found heterogeneous effects on economic performance, and the estimated effects depend in part on how participation, conditionality, financing, and reform implementation are identified (
Barro & Lee, 2005;
Bird & Rowlands, 2017).
Khan (
1990) provides early evidence of this temporal heterogeneity, finding that Fund-supported programs improved the current account, the balance of payments, and inflation in the short run but were accompanied by lower economic growth. Over longer horizons, the favorable external-balance and inflation effects strengthened, while the adverse growth effect diminished. The methodological difficulties underlying these evaluations have long been recognized.
Goldstein and Montiel (
1986) show that conventional multicountry comparisons may confound program effects with differences in initial conditions, external developments, and nonrandom program participation, highlighting the need for an appropriate counterfactual benchmark. Using a logit model,
Joyce (
1992) similarly identified the economic characteristics associated with developing countries’ entry into IMF stabilization programs, providing early evidence that program participation is systematically selected rather than random. Among the earlier empirical studies addressing nonrandom program participation,
Conway (
1994) jointly examines participation in IMF lending programs and their macroeconomic impact, finding evidence of an adverse immediate effect on economic growth. Using a bivariate dynamic Heckman selection model,
Przeworski and Vreeland (
2000) similarly find that IMF-program participation reduces growth while countries remain under a program; after leaving, their growth accelerates relative to remaining under the program, but not relative to nonparticipation. Subsequent work employed matching methods to address observable differences between program and nonprogram countries.
Hardoy (
2003), using matching and difference-in-differences matching, finds no statistically significant effect of IMF-program participation on per-capita growth one, two, or three years after participation; while
Butkiewicz and Yanikkaya (
2005), examining IMF and World Bank lending within a common empirical framework, find that the long-run growth effects vary across institutions and lending components, reinforcing the absence of a uniform effect of international financial support. Focusing directly on institutional overlap,
Marchesi and Sirtori (
2011) use simultaneous participation in IMF and WB programs as a proxy for institutional interaction and find that the interaction between the two organizations has a positive and statistically significant association with economic growth, although simultaneous participation does not necessarily imply effective operational coordination.
Momani and Hibben (
2015) provide an institutional explanation for this distinction, arguing that differences in the organizational cultures of the IMF and the WB can generate low trust, bureaucratic rivalry, and inconsistent collaboration, even when both institutions operate in the same country. Considered jointly, these studies illustrate why short-run adjustment effects should be distinguished from medium- and longer-run post-program outcomes and why conclusions may depend on the identification strategy employed. More recent contributions continue to emphasize the difficulty of separating the effects of IMF conditionality from other components of international financial support (
Stubbs et al., 2020), while evidence also points to heterogeneous effects across macroeconomic and social outcomes (
Garuda, 2000;
Oberdabernig, 2013;
Lang, 2021;
Chletsos & Sintos, 2023). For instance,
Biglaiser and DeRouen (
2010) find that IMF borrowers tend to attract more U.S. foreign direct investment, although the effect varies across program types and characteristics. The political consequences are also not uniformly adverse: using matching, instrumental-variable, and difference-in-differences approaches,
Nelson and Wallace (
2017) find modest but positive conditional differences in democracy scores between countries participating and not participating in IMF programs. At the institutional level, recent evaluations of development policy financing emphasize that PBL-type operations combine financing with policy and institutional actions, technical dialogue, and coordination with other development partners (
World Bank, 2021;
Bouillon et al., 2023). This literature suggests that PBLs should be viewed not simply as financial transfers, but as components of broader policy and institutional reform packages. The present study builds on this perspective by examining whether macroeconomic trajectories following PBL-supported reform episodes differ from trajectories that would plausibly have occurred in the absence of the intervention. This focus complements earlier evaluations based primarily on cross-country observational comparisons by combining case-specific institutional evidence with quasi-experimental counterfactual methods.
The empirical literature on IMF-supported and other policy-based financing has produced heterogeneous findings and continues to debate the distinction between financing, conditionality, reform implementation, and broader macroeconomic conditions. The Independent Evaluation Office of the IMF found that IMF-supported programs over 2008–2019 could be associated with improved post-program growth relative to counterfactual benchmarks, while also documenting persistent shortfalls relative to program projections and heterogeneous effects across policy instruments (
International Monetary Fund, Independent Evaluation Office, 2021). World Bank evaluations similarly characterize Development Policy Financing as a flexible instrument supporting policy and institutional reforms, while emphasizing implementation, ownership, and the country-specific reform context (
World Bank, 2021). More recent work has continued to refine the evaluation of conditionality: IMF guidance emphasizes realistic program design, tailoring of structural conditions, and country ownership (
International Monetary Fund, Strategy, Policy, & Review Department, 2024), while recent empirical research examines specific macro-financial commitments within IMF-supported programs using quasi-experimental designs (
Martin & Vardy, 2024;
International Monetary Fund, 2025). Methodologically, recent research has developed formal uncertainty-quantification procedures for synthetic-control settings with multiple treated units and potentially different treatment-adoption dates (
Cattaneo et al., 2022), while also examining the sensitivity of synthetic-control inference to temporal aggregation (
Sun et al., 2024). Against this background, the innovation of the present study is not the proposal of a new estimator. Rather, it lies in combining case-specific documentary evidence with three alternative counterfactual estimators for GDP per capita—SCM, MC, and CBC—and an ES-STU framework for broader macroeconomic outcomes to examine the timing and heterogeneity of macroeconomic outcomes following PBL-supported reform episodes involving multiple international financial institutions in LAC. This positioning makes the study complementary to, rather than a replacement for, previous evaluations.
This paper focuses on five case studies to shed new evidence on the effects associated with fiscal policy-based loans (fPBLs) on economic growth and other macroeconomic outcomes in the LAC region. We focus on fPBLs provided by the IMF, the IDB, and the WB from 2009 to 2019, and exclude those provided in response to the COVID-19 pandemic because insufficient post-intervention history is available to evaluate their medium- and long-term effects. Our contribution is twofold. First, we connect the institutional logic of PBLs—financing, policy conditionality, technical assistance, and reform implementation—to observable macroeconomic mechanisms. Second, we use three alternative counterfactual estimators for GDP per capita with an event-study approach for broader macroeconomic outcomes. The analysis is therefore intended to contribute evidence on the timing and heterogeneity of effects rather than to establish a universal or institution-specific causal effect of PBL financing. The remainder of the paper presents the case-study evidence, the empirical strategy and results, and the implications and limitations of the findings.
2. Theoretical Framework and Contribution
Policy-based lending can affect macroeconomic performance through several interconnected channels rather than through financing alone. PBL-supported reform episodes combine external resources, policy conditionality, institutional support, and domestic implementation. Financing can ease short-run fiscal and balance-of-payments pressures, but access to external resources may also weaken incentives for ex ante policy discipline.
Dreher and Vaubel (
2004) find that greater IMF borrowing potential is associated with larger government budget deficits and faster monetary expansion, a pattern consistent with moral hazard. Conversely, conditionality may strengthen the credibility of reform commitments.
Dreher (
2006) distinguishes among the effects of IMF financing, policy advice, and conditionality and shows that compliance matters for economic performance. Consistent with this mechanism,
Hackler et al. (
2020) find that the relationship between compliance and real GDP growth varies with the particular loan condition involved, underscoring the importance of both the content and implementation of conditionality.
Vadlamannati (
2020) further finds that investor sentiment responds not simply to program participation but also to the credibility conveyed by program design and policy conditions. The relevant intervention is therefore broader than the financial disbursement itself.
Whether these commitments translate into actual reform depends on domestic institutions and political conditions. Formal conditionality does not guarantee implementation: administrative capacity, government ownership, policy continuity, and political support shape whether agreed measures are carried out and sustained (
Biglaiser & DeRouen, 2011).
Vreeland (
2003) similarly emphasizes that participation in IMF programs and the implementation of agreed reforms are shaped by domestic political incentives, making program selection part of the evaluation problem. Political conditions may also evolve endogenously during program implementation.
Dreher and Gassebner (
2012) examine whether IMF and WB programs affect the likelihood of major government crises. They find that such crises are, on average, more likely following World Bank programs and that the risk can increase when governments remain under IMF or WB arrangements after economic performance has improved.
Konstantinidis and Reinsberg (
2023) emphasize government ownership as a central dimension of IMF conditionality, while
Weipert-Fenner et al. (
2026) show how domestic veto players and political-economic interests can affect reform implementation. Similar lending arrangements may therefore produce different outcomes across countries because the transmission from conditionality to realized reform is mediated by domestic institutional and political conditions.
These mechanisms also imply that effects may vary over time. Fiscal consolidation, expenditure rationalization, and tax reform can impose short-run adjustment costs, whereas improvements in revenue mobilization, debt management, public-sector efficiency, and policy credibility may emerge more gradually. Drawing on a systematic review of IMF-supported programs,
Hanedar and Munkacsi (
2025) show that expenditure conditions span areas such as social assistance, energy subsidies, pensions, health, education, and public-sector wage bills, emphasizing the need to tailor their design to program objectives and country circumstances.
Rickard and Caraway (
2019) further find that targeted public-sector conditions are associated with short-run reductions in the public-sector wage bill, illustrating how the specific design of conditionality can shape adjustment costs. Consistent with the heterogeneous effects documented in the IMF-program literature (
Bird, 2001;
Dreher, 2006;
Atoyan & Conway, 2006), the theoretical expectation is not an immediate or uniform increase in growth. Rather, PBL-supported reforms may involve adjustment during implementation followed, where institutional and political conditions are supportive, by greater macroeconomic stability and potentially stronger medium-run performance. Related concerns arise from prolonged engagement itself. The
Independent Evaluation Office of the International Monetary Fund (
2002) found that prolonged use was frequently associated with weaknesses in domestic ownership and institutional capacity, poorly focused conditionality, and insufficient consideration of a longer-term strategy. Longer intervention periods also increase the scope for additional reforms, political changes, and external shocks to complicate attribution.
This framework leads us to expect heterogeneous effects across countries, outcomes, and time and defines the contribution of the empirical analysis. We treat PBL-supported episodes as broader reform packages combining financing, conditionality, institutional support, and domestic implementation rather than as isolated financial interventions. For GDP per capita, we compare the Synthetic Control Method (SCM), Matrix Completion (MC), and a Cointegration-Based Counterfactual (CBC), complemented by an Event Study with Single Treated Units (ES-STU) for broader macroeconomic outcomes. Together, these approaches allow us to examine whether the observed timing and heterogeneity are consistent with the mechanisms described above, while avoiding the stronger claim that the estimated effects reflect financing alone or can be attributed to any single multilateral institution.
3. Case Studies: Background
We have considered in this study fiscal policy-based loans (fPBLs) from the IMF, the IDB, and the WB, on a sample of five countries in the LAC region: Costa Rica, the Dominican Republic, El Salvador, Guatemala, and Jamaica. In the case of the loans supplied by the IMF, we studied those that went through the so-called “Stand-By Arrangement” (SBA) and “Extended Fund Facility” (EFF) facilities. Typically, SBAs are interventions that last between 12 and 24 months, while EFFs are typically a type of three-year intervention. With respect to the loans supplied by the IDB, we included in our study the “Policy-based loan” (PBL) and “Programmatic policy-based loan” (PBP) facilities, both of which can be protracted for several tranches depending on the compliance of goals during the period of implementation. And finally, the loans supplied by the WB were made through “Development Policy Loan” (DPL) with a “Deferred Drawdown Option” (DDO) facility, which are typically programs that cover a number of multiple task interventions on different themes under a single financial umbrella. These programs are not purely fPBLs but instead are a “cocktail” of programs on several topics, such as education, health, energy, and infrastructure, but that also include fiscal program reforms.
We found a total of 26 fPBLs distributed among these countries (
Table 1). For instance, in Costa Rica we identified two loans in 2009, one from the IMF and another from the WB; for the Dominican Republic we found three fPBLs, one from the IMF, one from the IDB, and one from the WB; for El Salvador we found three fPBLs, two from the IMF–one of which was canceled during implementation–and one from the WB (
IMF, 2009b,
2009c);. for Guatemala we found eight fPBLs, the largest number among the countries studied, comprising one from the IMF, three from the IDB, and four from the WB (
IMF, 2009d,
2009e,
2009f); and finally, for Jamaica we found a total of ten fPBLs, three from the IMF–one of these derailed– three from the IDB, and four from the WB. To sum up, from the 26 fPBLs studied, 31% were from the IMF, 27% from the IDB, and 42% from the WB, with an approved average amount of USD 1.14 billion for the IMF loans, USD 0.49 billion for the loans provided by the IDB, and USD 0.2 billion by the World Bank. The following table presents a general view of the features of the fPBLs studied in this paper.
The selection of the five treated countries was guided by three considerations related to the identification strategy and data requirements of the study. First, Costa Rica, the Dominican Republic, El Salvador, Guatemala, and Jamaica were selected from the broader set of Latin American and Caribbean economies because they received fiscal policy-based lending from the IMF, IDB, and/or World Bank in response to the balance-of-payments and fiscal financing pressures triggered by the 2008 global economic downturn. This criterion provides a common historical origin for the treatment episodes and distinguishes these cases from other PBL operations in the region undertaken under different macroeconomic circumstances. The study therefore does not seek to evaluate all countries that have received PBLs, but rather a specific group of LAC economies exposed to PBL-supported fiscal reform episodes associated with the common shock represented by the 2008 global economic downturn.
Second, the five cases provide sufficiently long and comparable historical macroeconomic series to construct credible pre-intervention trajectories and to evaluate outcomes during and after program implementation. This requirement is particularly important for the quasi-experimental methods employed in the study, since SCM, MC, CBC, and ES-STU rely on adequate pre-treatment information to construct or assess counterfactual trajectories and pre-treatment comparability. Countries for which sufficiently long or comparable historical series were unavailable could not satisfy this empirical requirement.
Third, the 2008 global economic downturn provides a common external shock around which the treated cases and donor units are selected and compared. Although the intensity and domestic consequences of the downturn differed across countries, comparing countries within a common global shock reduces the heterogeneity in the macroeconomic circumstances leading to fiscal PBL interventions. It also provides a common historical benchmark that helps interpret our findings: if similar post-intervention patterns emerge across treated countries, this may strengthen the interpretation that PBL-supported reform episodes contributed to the observed outcomes, rather than those patterns being driven solely by unrelated country-specific events. This does not imply that PBL treatment was randomly assigned; instead, the common benchmark improves comparability and interpretation of the selected cases, while remaining country-specific heterogeneity is addressed through donor-pool construction, pre-treatment fit, and the robustness and sensitivity analyses.
Taken together, these criteria define the scope of the analysis as a comparative evaluation of five LAC countries that received fiscal PBL support in response to the 2008 global downturn and for which sufficient pre- and post-intervention information is available. Consequently, the sample is purposive rather than statistically representative of all PBL recipients. The results should therefore be interpreted as evidence for these five fPBL-supported reform episodes rather than automatically generalized to all countries, periods, or forms of policy-based lending.
Table 1 highlights both the common features and the heterogeneity of the five fPBL-supported episodes. All five countries received policy-based support in the context of the macroeconomic and fiscal pressures associated with the 2008 global downturn, providing a common external environment surrounding the treatment episodes. This common setting does not eliminate the nonrandom assignment of fPBLs or the self-selection of countries into multilateral support. It does, however, reduce heterogeneity in the macroeconomic circumstances surrounding treatment assignment and thereby provides a more comparable setting for constructing and interpreting the untreated counterfactual. At the same time, the institutional configuration and duration of the programs differed across countries, with Jamaica representing the most prolonged intervention episode. These remaining differences motivate the country-specific counterfactual construction, pre-treatment fit assessment, and robustness analyses that follow.
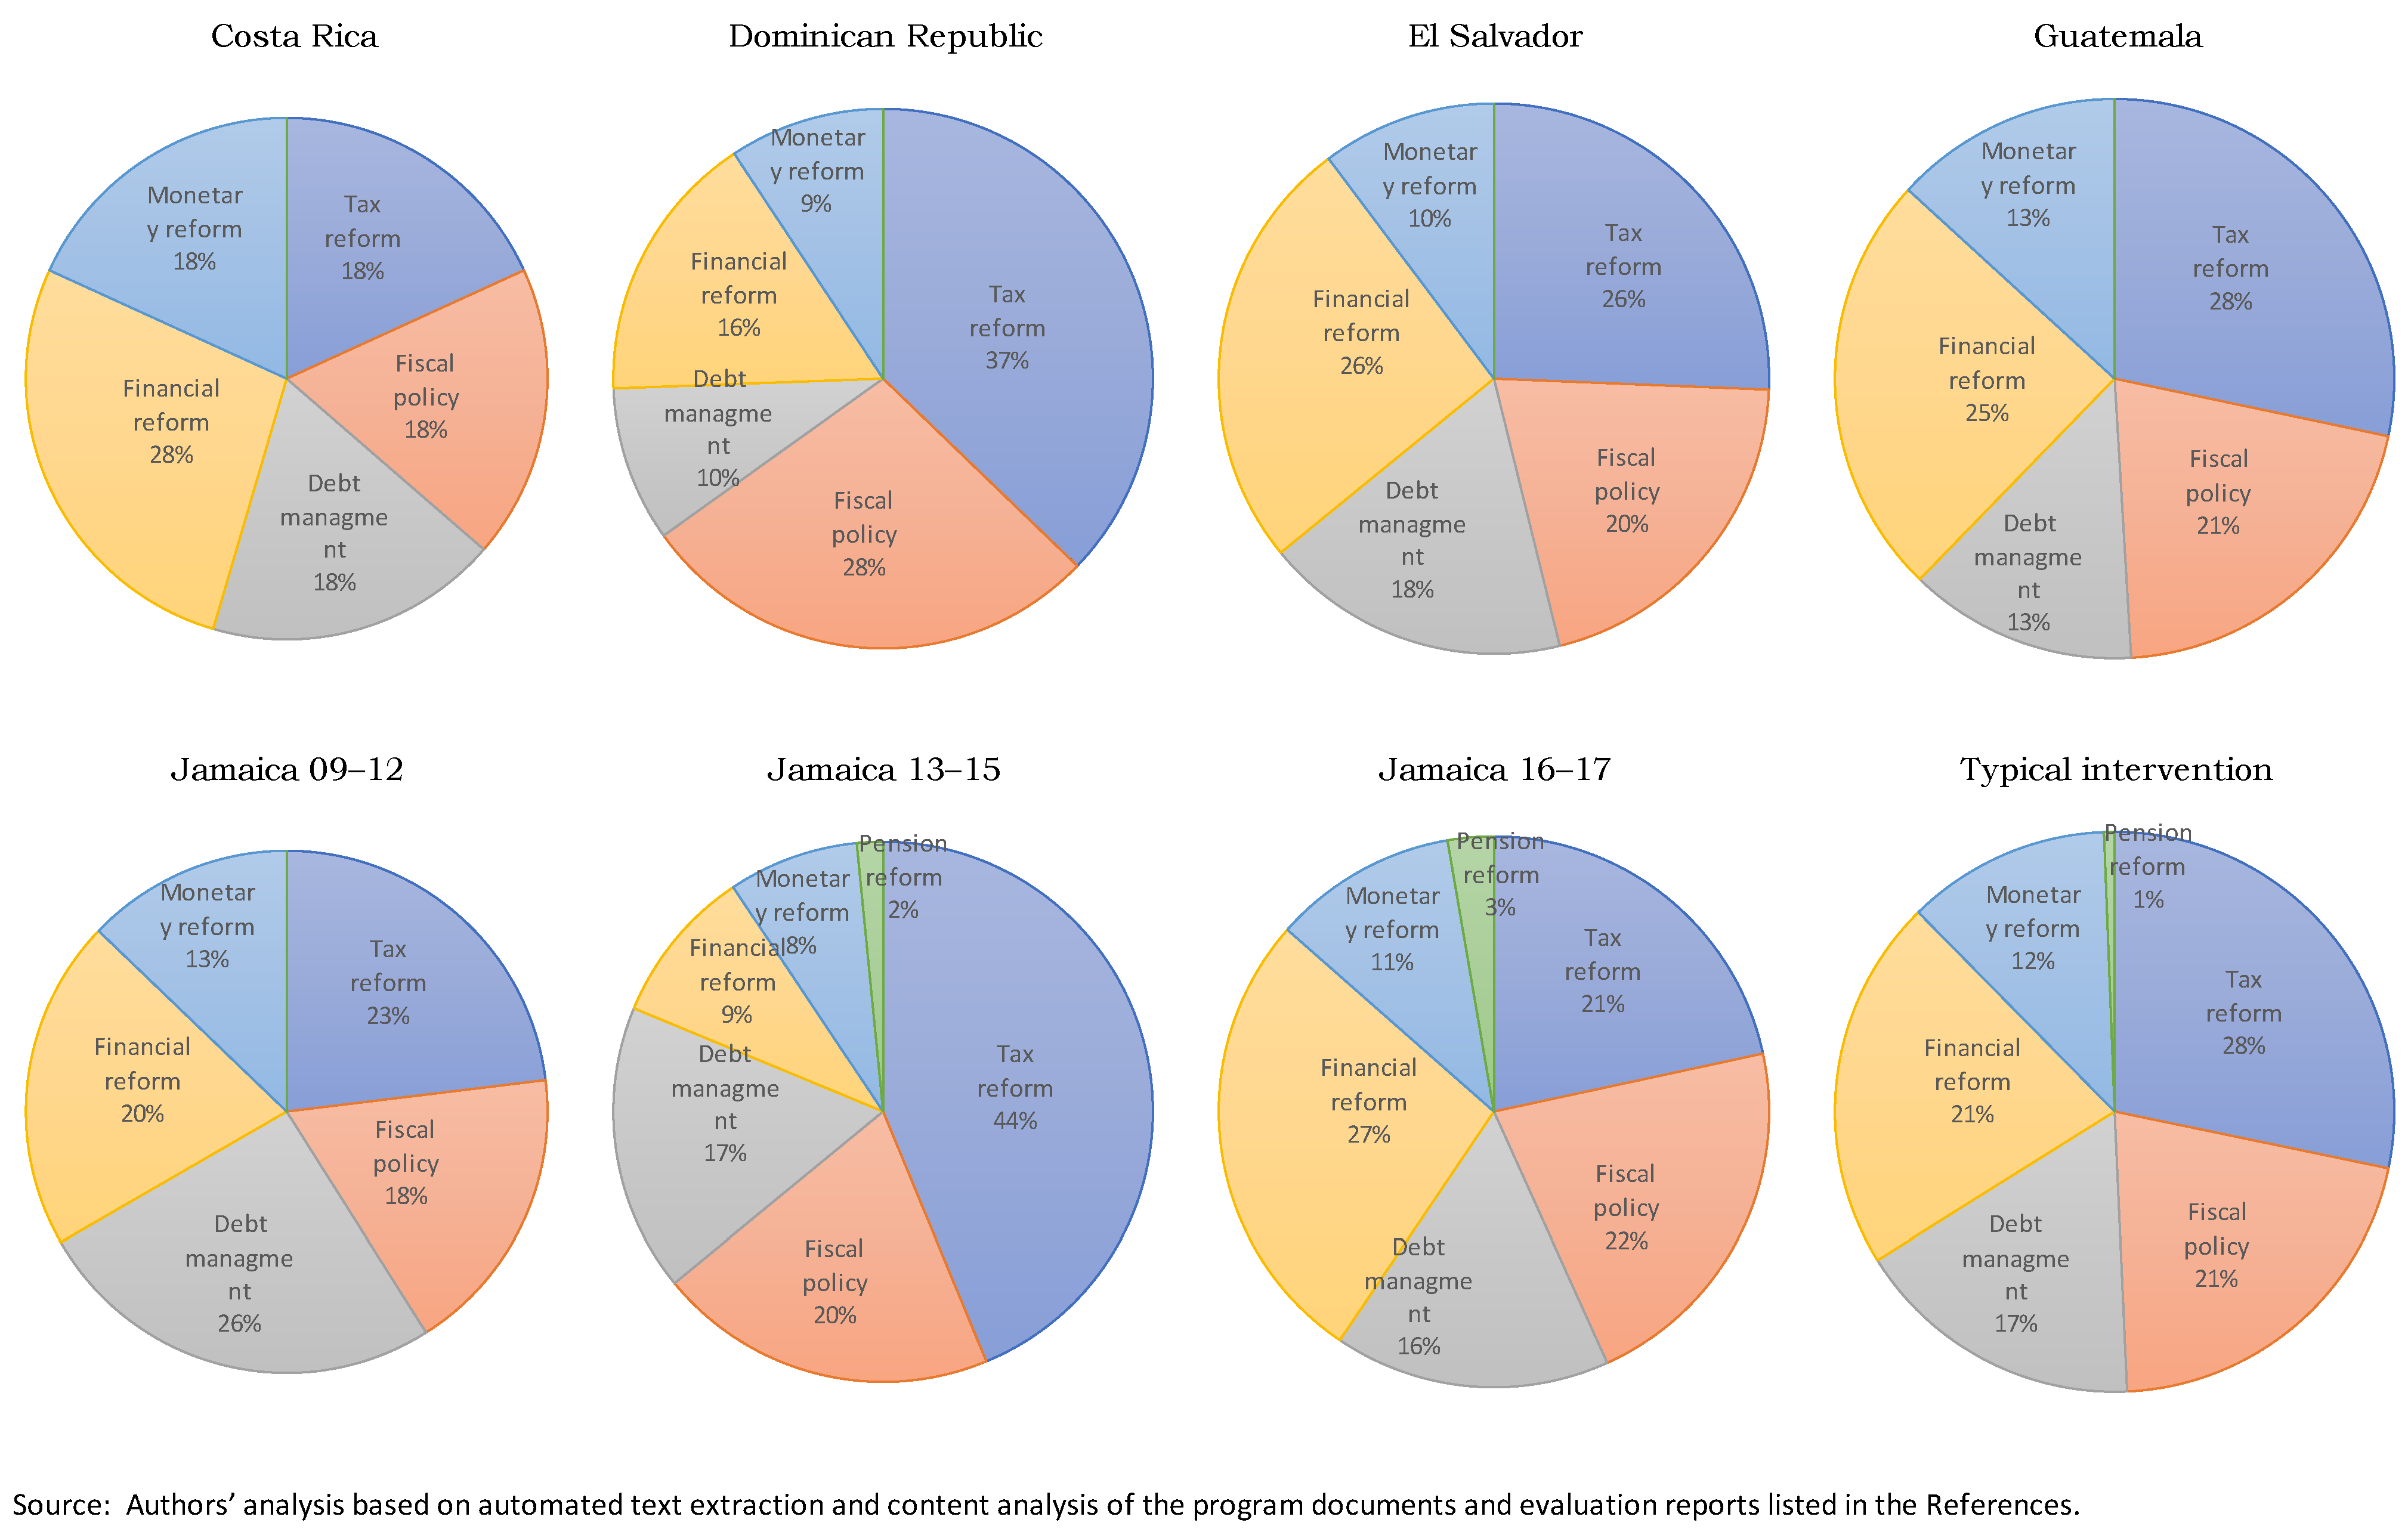
Finally, for each case study, we reviewed all available documentation regarding the on-the-ground experiences of each policy-based loan to provide the most unbiased view possible about its functioning, challenges, and achievements. This review included documents for which the program was planned, the content of the letters of intention, the pre-intervention diagnostic documents, and the partial reviews for the program when available. We also compared the macroeconomic projections made for each loan in the baseline with actual data after the implementation and reviewed the ex-post evaluations for each program. With all the available documentation, we implemented a data scraping approach to predict the main focus of each program. This enabled us to identify the fPBL focus in each country, which we present in the following set of graphs (
Figure 1). For the case study of Jamaica, we had to group the programs by year segments due to the country’s long exposure to fPBLs. The documentary review covered IMF Staff Reports and Article IV Consultation reports; Letters of Intent and Memoranda of Economic and Financial Policies where available; IMF program reviews and ex-post evaluations; World Bank Program Information Documents, Development Policy Financing documents, Implementation Completion and Results Reports (ICRs), Country Partnership Strategy progress reports, and Independent Evaluation Group reviews; and IDB loan/project documents, Program Completion Reports (PCRs), and Office of Evaluation and Oversight (OVE) evaluations. The specific country reports used are listed in the References section, including the IMF Country Reports and the World Bank and IDB evaluation documents identified for each case. The study did not use interviews, questionnaires, or survey data; all qualitative information was obtained from publicly available institutional documentation and published research.
Figure 1 summarizes the policy focus identified in the program documentation. Across the five cases, the fPBL-supported episodes combined tax and fiscal reforms with measures related to debt management, financial-sector reform, and, to a lesser extent, monetary reform. The relative emphasis differed across countries and, in Jamaica, also across successive program periods, illustrating that the interventions were multidimensional reform packages rather than a uniform policy treatment.
4. Methodology
Participation in fPBL-supported programs is certainly nonrandom, instead, it may reflect a heavy self-selection bias related to countries’ economic conditions, institutional capacity, political commitment, and willingness to undertake reforms. This selection process motivates the construction of credible untreated counterfactual trajectories for the countries exposed to these programs under different quasi-experimental approaches (
Athey & Imbens, 2017). The synthetic control method is particularly appropriate in this setting because it uses pre-intervention characteristics and outcomes to construct a data-driven comparison unit, rather than treating the 2008 global downturn as a source of random assignment (
Abadie & Cattaneo, 2018). The SCM has also been applied to IMF precautionary lending.
Essers and Ide (
2017) construct synthetic counterfactuals to evaluate the effects of Flexible Credit Line (FCL) arrangements on sovereign bond spreads and capital inflows, providing a related—although institutionally distinct—application of the method to international financial support. The common-shock rationale and case-selection criteria were discussed in
Section 3, while the methods below address remaining country-specific heterogeneity using alternative counterfactual estimators and an event-study approach.
4.1. Synthetic Control Method: Abadie’s Approach
Let
y(1) be the potential outcome of a country that was exposed to an fPBL triggered by the global economic shock of 2008, and
y(0) the outcome of the same country in the absence of that program. Because
y(0) is unobserved, we estimate it using a weighted combination of untreated units following the synthetic-control approach developed by
Abadie and Gardeazabal (
2003) and
Abadie et al. (
2010). This allow us to calculate
τ =
y(1) −
y(0), which represents the effect of the program. Suppose the outcome of interest is GDP per capita; then we may estimate
yt(0) by a weighted sum of observed outcomes from a donor pool of countries following the ADH’s approach. In symbols, let us assume that
where
yitc is the counterfactual state and
τit the treatment effect for the
i-th country in our sample at the
t-th year. Here, we suppose that
τit > 0 if
i = 0 (treated unit) and
t >
T0, where
T0 = 2008 (post-treatment period); and
τit = 0 for
i > 0 (donor pool of countries) or
t ≤
T0 (pre-treatment period). ADH incorporates structure in the model by considering the following linear factor model in the counterfactual state:
where
δt is an unobserved common factor with constant factor loadings across countries;
Z is a (k × 1) vector of observed covariates (not affected directly by the intervention);
θ is a (1 × k) vector of unknown parameters;
λ is a vector of unobserved common factors with unknown loadings
µ; and ϵ are unobserved transitory shocks with zero mean.
The ADH approach constructs the synthetic control as a weighted combination of untreated donor units. The vector of synthetic-control weights W = (w
1, …, w
j)′ is selected to minimize the distance between the treated unit and the weighted combination of donor units:
where
, and the estimated weights allow us to estimate the counterfactual state for the treated unit as follows:
In our estimates, contains the information of the outcomes and covariates for the countries in the donor pool, while contains the information in the treated country. We included the following covariates: trade openness, schooling, industry share, investment rate, total factor productivity, employment, population. The donor pool consists of economically comparable countries from LAC, Africa, Asia, and Oceania that did not receive conditional loans from the IMF, IDB, or World Bank during the evaluation period. The objective is to construct a credible approximation of the untreated trajectory for each treated country using information from a donor pool, thereby providing an estimate of its unobserved counterfactual path. Treatment effects are estimated over 2009–2020 for the five countries under study. Because SCM estimates can be sensitive to donor-pool composition, we interpret them jointly with pre-treatment fit, placebo tests, alternative pre-treatment windows, and donor-pool sensitivity analyses reported below rather than treating any single donor-pool specification as definitive.
4.2. Matrix Completion
According to
Athey et al. (
2021), there is a connection between a matrix completion estimator from machine learning techniques (ML), the synthetic control method, and the difference-in-differences approach, as they all focus on minimizing the same objective function but differ on the regularization and restrictions imposed on their parameters. The advantage of the matrix completion approach is that it imposes fewer restrictions than the other methodologies (not more than tuning the hyperparameters of the model) while dealing with more complex missing data patterns. This is because ML estimators exploit both sources of information over time and between cross units to impute the missing values of a matrix.
The idea behind the matrix completion approach is to complete a matrix of outcomes with the potential entries according to a matrix of treatment
D, where
Dit = 1 if the
i-th country is treated and 0 otherwise. This type of estimator usually uses a low-rank representation of the matrix of potential outcomes to fill out this matrix. If the missing values are the counterfactual potential outputs of the treated unit, then ML algorithms turn into powerful tools for making causal inferences in observational studies. In symbols, suppose that
Y(
0) is the
N ×
T matrix of outcomes for
N units over
T time periods with missing entries for the treated periods on the treated unit (that is, for the years a country was treated with a conditional loan), and
M the expected values of these outcomes. Applying the methods in the ML literature to complete the matrix
Y(
0), we estimate
M by solving the following convex-optimization problem:
where
PΩ is a projection matrix of the matrix
Y(
0) onto the observed entries and the missing entries replaced with 0, and ||
M||
∗ is the nuclear norm (the sum of the singular values of
M) multiplied by a scalar lambda, which is a penalty parameter chosen by cross-validation and required to identify the missing values of the matrix through convex optimization problems. Sometimes,
M is factored by
M ≈
AB′, where
AN×r and
BT×r are lower-rank matrices (
r ≪
min{
N,
T}), so the problem is now expressed as:
We address this problem using the matrix-completion-with-nuclear-norm-minimization estimator proposed by
Athey et al. (
2021). Unlike Frobenius-norm regularization, which produces zero estimates for unobserved entries, nuclear-norm regularization exploits the low-rank structure of the observed panel to estimate the missing untreated potential outcomes. We compute the estimator using an alternating least squares (ALS) algorithm and use the resulting estimates to construct the counterfactual untreated outcomes for countries exposed to conditional lending following the 2008 global economic downturn.
4.3. Cointegration-Based Counterfactual
Because GDP per capita is a highly persistent macroeconomic series, counterfactual estimation in levels may be vulnerable to spurious relationships when treated and donor outcomes are nonstationary. We therefore complement the Synthetic Control and Matrix Completion estimators with a cointegration-based counterfactual. If the treated outcome and an untreated linear combination of donor outcomes are individually integrated but share a stationary long-run relationship during the pre-intervention period, the cointegrating relation provides an estimate of the equilibrium path that the treated outcome would be expected to follow in the absence of the intervention. Related empirical work has combined synthetic-control reasoning with structural time-series models and cointegration to construct GDP-per-capita counterfactuals and to select control series on the basis of common long-run trends (
Dreuw, 2023). Under the maintained assumption that this long-run relationship would have remained stable after treatment, deviations of the observed treated outcome from the projected cointegrating path can be interpreted as treatment effects. This approach is consistent with
Masini and Medeiros (
2021), who develop a counterfactual framework for high-dimensional nonstationary data that nests synthetic-control methods. It is more directly motivated by
Masini and Medeiros (
2022), who show that intervention effects can be consistently estimated when the treated outcome and a linear combination of donor outcomes share a cointegrating relationship, albeit with a nonstandard asymptotic distribution. In contrast, when the treated and donor outcomes are noncointegrated I(1) processes, the resulting counterfactual relationship is spurious and the intervention-effect estimator diverges, even when the true intervention effect is zero.
The cointegration-based counterfactual is estimated using countries from the donor pool whose outcome series provide evidence of a common stochastic trend with that of the treated country during the pre-treatment period. Donor units are retained for this specification only when the pre-intervention data support a cointegrating relationship with the treated outcome. This restriction is intended to avoid constructing long-run counterfactuals from nonstationary series that merely exhibit spurious co-movement. The set of donor countries satisfying the cointegration condition for each treated country is reported in the Annex.
The cointegration specification therefore serves not merely as a time-series robustness check, but as an alternative estimator of the untreated potential outcome under non-stationarity. Nevertheless, its causal interpretation depends on the stability of the pre-treatment cointegrating relationship in the absence of treatment and on the donor, outcomes remaining unaffected by the intervention. Cointegration should therefore not be read as proof of causality by itself; rather, it supplies a long-run counterfactual relationship whose causal interpretation follows only under these maintained identification conditions.
To reduce dependence on any single counterfactual specification, we summarize the three estimated untreated trajectories—SCM, MC, and CBC—using their simple average as a composite counterfactual benchmark. The three estimators are intended to approximate the same latent untreated potential outcome, Y(0), under different modeling assumptions. The average therefore summarizes the common counterfactual signal and reduces reliance on the magnitude implied by any single specification. Agreement in the sign of the estimated effects across counterfactual methods provides evidence that the longer-run post-intervention pattern is robust to alternative model specifications and is not driven by the choice of a particular counterfactual model. Conversely, disagreement across methods is interpreted as evidence of counterfactual uncertainty and is therefore reported explicitly in our results.
4.4. Event Study with Single Treated Units
To provide additional evidence after the synthetic-control analysis, we conducted an event-study approach applied to single treated units for a set of macroeconomic outcomes. The control group was constructed with 20 donor countries from the LAC region that were not exposed to fPBLs. We compared the average outcomes of each treated unit with the control group before and after the intervention and explicitly evaluated the plausibility of the parallel-trends assumption (PTA). Where pre-treatment trajectories are sufficiently similar, the event-study differences are interpreted as evidence consistent with a causal treatment effect. Where the PTA is not supported, the estimated post-treatment differences are reported as descriptive counterfactual comparisons and are not assigned a causal interpretation.
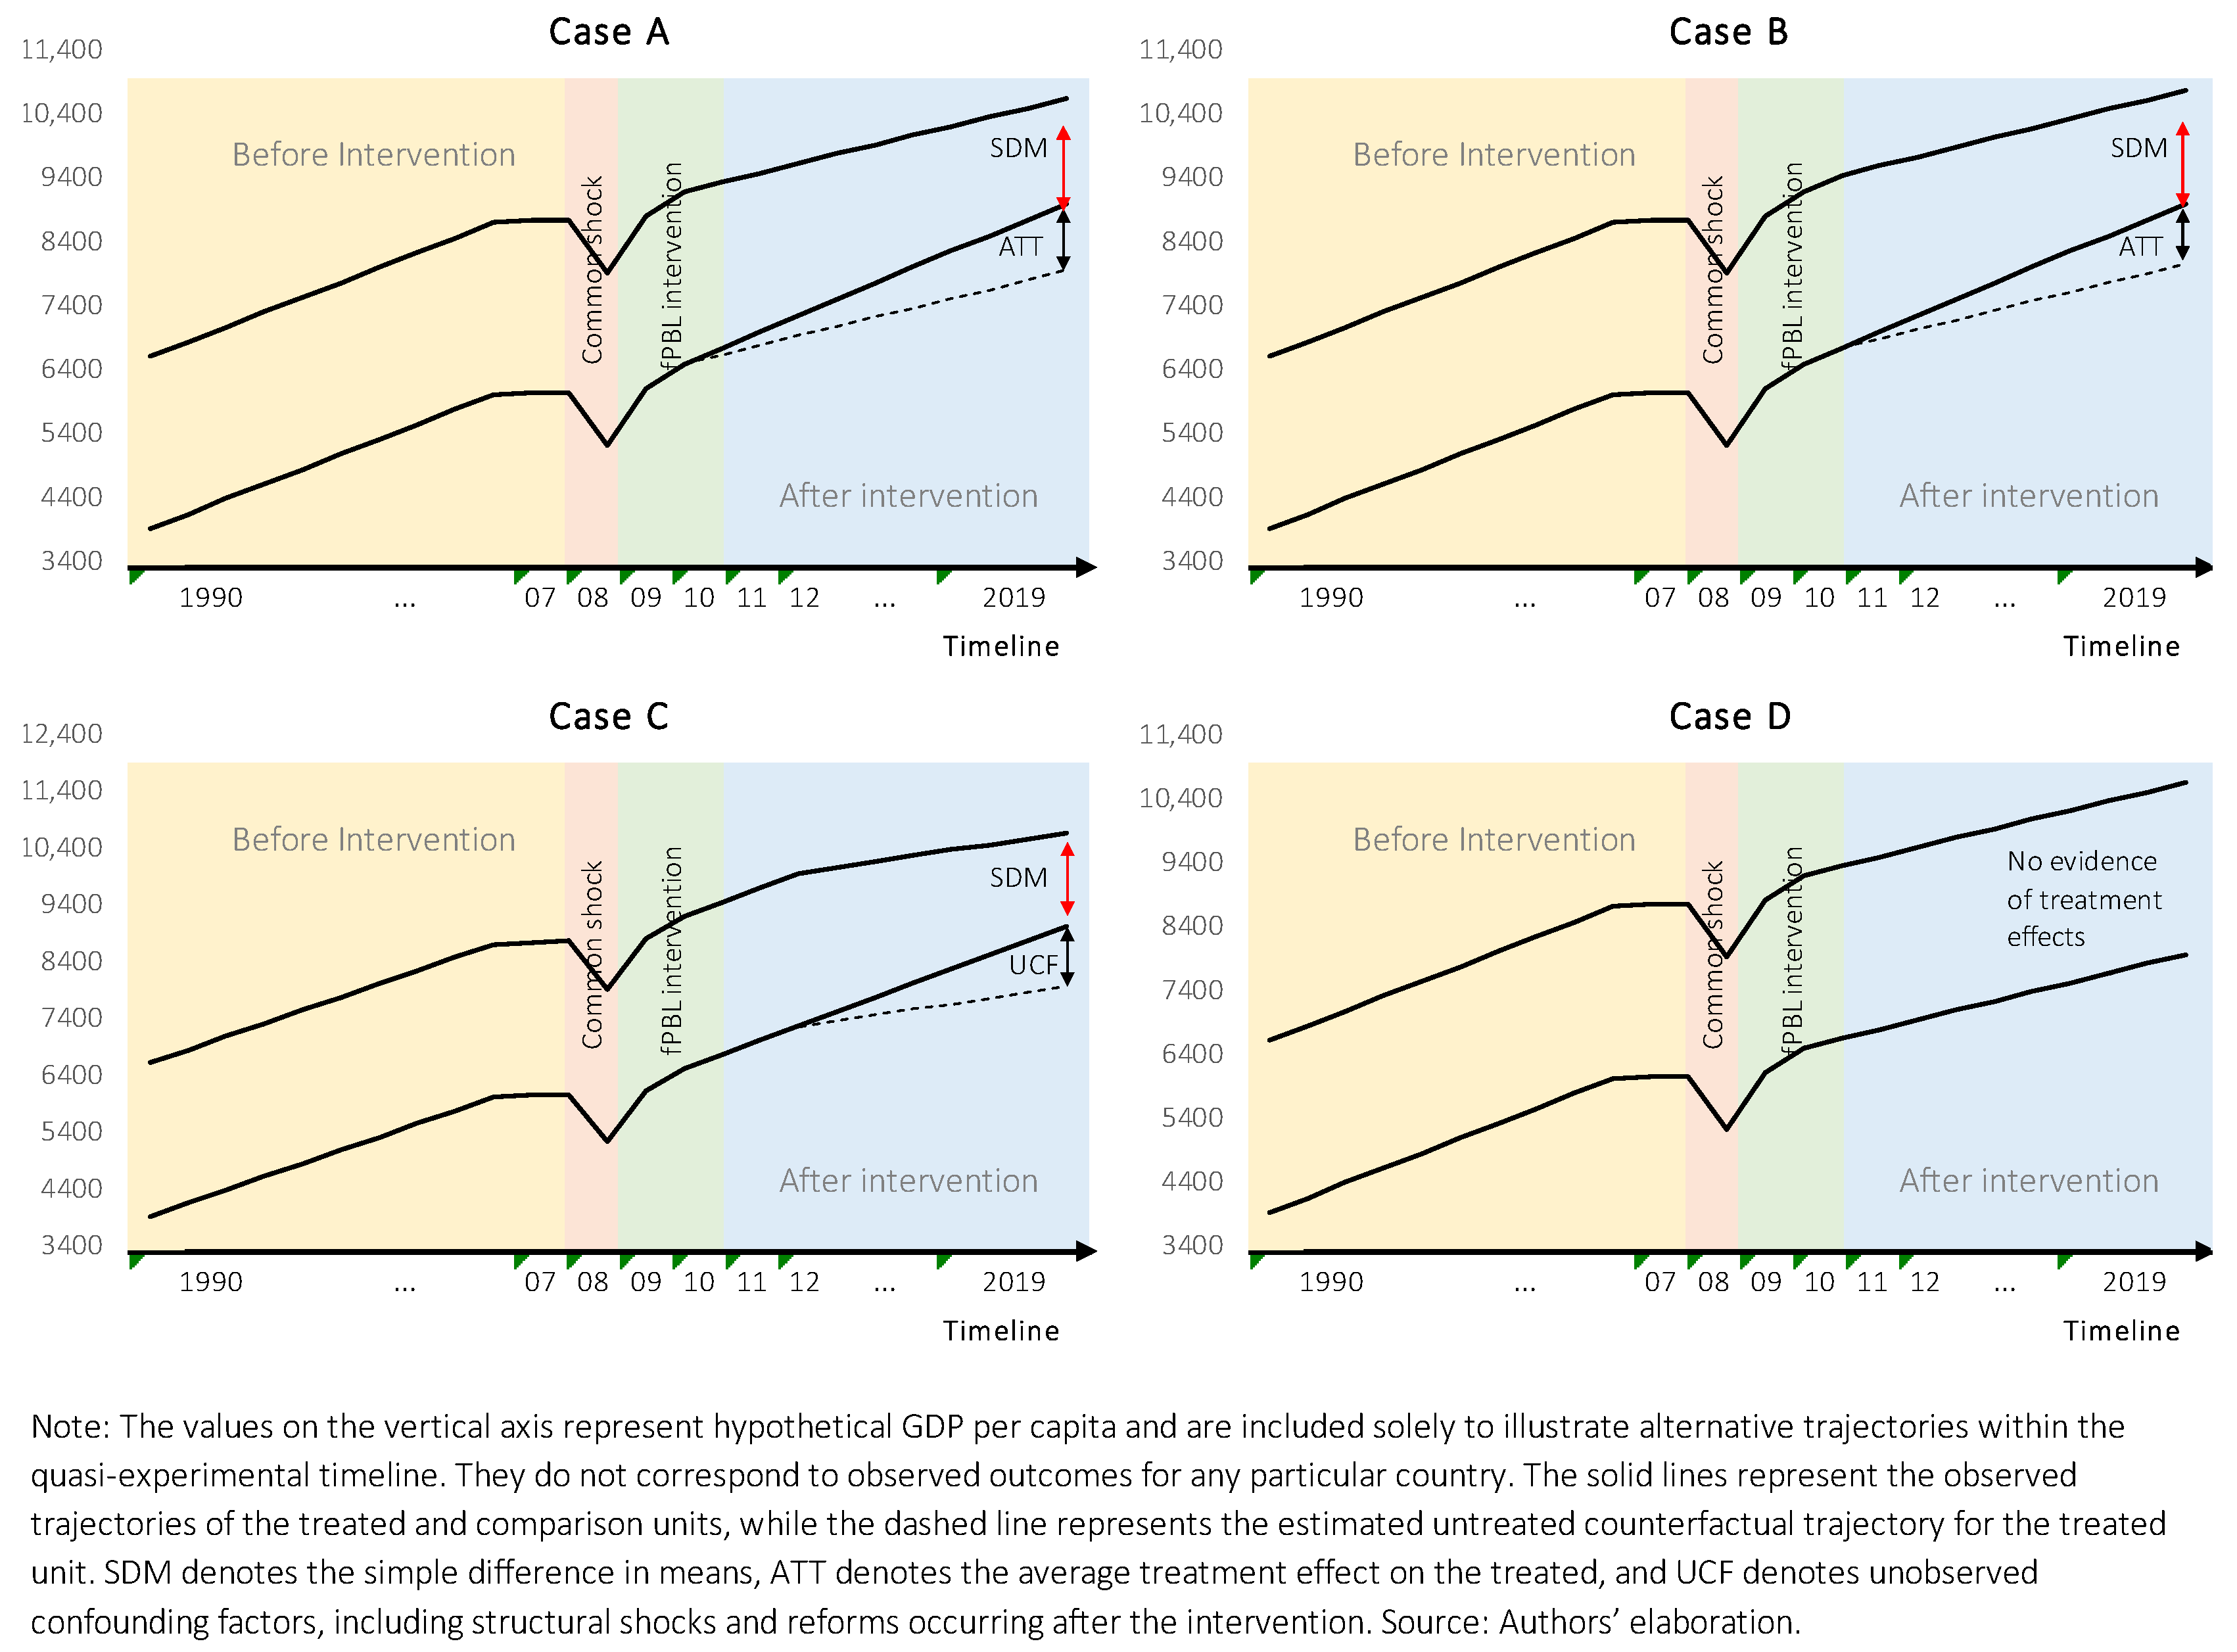
Figure 2 presents four hypothetical trajectories for the GDP per within the quasi-experimental timeline. The solid lines represent the observed outcomes of the treated and comparison units, while the dashed line represents the estimated untreated counterfactual trajectory of the treated unit. Case A illustrates an effect that begins during program implementation and continues after completion. Case B represents a delayed effect that emerges only after the intervention has ended. Case C shows a post-intervention divergence that cannot be attributed exclusively to the program because unobserved confounding factors, including structural shocks and subsequent reforms, may also have affected the treated outcome. Case D represents a situation in which no meaningful post-intervention divergence is detected and, consequently, there is no evidence of a treatment effect. We distinguish causal interpretation from descriptive comparison throughout the event-study results. The baseline for both groups is the outcome average over the five years before implementation (2004–2008 where the timing permits). Post-intervention outcomes are indexed by event time relative to the end of the relevant exposure period, with +1 denoting the first year after exposure, +2 the second year, and so forth. In the following expressions, (
yT) represents the outcome in the treated country, while (
yNT) represents the same outcome in the donor pool of non-treated countries. In turn, (
yT(0)) and (
yNT(0)) represent their respective baseline outcomes. When the outcome is denoted by (
), it represents an average.
4.5. Identification, Robustness, and Attribution
To check how sensitive the findings are to the main modeling choices and identifying assumptions, we carry out several robustness exercises. For the synthetic-control estimates, we examine pre-intervention fit, run placebo tests, vary the pre-treatment estimation window, compare alternative donor pools (Mixed/global, LAC-only, and non-LAC), and re-estimate each synthetic control after removing its highest-weight donor. These checks show whether the results depend heavily on a particular donor, donor-pool composition, or choice of pre-intervention period.
For the ES-STU estimates, causal interpretation depends on whether the pre-intervention trends are reasonably parallel. We therefore assess this condition separately for each outcome. When the pre-treatment evidence does not support parallel trends, we report the post-intervention differences as descriptive or complementary evidence rather than as causal effects. We also recognize that some countries received overlapping support from fPBLs while simultaneously implementing domestic reforms, which means that programs supported by the IMF, IDB, and World Bank may have had mutually reinforcing effects. Consequently, the estimates should be interpreted as reflecting the overall effect of the fPBL-supported fiscal reform episode, rather than the isolated effect of any single multilateral institution. The results of these checks are presented alongside the empirical findings and summarized in
Section 6.7.
5. Data
To enhance comparability and common support, we selected 33 untreated countries whose pre-intervention characteristics around 2008 were broadly comparable to those of the treated countries across several dimensions, including demographic characteristics, macroeconomic outcomes, institutional conditions, and the level of development measured by the Human Development Index. This selection was intended to increase the likelihood that each treated country’s pre-intervention characteristics could be approximated by a convex combination of countries in the donor pool. The donor countries were drawn from Latin America and the Caribbean, Africa, Asia, and Oceania and were used to construct the counterfactual trajectories for the LAC economies exposed to fiscal policy-based loans (fPBLs).
Table 2 lists the countries included in the study.
The data containing the covariates and outcomes for the countries in the sample come from the IMF Government Finance Statistics (GFS) (
IMF, 2023a), the IMF World Economic Outlook (WEO) (
IMF, 2023b), the World Bank World Development Indicators (WDI) (
World Bank, 2023), and the Penn World Table (
Feenstra et al., 2015). The conditional-lending information was constructed from IMF Country Reports and Article IV documents, including program requests, reviews, and ex-post evaluations; World Bank project and loan documents, Implementation Completion and Results Reports (ICRs), and Country Partnership Strategy progress reports; and IDB project documents, Program Completion Reports (PCRs), and independent evaluations by OVE. These sources are listed explicitly in the References section and are used to document both the intervention dates and the policy content of the programs. The quantitative analysis is based on the macroeconomic series from the statistical databases, while the institutional and program variables are coded from the documentary sources.
6. Results
6.1. Costa Rica’s Case
The global financial crisis of 2008 brought to Costa Rica a sudden stop in economic activity amid a scenario of inflation fueled by the decision of the central bank to postpone the implementation of inflation targeting policy in times when the economy was experiencing an excess of private spending just before the crisis erupted. The economy entered a stagflation period in 2009, aggravated by the sudden fall of commodity prices that increased the external account deficit to almost 9.3 percent of GDP. In this year, the public sector’s debt underwent a significant shift, having steadily declined since 2004. This complex scenario of payments encouraged a sequence of multilateral interventions for the country, which started in 2009 with an IMF-SBA for about USD 740 million and a single-tranche DPL-DDO for a total of USD 500 million with the World Bank. Both interventions focused on lowering the liquidity risks that Costa Rica was facing during the global economic crisis. The SBA aimed to lessen the shock to growth while enhancing the banking system’s ability to resist adverse external shocks by diversifying its dependence on the exchange rate (
IMF, 2009a). By contrast, the DPL-DDO’s objective on the fiscal front was to improve public finances by implementing results-based management on expenditures, including measures to prioritize essential services and reduce wasteful spending (
Independent Evaluation Group, 2011a). As the IMF arrangement progressed, its third and final review reported strong program performance: all quantitative performance criteria for end-December 2009 and end-March 2010 were met, although the structural benchmarks concerning deposit insurance and the bank-resolution framework were delayed (
IMF, 2010a).
While the ICR for the DPL-DDO program was rated as ‘’satisfactory”, based on an IMF ex-post evaluation (CR-11/157) with three reviews out of four completed, in which all of them rated the program as “on track”, it seems the SBA program ended satisfactorily and finally met its objectives. Among the quantitative performance criteria of the SBA’s program, we found two specific measures: (i) setting a ceiling on the stock of central government debt and (ii) setting a floor on net international reserves. Both measures, intended to identify safe ways to keep government spending regulated while also providing cash to help the financial sector recover from the negative shock, were met during the implementation period. In addition, the SBA sought to prepare Costa Rica for a more flexible exchange-rate regime and modernized monetary-policy framework. This transition continued after the program, including the adoption of a managed floating regime in 2015 and the strengthening of the policy interest rate as a monetary-policy instrument (
Muñoz & Rodríguez-Vargas, 2021). The program-document comparison in the Annex shows a comparison between a set of macroeconomic indicators that were projected when the SBA began and their actual figures. In light of this comparison, the SBA demonstrated mixed results throughout the intervention period. On one hand, there were positive results on the current account, but on the other hand, outcomes on the fiscal front were not entirely positive, as the government’s overall balance worsened. Finally, we found positive results on the inflation rate, as it decreased steadily during the intervention period.
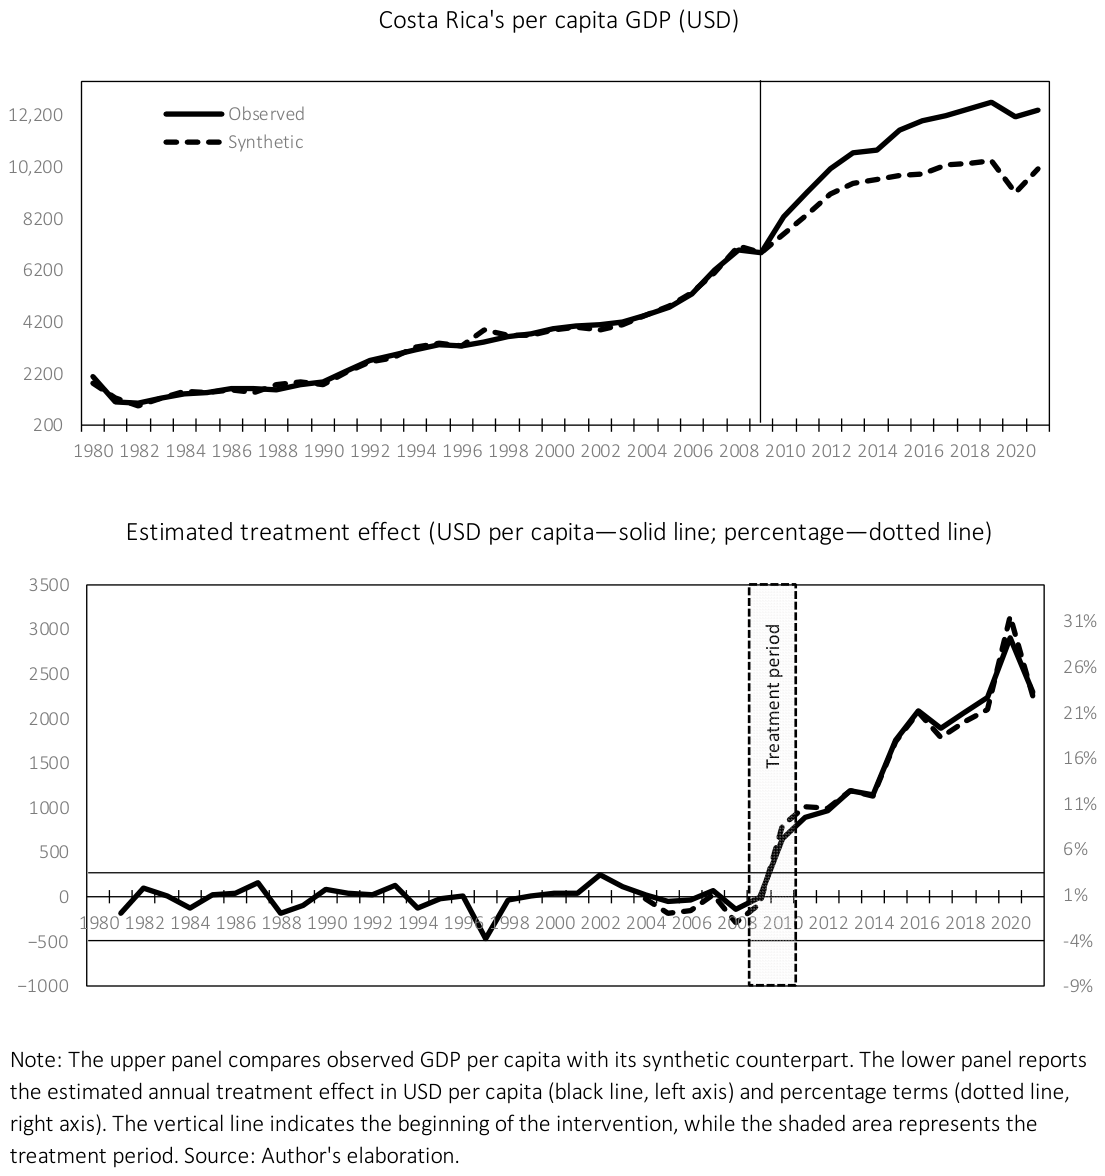
For Costa Rica, the clearest ES-STU results concern the fiscal balances and inflation. Pre-intervention trends are sufficiently parallel for the overall balance, primary balance, and inflation. The two fiscal balances improve relative to the comparison path after the intervention, and the favorable gap becomes larger over time. Inflation also remains below its counterfactual trajectory. Other indicators, including GDP per capita and the current account, show favorable post-intervention differences, but their pre-treatment trends are not sufficiently parallel for a causal interpretation (see
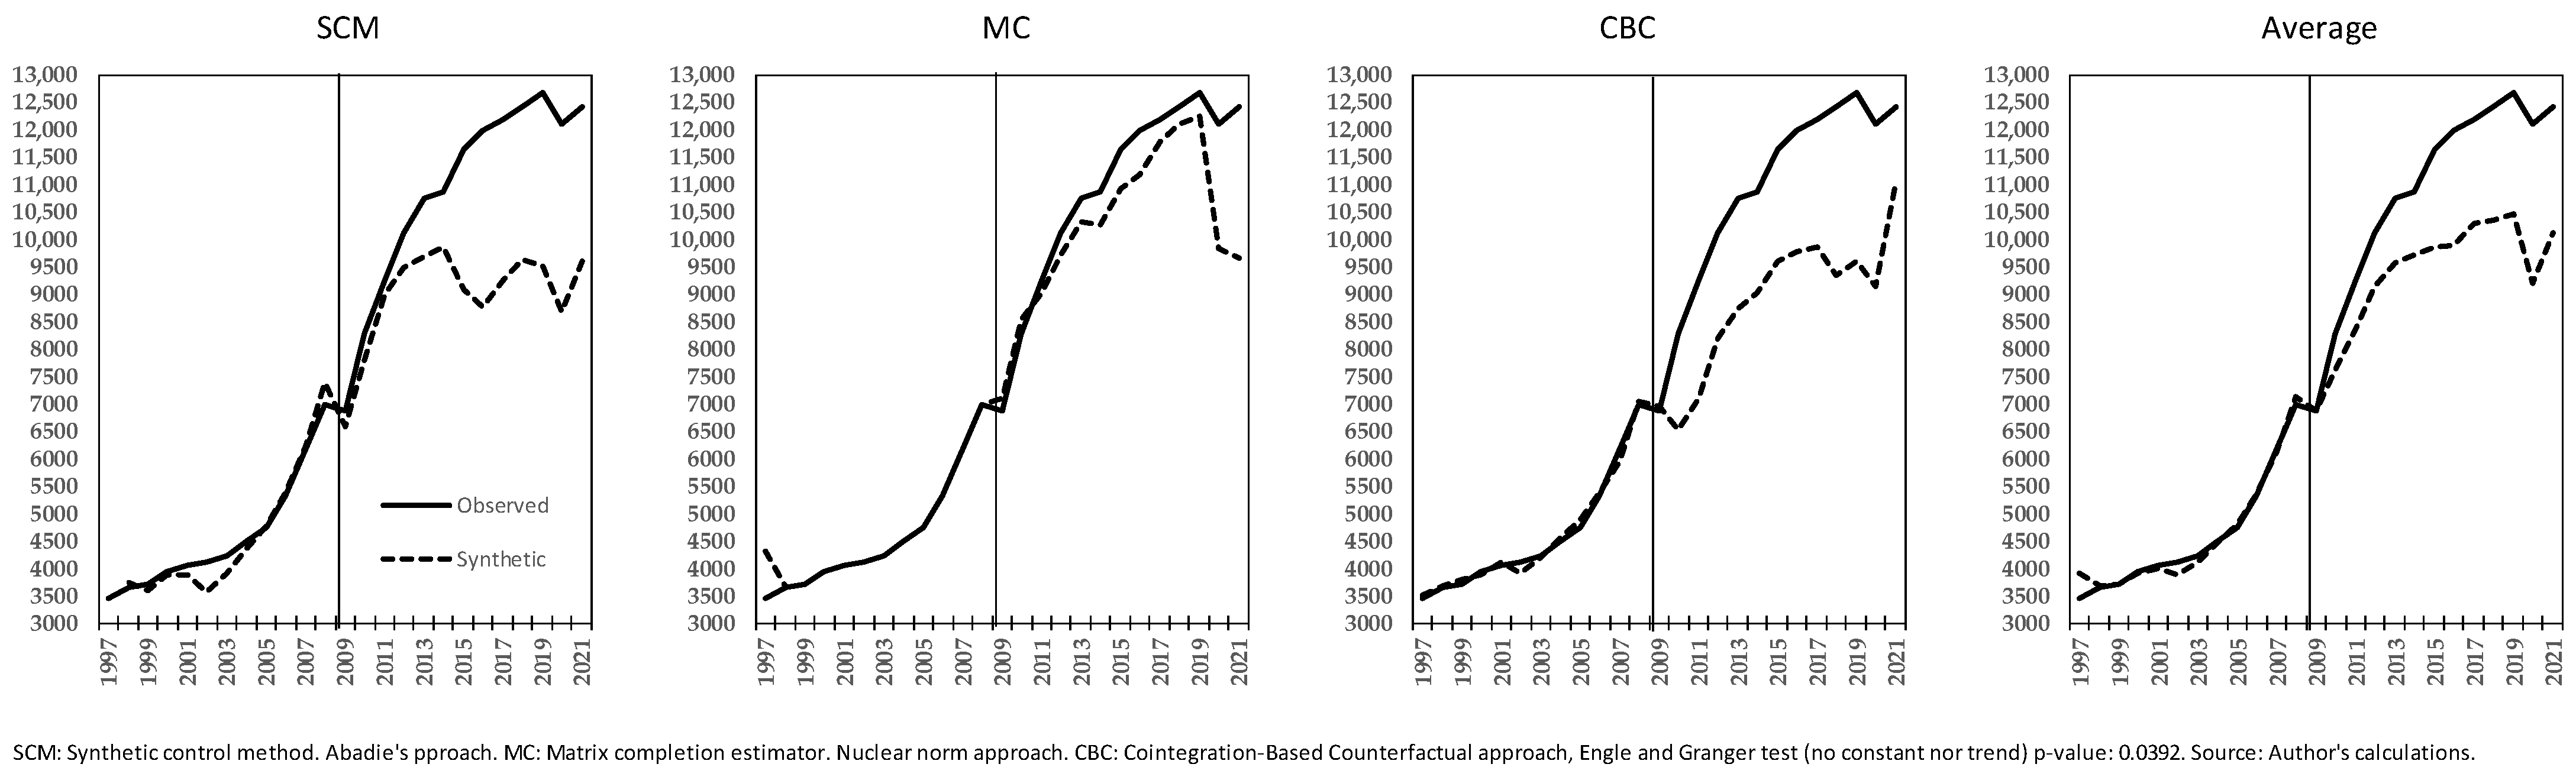
Appendix A). These results complement the synthetic-control evidence, which also points to a favorable post-program GDP-per-capita trajectory (
Figure 3). In the leave-one-out exercise, that direction is preserved, although the pre-intervention fit becomes weaker.
The counterfactual comparisons show that several favorable differences persist or widen during the post-intervention period. One possible mechanism is the institutional and technical support accompanying conditional lending, including training and the dissemination of fiscal-management practices. However, the empirical design does not separately identify this channel, and the later trajectory may also reflect domestic reforms, institutional changes, and external conditions.
The favorable post-program GDP-per-capita trajectory in Costa Rica is robust in direction across the alternative counterfactual approaches. SCM and MC both place observed GDP above the estimated untreated path in the later post-intervention period, while CBC provides a third counterfactual based on the stable pre-treatment long-run relationship (Engle–Granger p = 0.0392). The composite average therefore also indicates a favorable longer-run gap. This pattern remains qualitatively consistent with the descriptive ES-STU result for GDP per capita. However, because the parallel-trends condition is not supported for GDP per capita in the ES-STU specification, this cross-method consistency is interpreted as reinforcing evidence of a favorable post-program trajectory under the SCM approach.
6.2. Dominican Republic’s Case
The Dominican Republic’s economy suffered greatly due to the extreme external financial conditions that triggered the global financial crisis of 2008. The country’s foreign reserves plummeted due to a precipitous fall in goods and services exports, a sudden decline in commodity prices, and a steep decline in the tourism sector and remittances. This led to an unprecedented deficit in the current account, which reached a historic low in 20 years. The fall in tax revenue and the increase in primary expenses took the fiscal deficit to 3.1% of GDP, pushing inflation to rise and reach two digits in 2008. Amid this complex panorama, in October of 2009, the authorities entered into a 28-month SBA with the IMF for approximately USD 1669 million with eight scheduled reviews (
IMF, 2010b). During the same period, the IDB provided a PBP of USD 350 million (
OVE-IDB, 2013). The World Bank’s support combined policy-based financing with a broader country strategy: the Public Finance and Social Sector Development Policy Loan connected public financial management reforms with social-sector measures, while the country partnership strategy placed these activities within a wider program of institutional and development support (
Independent Evaluation Group, 2011b,
2014a).
The SBA’s main goals were to implement countercyclical policies to mitigate the economic downturn and accelerate a structural reform agenda intended to strengthen public finances. To achieve these objectives, the program sought to reduce the fiscal deficit over the medium term by increasing tax revenues and improving expenditure management. The policy stance was expansionary during the first part of the program, providing a stimulus to aggregate demand and limiting the widening of the output gap. During the second half of the program, fiscal policy became contractionary to address fiscal and debt sustainability. On the expenditure side, the program sought to eliminate electricity subsidies and rationalize current transfers to the power sector, thereby helping to place the debt-to-GDP ratio on a sustainable medium-term path.
Only four out of eight scheduled reviews were completed. Although the fourth review was concluded, it required a waiver for the nonobservance of a performance criterion and identified continuing challenges related to revenue mobilization and electricity-sector reform (
IMF, 2011a). The remaining program reviews were not completed before the arrangement expired in March 2012 (
IMF, 2016a). The 2016 Article IV consultations noted subsequent progress in fiscal consolidation nut emphasized that weak revenue collection, extensive tax expenditures, and erosion of the tax base continued to constrain public–service provision and increased public debt.
The program-document comparison in the Annex contrasts the macroeconomic outcomes projected at the beginning of with their observed values. The results were mixed: interest expenditure performed favorably, whereas the primary balance, tax revenue and primary expenditure performed below expectations. During the first half of the program, current expenditure was lower than projected but ultimately ended 0.9 percentage points above its projected level, while revenue finished 1.5 percentage points below its projection. The current account deficit was initially larger than projected but improved during the second half of the intervention and ended more favorably than expected. Inflation followed a similar trajectory and reached its target by the end of the program. Finally, public debt and economic growth both exceeded their projected levels, although with different economic implications.
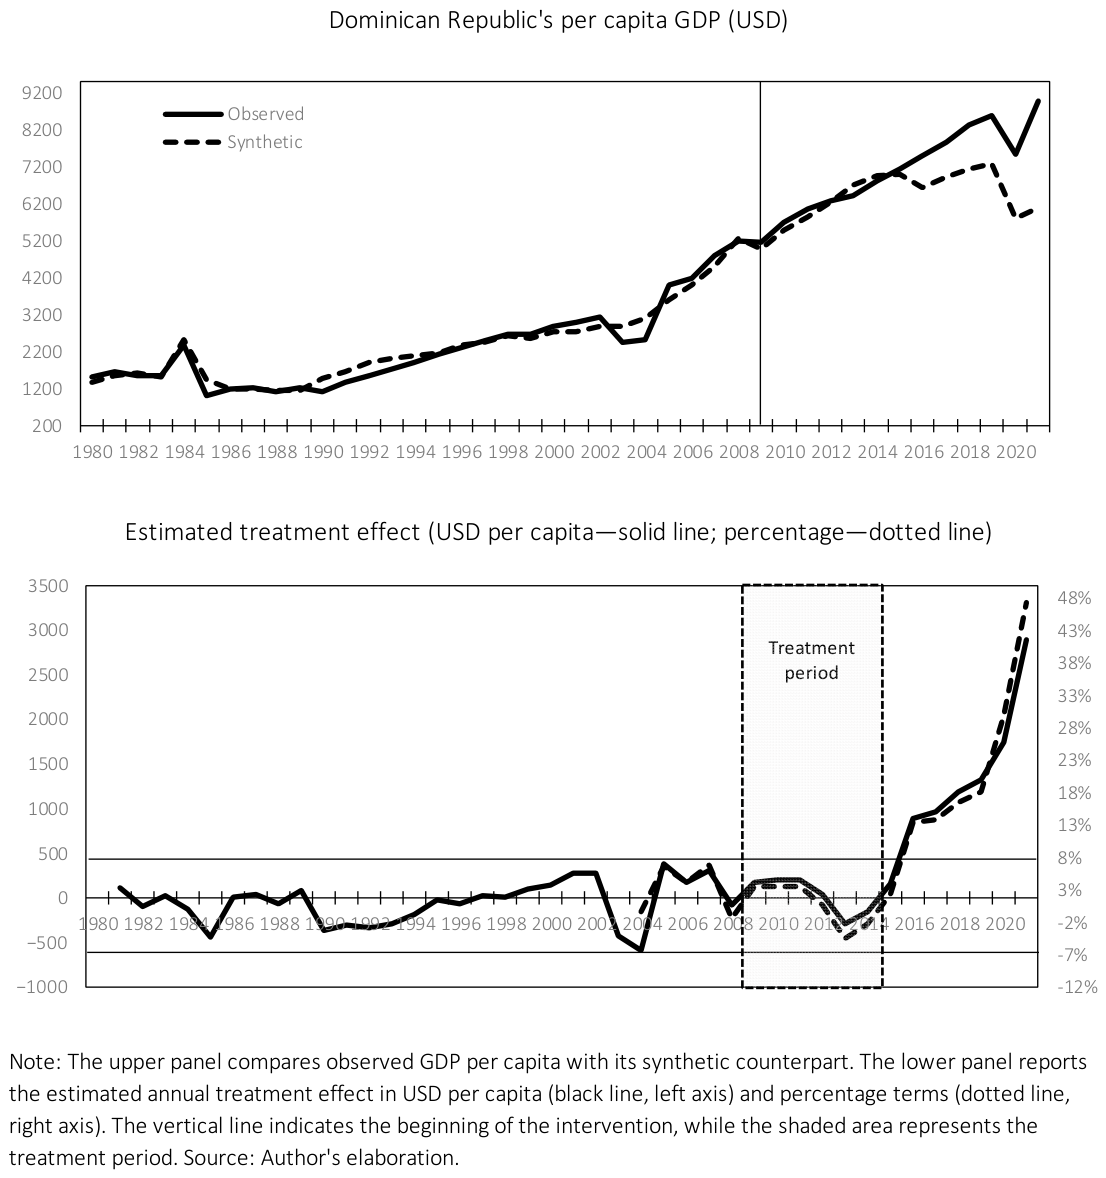
For the Dominican Republic, inflation provides the clearest ES-STU result. Its pre-intervention trend is sufficiently comparable with the control trajectory, and inflation remains below the comparison path after the intervention. Several other indicators—notably the fiscal balances, debt-to-GDP, the current account, and GDP per capita—also move in a favorable direction, but their pre-treatment behavior does not support the same causal interpretation. We therefore treat those estimates as descriptive evidence. The GDP-per-capita pattern nevertheless points in the same direction as the synthetic-control estimates. The leave-one-out exercise also preserves the positive post-program gap from +1 onward, although its size changes when the highest-weight donor is removed.
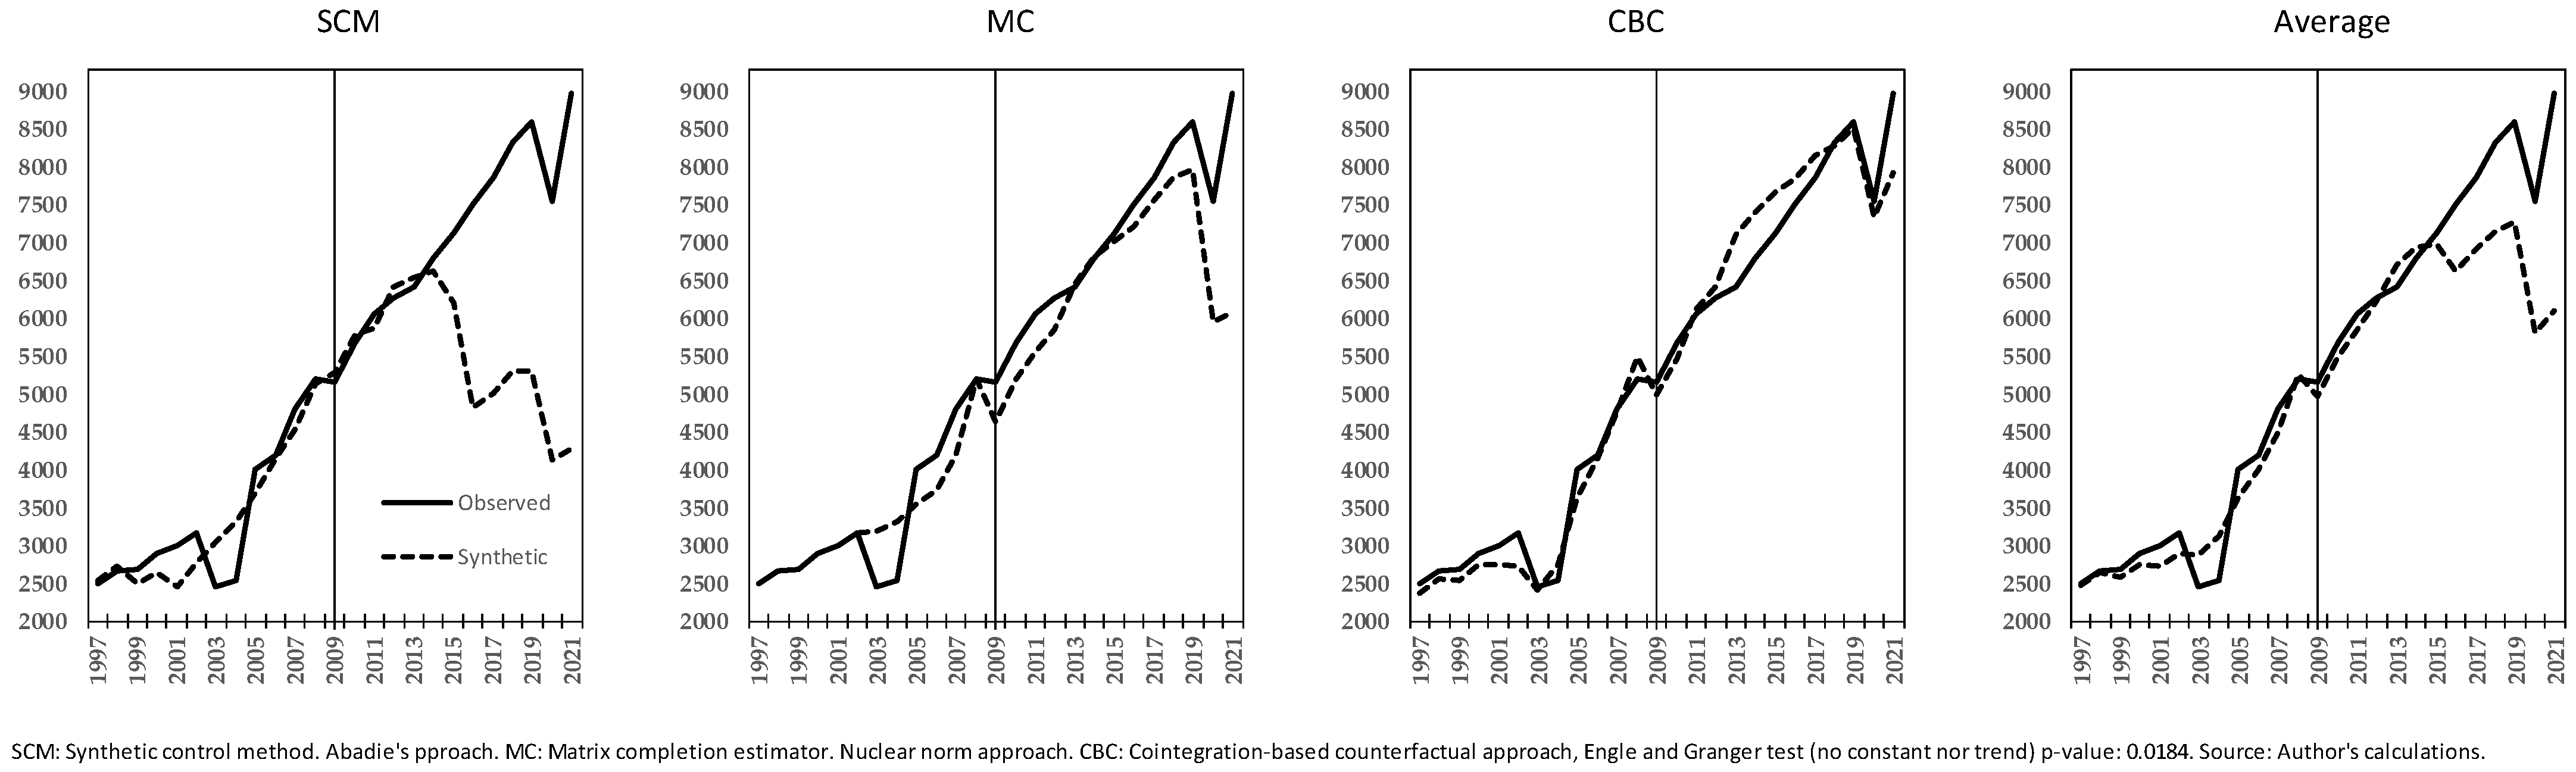
For the Dominican Republic, the favorable post-program GDP-per-capita trajectory is also consistent across the three counterfactual approaches. SCM and MC both place observed GDP above the estimated untreated path in the later post-intervention period, although MC produces a more conservative gap, while CBC is supported by a pre-treatment cointegrating relationship (Engle–Granger
p = 0.0184). The composite average consequently shows an increasingly favorable longer-run gap. The direction of the SCM result is also preserved when the highest-weight donor is excluded. ES-STU estimates point in the same favorable direction for GDP per capita, but the pre-treatment trends are not sufficiently convincing to support a causal interpretation for this outcome. Taken together, the evidence supports a favorable post-program growth trajectory during post-intervention (
Figure 4).
6.3. El Salvador’s Case
The 2009 precautionary SBA was canceled before completion of its first review and replaced by a new three-year arrangement in March 2010 (
IMF, 2010c,
2010d). The replacement SBA/10 focused on improving revenue administration by increasing customs revenue collections and tax auditing. This objective aimed to augment confidence in the financial sector and attain macroeconomic stability by decreasing the public sector deficit and public debt in the medium term. More specifically, the fiscal measures intended to modernize the structure of the tax administration were to enhance coordination in the tax collection process across agencies and improve auditing and collection capacities to boost revenue yields and reduce tax evasion. To control the fiscal deficit, the program also targeted dismantling subsidies for electricity, water, and liquid propane gas so as to remove existing inefficiencies and generate savings that would be redirected toward other social spending (
IMF, 2010d). The WB’s support complemented the broader stabilization and reform agenda through the Public Finance and Social Sector Development Policy Loan and the Public Finance and Social Progress Development Policy Loan, which combined fiscal-management reforms with social-sector measures (
Independent Evaluation Group, 2012a,
2013a;
World Bank, 2010). This support also included the Fiscal Management and Public Sector Performance Technical Assistance Project, which sought to strengthen institutional capacity in tax administration, public financial management, and public-sector performance (
Independent Evaluation Group, 2017;
World Bank, 2017).
The SBA/10 accomplished three out of six reviews, and its performance was mixed according to IMF staff reports: the authorities maintained financial stability and adopted successive tax reforms; however, fiscal consolidation stalled in 2011, mainly because of strong political opposition (
IMF, 2011b,
2011c). In fact, according to the 2013 Article IV consultation (
IMF, 2013a), the program expired in March 2013.
The program-document comparison in the Annex provides more evidence of the SBA/10 performance during the intervention period when comparing the projection of the macroeconomic outcomes with their actual figures. In light of this comparison, outcomes yielded mixed results. For instance, while there were effective steps to contain inflation, increase revenue collections, and slow down interest expense, with respect to the performance of the primary and the overall balance, the results were below expectations.
For El Salvador, the ES-STU results broadly reinforce the favorable patterns found with the synthetic-control method. The strongest evidence concerns the primary fiscal balance and inflation: pre-intervention trends are sufficiently parallel for both, and the post-intervention differences remain favorable over time. GDP per capita and debt-to-GDP also improve relative to the comparison trajectory, but their pre-treatment trends do not support a causal ES-STU interpretation. We therefore treat these estimates as complementary descriptive evidence. This distinction matters especially for GDP per capita because the leave-one-out synthetic-control test shows that El Salvador is relatively sensitive to the removal of its most influential donor.
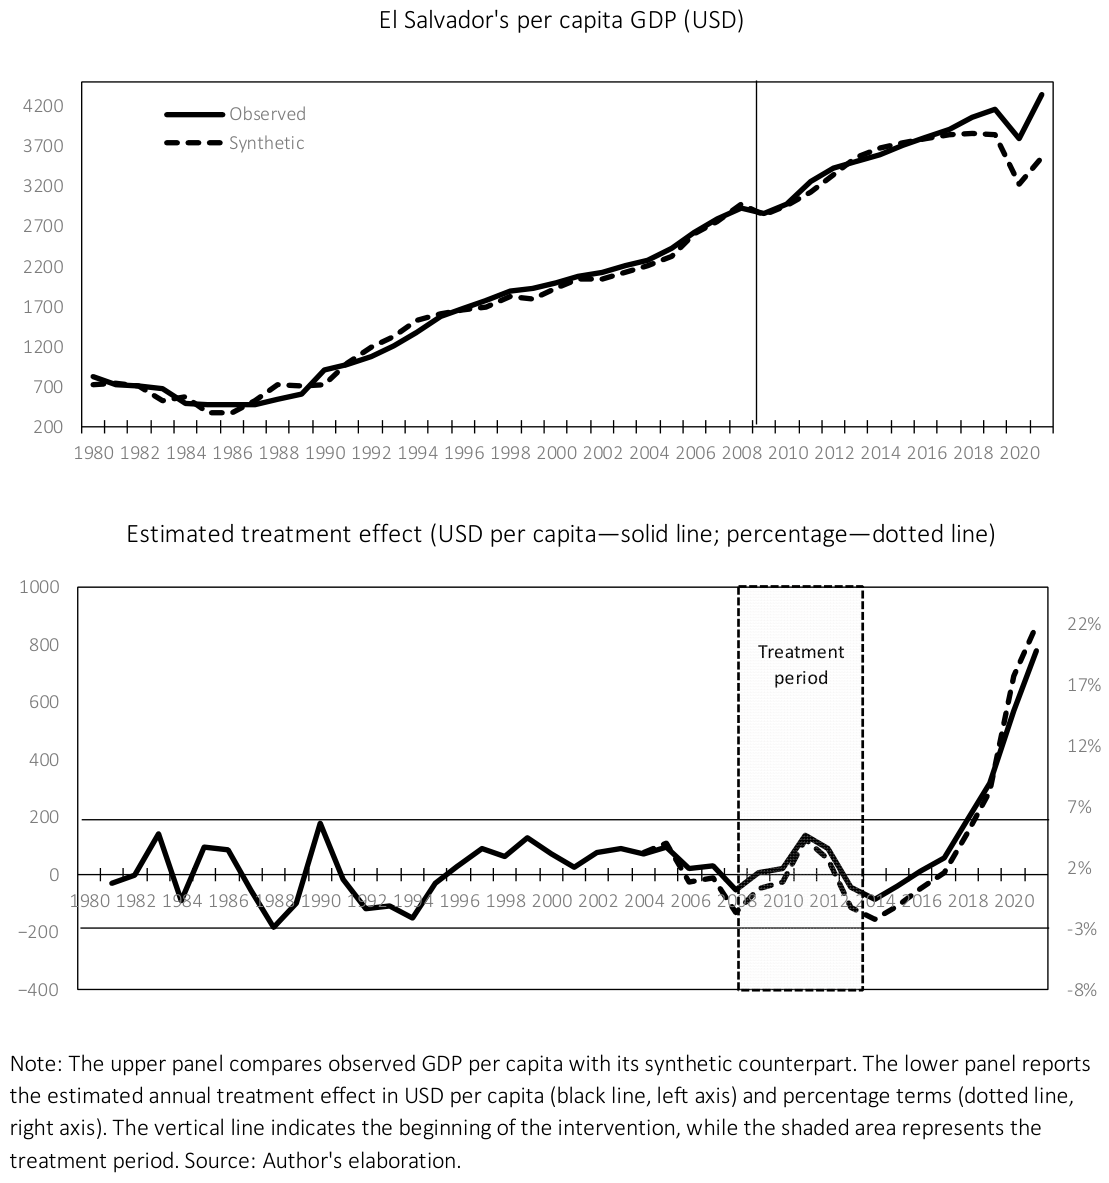
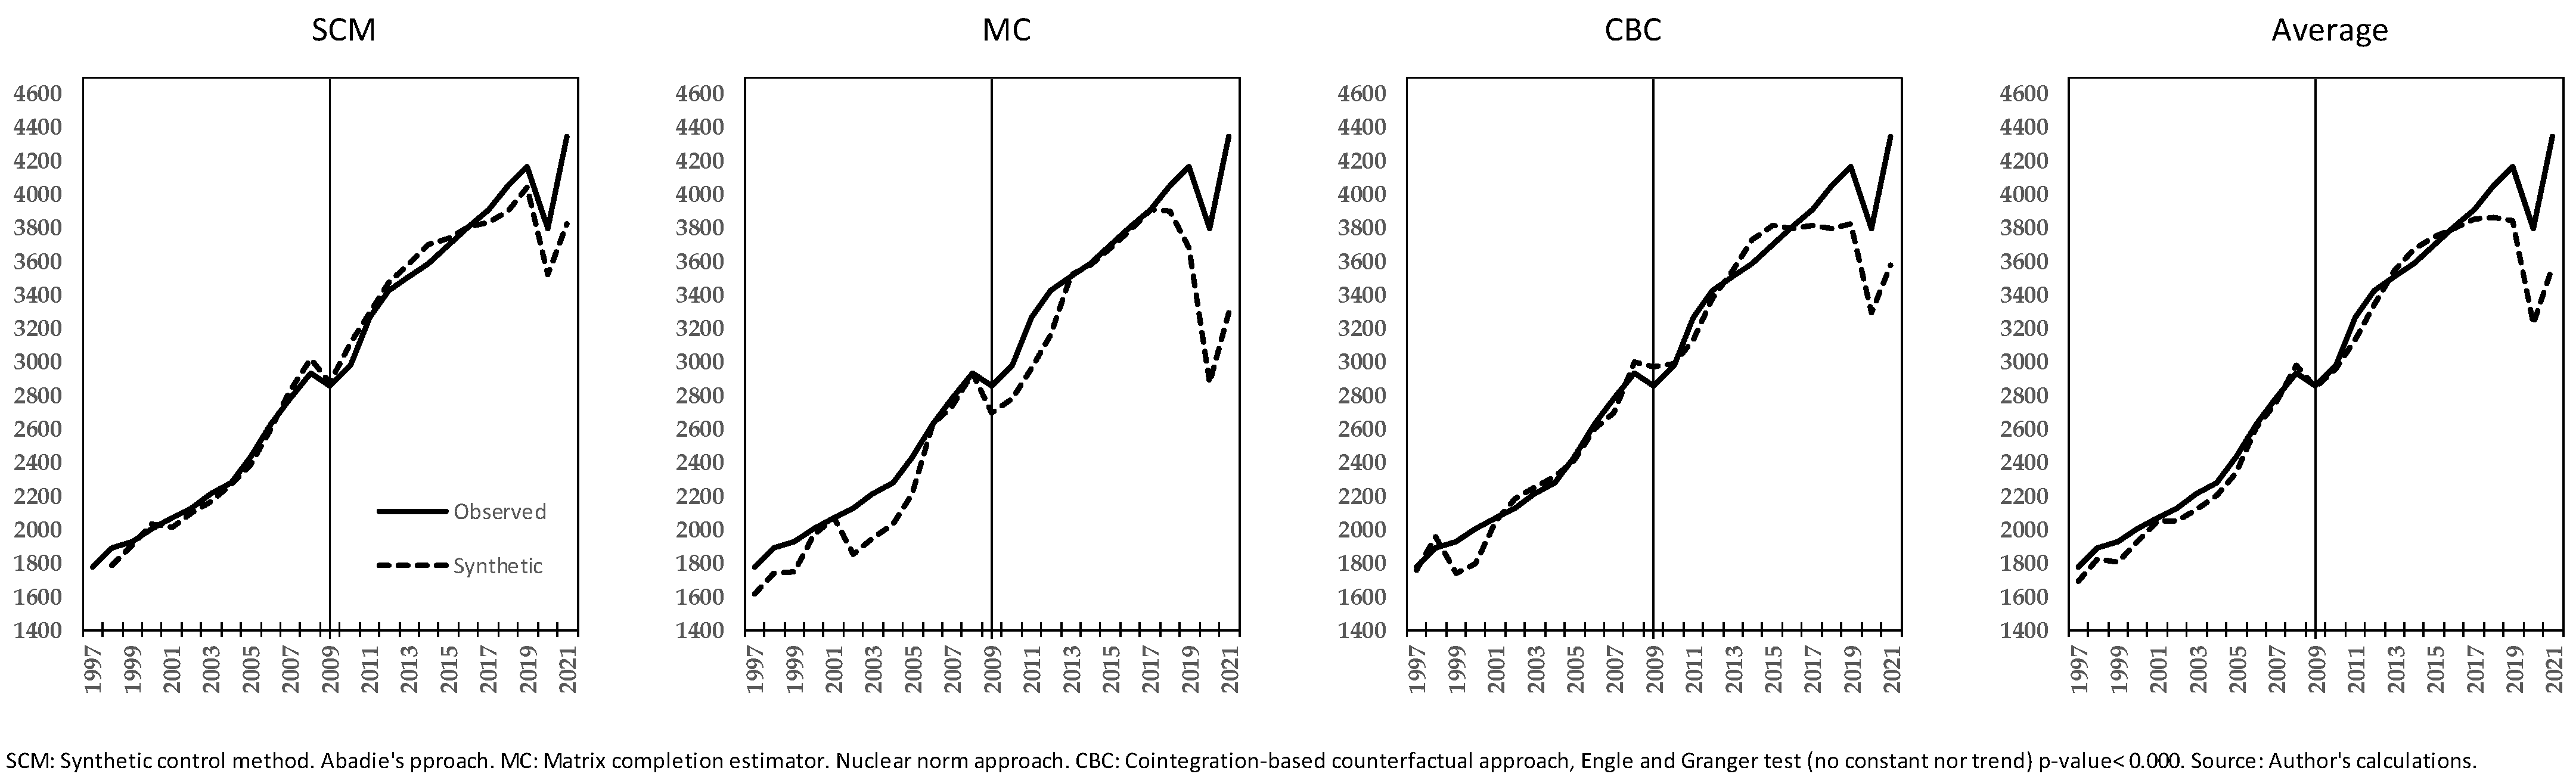
For El Salvador, the favorable longer-run GDP-per-capita trajectory is not confined to the SCM specification (
Figure 5). Although the leave-one-out exercise shows that the SCM estimate is sensitive to removal of its highest-weight donor, both MC and CBC produce treatment gaps with the same favorable direction toward the end of the observation period. The pre-treatment cointegrating relationship underlying CBC is strongly supported by the Engle–Granger test (
p < 0.001), and the composite counterfactual likewise places observed GDP per capita above its estimated untreated trajectory in the later post-intervention period. Thus, the leave-one-out result indicates sensitivity within the SCM specification rather than fragility of the broader cross-method finding. The ES-STU estimate for GDP per capita also points in a favorable direction, although the parallel-trends condition is not supported for this outcome; accordingly, the convergence strengthens the evidence of a favorable longer-run trajectory without providing definitive causal attribution to PBL financing alone.
6.4. Guatemala’s Case
The global financial crisis of 2008 and floods provoked by a heavy rainy season in 2009 obligated Guatemala to seek multilateral aid. The country’s economy suffered a sudden stop in 2009 after having experienced steady growth since 2002. This drop exerted pressure on fiscal accounts and opened a big gap in the deficit, as the already low level of tax revenue experienced in Guatemala rapidly plummeted to the levels of 2006 while expenses were kept at the 2008 level. The fiscal deficit hit a 15-year low point and increased to 3.1% of GDP in 2009, coming from 1.6% of GDP in 2008, which pushed the debt-to-GDP ratio to spike 5 percentage points and reach 24% in 2010 (from 19% of GDP in 2008). Under these circumstances, Guatemala requested multiple interventions from the IMF, the IDB, and the WB in 2009. The IMF approved an SBA for 18 months’ worth of USD 951 million with four scheduled reviews, to support a moderate countercyclical fiscal policy financed largely through external resources, while modernizing monetary policy and establishing a more flexible exchange rate regime (
IMF, 2009f,
2010e). During the same year, Guatemala negotiated a PBL with the IDB whose objectives were to improve fiscal management by raising tax collections through a modernized income tax system, updating customs administration, and increasing transparency in government spending. Guatemala subsequently requested a second PBL, which sought to strengthen fiscal sustainability by increasing revenues (
OVE-IDB, 2012). In 2016, Guatemala requested a third PBL, whose main objective was to improve tax administration and increase tax revenues while implementing measures to prevent money laundering and strengthen transparency in the country’s financial sector (
OVE-IDB, 2016). The WB-supported operations in Guatemala formed part of a broader package combining development policy lending with related technical assistance. Taken together, these operations sought to promote macroeconomic stability and create fiscal space by strengthening tax administration and tax policy, improving public expenditure and budget management, enhancing governance and transparency, supporting the the cash transfer program,
Mi Familia Progresa, and promoting financial sector reform (
Independent Evaluation Group, 2010a,
2010b,
2016).
According to the WB’s ICR documents, two loans were rated as moderately satisfactory and the third one as moderately unsatisfactory (
Independent Evaluation Group, 2009a,
2009b,
2009c). On the IMF side, program implementation remained strong. The third review reported that the quantitative performance criteria had been met and that the economic recovery was strengthening (
IMF, 2010g), while the fourth and final review confirmed that all end-June 2010 quantitative performance criteria were satisfied despite the natural disasters that affected the country that year (
IMF, 2010f). The subsequent ex post evaluation likewise concluded that the SBA had been successful in mitigating the financial crisis (
IMF, 2011d). Regarding the first PBL, the PCR document rated the program as unsatisfactory, mainly because of internal political challenges during loan implementation. Finally, the program satisfaction rates for the second and third PBLs were not available for review.
The program-document comparison in the Annex provides comparisons between a set of macroeconomic outcomes and their actual figures during the multi-intervention period. On one hand, between 2009 and 2011, fiscal revenue exceeded expectations but could not offset the primary expense, which also closely matched expectations; consequently, the primary balance showed a low performance compared to its projection. Interest expense was over the set level, and therefore the overall balance showed moderate performance. Public debt performed very close to expectations, which drew confidence with respect to debt dynamics as it went on track to a sustainable path. Finally, inflation turned out better than expected, especially after 2012. The current account also followed this pattern, which made the country’s external position better by the end of the multi-intervention period.
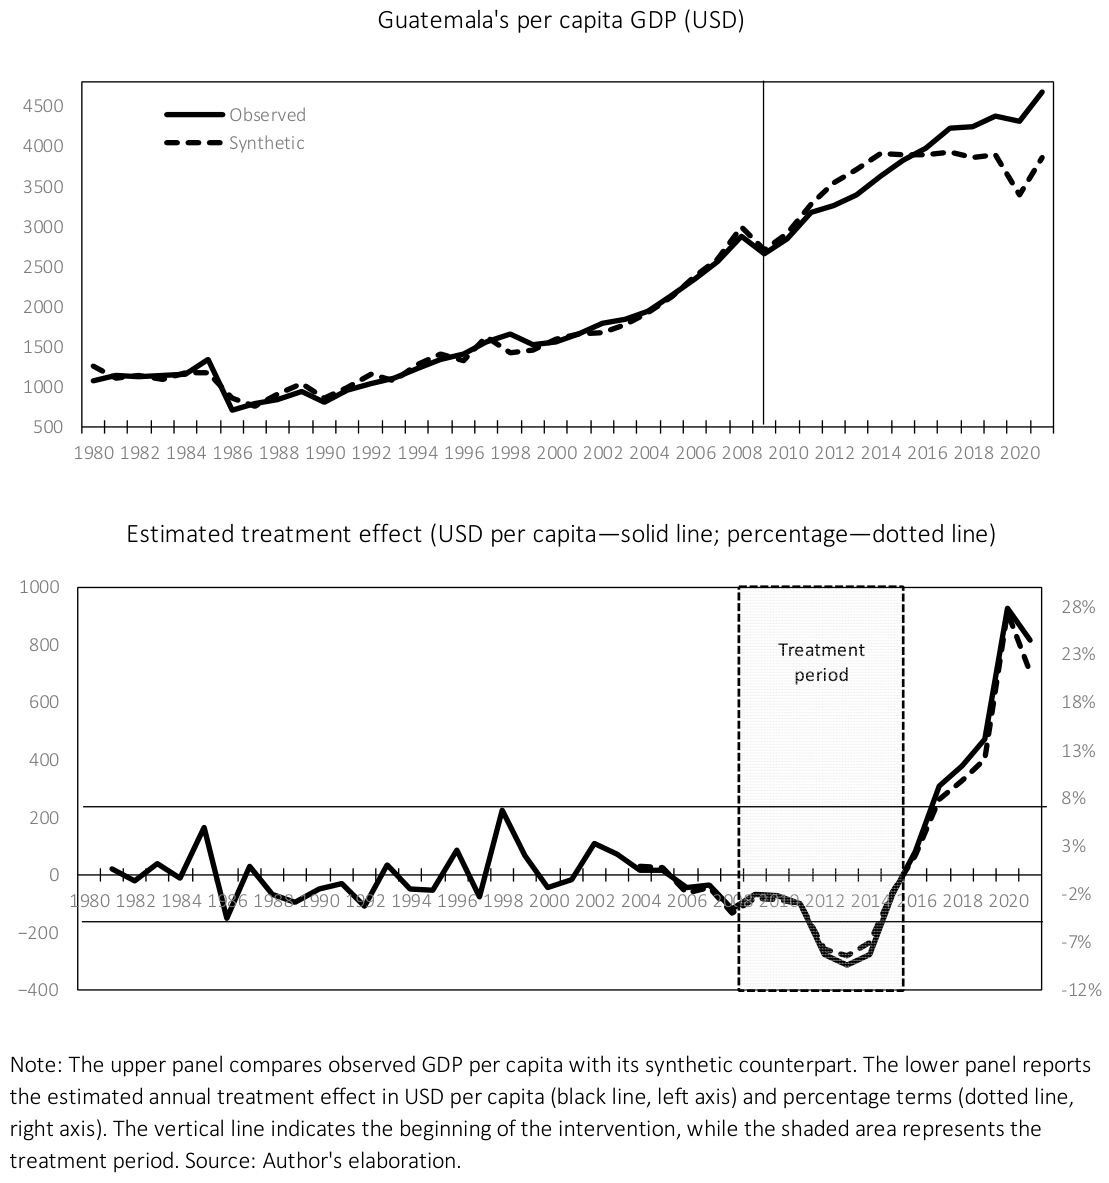
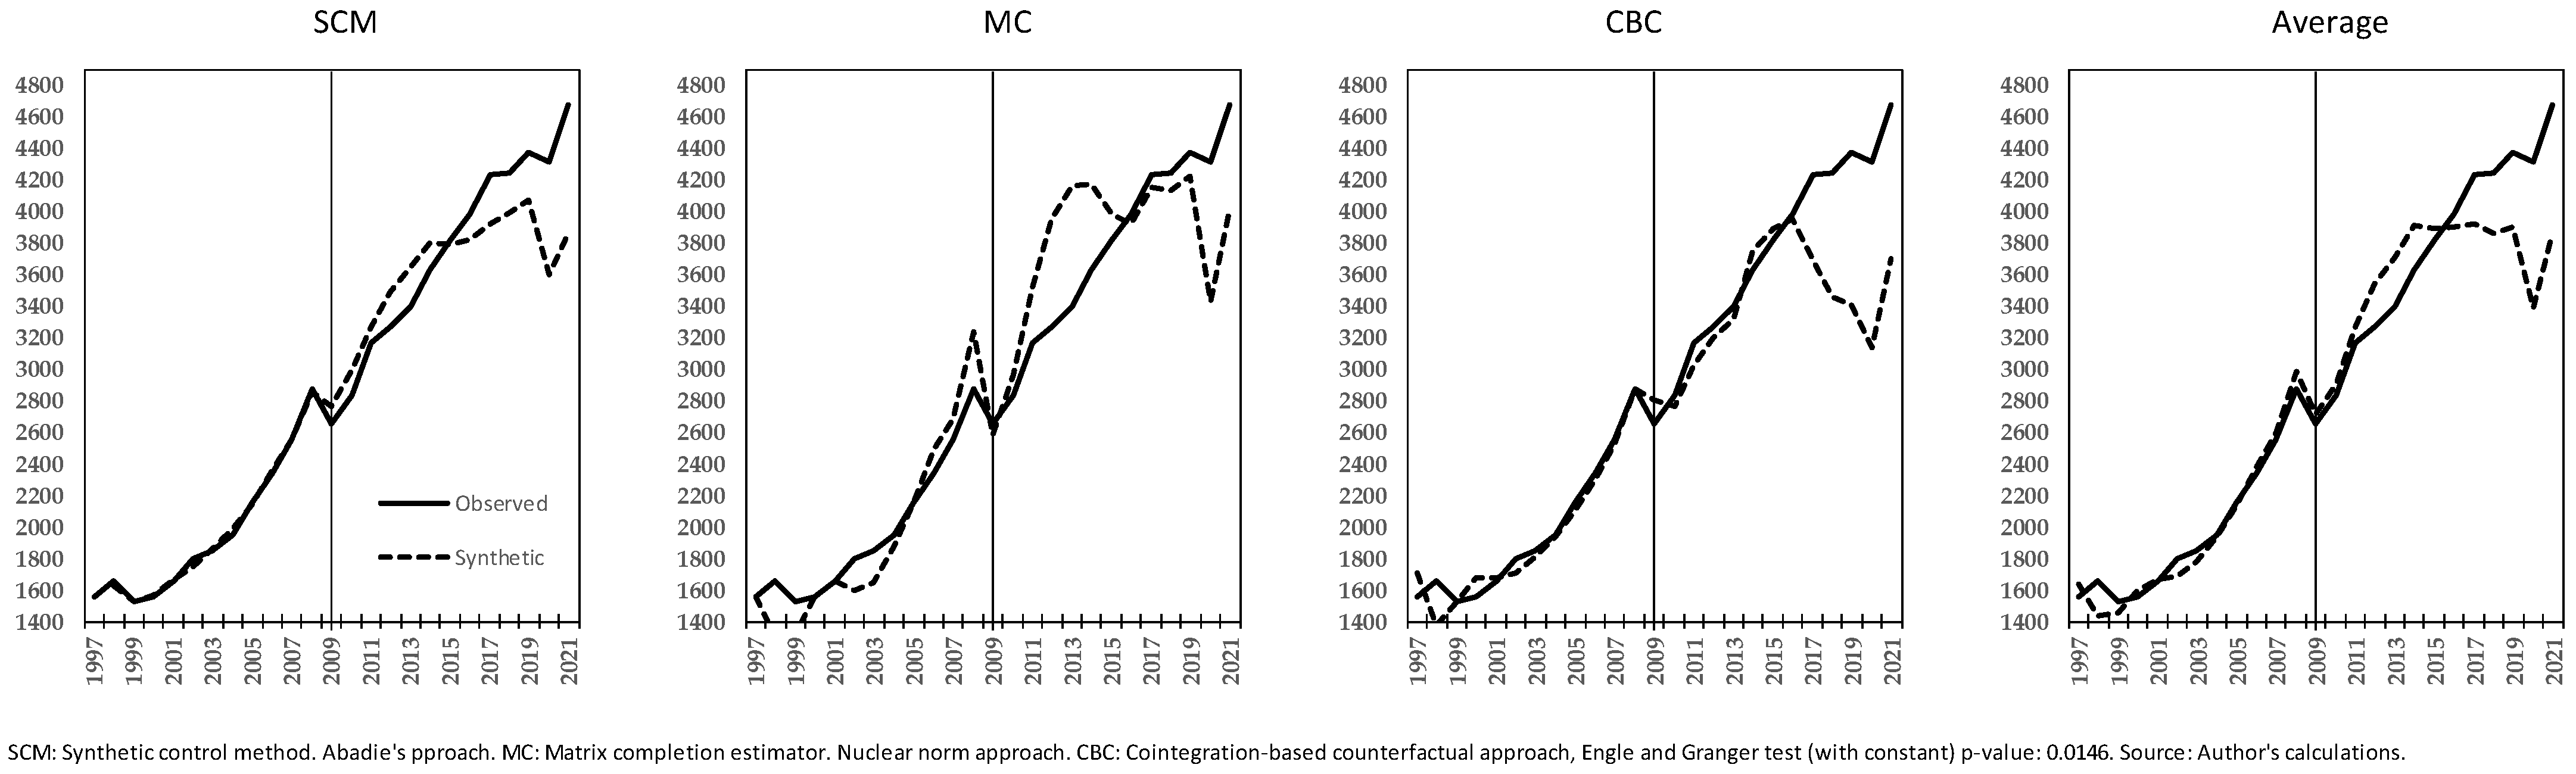
For Guatemala, several outcomes—including GDP per capita, debt-to-GDP, fiscal balances, and the current account—improve relative to the comparison trajectory after the intervention. However, their pre-treatment trends are not sufficiently parallel, so these differences should be read as descriptive rather than causal. The GDP-per-capita result is still informative because it points in the same direction as the synthetic-control estimate. That favorable SCM gap also survives the leave-one-out test, although the pre-intervention fit becomes weaker. Taken together, the two methods suggest a favorable post-program growth trajectory (
Figure 6), but the ES-STU results alone do not support a causal claim. Inflation is the clearest ES-STU finding for Guatemala: the parallel-trends condition is supported, and the post-intervention difference becomes increasingly favorable over time.
For Guatemala, the three counterfactual estimators converge on a favorable GDP-per-capita gap toward the end of the observation period. The timing and magnitude differ across SCM, MC, and CBC—MC is more conservative over part of the post-intervention period—but all three place observed GDP per capita above its estimated untreated trajectory by the end of the sample. CBC is supported by a statistically significant pre-treatment cointegrating relationship (Engle–Granger p = 0.0146), and the composite counterfactual consequently indicates a sizeable positive late post-intervention gap. This convergence is particularly relevant because the ES-STU estimate for GDP per capita also points in a favorable direction, while its pre-treatment trends do not support a causal ES-STU interpretation. The cross-method evidence therefore strengthens the interpretation of a favorable longer-run post-program growth trajectory without eliminating the identification limitations of the ES-STU specification.
6.5. Jamaica’s Case
Jamaica and Guatemala were the only countries in the sample to experience simultaneous interventions by the IMF, IDB, and World Bank following the 2008 global crisis. Jamaica’s intervention was also the longest, extending from 2009 to 2019. The global crisis reached the country at a particularly difficult moment, deepening an already severe balance-of-payments problem. Jamaica had experienced persistent fiscal and external deficits for more than a decade, accompanied by high debt-service costs and signs of unstable debt dynamics. By 2008, the current account deficit had reached 20.3% of GDP and public debt stood at 127% of GDP. Inflation had also returned to levels not observed since the early 1990s. These conditions led Jamaica to seek coordinated support from the IMF, the IDB and the WB. The World Bank’s contribution initially included a sequence of development policy operations addressing debt and fiscal sustainability, followed by support for economic stabilization and the foundations for growth. These operations were embedded within the World Bank’s broader country partnership strategy and combined fiscal adjustment with institutional and financial-sector reforms (
Independent Evaluation Group, 2012b,
2013b,
2014b,
2014c,
2015,
2019). The World Bank subsequently supported the First and Second Competitiveness and Fiscal Management Programmatic Development Policy Loans, which sought to improve the investment climate and competitiveness while sustaining fiscal consolidation and strengthening public financial management (
Independent Evaluation Group, 2020;
World Bank, 2019).
For context, SBA programs can extend for up to 36 months, whereas arrangements under the EFF can last up to four years. Jamaica’s first arrangement, the 2010 SBA, was a 27-month program of USD 1251.8 million, subject to eight reviews between 2010 and 2012 (
IMF, 2010h). Its reforms sought to reduce debt-service costs by limiting short-term maturities, improve tax collection, and rationalize the wage bill of the public sector and public enterprises. The program went off track after its third review amid difficulties in restructuring public debt and consolidating expenditure; public debt continued to rise and reached historically high levels in 2011. In 2012, the authorities tightened fiscal policy and prepared a more comprehensive reform program. This process led to a four-year arrangement under the Extended Fund Facility in 2013 for USD 935.1 million, subject to 15 reviews. After taking office in February 2016, the new authorities ended the EFF following its thirteenth review and replaced it with a 36-month precautionary SBA of USD 1661 million, subject to six reviews. The 2016 program sought to promote growth while strengthening fiscal stability and reducing public debt. Its tax measures aimed to rebalance revenue collection from direct toward more growth-friendly indirect taxation. On the expenditure side, the program sought to reduce the public-sector wage bill, improve efficiency and transparency, and implement a pension reform that increased the retirement age to 65. The monetary-policy component supported Jamaica’s transition toward inflation targeting, which began in 2017 and developed into a full-fledged regime in 2020 (
Inter-American Development Bank [IDB], 2017,
2020).
Our review of IMF documents for Jamaica’s three programs reveals a clear difference between the initial and later phases of the intervention. Although the first review of the 2010 SBA reported that all end–March quantitative performance targets and structural benchmarks had been met (
IMF, 2010i), the arrangement ultimately completed only three of its eight scheduled reviews and went off track after the third review. By contrast, the 2013 EFF completed 13 of 15 reviews, while all six reviews under the 2016 SBA were completed satisfactorily. As IMF staff observed: “
Under two consecutive IMF-supported programs that have spanned the last six and a half years, the Jamaican authorities have demonstrated an exemplary commitment to reforms. Difficult reforms have been implemented—with considerable sacrifices by the Jamaican people—that have institutionalized fiscal discipline and led to a substantial reduction in public debt, which is now on track to meet the legislated target of 60 percent of GDP by March 2026. The financial system is less vulnerable, the unemployment rate is at an all-time low, and international reserves are comfortable” (
IMF, 2019). In addition, the documentary evidence points to successful coordination between the IMF and IDB programs during the later phase of the intervention, particularly in supporting of improvements to Jamaica’s tax system and the broader fiscal reform process (
Inter-American Development Bank, 2018). This coordination may have contributed to the more successful implementation of the later programs.
The changing focus of the operations further illustrates this evolution. Tax reform accounted for 23% of the measures identified under the 2010 SBA and increased to 44% under the 2013 EFF. The 2016 SBA adopted a more diversified policy mixture, combining tax and fiscal measures with a more emphasis on financial reform (
IMF, 2016b). Although expenditure restraint remained part of the adjustment, the later operations relied on a broader and more institutionally coordinated reform framework.
Jamaica nevertheless requires the most cautious interpretation among the five cases. The ES-STU estimates show broad macroeconomic improvement, particularly toward the end of the intervention and by 2021, with favorable differences in fiscal balances, public debt, interest payments, the current account, GDP per capita, and inflation. None of these outcomes, however, satisfies the parallel-trends condition. The ES-STU results should therefore be read as descriptive evidence of improvement during and immediately after the reform process, rather than as causal estimates. The timing of the results suggests a gradual adjustment process associated with a sequence of fPBL-supported reforms, rather than the effect of a single discrete intervention.
The length and complexity of the intervention also limit causal attribution. The evidence is consistent with the possibility that the cumulative reform and financing package contributed to greater fiscal and macroeconomic stability, but the empirical design by itself cannot identify a credible counterfactual that isolates the IMF, IDB, and the WB operations. Domestic reforms, political decisions, institutional changes, and international conditions may also account for part of the observed improvement.
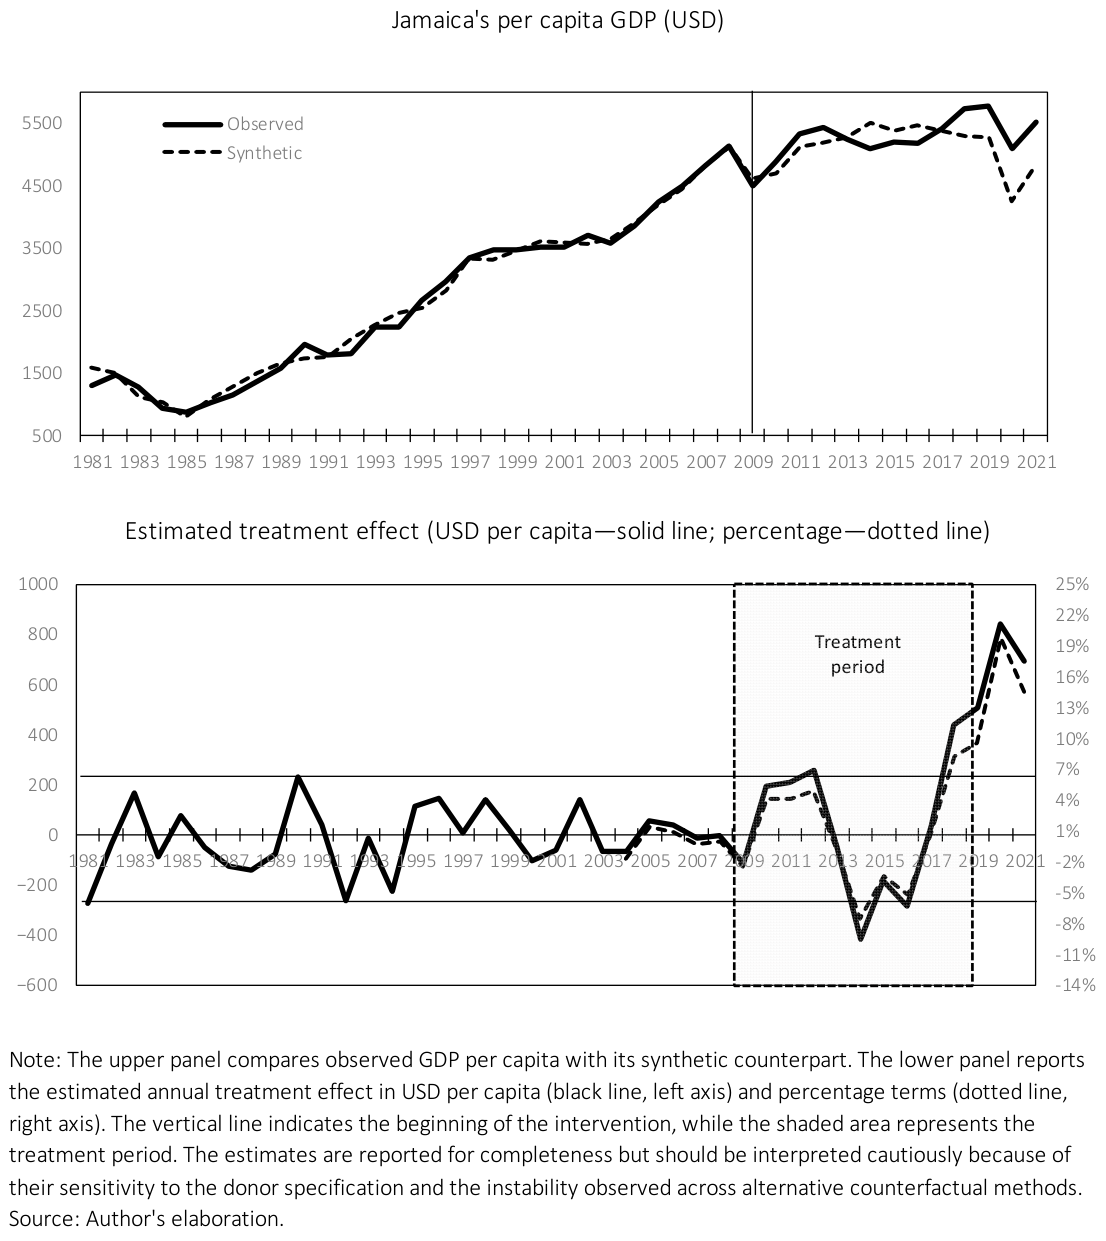
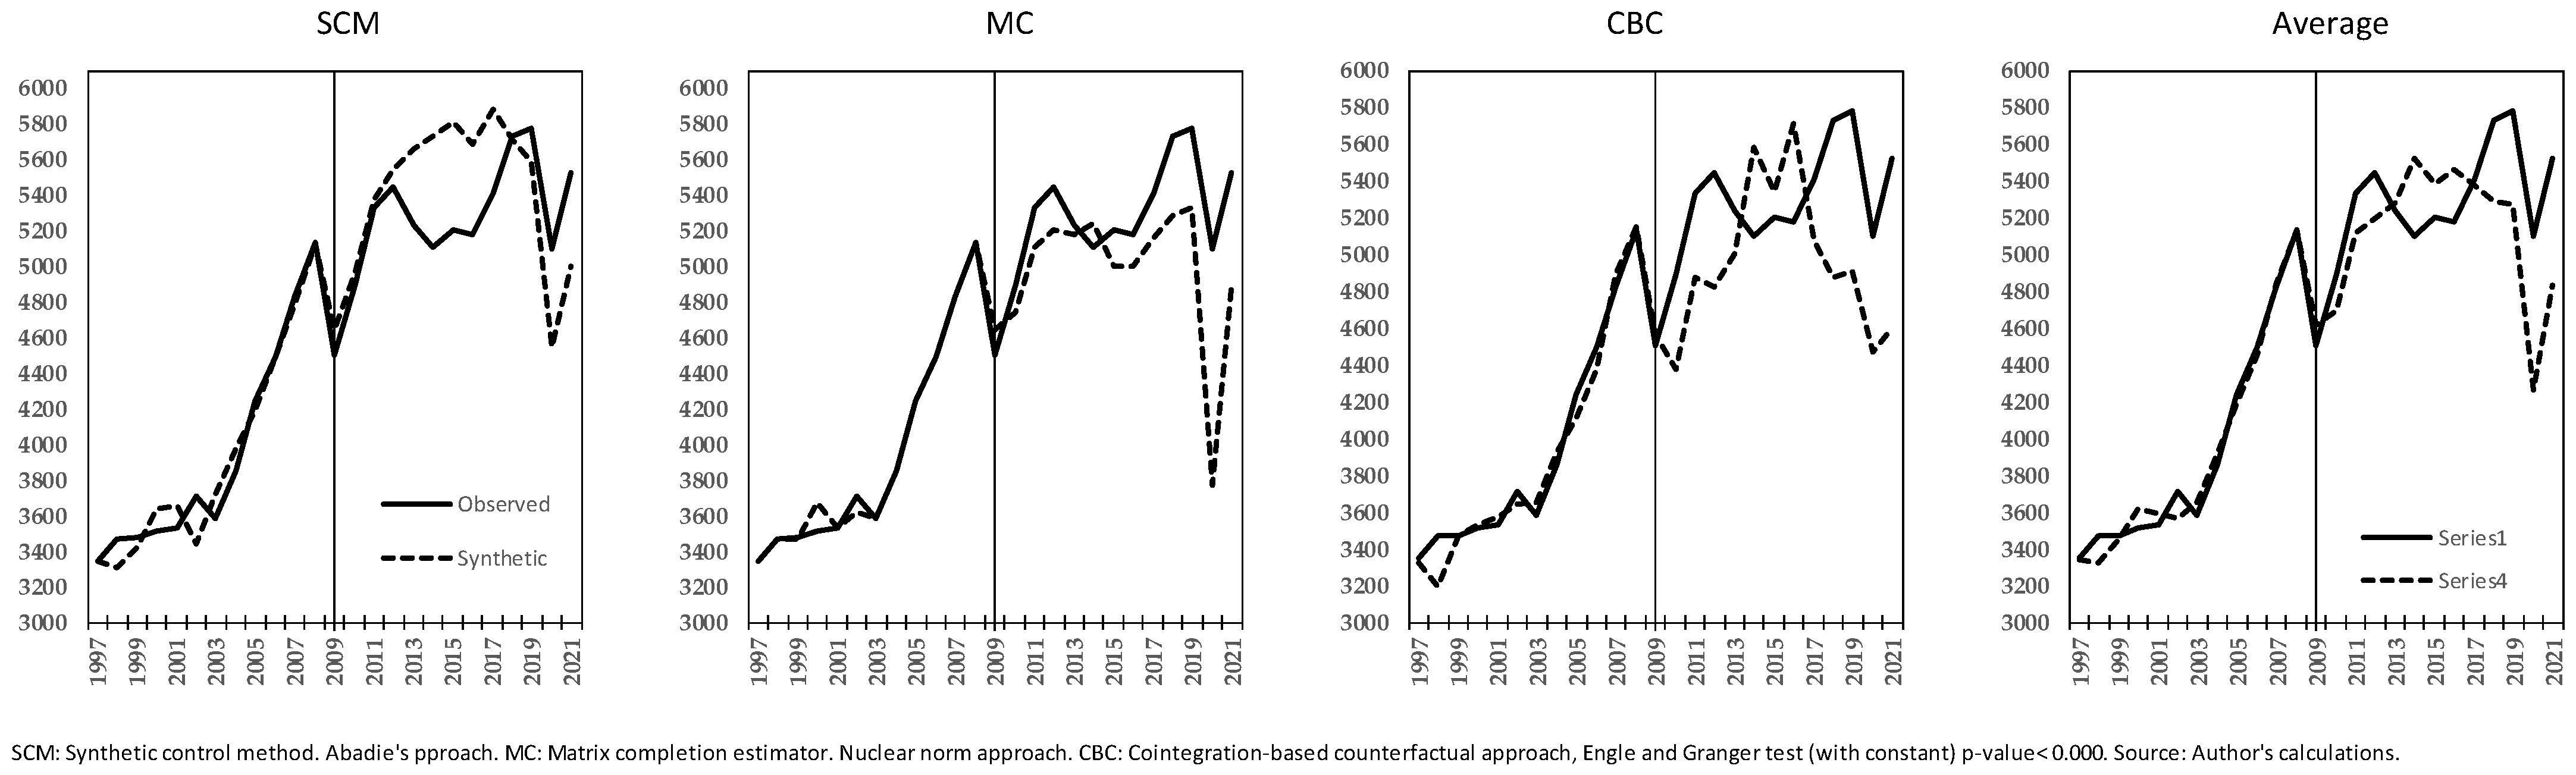
Figure 7 shows the SCM results for Jamaica. The observed and synthetic GDP-per-capita series track each other closely during most of the pre-intervention period, indicating a generally good baseline fit. During the intervention, however, the estimated effect follows a markedly uneven trajectory: it is initially positive, turns negative between approximately 2013 and 2016, and then reverses direction, becoming strongly positive from 2017 onward. This reversal coincides with the more successful implementation of the later programs, closer IMF–IDB coordination, and the consolidation of a broader policy mix encompassing tax, fiscal, and financial reforms. It also coincides with wider improvements in public debt, inflation, fiscal balances, and the external position. Nevertheless, the timing should be interpreted as consistent with a gradual and cumulative reform process, rather than as evidence that any individual program component caused the observed improvement. This baseline SCM pattern is examined further in the robustness and sensitivity analysis, which evaluates its dependence on the donor specification and compares it with estimates from alternative counterfactual methods.
Figure 7 shows the SCM results for Jamaica. The observed and synthetic GDP-per-capita series track each other closely during most of the pre-intervention period, indicating a generally good baseline fit. During the intervention, however, the estimated effect follows a markedly uneven trajectory. It is initially positive, turns negative between approximately 2013 and 2016, and then reverses direction, becoming strongly positive from 2017 onward. This pattern should be viewed in the context of Jamaica’s unusually long and evolving reform process. The initial 2010 SBA went off track after its third review, amid difficulties in restructuring public debt and consolidating expenditure (
IMF, 2011e,
2013b). The subsequent programs were implemented more successfully and involved a gradual reorientation of the reform agenda. In particular, tax reform accounted for 44% of the measures identified under the 2013 EFF, compared with 23% under the initial arrangement, while the 2016 precautionary SBA combined tax and fiscal measures with more emphasis on financial reform. This second phase was also characterized by closer coordination between the IMF and the IDB, particularly in support of tax-system improvements. Although some expenditure-restraint measures remained, the later operations relied on a broader and more institutionally coordinated policy mix. The positive GDP-per-capita gap emerging from 2017 therefore coincides with the consolidation of these reforms and with wider improvements in debt, inflation, fiscal balances, and the external position. However, the timing should be interpreted as consistent with a gradual and cumulative reform process, rather than as evidence that any single program component caused the observed reversal. We examine further the baseline SCM pattern in the following section, which evaluates its dependence on the donor specification and compares it with estimates from alternative counterfactual methods.
6.6. Robustness and Sensitivity Analysis
In this section, we examine whether the main findings depend on the composition of the SCM donor pool, the influence of individual high-weight donors, or the choice of counterfactual estimator. We first compare pre-intervention fit across alternative donor-pool specifications and then conduct leave-one-out re-estimations that exclude the highest-weight donor for each treated country. These checks are complemented by the MC and CBC estimates discussed above, allowing us to distinguish results that are relatively stable across specifications from those that remain sensitive to counterfactual construction.
Table 3 reports the pre-intervention fit obtained under the Mixed/global, LAC-only, and non-LAC donor-pool specifications.
Overall, we use the mixed global donor pool as our baseline, as restricting the donor pool by region preserves the main findings but worsens the pre-intervention fit in four of the five cases (
Table 3). Geographic proximity alone therefore does not always identify the most credible counterfactual, suggesting that a broader donor pool can provide a better pre-treatment match. Besides the LAC-only and non-LAC specifications robustness checks we implement a leave-one-out sensitivity analysis to examine the donor composition.
By performing this donor sensitivity test, we excluded the highest-weight donor from each baseline synthetic control and re-estimated the model. We assess this sensitivity jointly from the change in pre-intervention loss and the stability of the post-program effect (
Table 4). The results reveal heterogeneous donor dependence. For the Dominican Republic, exclusion of the leading donor raises the loss from 243.64 to 331.89 (+36.2%) but preserves the positive post-program direction, although the magnitude increases substantially. Costa Rica and Guatemala also preserve the direction and general trajectory of their baseline effects despite poorer pre-intervention fit. El Salvador is more donor-dependent: its loss rises from 52.15 to 187.14, and its post-treatment trajectory changes considerably. Jamaica shows similar sensitivity: its loss rises from 117.59 to 241.63, and the post-program gap reverses sign. In both sensitive cases—El Salvador and Jamaica—the OUT specification fits the pre-treatment path less well and should therefore not be treated as an equally credible counterfactual.
Table 5 summarizes the robustness evidence across SCM, MC, and CBC and complements the leave-one-out exercise reported above. Whereas the leave-one-out analysis examines sensitivity to donor composition within SCM, the cross-method comparison assesses whether the longer-run direction persists under alternative counterfactual constructions. This distinction is particularly informative for El Salvador and Jamaica. El Salvador is sensitive to the exclusion of its highest-weight SCM donor, but MC and CBC preserve its favorable longer-run direction; its donor sensitivity within SCM therefore does not, by itself, undermine the broader cross-method finding for this country. Jamaica differs more fundamentally: it is sensitive to donor exclusion within SCM and displays greater dispersion across the alternative estimators. This persistent identification uncertainty may partly reflect Jamaica’s long 2009–2019 program period, which increases the likelihood that unobserved time-varying shocks, concurrent domestic reforms, and political changes overlap with the treatment exposure. The extended period also creates greater scope for political resistance, incomplete implementation, and changes in treatment intensity, all of which may weaken the stability of the counterfactual relationship, which complicates any causal attribution. Moreover, these identification concerns are consistent with the lack of support for the parallel-trends assumption in the ES-STU estimates for other macroeconomic outcomes in Jamaica.
Considered jointly, the cross-method results show substantial longer-run directional convergence for Costa Rica, the Dominican Republic, El Salvador, and Guatemala, despite differences in the timing and magnitude of the estimates. This convergence suggests that the favorable GDP per capita pattern in these four cases is not driven by a single counterfactual construction. Jamaica remains the principal exception and is therefore treated as the case with the greatest counterfactual uncertainty.
6.7. Cross-Country Discussion
Broadly speaking, the ES-STU results point most consistently to improvements in inflation and, in some cases, fiscal balances. Inflation shows favorable post-intervention effects with sufficiently comparable pre-treatment trends in Costa Rica, the Dominican Republic, El Salvador, and Guatemala. The fiscal-balance evidence is also relatively strong for Costa Rica and for El Salvador’s primary balance. Where the pre-treatment evidence supports the parallel-trends assumption (PTA), these findings lend support to a causal interpretation; otherwise, we treat the estimates as descriptive counterfactual differences. This distinction is particularly important for Guatemala, where several fiscal indicators do not provide sufficient pre-treatment support for the PTA and therefore cannot be interpreted causally. GDP per capita, debt-to-GDP, and the current account also move favorably in several cases, but the ES-STU pre-treatment evidence for these outcomes is less convincing. Overall, this pattern is compatible with a stabilization channel, although the analysis does not isolate the specific mechanisms through which inflation or fiscal outcomes improved. Detailed country-level ES-STU estimates and parallel-trends assessments are reported in
Appendix A Table A1,
Table A2,
Table A3,
Table A4 and
Table A5.
Table 6 summarizes the GDP per capita estimates over the full evaluation window and separately during and after the programs. Across the five treated economies, the average effect is 4.7% for the full period, 0.6% during program exposure, and 11.0% after program completion
1. For comparison, the five-year pre-treatment estimate is 0.7%, while the placebo estimate is 0.8%. Both are considerably smaller than the post-program estimate, suggesting that the favorable pattern is concentrated in the period following program completion rather than appearing throughout the evaluation window. These checks strengthen confidence in the counterfactual results, although they do not resolve the broader concerns related to treatment selection, donor composition, institutional differences, and concurrent reforms.
Because the programs ended at different times,
Table 7 places the post-program estimates on a common timeline at +1, +2, +3, and +5 years after completion. Each country is included only when an observation is available for the corresponding horizon. The average effect increases from 6.5% at +1 year to 9.1% at +2 and +3 years and 17.1% at +5 years. All five countries contribute to the +1 and +2 estimates, while four contribute at +3 and +5 because Jamaica’s program ended in 2019 and the sample ends in 2021. The results therefore preserve the favorable average post-program pattern without filling in unavailable observations. At the same time, they reveal meaningful differences across countries: El Salvador is slightly negative at +1 and +2, approximately neutral at +3, and positive at +5.
The country cases highlight the importance of political economy and implementation capacity in translating fPBL-supported reforms into macroeconomic outcomes. By combining financing with policy commitments and institutional support, fPBL operations may ease some of the financial and administrative constraints that make structural reforms difficult to implement. Their influence, however, is not uniformly enabling, and the implementation process can follow two different paths. When program conditions align with domestic priorities and are supported by sufficient country ownership, they may facilitate the adoption and continuity of reforms. Conversely, when they are perceived as externally imposed or conflict with the government’s ideological orientation, political incentives, or distributional objectives, they may generate resistance, delay implementation, alter the original design of the operations, or even lead to the reversal of reforms. The experiences of El Salvador and Jamaica illustrate how political and institutional conditions can reshape—or, in some circumstances, derail—the implementation process.
Against this political-economy background, one possible mechanism behind the observed results operates through the reforms supported by fPBLs. The specific channels differed across countries. In Costa Rica, the programs focused primarily on strengthening financial and monetary institutions, potentially supporting macroeconomic stability through greater financial resilience and policy credibility. In the other cases, tax and fiscal consolidation measures sought to strengthen revenue mobilization, expenditure management, and debt sustainability, thereby creating fiscal space and reducing macroeconomic vulnerabilities. Although their emphasis varied, these interventions shared a potential pathway: where reforms were domestically supported, effectively implemented, and sustained, they could strengthen domestic policy frameworks and improve macroeconomic performance over time.
Finally, our findings should be interpreted in light of several limitations. Participation in fPBL programs is shaped by strong selection mechanisms: governments self-select into these programs based on their financing needs, reform willingness, and economic circumstances, while multilateral institutions determine eligibility and approval. These factors may also influence subsequent macroeconomic performance, creating potential selection bias. Institutional differences may further affect implementation, while overlapping domestic reforms and multilateral programs prevent us from isolating the effects of particular loans or reforms. Each estimator also relies on assumptions that cannot be fully verified using the available data. Pre-treatment fit, sensitivity analyses, and cointegration tests provide partial diagnostic evidence, but they do not establish that the identifying conditions hold after the intervention. Cross-method agreement reduces dependence on any single counterfactual specification but should not be interpreted as validation of the assumptions underlying SCM, MC, or CBC. Differences in post-program coverage prevent the pooled estimates from being interpreted as uniform event-time effects, while the five-country sample limits the external validity of the findings.
These considerations define the scope of our contribution. We do not claim that fPBLs mechanically generate growth or resilience. Rather, the findings suggest that financing, policy commitments, institutional support, and domestic implementation may jointly shape macroeconomic trajectories, with effects varying across countries and over time. The evidence is strongest where the identifying assumptions are plausible; otherwise, the results remain descriptive. Future research could employ larger samples, more granular event-time estimates, broader donor-level sensitivity analyses, and designs that separate the effects of financing from those of specific reforms.
7. Conclusions
This study examined the macroeconomic effects of fiscal policy-based loans (fPBLs) in Costa Rica, the Dominican Republic, El Salvador, Guatemala, and Jamaica following the 2008 global downturn. Despite the heterogeneity across operations, reflected in differences in program duration, institutional configuration, and policy focus, a common pattern emerges from our study: all five economies exposed to fPBLs showed improved macroeconomic performance following the treatment period. For Costa Rica, the Dominican Republic, El Salvador, and Guatemala, we found that GDP per capita reached higher levels over the longer run than those projected by the counterfactual estimates. The favorable direction of this result was generally preserved across alternative quasi-experimental methods, although the magnitude and timing of the estimates varied. Jamaica also experienced substantial macroeconomic improvements, but its longer intervention period and instability across counterfactual specifications require a more cautious interpretation under our design.
The processes underlying these favorable outcomes are likely to vary across countries. The effectiveness of an fPBL depends not only on the financial resources provided but also on the credibility of policy commitments, the quality of technical assistance, the transfer of knowledge and international best practices, and the capacity of domestic institutions to implement reforms. Our findings may therefore reflect the mutually reinforcing contribution of these factors, including effective cooperation between multilateral institutions and national authorities and, when programs overlap, coordination among multilateral institutions, as occurred in Jamaica. Political commitment, domestic ownership, implementation capacity, and institutional coordination are likely to determine how this process unfolds. Although the study cannot identify the precise mechanism connecting these factors to the observed outcomes, the results are consistent with benefits accumulating as reforms are implemented, consolidated, and gradually embedded in national institutions.
The ES-STU results provide some indication of the macroeconomic channels that may underlie the observed growth pattern. Where the parallel-trends condition is reasonably supported, the estimates point to improved inflation performance and stronger fiscal outcomes, including the overall and primary fiscal balances. These results are consistent with a stabilization channel through which stronger fiscal frameworks, greater price stability, and improved macroeconomic management create more favorable conditions for economic activity and growth. Nevertheless, this channel should be understood as a plausible interpretation of the evidence rather than as a formally identified causal mediation mechanism.
The longer-run results are also consistent with greater macroeconomic resilience. During the COVID-19 shock, the treated economies generally performed more favorably than their estimated synthetic counterfactuals, which deteriorated sharply during the same period. Institutional and macroeconomic gains accumulated over the treatment period may have strengthened their macroeconomic position and capacity to withstand the shock. Nevertheless, these estimates do not prove that the effects of the pandemic would necessarily have been worse without the fPBLs. COVID-19 represented a major structural break for all economies, and the counterfactual trajectories during this period extend beyond the conditions observed in the pre-treatment data.
Program duration affects the credibility of causal attribution. Shorter treatment periods provide a narrower window for observed and unobserved confounding factors—such as unrelated macroeconomic shocks, concurrent policy changes, and overlapping reforms—to influence the outcomes, whereas such influences are more likely to accumulate during longer episodes. The quasi-experimental design also faces selection challenges at both program entry and implementation. Countries do not participate in fPBLs randomly, and political resistance, weak government commitment, or insufficient coordination among domestic institutions can delay, weaken, or derail an operation. This creates an attrition-like implementation process in which countries that successfully implement the supported reforms may differ systematically from those whose operations fail to progress. These features limit the external validity of the study, and the five cases examined here should therefore not be regarded as representative of the universe of fPBL operations. Because the cases were purposively selected from programs initiated in response to the 2008 global crisis, the findings are most directly applicable to comparable fPBL-supported reform episodes rather than automatically generalizable to operations undertaken in different countries, periods, or institutional settings.
Jamaica illustrates both the value and the limitations of our evidence. Its prolonged exposure to fPBLs and overlapping programs, together with weaker support for the parallel-trends assumption and greater sensitivity across alternative counterfactual specifications, prevent a strong causal attribution to any particular operation. Nevertheless, the descriptive evidence points to broad and substantial improvements across Jamaica’s macroeconomic outcomes during the treatment period and in the years that followed. The Jamaican experience can therefore be regarded as a significant macroeconomic transformation, while remaining a boundary case for causal interpretation under our design.
Overall, the findings do not imply that fPBLs automatically generate growth or resilience. Rather, they suggest that financing, policy commitments, institutional support, technical cooperation, and domestic implementation may jointly influence macroeconomic trajectories, with effects that vary across countries and unfold over time. The evidence is most persuasive when the identifying assumptions are reasonably supported; otherwise, the observed patterns remain informative but descriptive. Future research could examine larger samples and other regions that include both completed and derailed operations, use more granular event-time estimates, extend donor-pool and counterfactual sensitivity analyses, and develop designs capable of separating the effects of financing from those of specific reforms, technical assistance, and institutional change.