1. Introduction
Sustainability challenges have expanded accounting beyond financial transaction recording towards the measurement and communication of resource allocation, environmental impacts and long-term public value. Environmental expenditure reporting is therefore relevant to sustainability accounting, public financial management and accountability because it translates environmental objectives into monetary information that can be traced, compared and scrutinised (
Bebbington & Larrinaga, 2014;
Burritt & Schaltegger, 2010;
Gray, 1992;
Larrinaga, 2014).
Environmental spending has also become relevant to fiscal management because governments must finance environmental protection while maintaining budgetary discipline. Expenditure patterns may indicate areas requiring closer examination of infrastructure needs or institutional responsibilities, but they do not directly measure fiscal, climate or environmental risk. Such assessment requires additional evidence on liabilities, asset condition, regulatory obligations and outcomes.
Within the European Union, the Green Deal, climate-neutrality objectives and sustainable-finance reforms have increased demand for reliable information on public environmental commitments. Environmental expenditure also intersects with green budgeting and climate-sensitive public financial management, which integrate environmental considerations across budget preparation, execution, accounting, reporting, oversight and audit. Because institutional boundaries, budget classifications and service-delivery arrangements differ across countries, harmonised accounting information is necessary before cross-country differences can be interpreted (
Battersby et al., 2022;
European Commission, 2019;
OECD, 2024).
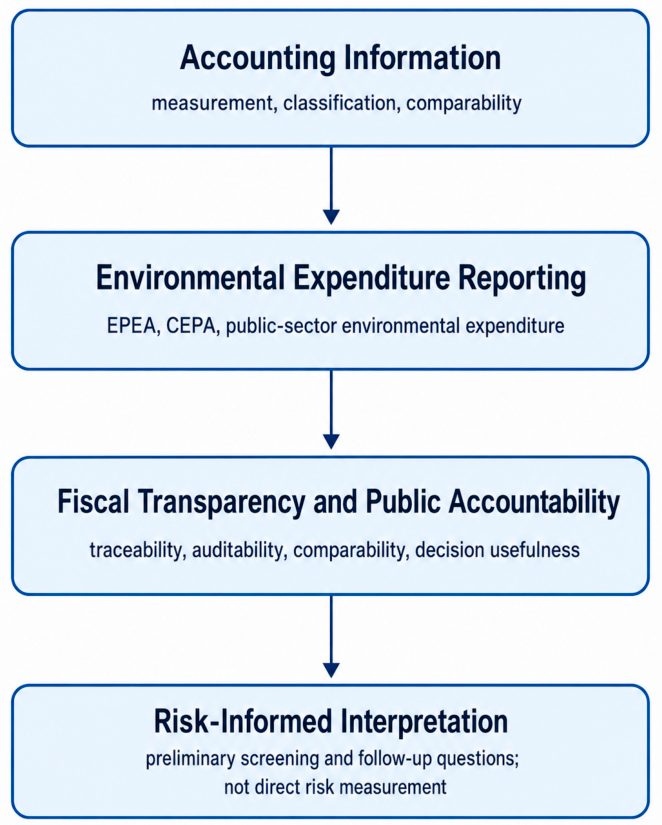
This paper treats accounting information as the link between environmental policy commitments and transparent public financial reporting. Decision usefulness depends not only on the amount spent, but also on who incurs the expenditure, for what purpose and within which accounting boundary (
Heald, 2003;
Steccolini, 2019).
EPEAs provide the harmonised accounting basis for this analysis by linking monetary values to institutional sectors and environmental purposes. CEPA adds a functional classification covering wastewater, waste, air and climate, biodiversity, soil and water protection and related activities. Together, these frameworks make it possible to compare expenditure intensity and allocation without equating spending with environmental performance (
Eurostat, 2017).
Public-sector sustainability accounting remains uneven across Europe. Comparative studies and recent reviews identify variation in adoption, disclosure scope, organisational capacity and the practical use of sustainability information by public organisations and local governments (
Domingues et al., 2017;
Greiling et al., 2015;
Mol et al., 2025;
Niemann & Hoppe, 2018). OECD guidance similarly warns that additional reporting does not automatically improve transparency unless information is integrated with existing budget and decision processes (
OECD, 2025). These findings strengthen the case for using harmonised environmental-economic accounts as a common comparative basis.
Accordingly, this study uses official Eurostat data to compare public-sector environmental protection expenditure across EU Member States. It examines expenditure per capita, EU-level expenditure relative to GDP, institutional-sector shares and CEPA composition through a descriptive design that avoids causal or inferential claims.
The study addresses three questions: how public-sector expenditure intensity differs across Member States; how EU environmental expenditure is distributed across CEPA domains; and what descriptive patterns emerge when harmonised expenditure indicators are compared transparently.
The paper contributes by extending sustainability accounting to public-sector environmental expenditure, providing explicit country-level evidence, documenting a workflow that reproduces the reported descriptive results from processed EPEA observations, and clarifying the limited role of expenditure information in preliminary sustainability risk screening. Its contribution is informational: the indicators support transparency and follow-up analysis but do not diagnose performance, resilience or fiscal exposure.
The main findings show that nominal EU environmental protection expenditure increased by 17.5% between 2018 and 2022, while its share of GDP remained close to 1.9%. Public-sector expenditure per capita varied substantially across the 27 Member States, with a median of EUR 314 and a coefficient of variation of 72.8%, while wastewater and waste management accounted for 69.7% of EU environmental protection investment. These findings indicate that harmonised EPEA information enhances comparability, auditability and fiscal transparency; however, expenditure levels should be interpreted as contextual accounting information rather than as direct measures of environmental performance, fiscal exposure or sustainability risk.
Table 1 links the research questions to the indicators and intended contribution.
The analytical framework therefore combines country comparison, functional classification and cautious interpretation within the boundaries of EPEAs.
3. Data and Methodology
3.1. Research Design
This study applies a descriptive comparative research design to examine how accounting information on environmental protection expenditure can support fiscal transparency and the cautious interpretation of sustainability-related public-finance issues. The empirical analysis is based on harmonised official statistical data for EU Member States and focuses on the public-sector component of environmental protection expenditure. No inferential econometric model or statistically validated country-classification model forms part of the final empirical design. Differences in expenditure are interpreted descriptively because they may reflect policy priorities, institutional arrangements, public–private service-delivery models, accounting boundaries and data-compilation practices.
The methodological approach is structured around three analytical stages. First, harmonised environmental expenditure data are collected from Eurostat Environmental Protection Expenditure Accounts. Second, comparable indicators are constructed by scaling expenditure by population and GDP and by calculating the public-sector share in total environmental protection expenditure. Third, the results are examined through descriptive cross-country comparison and CEPA-based functional analysis. This design aligns the analytical claims with the evidence that is fully reported in the study.
This design is appropriate because environmental expenditure reporting requires both accounting comparability and contextual interpretation. The study does not treat environmental protection expenditure as a direct measure of environmental performance or fiscal risk. Instead, it uses the information as descriptive accounting evidence on resource allocation and institutional responsibility and as an input for identifying issues that may warrant subsequent fiscal-risk assessment.
3.2. Data Sources and Coverage
The empirical analysis relies on publicly available official data from Eurostat. The statistical extracts used in the revised manuscript were downloaded on 31 May 2026. The main source is the dataset National expenditure on environmental protection by institutional sector (env_ac_epneis1), which provides information on national environmental protection expenditure by sector. This dataset is used to identify the public-sector component of environmental protection expenditure, with particular attention to the general government and non-profit institutions serving households sector grouping. The dataset is appropriate for the purposes of the study because it provides harmonised information on environmental protection expenditure across EU Member States. The use of this dataset is therefore directly linked to the official Eurostat EPEA dissemination framework (
Eurostat, n.d.-f).
The conceptual basis for the data is provided by the Environmental Protection Expenditure Accounts Handbook, which defines the scope, concepts, classifications and reporting logic of EPEAs (
Eurostat, 2017;
Eurostat, n.d.-a). EPEA are part of the European environmental-economic accounts and are aligned with national accounts principles. Regulation (EU) No 691/2011 establishes the common framework for the collection, compilation, transmission and evaluation of European environmental economic accounts, including environmental protection expenditure accounts (
European Parliament and Council of the European Union, 2021). This legal and methodological framework increases the comparability of the data and supports their use for cross-country public-sector analysis. Subsequent amendments also support the continued development of the environmental-economic accounts framework (
European Commission, 2022).
In addition to EPEA data, the study uses macroeconomic and demographic indicators for scaling and interpretation. GDP data are obtained from Eurostat’s Gross domestic product and main components dataset (nama_10_gdp), while population data are obtained from Eurostat’s Population on 1 January by age and sex dataset (demo_pjan). These datasets allow environmental protection expenditure to be transformed into indicators that are comparable across countries with different economic sizes and population structures. These two datasets provide the macroeconomic and demographic denominators used for scaling the expenditure indicators (
Eurostat, n.d.-d,
n.d.-g).
Where available, the analysis also uses Eurostat data on environmental protection investments by environmental activity, including env_ac_epigg1 and env_ac_epite1. These data support the functional interpretation of environmental protection investment across CEPA domains (
Eurostat, n.d.-b,
n.d.-c,
n.d.-e). The final reported evidence is organised into four clearly delimited extracts: (i) an EU aggregate annual series for 2018–2022, comprising five year observations; (ii) a 2022 cross-section of all 27 EU Member States for public-sector environmental protection expenditure per capita, comprising 27 country observations and no country exclusions; (iii) the 2022 EU aggregate distribution across three institutional-sector groupings; and (iv) the 2022 EU aggregate CEPA composition, reported in seven category groups. The EU aggregate is used as a contextual benchmark and is not counted as an additional country observation. No balanced multi-year country panel is estimated or reported in the final study.
Table 2 summarises the main datasets used in the empirical analysis, their analytical role and the indicators derived from them. The table is included to improve methodological transparency and to clarify how official environmental-economic accounts are transformed into comparable accounting-based indicators for public-sector sustainability analysis.
As shown in
Table 2, the empirical analysis combines environmental expenditure accounts with macroeconomic and demographic indicators. This allows environmental expenditure to be interpreted not only as an absolute monetary value, but also as a scaled and comparable indicator of public-sector fiscal commitment. The inclusion of CEPA-based investment data further supports the analysis of functional allocation across environmental domains. The stated extraction date, reference periods, observation units and sample counts define the precise analytical coverage of each reported result and prevent the EU aggregate, country cross-section and functional breakdown from being treated as a single homogeneous panel.
3.3. Variables and Indicator Construction
The study operationalises accounting information for environmental expenditure reporting through several variables and indicators.
The first key variable is public-sector environmental protection expenditure. It captures the environmental protection expenditure attributed to the public-sector institutional grouping, primarily general government and NPISH, as reported in EPEAs. This variable reflects the monetary resources allocated by public-sector entities to environmental protection activities.
The second variable is total national environmental protection expenditure. It is used as a contextual indicator showing the overall level of environmental protection expenditure in the economy. Comparing the public-sector component with total national expenditure helps to interpret the role of public institutions within the broader environmental protection financing system.
The third group of variables relates to functional composition. Environmental protection expenditure and investment are classified according to CEPA domains, including protection of ambient air and climate, wastewater management, waste management, soil and water protection, noise and vibration abatement, biodiversity and landscape protection, radiation protection, environmental research and development, and other environmental protection activities. CEPA-based classification is important because it allows expenditure to be interpreted according to environmental purpose rather than only according to institutional sector or aggregate amount.
To ensure cross-country comparability, the following indicators are constructed:
- 1.
Environmental protection expenditure per capita
where
is the environmental protection expenditure in country
i and year
t, and
is the population.
- 2.
Environmental protection expenditure as a percentage of GDP
where
is gross domestic product in country
i and year
t.
- 3.
Public-sector share in total environmental protection expenditure
where
is public-sector environmental protection expenditure and
is the total national environmental protection expenditure in country
i and year
t.
- 4.
CEPA functional share
where
is expenditure or investment in CEPA domain
k, country
i, and year
t.
These indicators allow the study to analyse environmental expenditure from three complementary perspectives: intensity, macroeconomic weight and functional allocation.
The use of both population- and GDP-scaled indicators prevents nominal expenditure totals from being interpreted without reference to demographic and macroeconomic scale.
To improve clarity and ensure the transparent operationalisation of the empirical analysis,
Table 3 summarises the main indicators used in the study. The table links each indicator with its formula, interpretation and relevance to fiscal transparency and risk-informed public financial management.
Table 3 shows that the empirical indicators are not intended to rank Member States by environmental performance or fiscal risk. Instead, they operationalise accounting information in a way that allows environmental expenditure to be compared and contextualised. Any risk-related use is limited to preliminary screening and requires complementary evidence.
3.4. Data Processing and Harmonisation
The Eurostat extracts were downloaded in tabular format and processed for the revised manuscript in Python 3.12 using pandas 2.2 and Matplotlib 3.9. The complete processed dataset and the code used to reproduce the reported descriptive statistics and figures are provided as
Supplementary Files S1 and S2. Environmental expenditure and GDP observations were used in current-price million euros. Monetary observations were converted to euros before per capita calculations, while the population was expressed in persons. No deflation, purchasing-power-standard adjustment, exchange-rate transformation or seasonal adjustment was applied. Consequently, the 2018–2022 temporal comparison is nominal and may partly reflect changes in the price level.
Unavailable or confidential source values were treated as missing and excluded only from the calculation for which they were required. No interpolation, extrapolation or author-generated imputation was applied. Observations identified by Eurostat as estimated or provisional were retained as official disseminated values, and their status was preserved in the working documentation. The final 2022 EU-27 cross-section was complete; therefore, no Member State was excluded from the reported country comparison. EU aggregates were used as published by Eurostat rather than reconstructed from national observations.
The working data are organised according to the observation unit required by each output rather than as one balanced country-year panel. The final reported sample comprises five EU-year observations for the 2018–2022 trend, 27 Member State observations for the 2022 public-sector per capita comparison, three EU institutional-sector shares and seven EU CEPA category shares.
Supplementary File S1 records these processed observations, their reference years, units and analytical role.
Supplementary File S2 recalculates the cross-country range, median, maximum-to-minimum ratio and counts above and below the EU benchmark.
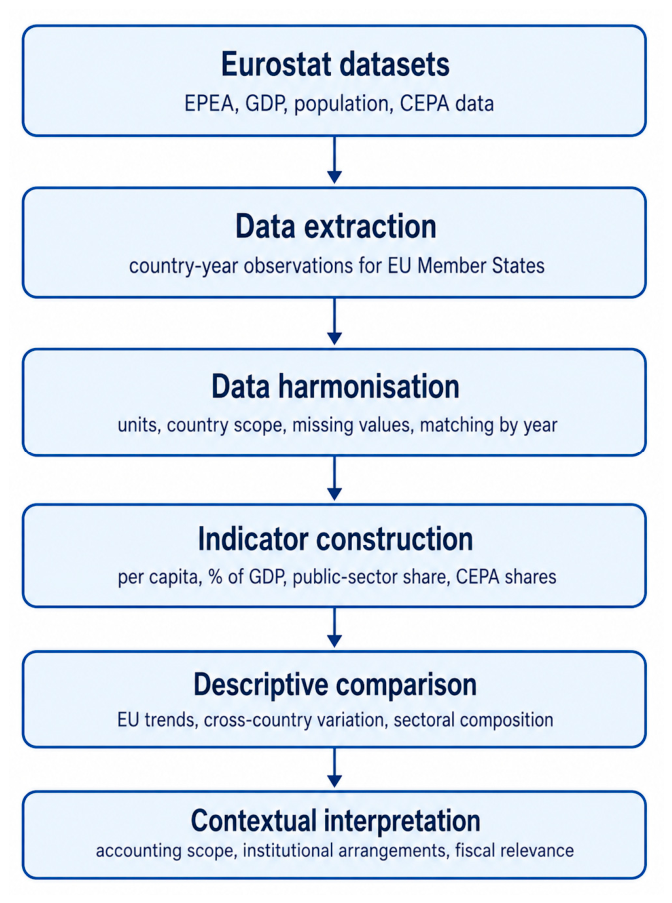
Figure 2 presents the data processing and harmonisation workflow applied in the study. The workflow illustrates how official Eurostat datasets are transformed into comparable accounting-based indicators and then used for descriptive cross-country and CEPA-based interpretation.
As shown in
Figure 2, the empirical procedure is designed to ensure transparency and reproducibility. Each stage connects the original statistical data with the indicators used in the descriptive analysis.
Supplementary File S2 reproduces the reported descriptive calculations and principal figures from the processed observations in
Supplementary File S1. It does not automate the original download, extraction, matching or harmonisation of raw Eurostat data; updated Eurostat releases must first be extracted and processed before the analytical code can be rerun.
3.5. Descriptive and Comparative Analysis
The descriptive comparative analysis examines variation in public-sector environmental protection expenditure across EU Member States. The country-level comparison is based on public-sector environmental protection expenditure per capita for 2022 and includes all 27 Member States. This indicator adjusts the reported expenditure for differences in population size and enables a transparent comparison of expenditure intensity.
The EU aggregate is used as a contextual benchmark for the country-level comparison. Separately, the study examines the development of total environmental protection expenditure and its share of GDP at the EU aggregate level for the period 2018–2022. The per capita country comparison and the GDP-scaled EU time series therefore refer to different observation units and institutional scopes and are not treated as a single homogeneous dataset.
For the 2022 per capita comparison, the 27 Member States are ordered from the highest to the lowest reported value. To summarise the distribution transparently, they are divided into four rank-based descriptive groups covering positions 1–7, 8–14, 15–21 and 22–27. These groups are used solely for presentation. They are not derived from a distance measure, optimisation procedure, centroid or validation statistic and should not be interpreted as statistical clusters. Country values and rank groups are interpreted cautiously because they may reflect differences in fiscal capacity, institutional organisation, service-delivery arrangements, accounting boundaries and infrastructure needs.
3.6. CEPA-Based Functional Analysis
The CEPA-based functional analysis examines the distribution of environmental protection investment across environmental domains at the EU aggregate level for 2022. It assesses the extent to which investment is concentrated in domains such as wastewater management, waste management, protection of ambient air and climate, biodiversity and other environmental activities.
CEPA domains differ in capital intensity, asset life and maintenance requirements. Wastewater and waste management, for example, are commonly associated with long-lived infrastructure. However, the CEPA shares reported in this study do not directly measure fiscal exposure, maintenance obligations, investment adequacy or underinvestment. They provide accounting-based information on functional allocation and identify areas that may require more detailed assessment.
The analysis does not report country-specific CEPA structures because a consistently populated country-by-domain cross-section was not available in the final processed dataset. CEPA-related conclusions are therefore limited to the EU aggregate.
3.7. Analytical Scope and Boundary of Inference
The empirical design is limited to descriptive and comparative analysis. It does not apply inferential econometric procedures or statistically derived country clustering. GDP and population are used as scaling denominators for the construction and interpretation of expenditure indicators rather than as explanatory variables in a causal model.
The cross-country analysis identifies observed differences in expenditure intensity but does not establish statistical dependence, causal effects or stable country typologies. Terms such as higher, moderate or lower expenditure intensity refer only to relative positions within the observed distribution and should not be interpreted as performance rankings, risk categories or validated cluster memberships.
This boundary is important because environmental expenditure is influenced by accounting scope, institutional-sector coverage, public–private service-delivery arrangements, infrastructure cycles and data availability. The results therefore support fiscal transparency and contextual interpretation, but direct conclusions about fiscal risk, environmental performance or sustainability preparedness require additional country-specific evidence.
3.8. Reproducibility and Transparency
A core methodological contribution of the study is the transparent documentation of the analytical procedure and the reproducibility of the reported descriptive calculations from processed observations. The reproducibility claim is limited to the calculations performed on the processed observations supplied in
Supplementary File S1.
Supplementary File S1 contains the processed, while
Supplementary File S2 contains the Python code used to verify the reported summary measures and regenerate the principal empirical figures. A short README records the reference periods, observation units, monetary basis and treatment of missing values. This documentation reduces the risk of static or opaque comparisons and increases the transparency of the research process.
Analytical transparency is also closely related to fiscal transparency. If public-sector environmental expenditure reporting is to support accountability and risk-informed decision-making, users should be able to understand how indicators are constructed, which data sources are used, how missing values are treated and how methodological choices affect the results. The revised manuscript therefore documents the extraction date, dataset codes, reference periods, final observation counts, monetary units, price basis, missing-value rules, software environment and indicator formulas.
Methodological robustness is supported through the use of complementary descriptive indicators. Expenditure per capita controls for population size, expenditure as a percentage of GDP reflects macroeconomic weight, the public-sector share captures institutional responsibility, and CEPA shares reveal functional allocation. Reading these indicators jointly reduces the risk of drawing conclusions from a single measure and strengthens the transparency of cross-country interpretation.
3.9. Methodological Limitations
Several limitations should be acknowledged. First, EPEAs measure environmental protection expenditure, but they do not capture all forms of green spending or all sustainability-related public expenditure. Resource management activities, certain climate mitigation investments and broader sustainability initiatives may fall outside the EPEA boundary. Therefore, the results should not be interpreted as a complete measure of total green public expenditure.
Second, cross-country comparability is affected by institutional arrangements. Environmental services such as waste and wastewater management may be organised differently across Member States. In some countries, these services may be provided by public-sector entities; in others, they may be delivered by market producers. This affects the interpretation of public-sector expenditure levels and public-sector shares.
Third, the empirical analysis is based on official statistical data that may subsequently be revised and may contain estimated or provisional observations. No independent imputation was applied. In addition, the 2018–2022 expenditure series is expressed in nominal current-price values, so part of the observed increase may reflect inflation rather than a real expansion of environmental activity. These features are treated as limitations of the reporting environment rather than as evidence of statistical error.
Fourth, the analysis is descriptive and does not provide statistical tests of association, causal estimates or data-derived country clusters. The observed patterns are intended to support comparative interpretation and accounting-based contextualisation. Future research may apply clustering or panel econometric techniques when a sufficiently complete, balanced and fully documented country-year dataset is available.
Fifth, the complete country cross-section is available for the 2022 public-sector per capita indicator, whereas the GDP-scaled trend and CEPA composition are reported at the EU aggregate level. The study therefore does not compare country-level GDP shares or country-specific CEPA structures. This asymmetry limits multivariate country profiling but avoids imputing incomplete country-domain observations or conflating different institutional scopes.
Despite these limitations, the methodological framework provides a transparent basis for analysing accounting information on environmental expenditure in the public sector. The supplementary workflow reproduces the reported descriptive calculations from the processed observations in
Supplementary File S1, while the original extraction and processing of raw Eurostat data remain outside its scope. Within this boundary, harmonised accounting data support fiscal transparency, comparative interpretation and the preliminary identification of issues requiring direct, country-specific assessment.
4. Empirical Results and Comparative Analysis
4.1. EU-Level Environmental Protection Expenditure: General Trends and Accounting Interpretation
The empirical analysis begins with an overview of environmental protection expenditure at the EU level. The processed dataset used in this study reports total EU environmental protection expenditure of EUR 335 billion in 2022. This value is broadly consistent with Eurostat’s rounded headline estimate of approximately EUR 340 billion. The minor difference reflects the use of different extraction dates, dataset configurations and rounding conventions and does not affect the interpretation of the reported trends.
Table 4 presents the main EU-level headline indicators used as contextual anchors for the subsequent country-level analysis. These indicators provide an overview of the scale, macroeconomic weight, per capita intensity and sectoral composition of environmental protection expenditure in the EU. These headline indicators are consistent with Eurostat and European Environment Agency reporting on environmental protection expenditure (
European Environment Agency, 2025;
Eurostat, 2024).
As shown in
Table 4, environmental protection expenditure in the EU represents a significant financial flow, but its interpretation requires more than aggregate measurement. The sectoral distribution demonstrates that environmental protection is financed through a mixed system involving corporations, public-sector institutions and households. Therefore, the public-sector component should be analysed as part of a broader environmental protection financing structure rather than as an isolated fiscal category.
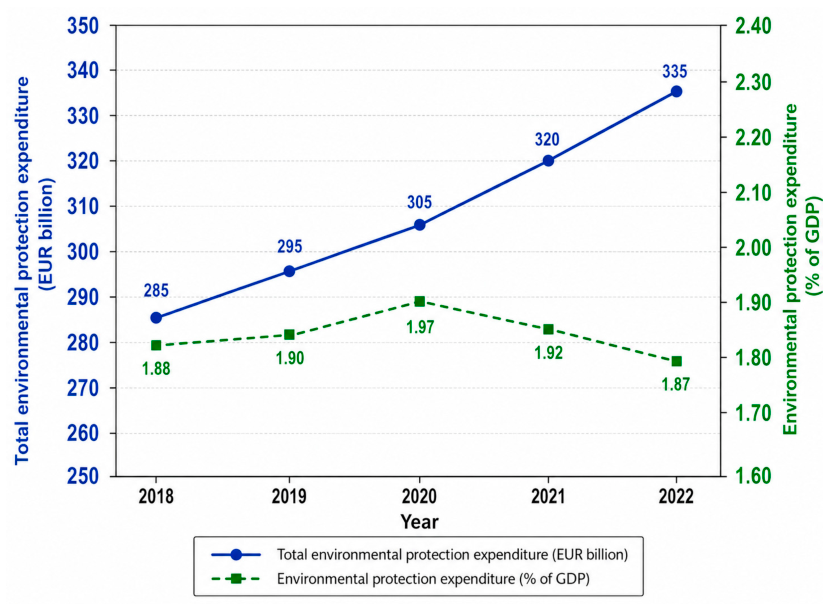
Over the period 2018–2022, nominal environmental protection expenditure increased from EUR 285 billion to EUR 335 billion. This represents a cumulative increase of EUR 50 billion (17.5%) and a compound annual growth rate of approximately 4.1%. Annual nominal growth was 3.5% in 2019, 3.4% in 2020, 4.9% in 2021 and 4.7% in 2022. By contrast, environmental protection expenditure remained within a narrow band of 1.87–1.97% of GDP, with a five-year mean of 1.91% and a total range of only 0.10 percentage points. The results therefore show nominal expansion without a sustained increase in the macroeconomic share devoted to environmental protection.
To visualise this relationship,
Figure 3 presents the general EU-level trend in environmental protection expenditure and its relative weight as a percentage of GDP. The figure illustrates why absolute expenditure growth should be interpreted together with GDP-scaled indicators when interpreting the macroeconomic weight of environmental protection expenditure.
As shown in
Figure 3, the absolute and GDP-scaled indicators describe different empirical dimensions. The nominal series rises in every year, whereas the expenditure-to-GDP ratio peaks at 1.97% in 2020 and returns to 1.87% in 2022. The divergence demonstrates why growth in current-price expenditure should not be interpreted automatically as stronger fiscal prioritisation. The numerical temporal diagnostics are reported below and reproduced in
Supplementary File S2.
Total-economy environmental protection expenditure in the EU is approximately EUR 675 per capita in 2022. This headline measure should be distinguished from the public-sector benchmark of EUR 365 per capita. The two values refer to different institutional scopes: the first covers total national environmental protection expenditure, whereas the second concerns the general government and NPISH component used for the country comparison. GDP-scaled and per capita indicators likewise capture different dimensions of environmental protection expenditure and should be interpreted together only when their institutional scope is held constant.
At the EU level, the sectoral composition of environmental protection expenditure confirms that environmental protection is not financed or delivered exclusively by the public sector. Corporations represent the largest share of total national environmental protection expenditure, followed by general government and non-profit institutions serving households, and then households. In 2022, corporations accounted for around 53% of total national environmental protection expenditure, general government and non-profit institutions serving households (NPISH) for around 28%, and households for around 19%. This structure is important because it prevents an overly narrow interpretation of public-sector environmental expenditure. Public-sector expenditure is only one component of a broader environmental protection financing system involving public authorities, businesses and households.
4.2. Public-Sector Environmental Expenditure and Fiscal Transparency
The public-sector component of environmental protection expenditure is particularly relevant for fiscal transparency and can provide contextual information for preliminary sustainability risk screening. Public authorities finance environmental infrastructure, support environmental services and implement policy commitments related to pollution control, waste management, water protection, biodiversity and climate-related measures. The level and structure of expenditure therefore show how policy objectives are translated into reported financial commitments, but they do not quantify fiscal risk or resilience.
However, public-sector environmental expenditure must be interpreted cautiously. Differences between Member States may reflect differences in environmental ambition, but they may also reflect institutional arrangements. In some countries, waste and wastewater services are delivered mainly by public-sector entities, while in others similar services may be provided by market producers or mixed public–private structures. Consequently, a higher public-sector share does not automatically indicate stronger environmental commitment. It may simply indicate that environmental services are more strongly embedded in the public sector.
This point is central to the accounting interpretation of the results. Environmental expenditure reporting is not only a matter of measuring “how much is spent”, but also of understanding “who spends”, “for what purpose” and “through which institutional arrangement”. EPEA data provide a structured framework for this interpretation because they classify expenditure by institutional sector and environmental domain. This makes the information more useful for public financial management, auditability and fiscal transparency.
4.3. Cross-Country Variation in Environmental Expenditure Intensity
The results indicate substantial variation across EU Member States in public-sector environmental protection expenditure per capita. The country-level comparison covers all 27 Member States for 2022. The GDP-scaled indicator is examined separately as an EU aggregate time series for 2018–2022 and is not used for country-level comparison. This confirms that aggregate EU-level indicators conceal significant differences in national expenditure profiles. These differences may be associated with several factors, including economic size, population, environmental infrastructure needs, administrative structure, public-sector involvement, historical investment cycles and national policy priorities.
The per capita indicator provides a different interpretation. Countries with higher GDP per capita may report higher environmental expenditure per capita because they have greater fiscal capacity, higher service costs or more advanced environmental infrastructure. Conversely, countries with lower per capita expenditure may not necessarily be less committed to environmental protection; they may have lower costs, different institutional arrangements or incomplete coverage of certain expenditure categories.
Cross-country differences in expenditure intensity can prompt questions about infrastructure dependency, institutional responsibility and the relative scale of public commitments. They cannot establish whether a country is prepared for the sustainability transition, holds environmental liabilities, is underinvesting or will face future adjustment costs. High values may reflect fiscal capacity, service costs or capital investment, while low values may reflect different delivery models or accounting scope. Direct risk interpretation requires additional country-specific data on assets, obligations, outcomes, financing and public finances.
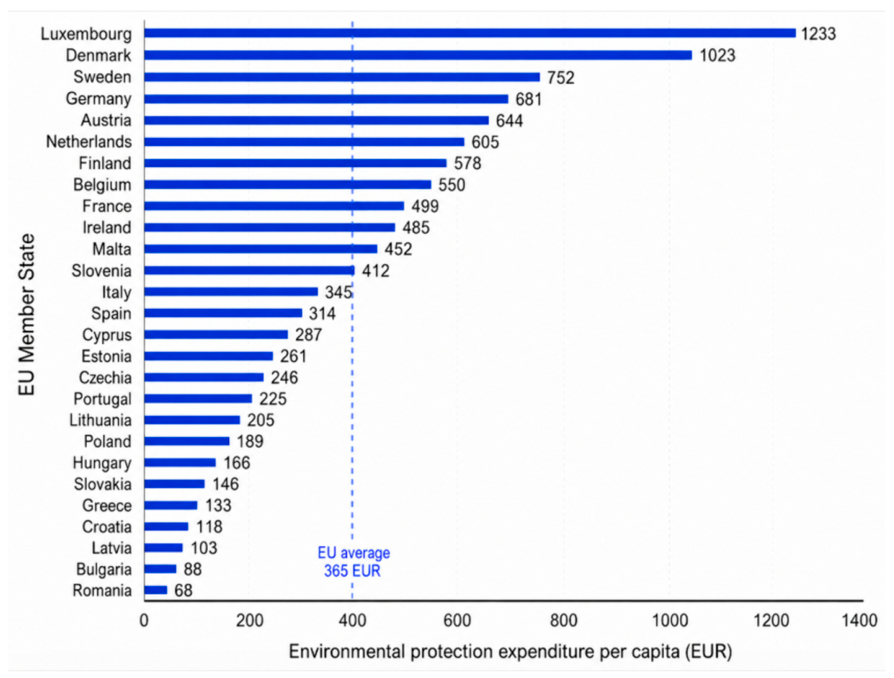
Figure 4 illustrates the cross-country variation in environmental protection expenditure per capita across EU Member States. The figure highlights the extent to which aggregate EU-level averages conceal substantial national differences in expenditure intensity. This visual comparison supports the interpretation that environmental expenditure should be analysed in relation to population size, economic capacity, institutional arrangements and environmental infrastructure needs.
Figure 4 provides direct comparative evidence for all 27 EU Member States. The reported values range from EUR 68 per capita in Romania to EUR 1233 in Luxembourg, producing a range of EUR 1165 and a maximum-to-minimum ratio of approximately 18.1. The unweighted country mean is EUR 400.3, while the median is EUR 314.0; the difference between them indicates a right-skewed distribution. The sample standard deviation is EUR 291.3 and the coefficient of variation is 72.8%, confirming substantial dispersion relative to the mean. Twelve Member States are above the EU aggregate benchmark of EUR 365 and fifteen are below it. Luxembourg and Denmark exceed EUR 1000 per capita, while Romania, Bulgaria, Latvia and Croatia report values below EUR 120. These differences should not be interpreted as a direct ranking of environmental performance or sustainability ambition; they reflect the combined influence of fiscal capacity, population size, service-delivery models, infrastructure needs and accounting scope.
Table 5 shows explicit country affiliation allowing for the distinction between comparison and classification.
As shown in
Table 5, the first rank group contains seven Member States, all above the EU reference standard, while the two lowest rank groups contain thirteen Member States, all below it. The upper-middle group crosses the benchmark: Belgium, France, Ireland, Malta and Slovenia remain above EUR 365, while Italy and Spain fall below it. The interquartile range extends from EUR 177.5 to EUR 564.0. Applying the conventional 1.5 × IQR rule identifies Luxembourg as the only upper outlier because its value exceeds the upper fence of EUR 1143.8. Importantly, dispersion remains high after excluding Luxembourg: the coefficient of variation is still 66.2% and the remaining maximum-to-minimum ratio is approximately 15.0.
Table 6 reports the complete set of descriptive diagnostics.
The descriptive distribution does not establish whether countries with lower expenditure will face higher future adjustment costs or whether higher expenditure reduces long-term risk. Such conclusions require country-specific evidence on infrastructure condition, compliance gaps, investment backlogs, environmental outcomes and financing capacity. The rank groups therefore describe expenditure intensity only and are not risk categories.
4.4. Functional Composition of Environmental Protection Expenditure by CEPA Domains
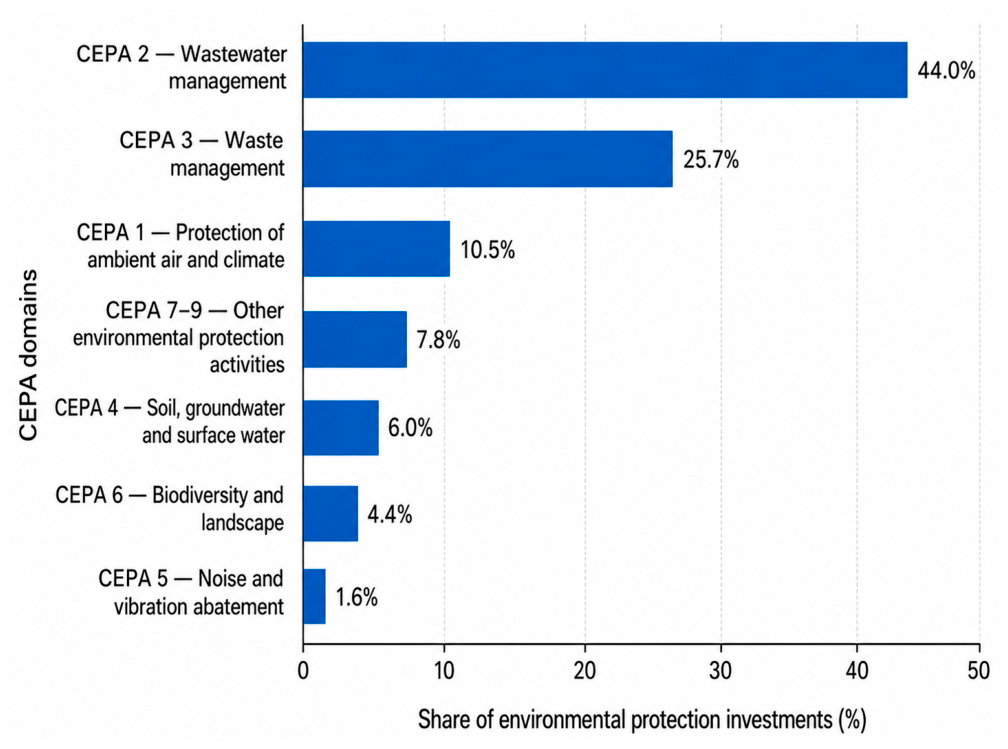
The CEPA-based analysis reveals the functional structure of environmental protection expenditure. At the EU level, environmental protection investments are strongly concentrated in wastewater management and waste management. Wastewater management accounts for approximately 44.0% of total environmental protection investments, while waste management accounts for around 25.7%. Protection of ambient air and climate represents around 10.5%, followed by soil, groundwater and surface water protection at 6.0%, biodiversity and landscape protection at 4.4%, noise and vibration abatement at 1.6%, and CEPA 7–9 activities at 7.8%.
Table 7 presents the CEPA-based functional composition of environmental protection investments at the EU level. The table shows that environmental protection expenditure is not evenly distributed across domains, but is strongly concentrated in infrastructure-intensive areas, particularly wastewater management and waste management.
As shown in
Table 7, wastewater management and waste management together account for 69.7% of environmental protection investments, while the three largest domains together account for 80.2%. The spread between the largest category (44.0%) and the smallest (1.6%) is 42.4 percentage points. These descriptive concentration measures confirm the infrastructure-intensive character of environmental protection and highlight the importance of linking expenditure reporting with capital budgeting, asset management and long-term fiscal planning. The relatively smaller shares of air and climate protection, biodiversity and soil-related domains should be interpreted cautiously because EPEAs do not capture all climate-related or resource-management expenditure.
The concentration of investment in wastewater and waste management warrants attention to capital budgeting, asset management and long-term service provision. It does not, however, demonstrate insufficient investment, future liabilities or fiscal vulnerability. These conclusions would require direct evidence on asset condition, maintenance backlogs, regulatory compliance and financing obligations.
Figure 5 visualises the CEPA-based functional composition of environmental protection investments. The figure complements
Table 7 by showing the relative dominance of wastewater management and waste management within the EU environmental protection investment structure.
The concentration of environmental protection investment in wastewater and waste management reflects the infrastructure-intensive character of these activities and highlights the relevance of capital budgeting, asset management and long-term service planning. However, the reported shares do not demonstrate investment adequacy, future liabilities or fiscal vulnerability. Such conclusions require direct evidence on asset condition, maintenance backlogs, regulatory compliance and financing obligations.
The CEPA evidence is limited to the complete EU aggregate functional extract. A consistently populated country-by-domain cross-section was not available in the final processed dataset. The study therefore does not construct national CEPA profiles, assign functional structures to the descriptive country groups or interpolate missing country-domain observations. In addition, EPEAs do not capture all climate-related or resource-management expenditure; the CEPA results should therefore not be interpreted as a complete measure of total green or climate expenditure.
4.5. Interpretation of Cross-Country Expenditure Patterns
The country-level ordering and rank-based groups reported in
Figure 4 and
Table 5 make the comparative evidence explicit. They reveal substantial dispersion between the highest and lowest public-sector expenditure per capita values and show that the EU aggregate benchmark does not represent the position of most Member States.
The observed differences should be interpreted cautiously. Higher per capita expenditure may reflect greater fiscal capacity, higher service costs, capital-intensive infrastructure or broader public-sector responsibility. Lower values may reflect different accounting boundaries, service-delivery arrangements or stronger participation by market producers. The country-level results therefore describe reported expenditure intensity rather than environmental commitment, policy effectiveness or fiscal risk.
The institutional-sector distribution and CEPA composition provide a complementary EU-level context. The sectoral evidence shows that environmental protection is financed by corporations, public institutions and households, while the CEPA results demonstrate the concentration of investment in wastewater and waste management. Because these indicators are available at the EU aggregate level, they are not used to construct national profiles or explain the position of individual Member States.
The rank-based groups are transparent descriptive summaries of the observed per capita distribution and are not outputs of statistical clustering. No distance matrix, optimisation procedure, cluster centroid or validation statistic is used. The groups should therefore not be interpreted as stable country types, performance categories or risk classifications.
From a risk-informed perspective, the country-level expenditure distribution can identify observations that warrant further investigation. Direct assessment requires additional national evidence on environmental outcomes, regulatory obligations, asset condition, financing arrangements and public finances.
4.6. Macroeconomic Context of the Descriptive Indicators
GDP and population are used in this study to place environmental expenditure in a comparable macroeconomic and demographic context. Expenditure per capita indicates the average monetary intensity relative to population, whereas expenditure as a percentage of GDP indicates the weight of environmental protection expenditure relative to economic output. These measures are descriptive transformations of expenditure information and are not treated as dependent variables in an econometric model.
The indicator environmental protection expenditure as a percentage of GDP captures the macroeconomic weight of environmental protection expenditure. A higher ratio means that expenditure represents a larger share of economic output, but it does not indicate better environmental outcomes, stronger commitment or greater fiscal exposure. Differences may reflect infrastructure needs, service costs, accounting treatment or institutional service-delivery models.
The two scaling approaches answer different questions and should not be merged into a single ranking. The complete 2022 country cross-section used in
Figure 4 and
Table 5 is population-scaled and reveals how much public-sector environmental protection expenditure corresponds to each resident. The GDP-scaled evidence reported in
Figure 3 is an EU aggregate time series and shows whether total-economy expenditure is changing relative to economic output. Because the institutional scope and observation unit differ, the study uses the GDP series to interpret macroeconomic stability over time and the per capita cross-section to describe national dispersion. It does not claim a country-level correspondence between the two indicators.
The combined use of per capita and GDP-scaled indicators improves contextual interpretation by distinguishing expenditure intensity relative to population from expenditure intensity relative to economic output. However, the two indicators are analytically distinct and are not combined into a country-level ranking or profile. This dual perspective does not determine fiscal exposure; it provides complementary accounting information for subsequent assessment.
No inferential association or regression analysis is reported. GDP and population are used solely to scale and contextualise expenditure rather than to establish statistical dependence, prediction or causality.
The resulting interpretation remains relevant to sustainable finance and public financial management because similar nominal expenditure amounts may represent different levels of economic and demographic intensity. Nevertheless, conclusions about fiscal capacity, underinvestment or transition risk require additional evidence and should not be inferred from the scaled expenditure indicators alone.
4.7. Interpretation of Results from the Perspective of Accounting Information Quality
The empirical results illustrate how accounting information on environmental expenditure becomes decision-useful when it satisfies several quality characteristics. First, it must be comparable across countries and periods. EPEAs contribute to comparability by providing a harmonised conceptual and classification framework. Second, it must be relevant for users of public financial information. Indicators such as expenditure per capita, expenditure as a percentage of GDP and CEPA shares are relevant because they connect environmental expenditure with population, economic scale and functional policy priorities.
Third, the information must be traceable and auditable. The use of official Eurostat datasets and a reproducible workflow strengthens traceability by allowing users to identify data sources, extraction procedures and indicator formulas. Fourth, the information must be interpretable. The results show that environmental expenditure figures cannot be understood without considering institutional arrangements and accounting boundaries. This is particularly important for the public sector, where expenditure levels may reflect service delivery structures as much as environmental ambition.
Finally, the information may be useful for preliminary sustainability risk screening. Public-sector environmental expenditure data can flag infrastructure-intensive domains or unusual expenditure patterns for further examination. They cannot identify fiscal pressure or adequacy of investment without environmental outcome indicators, regulatory data, asset information, financing arrangements and policy targets.
4.8. Summary of Empirical Findings
The comparative analysis leads to several key findings.
First, total environmental protection expenditure in the EU increased nominally by 17.5% between 2018 and 2022, with a compound annual growth rate of about 4.1%. Its share of GDP nevertheless remained within 1.87–1.97%, indicating that the nominal increase was not accompanied by a sustained rise in macroeconomic weight.
Second, the sectoral structure of environmental protection expenditure shows that the public sector is an important but not dominant actor. Corporations account for the largest share of total expenditure, while general government and NPISH represent a significant public-sector component. This confirms the need to analyse environmental expenditure as part of a mixed financing and service delivery system.
Third, substantial cross-country variation exists in public-sector environmental protection expenditure per capita. The mean is EUR 400.3, the median EUR 314.0, the standard deviation EUR 291.3 and the coefficient of variation 72.8%. The values range from EUR 68 in Romania to EUR 1233 in Luxembourg. The IQR diagnostic identifies Luxembourg as an upper outlier, but dispersion remains high even when it is excluded. Twelve Member States are above the EU aggregate benchmark of EUR 365 and fifteen are below it. The transparent rank-based groups make this variation visible without treating the countries as statistically validated clusters.
Fourth, the EU aggregate CEPA composition is highly concentrated: wastewater and waste management account for 69.7% of environmental protection investments and the three largest domains account for 80.2%. This highlights the infrastructure-intensive character of environmental protection and the importance of linking expenditure reporting with capital budgeting and asset management. The study does not claim country-level CEPA differences because a completely comparable country-by-domain extract is not part of the final dataset.
Fifth, the country-level per capita distribution and the EU aggregate institutional-sector and CEPA evidence provide complementary but analytically distinct perspectives. The former reveals national expenditure dispersion, while the latter clarifies the broader financing and functional structure of environmental protection in the EU. These indicators are not combined into national profiles.
Overall, the empirical findings support the main argument of the study: harmonised, scaled and functionally classified expenditure information enhances fiscal transparency and public accountability and can structure preliminary sustainability risk-screening questions. However, it does not directly measure fiscal exposure, transition vulnerability, environmental performance or sustainability resilience.
5. Discussion
The findings should be interpreted as differences in reported environmental protection expenditure rather than as direct evidence of environmental effectiveness, fiscal strength or sustainability vulnerability. The results demonstrate the analytical value of harmonised expenditure accounts while also revealing the limitations of expenditure-based indicators. Institutional scope, accounting boundaries, service-delivery arrangements and functional classification remain essential for interpreting both cross-country differences and EU aggregate trends. The discussion therefore focuses on the contribution of EPEAs to fiscal transparency, the limits of aggregate indicators and the conditions under which expenditure information can support preliminary sustainability risk screening.
5.1. Accounting Information as a Basis for Fiscal Transparency
The results show that environmental expenditure information becomes useful for fiscal transparency when it is harmonised, scaled and disaggregated. Country-level reporting reveals variation concealed by EU aggregates, while institutional-sector and CEPA classifications clarify who finances environmental protection and for which purposes.
Transparency therefore depends on both classification quality and disclosure granularity. The complete country table and distribution statistics allow users to distinguish the EU benchmark from the underlying national dispersion, while the institutional-sector and functional shares clarify the broader EU financing and expenditure structure.
This interpretation is consistent with public-sector sustainability reporting research, which emphasises that comparability and accountability depend not only on the availability of information but also on the clarity of reporting boundaries, classifications and institutional responsibilities (
Domingues et al., 2017;
Greiling et al., 2015;
Niemann & Hoppe, 2018).
5.2. Environmental Expenditure Reporting and the Limits of Aggregate Indicators
Aggregate expenditure should be interpreted cautiously. Nominal growth may reflect inflation or cost increases, and high per capita values may arise from fiscal capacity, infrastructure cycles or service-delivery models rather than stronger environmental ambition. Conversely, low reported expenditure may reflect accounting boundaries or private provision rather than weak policy commitment.
The per capita and GDP-scaled indicators provide complementary but analytically distinct perspectives and must be interpreted within their respective observation units. The former compares 2022 public-sector expenditure across countries; the latter describes total-economy EU trends. They are not combined into a synthetic ranking or treated as evidence of statistical association.
5.3. CEPA Classification and the Functional Meaning of Environmental Expenditure
At the EU aggregate level, CEPA provides information on the functional allocation of environmental protection investment. The concentration of EU investment in wastewater and waste management indicates the importance of infrastructure-intensive services and supports links with capital budgeting, asset management and expenditure review. It does not, however, quantify maintenance backlogs, liabilities or investment adequacy.
CEPA also limits interpretation because EPEAs exclude parts of climate mitigation, energy transition and resource management. Environmental protection expenditure must therefore be distinguished from total green spending and broader climate finance.
The findings are also consistent with research highlighting the importance of linking environmental accounting information with management control, capital allocation and organisational decision-making rather than treating expenditure totals as stand-alone performance indicators (
Burritt & Schaltegger, 2010;
Qian et al., 2018).
5.4. Environmental Expenditure as an Input to Sustainability Risk Screening
EPEAs can support preliminary sustainability risk screening as contextual accounting information, but not as a diagnostic or risk-measurement instrument. It identifies the scale, institutional location and functional allocation of expenditure, thereby indicating where more detailed fiscal or asset-level investigation may be useful.
Neither high nor low expenditure establishes preparedness, underinvestment or exposure. Such conclusions require evidence on public debt, contingent liabilities, compliance obligations, infrastructure condition, financing arrangements and environmental outcomes. The descriptive groups in this study are therefore presentation devices rather than risk categories.
Table 8 summarises these interpretative boundaries.
Table 8 emphasises that environmental expenditure information can structure follow-up analysis but cannot replace the direct measurement of fiscal exposure, environmental performance or sustainability risk.
5.5. Link with Sustainable Finance and Corporate Responsibility
Public environmental expenditure is relevant to sustainable finance because governments shape regulatory, fiscal and infrastructural conditions for private investment. Transparent EPEA information can complement corporate ESG disclosure by showing the public financing context of environmental services and infrastructure, while avoiding claims about the performance of individual financial instruments.
The study contributes to the sustainable finance literature by drawing attention to the public-sector accounting information that underpins environmental policy implementation, infrastructure provision and expenditure oversight. This perspective complements, rather than replaces, corporate ESG disclosure and financial-market approaches.
5.6. Methodological Contribution: Reproducibility as a Transparency Mechanism
The documented supplementary workflow is a methodological contribution because it permits verification of the reported descriptive results from processed observations. The reporting of dataset references, extraction dates, units, transformations and missing-value rules allows researchers and public institutions to understand and verify the analytical procedure.
Supplementary File S2 reproduces the reported descriptive calculations and principal figures from
Supplementary File S1, but it does not automate the original download, extraction, matching or harmonisation of raw Eurostat data.
This transparency is also substantive: documented construction of indicators reduces selective interpretation and strengthens the credibility of public-sector sustainability analysis.
5.7. Theoretical Implications
The study contributes theoretically by extending sustainability accounting from corporate disclosure to public-sector expenditure and by linking information quality with fiscal transparency. The findings indicate that monetary environmental accounts can support accountability when their institutional scope and functional boundaries are explicit.
Its risk-related contribution is deliberately limited: comparable expenditure data can guide preliminary screening, but they are not measures of fiscal or sustainability risk.
5.8. Interpretation and Implications of EPEA Indicators
For policy and practice, three priorities emerge. First, where institutionally feasible, budget classifications and expenditure-review procedures should be more closely aligned with EPEA and CEPA categories so that environmental commitments can be traced from planning to reporting. Second, governments should distinguish environmental protection expenditure from broader green and climate spending. Third, audit bodies and accounting professionals should use EPEA indicators to assess visibility, classification and allocation while seeking direct evidence before drawing conclusions about performance or risk. These priorities are consistent with international green-PFM and public-sector sustainability-reporting guidance (
Battersby et al., 2022;
OECD, 2024,
2025).
These priorities require stronger competence in environmental-economic accounting and clearer communication of indicator boundaries. They also support more credible expenditure reviews and sustainability reporting.
EPEA-based indicators are therefore a reference framework for inquiry, not a substitute for environmental audits, asset assessments or fiscal-risk analysis.
All implications should be read within the descriptive scope of the study.
6. Conclusions
6.1. Main Findings
This study assessed how harmonised environmental expenditure information supports fiscal transparency and preliminary sustainability risk screening in the EU public sector.
EU environmental protection expenditure increased nominally between 2018 and 2022, while its GDP share remained broadly stable. Corporations were the largest financing sector, with government and NPISH representing the public-sector component.
The 2022 country comparison showed substantial dispersion: public-sector expenditure per capita ranged from EUR 68 to EUR 1233, the median was EUR 314 and the coefficient of variation was 72.8%. These differences may reflect institutional arrangements, accounting scope, economic capacity and infrastructure needs and should not be interpreted as performance rankings.
At the EU level, wastewater and waste management accounted for 69.7% of environmental protection investment, highlighting the importance of infrastructure-intensive domains without establishing liabilities or investment adequacy.
Overall, harmonised, scaled and functionally classified information is more decision-useful than uncontextualized totals and provides a transparent basis for further assessment.
6.2. Theoretical Contributions
The study contributes to extending sustainability accounting research towards public-sector environmental expenditure and shows that fiscal transparency requires comparable, traceable and functionally classified information. It also provides an EU-wide descriptive comparison using one harmonised accounting framework.
Conceptually, EPEAs are positioned as an input to preliminary sustainability risk screening within public financial management rather than as a risk measure. Direct assessment still requires data on liabilities, debt, compliance, asset condition, financing capacity and environmental outcomes.
Table 9 summarises the theoretical, methodological, empirical and policy contributions.
The central contribution is a transparent comparison whose interpretative limits are stated explicitly.
6.3. Practical and Policy Implications
The findings imply three practical priorities.
Where institutionally feasible, public authorities should align environmental accounts more closely with budget classifications and expenditure-review procedures to improve traceability between policy objectives and financial implementation.
Governments should distinguish EPEA expenditure from total green spending, climate finance and resource-management expenditure so that public reporting does not overstate its scope.
Audit institutions can use EPEAs as a reference for examining visibility, comparability and functional allocation, while relying on direct evidence for conclusions about liabilities or performance.
Accountants and financial managers require competence in environmental-economic accounting, sustainability reporting and the interpretation of scaled indicators.
6.4. Limitations
Second, expenditure is reported in nominal terms and is not an environmental-outcome measure. Changes may reflect inflation, service costs, infrastructure cycles or institutional design rather than changes in environmental effectiveness.
Third, public–private service-delivery differences affect cross-country comparability.
Fourth, the study is descriptive and reports no correlation, regression or statistical-cluster results.
Fifth, the empirical extracts use different observation units: country dispersion is measured for 2022 public-sector expenditure per capita, whereas GDP scaling and CEPA composition are EU aggregates.
Sixth, the study does not directly measure debt, liabilities, climate exposure, asset condition, regulatory obligations or outcomes; expenditure indicators support only preliminary screening.
Seventh, the supplementary workflow reproduces the reported descriptive results from processed observations but does not automate the original download, extraction, matching or harmonisation of raw Eurostat data.
6.5. Future Research Directions
Future research should combine EPEAs with environmental outcomes, green-budgeting practices and longer time series to examine how expenditure patterns relate to policy implementation.
Country-level CEPA datasets would permit a more detailed comparison of functional priorities and institutional structures.
Research could also connect public-sector expenditure with corporate environmental investment and ESG disclosure to examine interactions between public and private financing.
With sufficiently complete panels, future studies may apply econometric methods using direct indicators of debt, liabilities, compliance, infrastructure condition and climate exposure rather than treating expenditure as a proxy for risk.
6.6. Final Remarks
Harmonised environmental expenditure accounts make public commitments more visible, comparable and auditable across the EU. Their principal value lies in structuring evidence, identifying expenditure patterns and supporting targeted follow-up questions.
Environmental expenditure information should therefore be interpreted as an input to preliminary sustainability risk screening rather than as a measure of fiscal preparedness, environmental performance or resilience. Direct conclusions about fiscal exposure require country-specific evidence on liabilities, assets, regulatory obligations, financing arrangements and environmental outcomes. Within these boundaries, harmonised reporting can strengthen accountability, fiscal transparency and long-term public financial analysis.