1. Introduction
The force of globalization and complexity of the banking system have deepened the linkages among domestic and international financial institutions. This interlinkage raises an interesting question about the propagation of return shocks across borders over certain time periods.
Cetorelli and Goldberg (
2011) argue that large global banks influence price formation through instant information channels such news, analyst revisions and cross-listing arbitrage, and through slower mechanisms such as liquidity adjustment, portfolio rebalancing and funding stress. For example, following the 2007–2009 financial crisis, global banks responded to adverse liquidity shocks at their parents (head offices) by reducing cross-border lending to emerging markets and by reallocating internal funds within the banking group (“internal capital markets”). At the same time, some of the transmission occurred via information channels: affiliate lending decisions also changed as foreign markets perceived increased risk, leading to pullbacks in local lending by global banks’ subsidiaries.
These channels operate differently with respect to emerging-market banks that are connected but institutionally distinct. The institutional distinctiveness of emerging-market banking systems, which is characterized by varying regulatory quality, differential supervisory capacity, shallow capital markets, heterogeneous disclosure standards, and often higher sovereign-risk exposure, influences how these channels operate in practice. Unlike advanced-economy affiliates that are tightly embedded within globally integrated regulatory and supervisory networks, emerging-market banks often face segmented financial structures and imperfect information environments. As a result, the information-based transmission channel can become amplified, as price formation in emerging markets tends to respond more intensely to external news, analyst revisions, and cross-listing signals because local markets have fewer alternative information benchmarks and less market-microstructure depth. This asymmetry causes foreign-originated signals to exert disproportionate influence on domestic asset pricing and banks’ lending expectations (see, e.g.,
Cetorelli & Goldberg, 2012;
Avdjiev et al., 2012).
South Africa boasts one of the largest and some of the most systemically important banks in Africa (
FSB, 2020), offering a particularly informative setting. These banks trade in the liquidity markets, maintain regional subsidiaries, and are exposed to global funding and investor bases. Understanding whether South African bank returns respond contemporaneously to global bank shocks, or chiefly through lagged transmission, is vital for investors, risk managers and regulators seeking to monitor contagion and design effective macroprudential responses. Global banks that offer cross-border financing and investment services, like J.P. Morgan and BNP Paribas, have broad worldwide operations and strategic partnerships with South African banks. This is evidenced by the physical presence of J.P. Morgan in Johannesburg and Cape Town, offering investment and commercial banking (
J.P. Morgan, 2025). Additionally, BNP Paribas provided trade finance, corporate banking, cash management, and foreign exchange services via its branch in Johannesburg (
BNP Paribas, 2021). These global banking connections portend serious implications for stability in developing markets like South Africa, especially during times of financial stress.
Methodological advances in connectedness measurement have provided powerful tools to unravel the implications of global banking’s connection with emerging markets. The Diebold–Yilmaz variance-decomposition framework established a practical approach for quantifying directional spillovers in returns and volatility across institutions (
Diebold & Yilmaz, 2014). Frequency-domain methods later showed that spillovers differ across horizons (short, medium, and long), implying that timing matters for systemic risk assessment (
Baruník & Křehlík, 2018). More recently, an
R2-decomposed connectedness approach was proposed to split total goodness-of-fit into contemporaneous (same-period, information-driven co-movements) and lagged (intertemporal, adjustment-driven) components, thereby allowing a clearer diagnosis of whether spillovers arise from instantaneous information assimilation or from delayed market processes (
Gong et al., 2019). Extensions and applications of
R2-decomposition recently implemented with DCC-GARCH and related multivariate methods confirm its usefulness across asset classes and event windows (
Gabauer, 2021;
Cocca et al., 2024;
Nie et al., 2025).
Despite these methodological advancements, there is still a dearth of empirical research applying contemporaneous/lagged
R2-decomposition to cross-border bank stocks and specifically tying South African banks to leading international banks. Bank-level studies are just starting to appear (
Nyakurukwa & Seetharam, 2024), while the majority of the literature on Africa has concentrated on stock market integration or macro-financial transmission (
Mlambo & Biekpe, 2007;
Bonga-Bonga, 2018). However, recent events such as the COVID-19 pandemic, the Swiss banking crisis in 2023, and other stressors in 2023–2024 have highlighted how quickly banking networks can change and how transmission timing is important for policy (
BIS, 2024;
IMF, 2020). This targeted institution-level study that distinguishes between immediate and delayed transmission between South African and leading international banks has been motivated by these developments.
This paper applies the contemporaneous and lagged R2-decomposed connectedness framework to leading South African banks and the top two global banks’ daily equity returns. The decomposition allows us to, first, quantify how much of each bank’s return co-movement with the system is driven by same-day information versus lagged adjustments. Second, it maps directional roles (net transmitters vs. receivers) in both contemporaneous and lagged layers. Third, it documents how these roles evolve across stressed windows, particularly those around salient global events. This timing-explicit perspective clarifies whether shocks are transmitted instantly (suggesting tight information arbitrage or co-incident exposure) or with delay (consistent with liquidity channels, funding squeezes or staggered investor reactions).
This article contributes to the literature in the following way. First, we extend the R2-decomposed connectedness literature to a cross-border banking context. Second, we fill a geographic and institutional gap by directly linking South African banks with global peers, offering new evidence on how emerging-market banking systems absorb and retransmit international shocks. Third, by distinguishing contemporaneous from lagged transmission and tracking dynamics around recent crises, the paper delivers policy-relevant diagnostics for macroprudential surveillance, cross-border supervision, and stress testing. Finally, our findings speak to broader debates about market efficiency and contagion, including the question of whether integration primarily reflects rapid information transmission, or whether delayed mechanisms (e.g., liquidity, funding, and behavioral adjustment) dominate in crises.
2. Literature Review
The study of financial connectedness has grown into a major strand of empirical finance scholarship, driven by concerns over systemic risk, contagion, and the globalization of capital markets. In particular, the interconnectedness of banking institutions, both within and across borders, has attracted heightened attention since the global financial crisis (GFC) of 2007–2009, and more recently, during the COVID-19 pandemic and the 2023 U.S.–Swiss banking turmoil. Understanding how shocks are transmitted between banks, and whether these transmissions occur instantaneously or with delay, has important implications for risk management, investor behavior, and macroprudential policy. This literature review surveys the methodological developments in measuring connectedness and the empirical findings on bank return spillovers, and identifies gaps in the literature, especially regarding African banks. It emphasizes the role of the contemporaneous and lagged R2-decomposed connectedness framework in addressing these gaps.
2.1. Theoretical Literature Review
The theoretical foundations of financial connectedness and return transmission derive from the broader literature on systemic risk, financial contagion, and market efficiency. Classical contagion theory posits that shocks in one financial institution or market can propagate through multiple channels, including those involving information asymmetry, liquidity constraints, and investor behavior (
Brunnermeier & Pedersen, 2009;
Glasserman & Young, 2015). These channels generate both contemporaneous and lagged transmission effects. Contemporaneous transmission reflects the informational channel, in which new information is rapidly incorporated into asset prices, consistent with the efficient market hypothesis (EMH). In contrast, lagged transmission arises through liquidity and funding channels, within which shocks spread more gradually as banks adjust portfolios and manage funding mismatches.
The systemic risk framework conceptualizes the financial system as a network in which institutions are interdependent nodes, and contagion occurs when distress in one node affects others through direct exposures or correlated behaviors (
Billio et al., 2012). This view aligns with the network topology theory, which highlights that a few core institutions dominate transmission, while peripheral entities mainly absorb shocks. In emerging markets, such as South Africa, this hierarchy may differ due to structural characteristics and regional market segmentation. For example, financial institutions frequently function within segmented markets in South Africa, where foreign banks offer access to global capital, but domestic banks have a major impact on local lending (
Moyo & Sibanda, 2017). Thus, in addition to size and connection, regulatory frameworks, capital buffers, and liquidity limitations also influence the systemic risk network (
Billio et al., 2012;
Acharya et al., 2017). The mapping of contagion channels is context-specific because, in contrast to developed markets, peripheral banks in South Africa may be more actively involved in risk propagation, due to concentrated sectoral exposures or insufficient market depth.
Building on these foundations,
Diebold and Yilmaz (
2014) introduced a variance-decomposition connectedness framework to quantify directional spillovers in return and volatility. Subsequent extensions by
Baruník and Křehlík (
2018) and
Gong et al. (
2019) emphasized the temporal and frequency-related dimensions of connectedness, distinguishing short-term from long-term and contemporaneous spillovers from lagged. The
R2-decomposed connectedness approach advances this theory by partitioning total return co-movement into instantaneous and delayed components, enabling empirical testing of whether financial integration is primarily information-driven or liquidity-driven. This theoretical lens provides a robust foundation for understanding the timing and mechanisms of return transmission among global and South African banks.
2.2. Methodological Developments in Measuring Connectedness
Early studies of financial linkages often relied on correlation analyses or simple regressions, which failed to capture the directionality and network nature of spillovers. The seminal contribution of
Diebold and Yilmaz (
2014) transformed this field within the literature by introducing a variance-decomposition framework based on vector autoregressions (VAR). Their connectedness index, derived from forecast error variance decompositions, provided a systematic way to quantify total spillovers, as well as directional transmission and reception of shocks across firms or asset classes. This approach allowed researchers to measure how much of one entity’s forecast error variance could be attributed to developments in another entity, thereby moving beyond static correlations to a dynamic and directional measure of interconnectedness.
Although powerful, the Diebold–Yilmaz approach initially did not account for the different time horizons of spillover effects. To address this,
Baruník and Křehlík (
2018) developed a frequency-domain connectedness framework that decomposes spillovers into short-, medium-, and long-term horizons. Their results demonstrated that shocks manifest differently across time horizons, and that understanding systemic risk requires distinguishing between immediate contagion and slower adjustment processes. This methodological innovation highlighted that not all connectedness occurs contemporaneously; some is driven by lagged transmission reflecting liquidity frictions, funding constraints, or gradual portfolio rebalancing.
Gong et al. (
2019) expanded on this understanding by presenting the
R2-decomposed connectedness framework, which divides models’ explanatory power into contemporaneous and lagged components. This distinction is essential for determining whether co-movements are fueled by delayed mechanisms like funding channel adjustments, liquidity stress, and staggered investor reactions, or by instantaneous information assimilation like cross-listing arbitrage or shared news events. Most recently,
Ha (
2025) shows that the relationship between equities and green asset markets is significantly altered by rare-event volatility, confirming findings based on methodological developments like
R2-decomposition that identify fundamental shifts in propagation channels. These studies verify the use of decompositional-connectedness techniques in banking systems and highlight their increasing relevance outside of traditional financial markets.
R2-decomposition has been expanded into dynamic conditional correlation–Generalized Autoregressive Conditional Heteroskedasticity (DCC-GARCH) settings in more recent applications, demonstrating its usefulness in detecting subtle propagation channels across asset classes (
Cocca et al., 2024). These methodological developments, taken together, offer a more comprehensive toolkit for researching the transmission of shocks both within and between financial systems.
2.3. Empirical Evidence on Bank Connectedness
Banks are among the most interconnected financial institutions, and spillovers get worse during crises, according to empirical applications of connectedness metrics in the banking industry.
Diebold and Yilmaz (
2014) demonstrated the strategy using U.S. financial institutions, showing that connectivity increased during the Great Financial Crisis of 2007–2009. Global banking markets have been the focus of more recent research. For instance, a network-based analysis of 500 major international banks in 72 countries was conducted by
Muñoz Mendoza et al. (
2024), who found clusters of core return shock transmitters and showed persistent interconnectedness. Their results highlight the fact that banking interconnectedness is dynamic, with previously peripheral institutions becoming more central as network topology changes during crises.
Research has also shown that emerging markets have significant return transmission effects at the regional level. With an emphasis on South Africa,
Nyakurukwa and Seetharam (
2024) investigated bank stock return spillovers and found notable co-movement among domestic banks, which has ramifications for hedging and portfolio diversification tactics. These results do not specifically break down spillovers into contemporaneous versus lagged channels, nor do they link South African banks with their leading international counterparts, even though they confirm the existence of strong intra-market linkages. In a similar vein,
Bonga-Bonga (
2018) discovered evidence of robust stock market integration between South African and international markets; however, the bank-specific viewpoint, particularly the timing of transmission, is still not well understood.
This type of empirical work has continuously demonstrated that banking connectedness is widespread and varies over time. Large directional spillovers across financial institutions are reported by early VAR-based applications, with connectedness peaking during crises (
Diebold & Yilmaz, 2014). A consistent core–periphery structure is found by complementary network and econometric studies: many smaller banks are net receivers of shocks, while a small group of large, systemically important banks act as net transmitters (
Billio et al., 2012;
Muñoz Mendoza et al., 2024).
These patterns’ underlying mechanisms have been verified by empirical research. Lagged spillovers that intensify initial shocks are caused by liquidity and funding channels within which staggered adjustments are forced by margin calls, fire sales, or interbank freezes (
Brunnermeier & Pedersen, 2009). Furthermore, empirical network-simulation studies show that common asset holdings and cross-border exposures make a network more susceptible to contagion and can quickly reorganize it under stress (
Glasserman & Young, 2015;
Muñoz Mendoza et al., 2024). Research employing high-frequency data demonstrates that while some spillovers occur almost instantly due to synchronous information assimilation or cross-listing arbitrage, others take place over the course of days or weeks as funding and liquidity constraints become apparent (
Baruník & Křehlík, 2018;
Gong et al., 2019).
Research on connectedness in sustainable finance also provides information relevant to the transfer of bank returns. Strong state-dependent connectivity between the clean-energy and commodity markets is demonstrated by
Kanamura (
2022), indicating that sectoral shocks spread differentially under stress, a behavior also seen in banking systems. Significant multi-frequency return similarity amongst sustainable stocks was found by
Asafo-Adjei et al. (
2022), which is in line with data showing that financial spillovers in bank networks differ over time.
Pham (
2016) compares the asymmetric transmission between global and emerging-market banks to the spillover asymmetry between green bonds and conventional assets. Establishing a similarity to the way in which bank connectivity increases during crises like COVID-19 or the 2023 U.S.–Swiss financial crisis,
Ha (
2025) demonstrates that volatility in green assets increases cross-market connectedness during infrequent serious incidents. When analyzing return transmission between South African and international banks, these data collectively support the idea that connectedness is dynamic, state-dependent, and responsive to market stress.
Global Systemically Important Banks (G-SIBs) frequently cause systemwide volatility that subsequently spreads to regional banks via funding and portfolio channels, according to recent event-based analyses covering the COVID-19 shock and 2023 banking crisis episodes. These analyses show significant increases in both contemporaneous and lagged connectedness (
BIS, 2024;
IMF, 2020). The proportion of non-core (wholesale) funding, bank size, and cross-jurisdictional exposures are all empirically strong indicators of a bank’s function as a transmitter. These results collectively serve as motivation for the
R2-decomposed approach, which separates lagged (liquidity/funding) from same-period (information) transmission to provide direct empirical tests of the main propagation channels influencing emerging-market banks like those in South Africa.
2.4. Gaps in the Literature
Despite the rapid growth of connectedness research, several gaps remain that are relevant to this study. First, the dynamics of African banking systems have received little attention in empirical research, which has mostly concentrated on developed markets or sizable cross-national bank samples. Despite their close ties to international financial flows, South African banks, despite being the biggest and systemically significant in Africa, remain underrepresented in the literature on global return transmission. Second, current research frequently uses variance decomposition frameworks or aggregate market indices that fail to distinguish between contemporaneous and lagged transmission. As a result, it remains unclear whether South African banks absorb global shocks immediately, through fast information channels, or with delays, through liquidity and funding mechanisms. Third, while some research has begun to employ
R2-decomposition in asset markets such as energy (e.g.,
Cocca et al., 2024), there is virtually no application of this methodology to bank-level cross-border transmission in an African context.
2.5. Contributions of the R2-Decomposed Approach
The contemporaneous and lagged
R2-decomposed connectedness approach enhances the analysis of financial spillovers by separating instantaneous information-driven effects from delayed adjustment mechanisms, enabling clearer identification of transmission channels (
Gong et al., 2019;
Baruník & Křehlík, 2018). Unlike traditional frameworks, it provides directional measures across both components, allowing the identification of net transmitters and receivers within financial networks (
Diebold & Yilmaz, 2014;
Gabauer, 2021).
When applied dynamically, the framework captures time-varying shifts in transmission during crises, offering important insights for systemic risk monitoring and macroprudential policy design (
BIS, 2024;
IMF, 2020). By applying this methodology to South African and global banks, the study extends connectedness research to an underexplored context and provides evidence on the roles of information efficiency and liquidity-driven contagion in emerging markets (
Nyakurukwa & Seetharam, 2024;
Brunnermeier & Pedersen, 2009).
3. Methodology
This study employs a novel
-decomposed connectedness approach developed by
Balli et al. (
2023) to examine the overall, contemporaneous, and lagged return transmission among South African banks and the top two global banks. This framework extends the connectedness model of
Diebold and Yilmaz (
2012,
2014) by integrating the generalized forecast error variance decomposition (GFEVD) with
Genizi (
1993)’s decomposition concept, allowing for a more accurate and computationally efficient estimation of connectedness measures, as it avoids the associated normalization problem. Specifically, the
value of a multivariate regression model falls between 0 and 1, eliminating the need for scaling to constrain row sums with this range. Consequently, this results in connectedness measures that are easier to interpret, with the row sums automatically constrained to a functional range (
Naeem et al., 2024).
where
, and
are
dimensional demeaned vector in time
t, and
as well as
are
dimensional matrices where
—thus the left-hand side (LHS) variable is dropped from the right-hand side (RHS) variables. It should be noted that if
the model collapses to the contemporaneous
-decomposed connectedness approach of
Naeem et al. (
2024). Alternatively, the outlined model can be formulated as
where
is an
dimensional vector and
is an
dimensional vector with zero on the
position.
In general, the sum of the
combinations using bivariate linear regressions (BLRs) is only equal to the
goodness-of-fit measure of a multivariate linear regression (MLR) if all RHS variables are uncorrelated with each other. Therefore, we need to find a mapping that transforms the correlated series
1 into orthogonal series. This can be done by using principal component analysis (PCA) where the number of latent factors is equal to the number of RHS variables. Thus, the
decomposition for an MLR can be computed by
where
, and
represent
eigenvector, eigenvalue, and Pearson correlation matrices, respectively, while
and
illustrate
Pearson correlation and
contribution vectors, respectively. In more detail,
refers to the Pearson correlation coefficient across RGS variables and
to Pearson correlation coefficients between the LHS and RHS variables. The first
values of
represent the contemporaneous
contributions, while the remaining highlight the lagged
contributions. Consequently, the vector sum of
is equal to the MLR
goodness-of-fit measure. Next, we stack the
contribution of all
MLRs to obtain the
dimensional
decomposition matrix,
.
2 can be interpreted as the contemporaneous spillovers (
) while the sum of the lagged values,
stand for the lagged spillovers.
With respect to the connectedness approach of
Diebold and Yilmaz (
2012,
2014),
replace the scaled GFEVD matrix. This implies that the Total Connectedness Index (TCI) is equal to the average
of the
MLRs
3.
As
is between zero and one, TCI also lies within the same range, avoiding the connectedness normalization problem (see,
Lastrapes & Wiesen, 2021;
Chatziantoniou & Gabauer, 2021;
Gabauer, 2021). Using our proposed methodology allows us to investigate the contemporaneous and lagged TCI. The
R2-decomposed connectedness method is novel in empirically testing whether transmission is information-driven or adjustment-driven, rather than making an assumption. Traditional variance-decomposition and TVP-VAR frameworks measure the magnitude of spillovers but cannot distinguish between contemporaneous and lagged mechanisms. The novelty therefore lies not in the sizes of spillovers themselves but in identifying the dominant transmission channel, which is crucial for interpreting market efficiency and contagion dynamics.
where
represent the contemporaneous and lagged TCI, respectively.
Finally, the same concept can be applied to the total directional connectedness TO and the influence “FROM” others, as well as the net total directional connectedness measures.
While the total directional connectedness illustrates how much of the overall (contemporaneous/lagged) variance in all LHS variables is explained by series j, () total directional connectedness demonstrates the degree to which all RHS variables explain the overall (contemporaneous/lagged) variance in series j—equal to of the K MLR. If the series j is considered as a net transmitter (receiver) of shock, indicating that it can explain more (less) of the variation in others than vice versa. The contemporaneous and lagged connectedness measures can be interpreted in the same fashion.
The model is estimated as a lagged function of (1), which was chosen according to the Bayesian Information Criterion (BIC), given the VAR forgetting factor of 0.99, for the best fit of the model and parsimony. A forecast horizon of H = 10 periods is employed in computing the connectedness measures, as per the literature on variance decomposition frameworks. To incorporate time-changing dynamics, a rolling window method using W = 200 observations is applied; thus, the analysis can follow the evolution of the spillovers over time, while maintaining sufficient estimation precision.
Data
This study uses a daily stock returns dataset for the top five banks in South Africa (Nedbank, Investec, Capitec, Standard Bank, and ABSA) and the top banks in the U.S. and France, J.P. Morgan and (BNP) Paribas, respectively, spanning from 2 January 2015 to 9 September 2024, retrieved from iress.co.za. The analysis used daily stock returns because this frequency is better-suited to capturing the dynamics of high-frequency transmission in financial markets. Daily datasets make it possible to identify rapid information-driven spillovers, events that would be hidden at lower frequencies. As shown by
Papathanasiou et al. (
2025), the application of daily frequency significantly increases the explanatory power of
R2-based models, resulting in the improved reliability of connectedness estimates. In addition, the data essentially captures the banking crisis of 9 March 2023 to 2 May 2023 and the 2022 Russia–Ukraine war, which helps in examining the return transmission associated with the main banking crisis subsequent to the Global Financial Crisis (GFC) and the European Debt Crisis (EDC) of 2008 and 2011, respectively. The sample period is carefully selected to capture different global and regional shock-events, including the COVID-19 pandemic (2020), the Russia–Ukraine war (2022) and the 2023 global bank turmoil, within a single continuous framework. Secondly, it enables estimation of multiple financial cycles, which includes expansionary periods, crisis periods, and the periods after these crises. The return series reveals a non-stationary status according to the
Elliot et al. (
1996) unit root test; we further estimate the percentage changes for each series through equation below:
4. Empirical Results
4.1. Descriptive Statistics and Return Characteristics
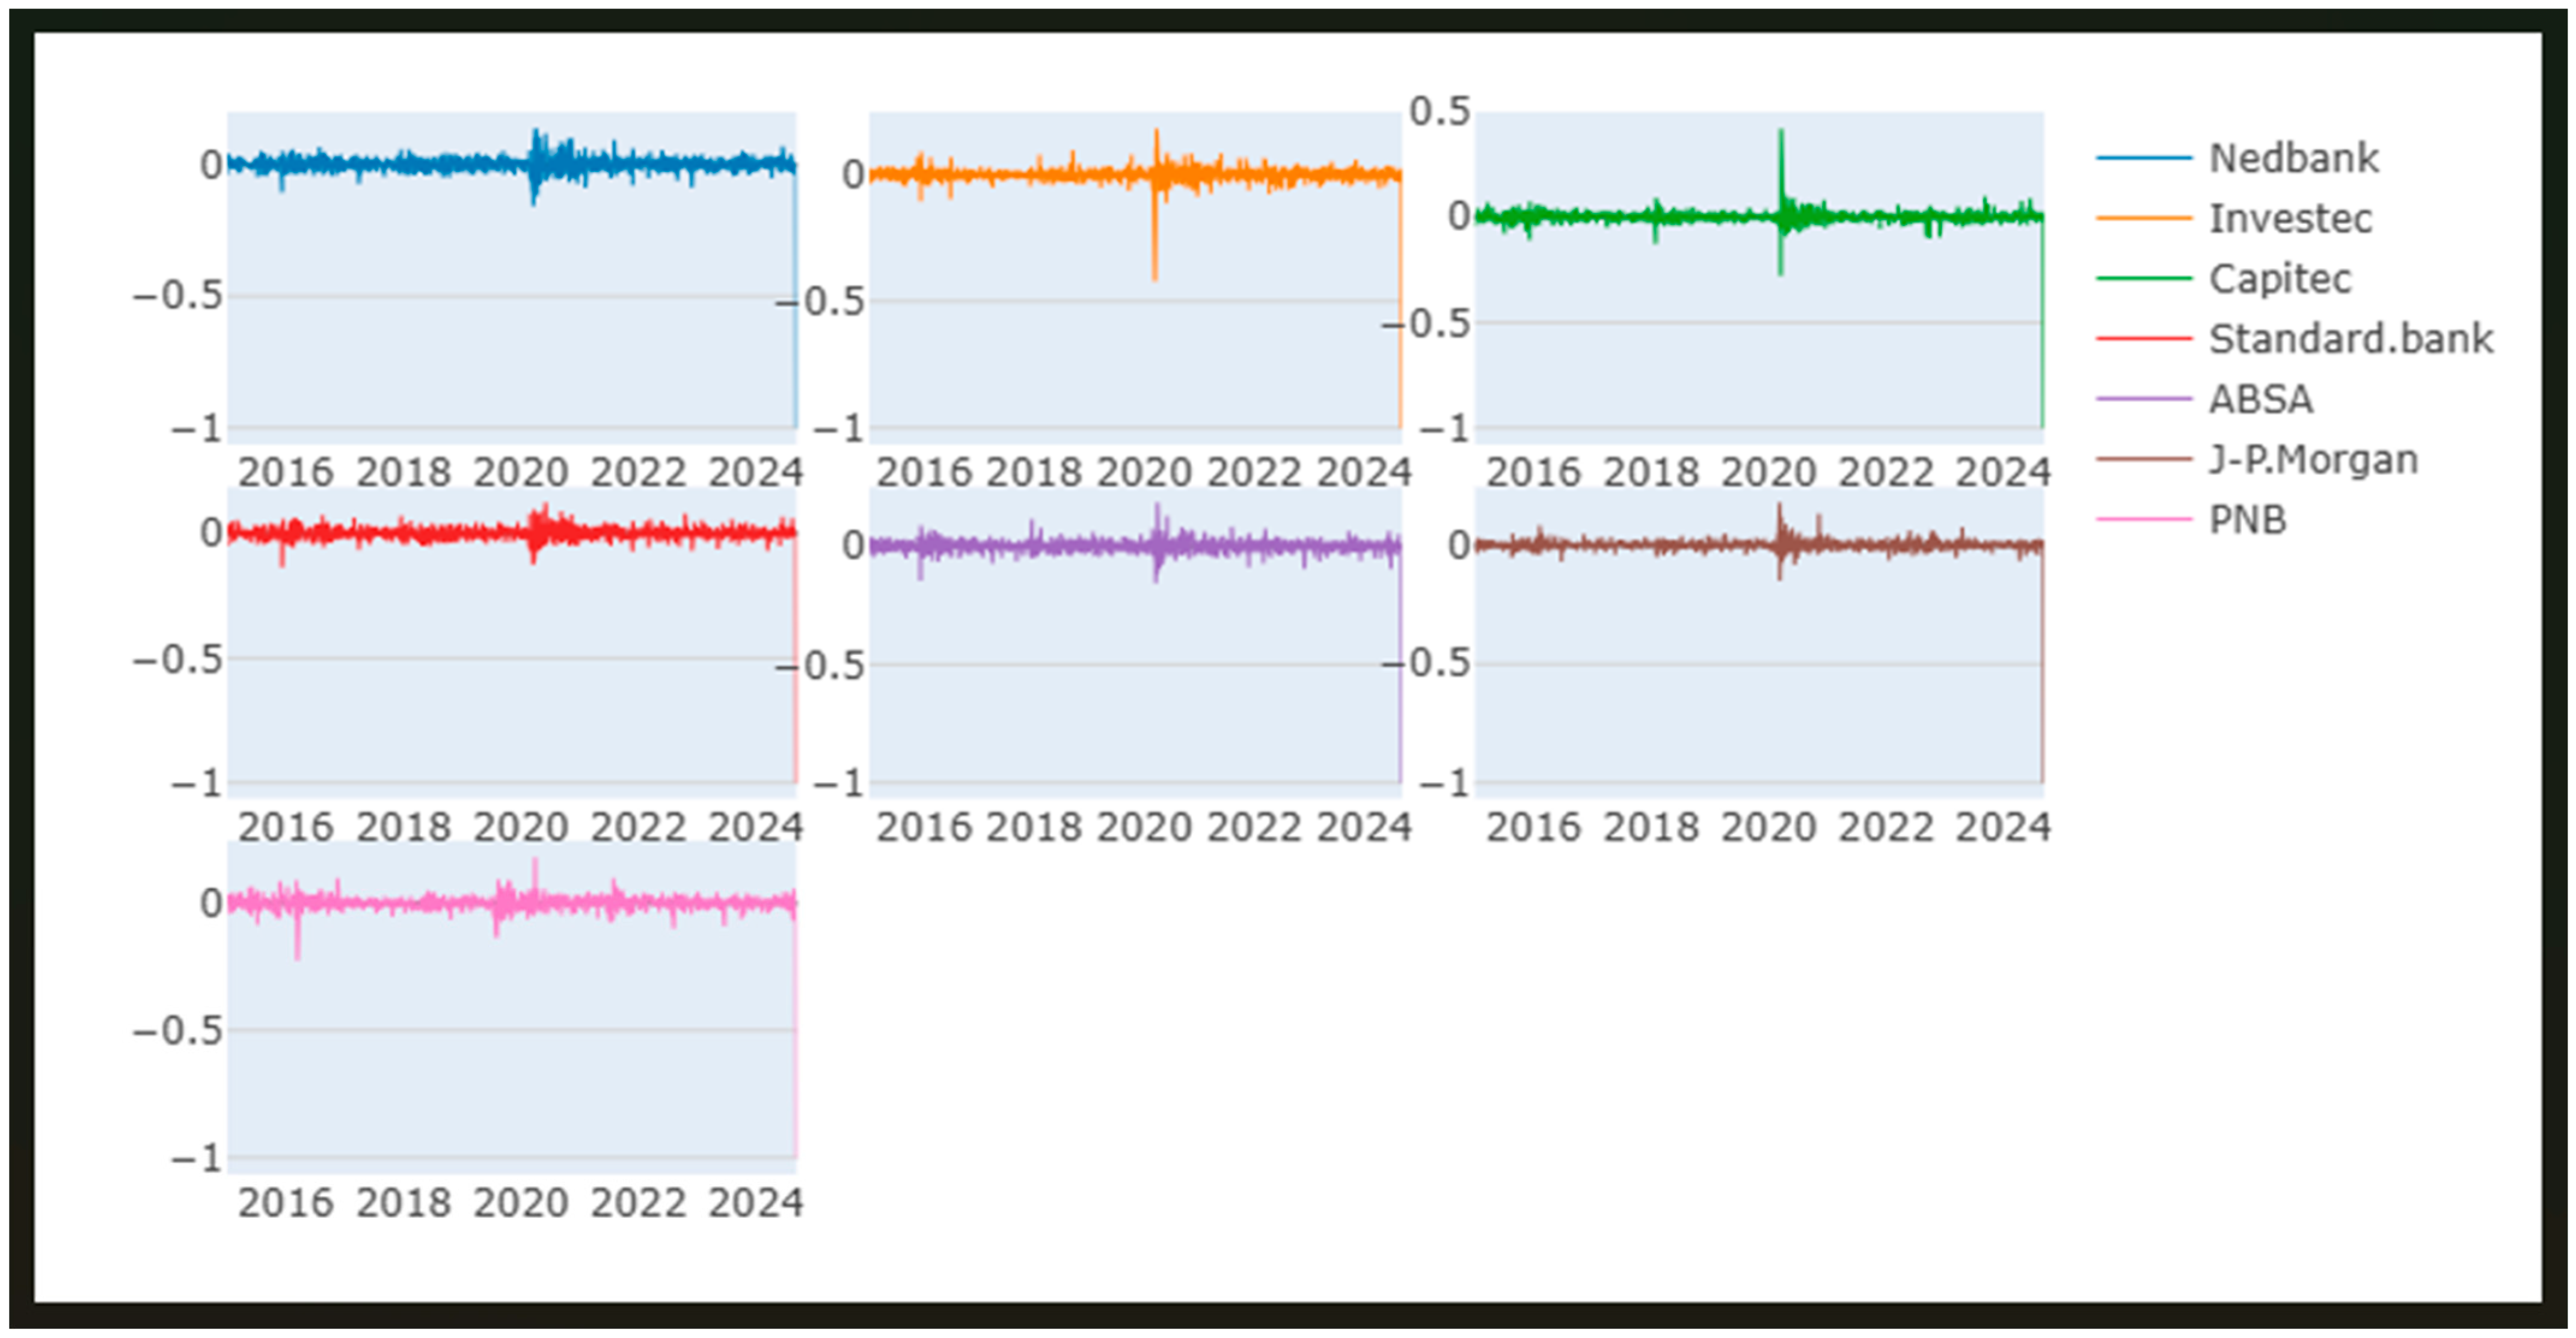
Figure 1 shows the characteristics of returns for all banks between 2015 and 2024, within the sample period. It is interesting to note that volatility increased across all sample banks in 2020 due to the COVID-19 pandemic. Furthermore, several other minor spikes occurred from 2023 to 2024. Additionally, all South African banks witnessed a major spike in 2016. As can be seen in
Table 1, among the South African banks, Capitec (0.000736) exhibits the highest mean return, followed by J.P. Morgan (0.000232), suggesting relatively better average performance during the sample period. In contrast, ABSA (−0.000186) and Nedbank (−0.000114) show slightly negative means, indicating modest underperformance compared to peers.
The descriptive statistics reported in
Table 1 summarize the daily return characteristics of the seven banks included in the sample: five South African banks (ABSA, Capitec, Investec, Standard Bank, and Nedbank) and two global banks (J.P. Morgan and PNB). Consistent with the assumptions under the efficient market hypothesis that price changes approximate a martingale process (
Diebold & Yilmaz, 2014), the mean returns for all banks are close to zero, indicating that daily price movements are largely unpredictable.
All banks except J.P. Morgan exhibit comparable standard deviations in terms of volatility (between 0.029 and 0.031), indicating a similar level of exposure to transient market swings. But once more, Capitec has the highest standard deviation (0.0227), suggesting higher return variability and risk–return trade-offs. This could be because of its retail-focused model and susceptibility to domestic shocks. J.P. Morgan’s comparatively lower volatility (0.0173) might be the result of more sophisticated risk management frameworks and a more diversified global exposure.
The return distributions of four out of the five South African banks exhibit pronounced negative skewness, ranging from Investec at (−2.8738) to Nedbank with (−0.009247), meaning that large negative returns occur more frequently than large positive ones; this is a common and accepted fact regarding banking equities during periods of market distress (
Billio et al., 2012). Skewness varies across institutions, with some banks exhibiting positive asymmetry (e.g., Capitec and J.P. Morgan), while others show negative skewness, indicating differing downside risks. All series display extremely high kurtosis, confirming leptokurtic distributions with fat tails. Furthermore, the Jarque–Bera test results (
p = 0.000) strongly reject normality, implying that bank returns are characterized by non-normality, extreme values, and heightened financial risk. The minimum return values for all banks are negative, between (−0.4205) to (−0.1496), which indicates a broad-based decline in bank stock performance. However, the difference between the maximum and minimum (range) is wide, which illustrates a significant fluctuation in returns. Overall, the descriptive statistics reveal that South African and global bank returns share similar non-normal characteristics, though domestic institutions, particularly Capitec, Investec and ABSA, display higher volatility and downside asymmetry, potentially reflecting their greater exposure to local macro-financial risks.
The Elliott–Rothenberg–Stock (ERS) unit root tests confirm the stationarity of all return series, allowing the use of the
R2-decomposed connectedness framework on first-differenced returns. Ljung–Box Q and Q
2 statistics also suggest the presence of autocorrelation and ARCH effects, which is consistent with the volatility clustering typical of financial returns (
Gong et al., 2019).
Figure 1 (Bank Returns between 2015–2024) visually confirms these findings. Volatility spikes align with identifiable macro-financial episodes: the 2016 South African sovereign downgrade, the 2020 pandemic outbreak, the 2022 Russia–Ukraine conflict, and the 2023 global banking crisis. While global shocks dominate the volatility surges across all banks, local, idiosyncratic events such as South Africa’s 2021 unrest and policy uncertainties also manifest as short-lived volatility spikes. This suggests that South African bank returns are influenced by both global and regional drivers, reinforcing the need to examine both contemporaneous and lagged transmission channels.
4.2. Average Connectedness and R2-Decomposition
Table 2 presents the average connectedness results, based on the contemporaneous and lagged
R2-decomposition. The Total Connectedness Index (TCI) averages 44.14%, implying that nearly half of the return variation across the sample can be explained by cross-bank linkages rather than idiosyncratic shocks. This magnitude is comparable to those found in international banking studies (
Muñoz Mendoza et al., 2024;
Cocca et al., 2024), underscoring the systemic interdependence of the global banking network.
When decomposed, 40.92% of the connectedness arises contemporaneously, while only 3.22% originates from lagged transmission. This implies that most return spillovers occur within the same trading day, which is consistent with rapid information assimilation, cross-market arbitrage, and the integration of financial news channels (
Baruník & Křehlík, 2018;
Gong et al., 2019). Nonetheless, the non-negligible lagged component suggests the presence of slower adjustment processes, likely liquidity and funding channels, which are particularly relevant during periods of market stress (
Brunnermeier & Pedersen, 2009).
The directional connectedness “TO” and “FROM” measures provide deeper insight into how shocks are transmitted between banks. Standard Bank exhibits the highest net transmitter role (+2.42%), followed by Nedbank (+1.87%) and ABSA (+1.06%). These findings align with their sizes and their levels of regional dominance and international exposure. Standard Bank’s extensive pan-African operations and cross-border listings may amplify its capacity to propagate return shocks. Nedbank’s exposure to investment holdings and ABSA’s historical ties with Barclays further integrate them within global financial cycles.
By contrast, J.P. Morgan and PNB emerge as net receivers (−2.24% and −1.72%, respectively). This pattern, though counterintuitive given their global scale, suggests that during the sample period, South African banks transmitted region-specific information possibly related to emerging-market risk pricing to global peers. The dominance of contemporaneous over lagged spillovers for most banks indicates efficient information transmission, the exceptions being J.P. Morgan and PNB, where lagged effects dominate (lagged “FROM” = 6.10 vs. contemporaneous = 4.41 for J.P. Morgan). This delayed response aligns with the possibility that global banks react more slowly to region-specific developments, integrating these developments through periodic portfolio rebalancing rather than real-time arbitrage (
Glasserman & Young, 2015).
Crucially, the decomposition results also suggest that associations between banks are not stable and become stronger with an increased degree of market activity. Although contemporaneous connectedness is stronger on average, it becomes more important during times of high volatility, indicating that, under stress, financial markets move into a more closely coupled system. On the other hand, the lagged feature, though smaller in magnitude, becomes more essential when shocks travel through balance-sheet adjustments and funding constraints by slow propagation. This signifies that interbank relationships evolve from quick, information-driven linkages to more enduring, adjustment-driven dependencies.
The cross-sectional connectedness matrix also reveals asymmetry: intra-South African linkages are stronger than cross-border ones, which is consistent with prior evidence of regional clustering (
Nyakurukwa & Seetharam, 2024). Within South Africa, Standard Bank, Nedbank, and ABSA dominate transmission, while Capitec and Investec primarily receive shocks. This structure mirrors the domestic market hierarchy, where large universal banks drive price formation, and smaller retail-oriented institutions adjust subsequently.
Table 2 above shows the list of banks and their respective net spillover values, which distinguish each bank either as a net-sender or a net receiver. It is quite interesting to note that J.P. Morgan stands as the biggest receiver of risk spillovers from all other banks, while Nedbank and PNB share space as the second highest risk receiver. Meanwhile Standard Bank and ABSA bank stand as the first and second senders of risk to other banks.
4.3. Dynamic Connectedness and Event-Specific Patterns
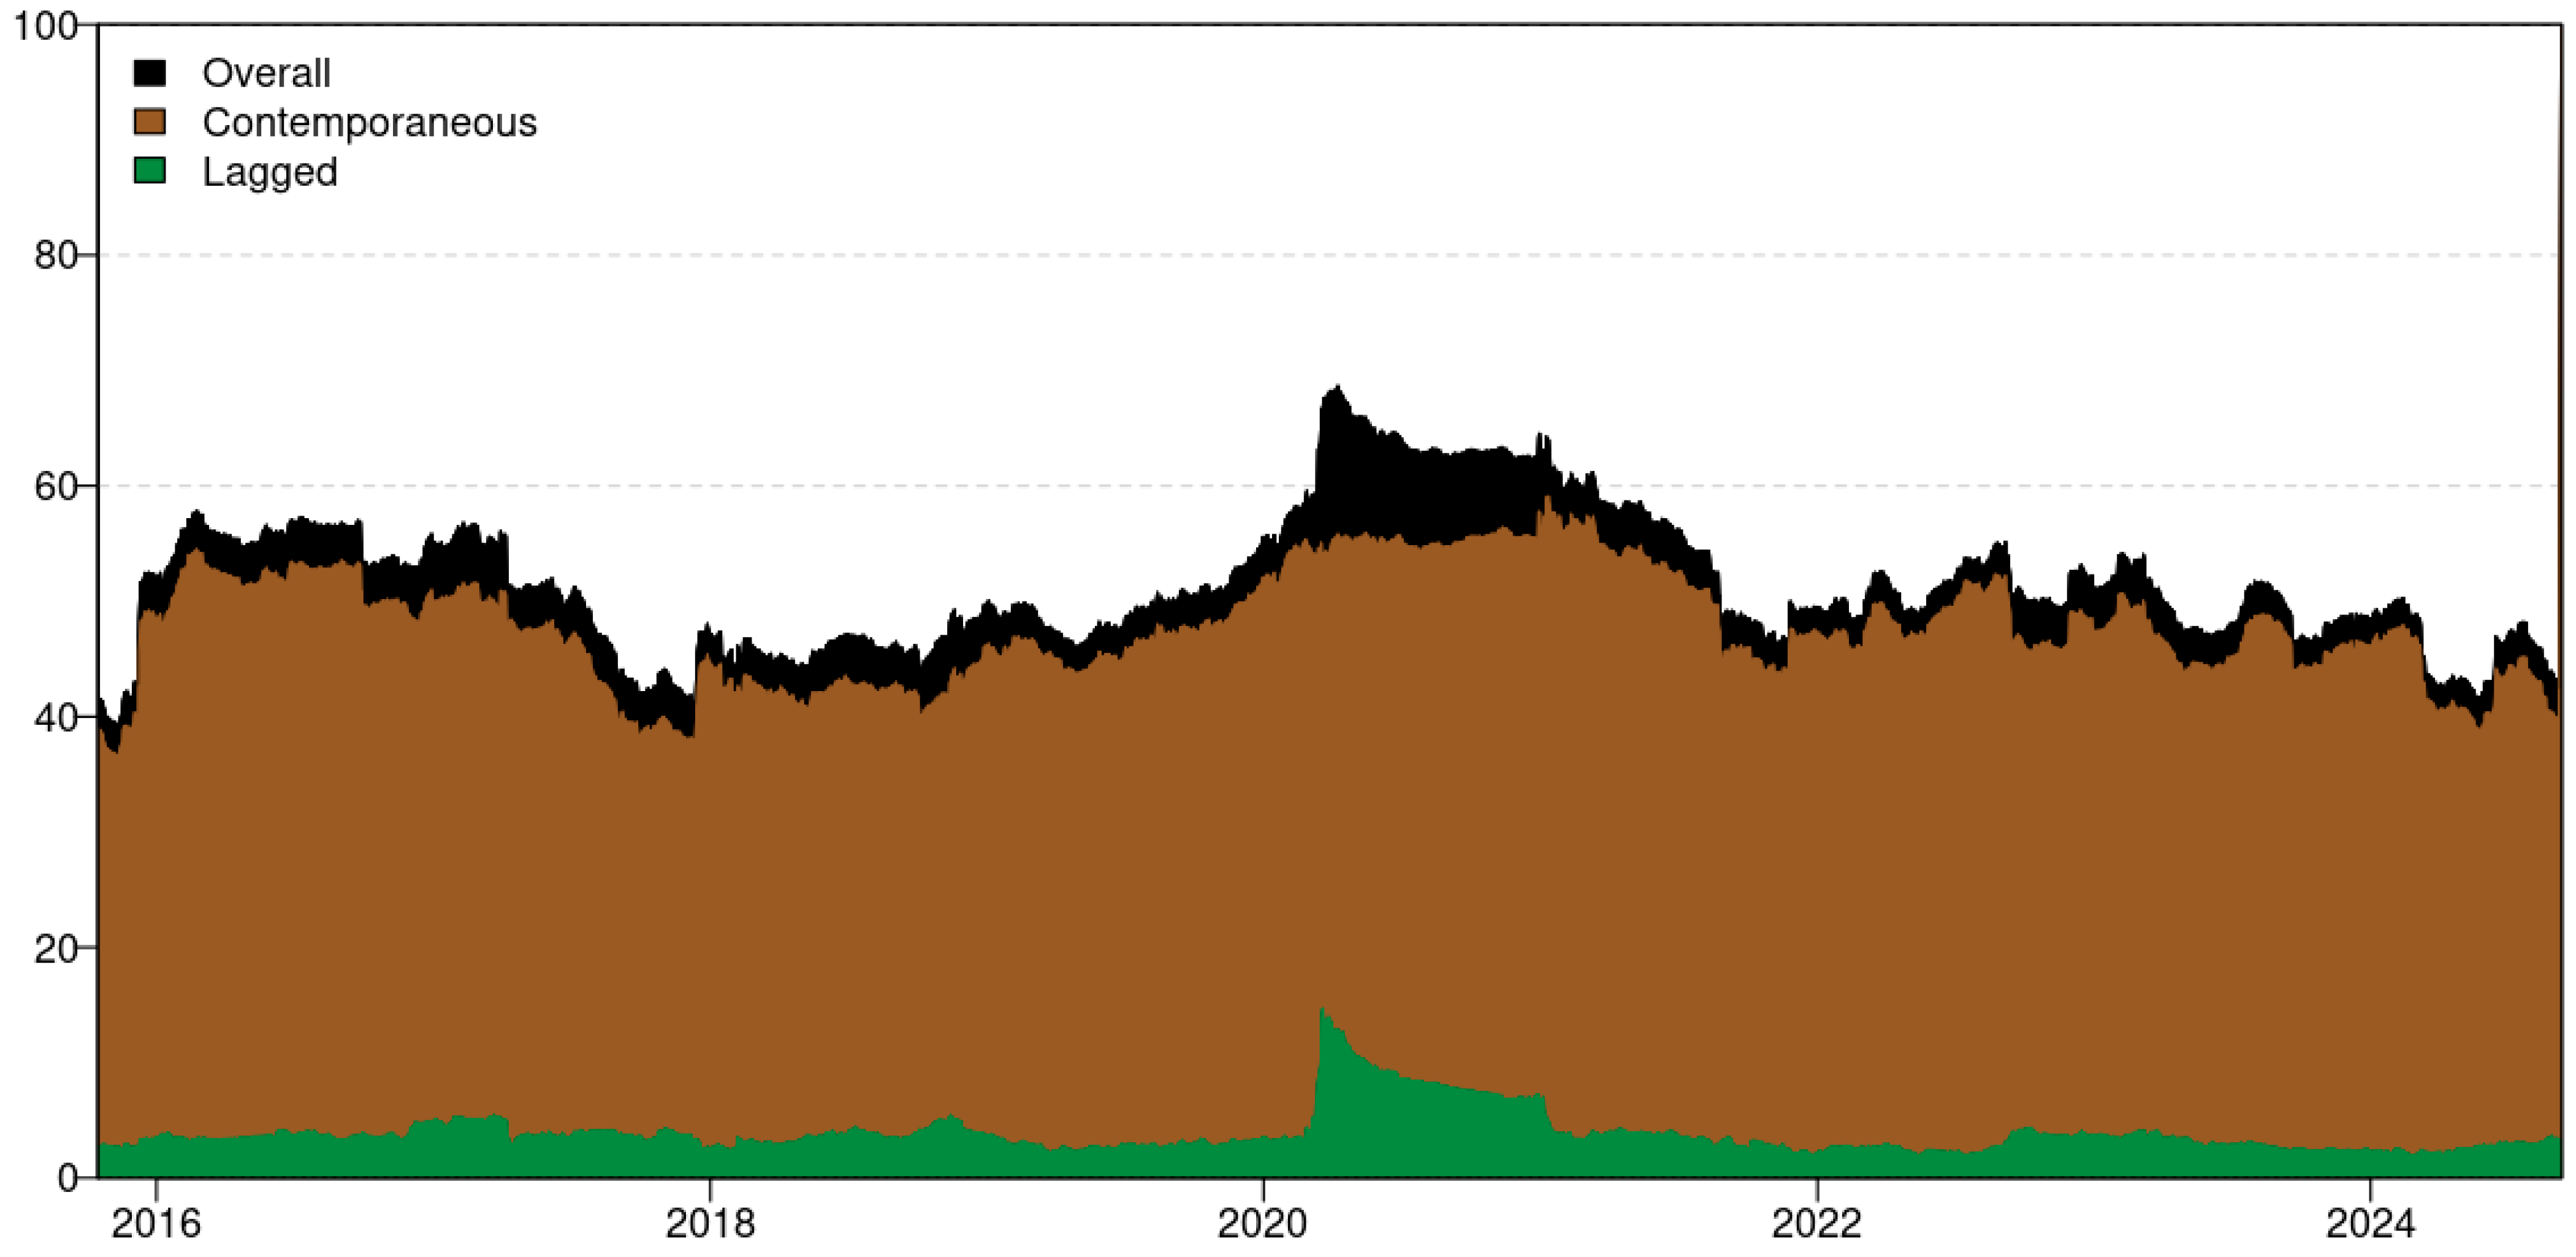
Figure 2 illustrates the dynamic evolution of total, contemporaneous, and lagged connectedness over time. The TCI fluctuates between 40% and 65%, with four distinct peaks corresponding to major local, global and regional crises. A high level of connectedness was observed in 2016, which coincides with period of intense financial turmoil in South Africa. This was followed by episodes of fiscal volatility and political unrest, which included the sudden replacement of the finance minister and attendant severe currency depreciation and stock market volatility (
IMF, 2016). This further degenerated into increased risk sentiment, which resulted in co-movements in domestic banking shares of financial institutions such as banks, an indication of information-driven spillover. This finding is in line with evidence showing that political shocks can strengthen financial market connectedness, particularly in developing markets (
IMF, 2016;
World Bank, 2017). It also suggests that local political shocks, together with global crises, can amplify systemic interconnectedness in the South African banking system.
Prior to 2020, connectedness remained relatively stable, fluctuating within a moderate band, indicating a loosely integrated system in which shocks are only partially transmitted across institutions. But in the context of the COVID-19 crisis, there is a sharp structural break, as total connectedness rises significantly and contemporaneous spillovers dominate. This reflects a regime shift toward rapid information diffusion, where markets react almost instantaneously to global uncertainty. The second peak, in 2020, coincides with the COVID-19 pandemic, reflecting heightened uncertainty and global synchronization of banking returns. Both contemporaneous and lagged connectedness surged sharply, confirming that banks responded almost simultaneously to pandemic-related news, while liquidity and funding adjustments prolonged spillovers (
IMF, 2020). This pattern is consistent with the “flight-to-quality” behavior observed globally, where investors simultaneously reprice risk across all banking equities (
BIS, 2024).
The third peak (2022) coincides with the conflict between Russia and Ukraine, during which shocks to the world’s energy and commodity prices created powerful contemporaneous transmission. Due to their lending portfolios, which were linked to commodities, South African banks, especially Standard Bank and Nedbank, displayed a marked degree of sensitivity. Curiously, lagged spillovers also became more intense, indicating that secondary liquidity adjustments, perhaps through funding markets and currency exposures, increased transmission over the next few days (
Cocca et al., 2024).
The 2023 banking crisis also reflects an evolution of the transmission system. In this episode, lagged connectedness temporarily exceeds or converges with contemporaneous connectedness, signaling a shift toward delayed and sequential contagion. This is consistent with stress propagation through interbank exposures and gradual reassessment of counterparty risk. The fourth peak (March–May 2023) may be associated with the U.S.–Swiss banking crisis, when regional U.S. bank failures and Credit Suisse’s troubles sparked fears of a global contagion. Lagged connectedness momentarily overtook contemporaneous connectedness during this episode, suggesting slower, sequential responses to cross-border stress (
BIS, 2024). In keeping with the theory that big G-SIBs absorbed contagion rather than spreading it, J.P. Morgan’s function as a receiver significantly increased. South African banks, on the other hand, demonstrated resilience by limiting the spread of global stress, highlighting their relative isolation from Western funding markets. Total connectedness gradually decreased after 2023 and returned to pre-pandemic levels by the middle of 2024. The stabilization of monetary policy expectations and better global liquidity conditions occur at the same time as this normalization. During normal times, the dominance of immediate transmission channels over delayed ones is reinforced by the persistent asymmetry between contemporaneous and lagged connectedness.
4.4. Dynamic Net Total Directional, Net Pairwise Directional, and Network Connectedness
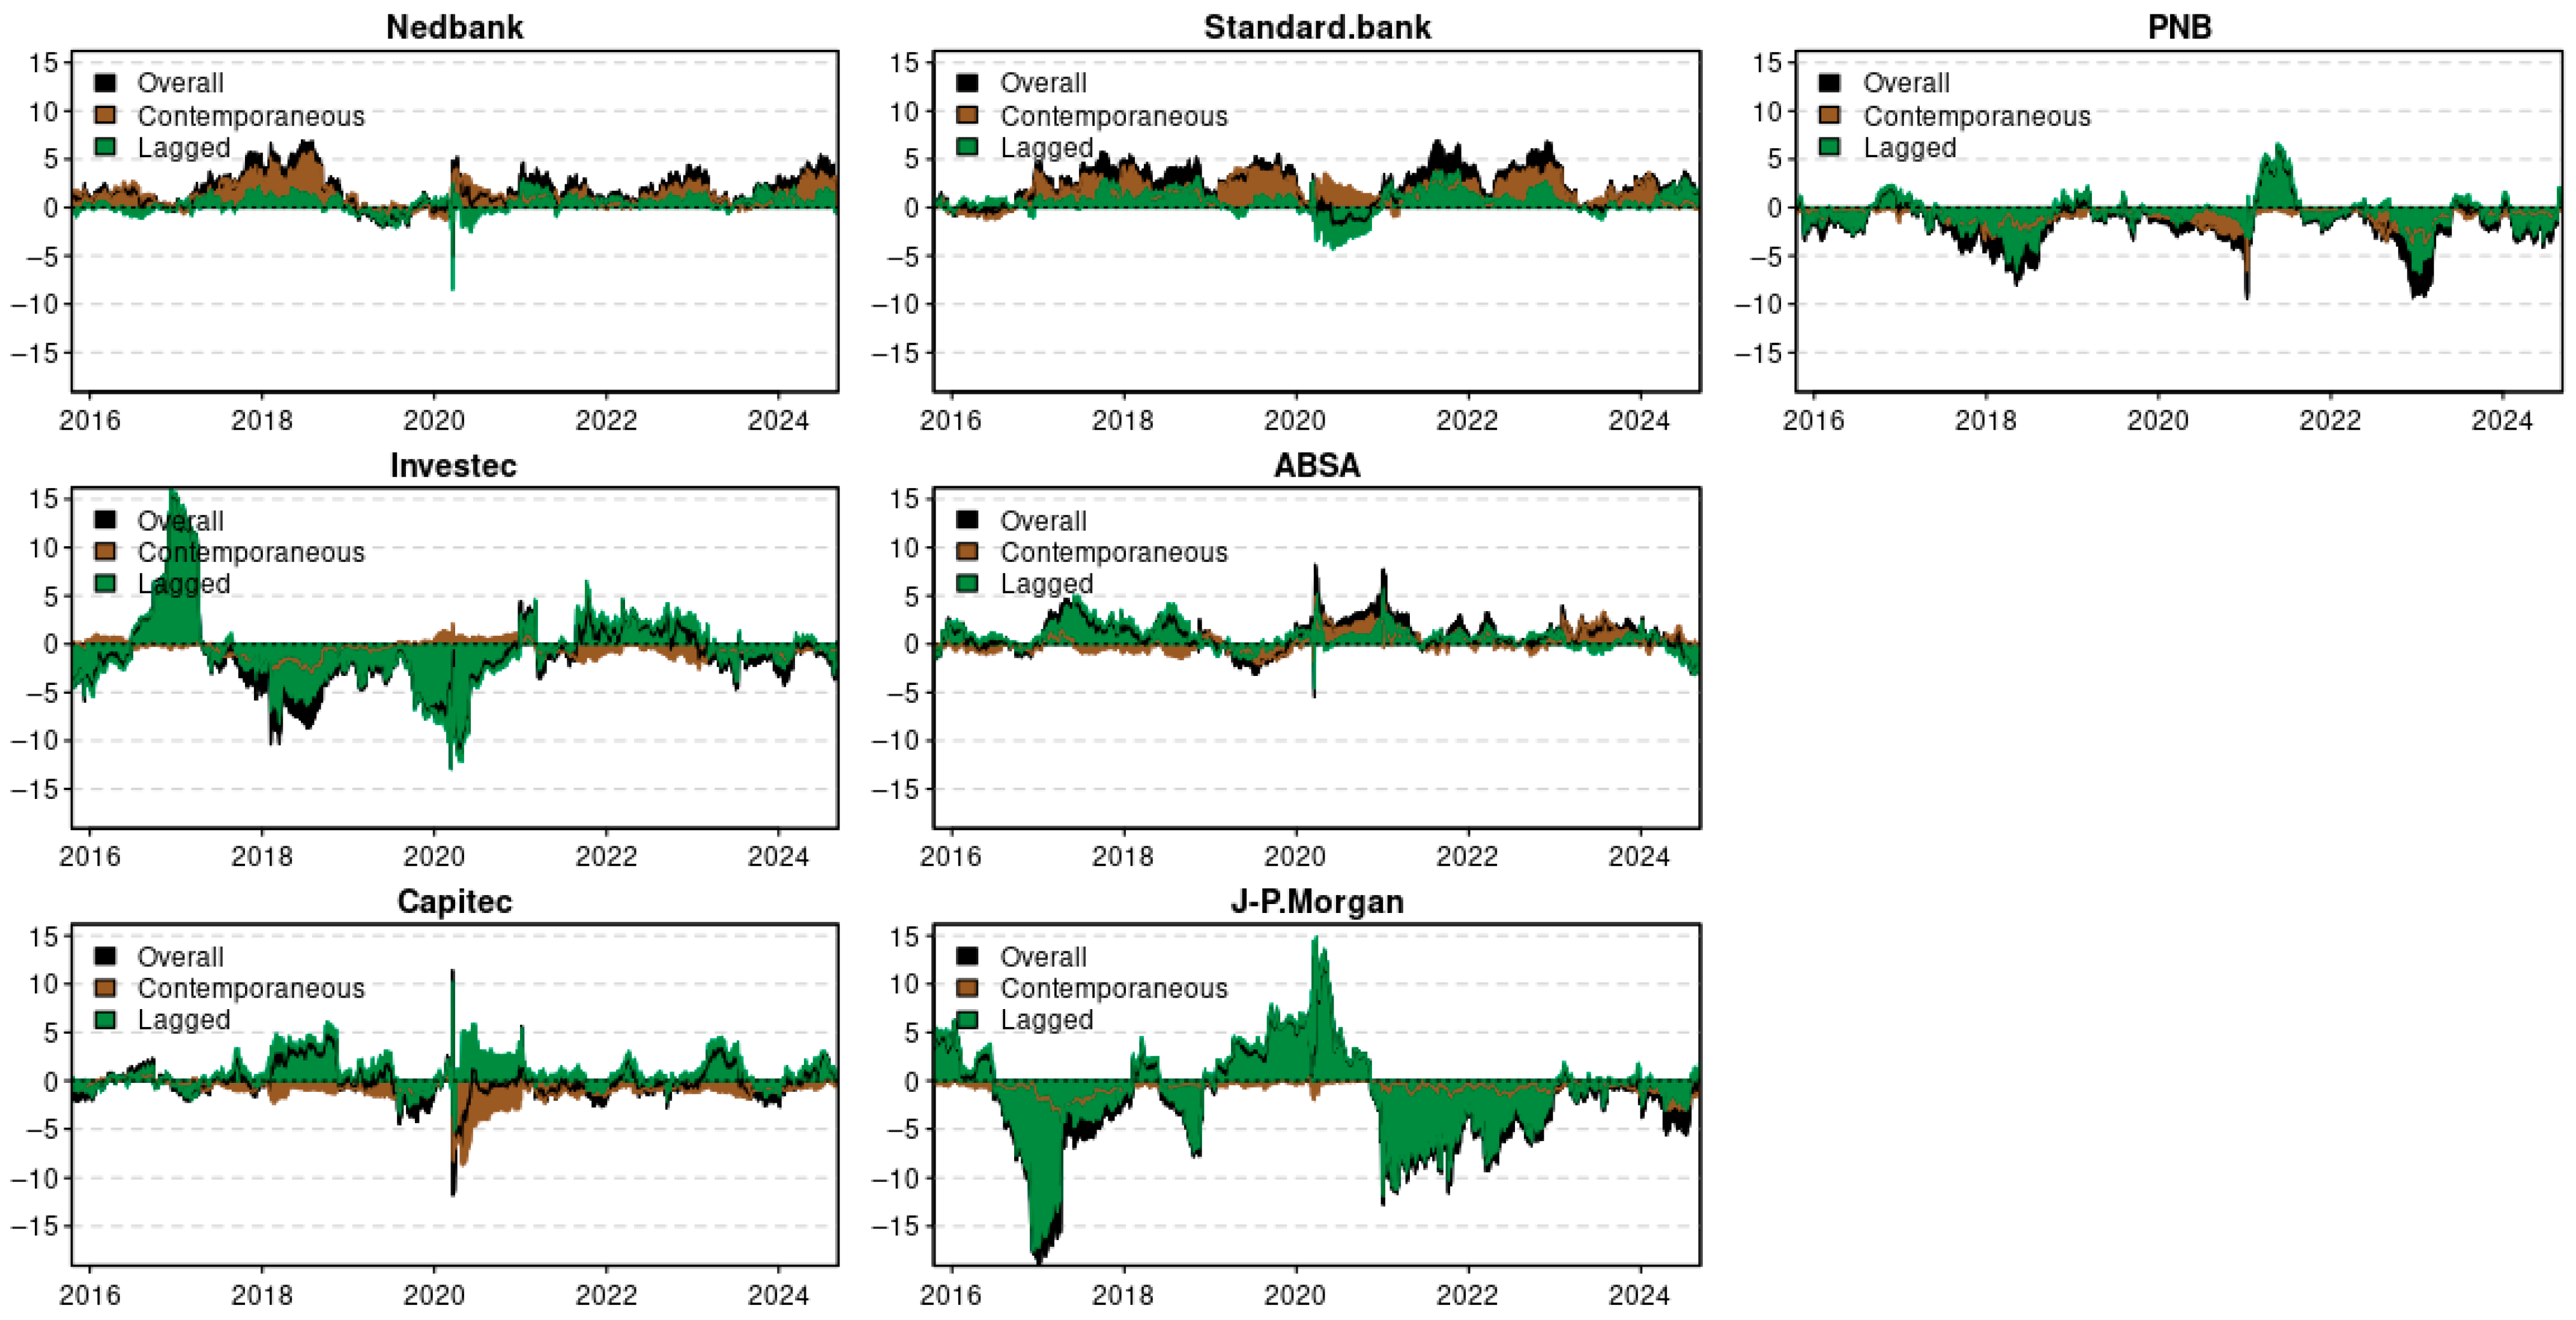
The net total directional connectedness is plotted over time in
Figure 3, with contemporaneous (red) and lagged (green) components distinguished. The graph demonstrates that Standard Bank, Nedbank and ABSA continuously function as a net transmitter, particularly during periods of systemic stress, although Nedbank and Standard bank became net receivers of lagged spillovers in 2019 and 2018, respectively, and ABSA a net receiver of both spillovers in 2019. Similar to the average
R2 spillovers, PNB and J.P. Morgan continue to function as net receivers, saving in 2020 and 2021, when they acted as transmitters of lagged spillovers respectively. Investec and Capitec demonstrate a dynamic reconfiguration within the South African banking system by switching between transmitter and receiver roles based on market phases, while Investec switches between transmitter and receiver of contemporaneous, and lagged Capitec mostly acts as a receiver of lagged spillover. This demonstrates that a bank’s role as a net receiver or transmitter of decomposed spillovers is not absolute. For example, a bank can act as a transmitter of lagged spillover and a recipient of contemporaneous spillover at the same time, as demonstrated by ABSA and Capitec in 2020.
Figure 2 further demonstrates that while SA banks are more influential in the propagation of contemporaneous spillover, global banks appear to dominate the transmission and reception of lagged spillover.
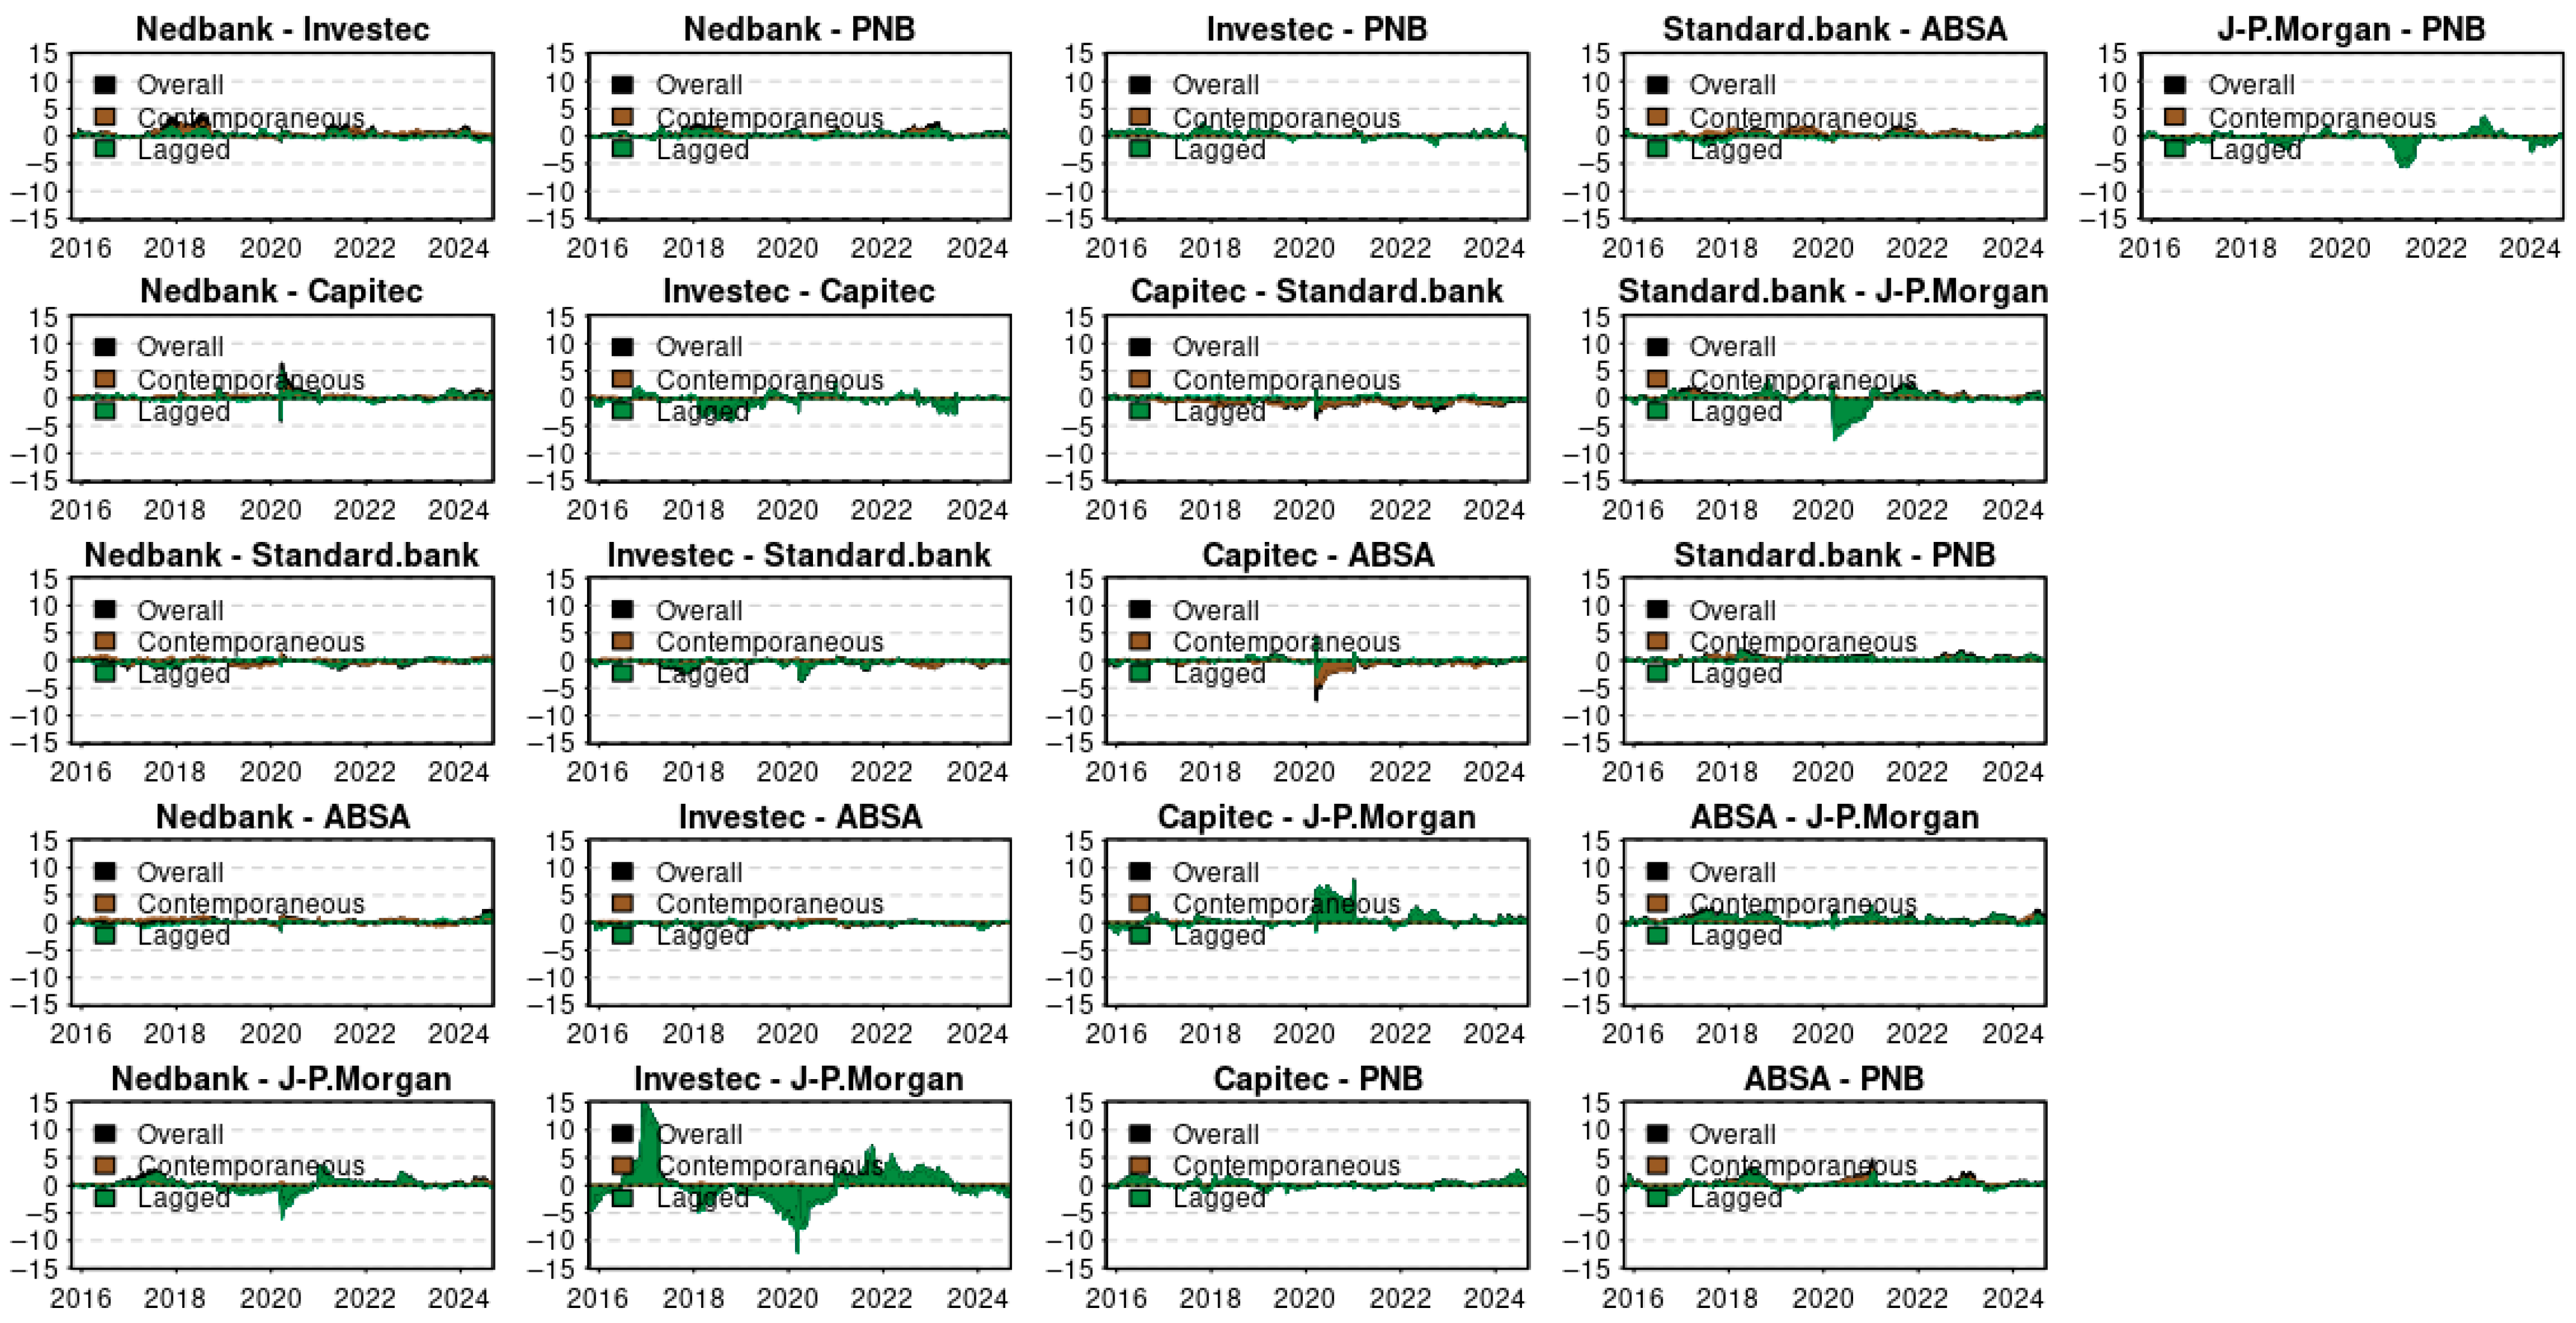
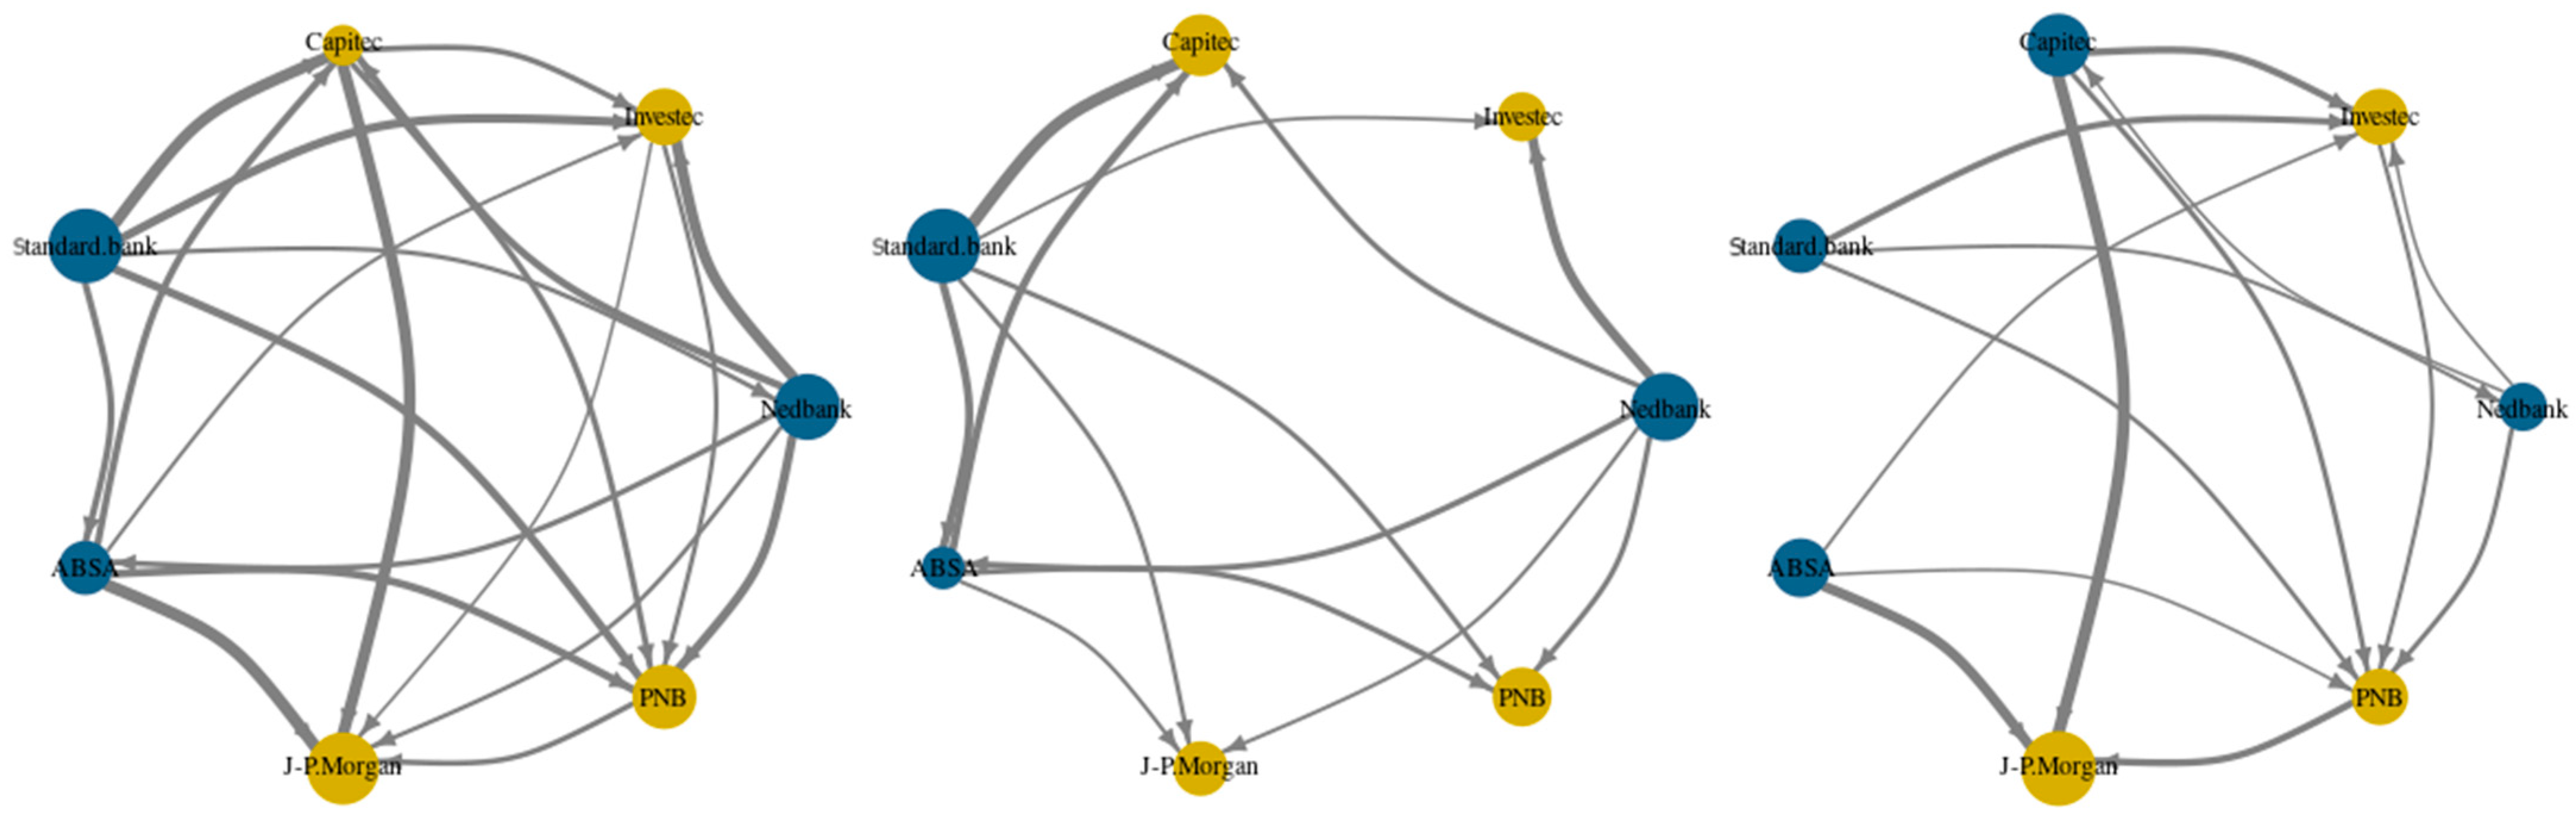
Figure 4 shows the time-varying net pairwise directional connectedness between the global banks and five SA banks decomposed into their contemporaneous and lagged components. Unlike
Figure 2, where contemporaneous spillover dominates in absolute form,
Figure 5 shows that delayed effects are more evident across cross-border relationships and are indicative of a more gradual international transmission mechanism through adjustments such as liquidity rebalancing and funding restrictions. The figure shows that the transmission of both contemporaneous and lagged spillovers among South African banks is peripheral. In this instance, Nedbank and ABSA respectively transmit marginal (contemporaneous and lagged) spillovers to Investec and Capitec in 2018 and 2020; Investec receives marginal lagged spillover from Capitec and Standard bank in 2018 and 2019, respectively; and Nedbank transmits lagged spillover to Capitec in 2020. Focusing on South African banks’ interactions with global banks (J.P. Morgan and PNB), the net-spillover transmitting role of the former was evident in the positive relationship between the pairs over time. While the interaction of South African banks with PNB is insignificant, it is noteworthy that Nedbank, Capitec and Standard Bank’s positive relationship with J.P. Morgan was interrupted over 2018–2020 period, a period coinciding with China–U.S. trade tension and COVID-19. Thus, the three South African banks switched from being net transmitters of lagged spillovers (pre-2018) and become net receivers of lagged spillovers, in receiving more significant shocks during COVID-19 in 2020, before reversing roles thereafter. Relative to the other SA banks, Capitec poses more significant lagged spillovers to J.P. Morgan during COVID-19. Overall,
Figure 5 shows that South African banks are more exposed to higher spillovers from global banks during crises than the global banks are from their local counterparts.
Koziol (
2022) argues that “the characteristic of the South African banking system to be highly concentrated has a positive absorptive effect on financial system stability”. Further, the relatively high exposure to global banks is consistent with
Koziol (
2022), who submits that South African banks are more sensitive to international shocks (cross-border) than internal spillovers, showing significant vulnerability to shocks from outside the country.
This figure indicates significant asymmetries in directional roles. Standard Bank has emerged as the net transmitter over most bilateral relationships and has strong outward spread effects. Meanwhile Nedbank and ABSA exhibit behaviors that vary according to market conditions (transmitter/receiver). In contrast, J.P. Morgan and BNP Paribas are still to a greater or lesser extent net receivers, absorbing shocks from the system. On the whole, the network shows a strong core–periphery dynamic structure in which national banks are transmission providers and global banks are more absorptive.
Figure 5 further visualizes the network topology, where node size represents the magnitude of net connectedness and edge thickness reflects transmission strength. The topology displays a core–periphery structure, with Standard Bank and Nedbank at the core, surrounded by domestic peers and connected via thinner cross-border links to J.P. Morgan and PNB. This structure echoes findings by
Billio et al. (
2012) and
Muñoz Mendoza et al. (
2024) that systemic banking networks feature concentrated hubs, the influence of which dominates during crises.
5. Discussion
The empirical results highlight a clear distinction between information-driven (contemporaneous) and liquidity-driven (lagged) transmission among banks. The dominance of contemporaneous connectedness (≈41%) supports the view that modern financial markets are increasingly synchronized through digital information flows, cross-listings, and investor arbitrage (
Diebold & Yilmaz, 2014;
Gong et al., 2019). In such an environment, bank stock prices rapidly incorporate global news, macroeconomic data, and risk sentiment. However, the persistence of lagged spillovers, especially during stress episodes, confirms that not all contagion occurs instantaneously. Liquidity channels, counterparty exposures, and balance-sheet adjustments introduce temporal frictions that propagate shocks over subsequent trading days (
Brunnermeier & Pedersen, 2009). The
R2-decomposition effectively disentangles these layers, providing empirical validation of theoretical contagion models that emphasize both rapid information diffusion and delayed financial adjustments.
The identification of Standard Bank and Nedbank as net transmitters underscores their systemic importance within the South African banking network. Their scale, diversification, and international linkages make them pivotal in regional financial stability. In contrast, the status of J.P. Morgan and PNB as net receivers suggests that during this period, emerging-market developments occasionally influenced advanced-economy banks, a reversal of traditional contagion direction (
BIS, 2024). This could reflect portfolio rebalancing behavior, where investors hedge developed-market exposures using emerging-market instruments, thereby reversing causality in short horizons.
These findings align with, yet also extend, previous research.
Diebold and Yilmaz (
2014) and
Baruník and Křehlík (
2018) observed that financial connectedness intensifies during crises and is predominantly contemporaneous. Our results corroborate this temporal asymmetry but introduce geographic nuance: South African banks exhibit strong domestic contagion yet limited global transmission. This contrasts with European and U.S.-based studies (e.g.,
Billio et al., 2012;
Muñoz Mendoza et al., 2024), where large banks dominate both domestic and cross-border spillovers. Significant intra-market co-movement between South African banks was discovered by
Nyakurukwa and Seetharam (
2024), without decomposing timing effects. This study adds to that literature by using the
R2 framework to demonstrate that these co-movements are primarily contemporaneous and driven by information flows rather than delayed liquidity mechanisms. The Johannesburg Stock Exchange (JSE) appears to maintain high informational efficiency even during turbulent times, as evidenced by the modest lagged transmission, which contrasts with evidence from less-liquid markets (
Bonga-Bonga, 2018).
The evidence in
Figure 5 also reinforces the asymmetric architecture of the shock transmission in the banking network. Based on the connection of directions and relationships, Standard Bank is revealed to be the major transmitter of shocks, while J.P. Morgan and BNP Paribas are the main receivers; this confirms that local South African banks are at the center of driving return spillovers in the banking sector. This trend favors the core–periphery structure seen primarily in financial networks, with a few large banks serving as contagion hubs and others acting by absorbing situations associated with shocks (
Billio et al., 2012;
Muñoz Mendoza et al., 2024). Besides, the stronger contemporaneity components of spillovers imply that transmission occurs through the dissemination of certain information at fast speeds, like investors’ sentiment, news dissemination and market arbitrage, in line with
Diebold and Yilmaz’s (
2014) connectedness frameworks and the
R2-decomposition-produced evidence of
Gong et al. (
2019). The smaller lagged spillovers suggest that delayed channels related to liquidity pressure and portfolio adaptations continue to be a driver of shocks, especially with the intensity of market distress (
Brunnermeier & Pedersen, 2009). These implications illustrate the systemic role of large domestic banks in determining financial stability at the regional level, but also the incomplete integration of South African banks with other international commercial banking institutions.
By confirming the
R2-decomposed connectedness framework in a cross-border banking setting, this study makes a theoretical contribution. It provides empirical support for the claim made by
Gong et al. (
2019) that different propagation mechanisms—information assimilation versus market adjustment—are captured by contemporaneous and lagged co-movements. Furthermore, it illustrates how the two mechanisms work together, with the balance changing in times of crisis. Additionally, the results support the core–periphery paradigm in financial networks (
Muñoz Mendoza et al., 2024;
Glasserman & Young, 2015). In the South African banking system, Standard Bank and Nedbank are at the center, with Capitec, Investec, and ABSA in the middle. The peripheral connections between J.P. Morgan and PNB via international channels raise the possibility that cross-regional transmission may not always be dominated by global systemic banks, particularly when emerging-market subsystems are the focus.
The prevalence of contemporaneous connectedness in the majority of the sample is consistent with international research by
Diebold and Yilmaz (
2014);
Baruník and Křehlík (
2018); and
Gong et al. (
2019); which highlighted that information spillovers in financial markets typically occur instantly under normal circumstances. However, the temporal decomposition also showed that during crises, especially the COVID-19 shock in 2020 and the banking crisis in 2023, lagged connectedness increases. As funding conditions tighten, interbank exposures are reevaluated, and liquidity positions are gradually rebalanced; this implies that markets undergo delayed adjustments during times of stress (
Brunnermeier & Pedersen, 2009;
BIS, 2024). Thus, contemporaneous connectedness dominates in stability, while lagged connectedness rises in instability, a pattern consistent with theoretical models of contagion that distinguish between rapid information contagion and slower financial contagion.
6. Conclusions
In this study, the temporal and directional characteristics of the dynamics of return transmission across the top South African banks and two global banks were investigated during peaceful and turbulent times (the COVID-19 pandemic, the Russia–Ukraine conflict, and the 2023 banking crisis), using daily data from January 2015 to September 2024. The findings provide several significant conclusions. The study concludes that interconnectedness, not idiosyncratic factors, accounts for almost half of the variance in bank returns, as revealed by the average TCI of 44.14 percent. By establishing that lagged effects (3.22%) are subordinated to contemporaneous effects (40.92%), the study concludes that information transmission across the banking system is predominantly instantaneous, driven by fast-moving news channels, market sentiment, and investor behavior, in line with the principles of informational efficiency. However, the presence of non-trivial lagged connectedness indicates that certain spillovers persist beyond immediate trading days, reflecting slower adjustment processes effected through liquidity, funding, or behavioral channels.
We conclude that, according to the results of the dynamic connectedness analysis, notable periods of local, regional, and worldwide financial stress spurred significant increases in total, contemporaneous, and lagged connectedness in absolute form. These include the South African political and financial turmoil in 2016, the COVID-19 pandemic in 2020, the Russia–Ukraine war in 2022, and the U.S.–Swiss banking crisis of 2023. When individual and pairwise connectivity are considered, we conclude that lagged spillover transmission among South African banks, and from global banks, was more pronounced in the aftermath of COVID-19.
South African banks, especially Standard Bank, Nedbank and ABSA, which are predominantly net transmitters, and global banks (J.P. Morgan and BNP Paribas), which are dominant net receivers, usually switch roles during crises. This serves to demonstrate that both contemporaneous and lagged spillovers are not constant, but time-varying and context-dependent, and heighten during times of high uncertainty. Thus, the lagged spillovers from J.P. Morgan and BNP Paribas are larger during stress episodes, indicating lagged integration of emerging-market shocks into global portfolios.
In terms of theory, this research contributes by validating the R2-decomposed connectedness approach in a cross-border banking context. It demonstrates that separating contemporaneous from lagged components provides a deeper understanding of how financial contagion works. The study offers a framework that can differentiate between informational and liquidity contagion by combining this decomposition with time-varying connectedness measures. This is a crucial step in gaining a more detailed understanding of systemic risk. By demonstrating that South African banks demonstrate both market sophistication and institutional resilience by displaying strong domestic integration while maintaining some degree of protection from global systemic events, the findings further the body of knowledge on African banking systems. The South African banking sector has experienced strong domestic integration and partial global insulation. Domestic banks belong to a closely coupled core which is closely bound through contemporaneous spillovers, whereas global banks are more absorptive and peripheral in the network. Nevertheless, the cross-border transmission is not negligible and is carried by weaker and lagged channels, indicating a multilayered mode of financial integration.
These empirical trends have important ramifications for portfolio management, policy, and financial stability. Findings of strong contemporaneous spillovers suggest to regulators that crises can spread quickly throughout the South African banking system, leaving little time for reactive action. This emphasizes how proactive macroprudential measures, like dynamic capital buffers and stress testing, are essential for containing systemic vulnerabilities. Lagged spillovers are another sign that delayed contagion through funding markets is still a risk, which is why the South African Reserve Bank (SARB) and international financial authorities must continue to coordinate their liquidity. The study’s conclusions are strategically significant for investors and portfolio managers. Given how quickly shocks spread amongst institutions, the moderate level of contemporaneous integration among South African banks, especially the Nedbank–Investec, Captec–ABSA, and Standard–Absa pairings, points to limited prospects for short-term diversification within the domestic banking industry. South African banks may benefit from lagged spillovers by means of the global banks in the form of international diversification, but the risk mitigation benefits diminish over time.
Only equity return transmission is examined, an approach which accounts for market-based perceptions of interconnectedness but ignores the funding and balance-sheet exposures that really constitute systemic risk. To map contagion more thoroughly, future research could integrate equity data with macroprudential indicators, interbank lending rates, or credit default swap (CDS) spreads. Furthermore, high-frequency or intraday data may reveal the more subtle aspects of contemporaneous transmission that daily data might miss. Finally, FirstRand Bank was excluded from the sample due to the unavailability of data for the period of 2015 to 2024. Future studies must include this bank in the sample when the relevant data is available.