Article

Corporate Governance and Firm Performance: The Role of Capital Structure

School of Business Administration, University of Business and Technology, Jeddah 21361, Saudi Arabia
J. Risk Financial Manag. 2026, 19(5), 324; https://doi.org/10.3390/jrfm19050324
Submission received: 31 January 2026 / Revised: 8 April 2026 / Accepted: 17 April 2026 / Published: 29 April 2026
(This article belongs to the Section Applied Economics and Finance)

Abstract

The current study explores how corporate governance affects firm performance. It also examines the link between corporate governance and firm performance within capital structure, focusing on how financing decisions may moderate this relationship.—This analysis covers 215 non-financially registered firms listed on the Pakistan Stock Exchange from 2010 to 2022. To assess the quality of governance in these sample firms, a governance index incorporating 29 provisions is utilized. In addition, the book value of the debt-to-equity ratio determines the capital structure, whereas ROA and ROE serve as indicators of business performance. The methodology relies on panel data techniques, specifically the Fixed Effects Model and Random Effects Model, as determined by the Hausman test. Furthermore, multiple additional tests are conducted to verify the robustness of the analysis. Regression analysis shows that corporate governance significantly increases profitability (i.e., ROA and ROE), while capital structure significantly decreases it. Furthermore, when examining the capital structure’s moderating effect, the results indicate that the interaction variable significantly enhances firm performance. Still, it is more significant in terms of ROA than ROE, suggesting that market participants consider leverage not a good disciplinary mechanism, as high leverage introduces financial risk and obligations (such as interest payments) that can reduce firms’ ability to translate good governance practices into performance. Interactive variables have a weaker effect on profitability, as measured by ROE. Furthermore, these findings are more prevalent in larger, higher-level, and better-governed firms. The study’s findings could help lenders assess a company’s governance structure before making financial decisions. Similarly, investors should examine the quality of corporate governance and the company’s capital structure decisions. Managers should be extremely cautious when deciding how much long-term debt to include in their capital structure. The study indicates that capital structure plays an additional role in how corporate governance affects a company’s performance. This role is not often explored in research, especially in emerging markets.

1. Introduction

Corporate governance (CG) has become a central issue for firms and stakeholders in today’s global economy. The Organization for Economic Cooperation and Development (OECD) principles of corporate governance (OECD, 2004) define CG as a framework for setting an organization’s goals and strategies, along with the means to achieve them. CG specifies the processes, policies, regulations, and laws established by regulatory authorities to protect stakeholder interests while pursuing organizational objectives. It balances the interests of shareholders and other stakeholders within a firm. Contemporary research on CG is divided into internal and external governance mechanisms (Walsh & Seward, 1990). Internal governance includes the firm’s ownership structure, board composition, and executive compensation policies. In contrast, external mechanisms encompass audit fees, auditor quality, independent directors on boards and audit committees, and external holdings (Schäuble, 2019).
Numerous scholars have researched the impact of CG quality on firm performance (FP) globally. Many researchers have found a direct link between the CG mechanism and FP (e.g., Bhagat & Bolton, 2019; Gutiérrez-Ponce et al., 2022); others have shown no significant impact of CG on FP (Akbar et al., 2016). As a result, the effects of CG on FP are inconsistent, which could be explained by various factors, including firm-specific characteristics (Cuomo et al., 2016). Baron and Kenny (1986) propose the indirect moderator variable as a potential explanation for discrepancies in the relationship between the dependent and independent variables. According to Cuomo et al. (2016) and Song et al. (2020), the applicability of a CG system is dependent on several critical firm-related criteria (for example, capital structure).
Moreover, as CG systems aim to mitigate agency costs, examining their impact on firm value in isolation yields an imperfect understanding (Tripathi et al., 2024). Corporations exist to generate shareholder wealth and sustainability, and increasing this wealth requires investments in growth-oriented, value-enhancing, long-term projects and acquisitions. Extensive investments targeting organic and inorganic growth necessitate periodic financing. As a result, capital structure (CS), or leveraged funding, is important to the company’s goal of increasing shareholder wealth. Alexandridis and Hasan (2020) reported that CS decisions remain among the essential corporate decisions made by executive managers of firms. According to Danso et al. (2021), incorrect CS decisions can significantly impact a firm’s cost of capital, riskiness, and performance. In an organization, the separation of Ownership and management creates agency problems, as each party has its own set of trust (Nasr & Ntim, 2018). Morellec et al. (2012) narrated that agency problems have first-order effects on corporate policies and important value consequences. Agency theory posits that a corporation may acquire debt to enforce necessary discipline over board affairs and managerial activities, as well as to reduce agency costs between shareholders and managers (Tripathi et al., 2024). In other words, debt issuance involves covenants that require the firm to enhance value through judicious board monitoring and coordinated managerial activities. Therefore, exploring the effect of leverage (CS) can yield novel insights, as the existing literature has primarily examined the influence of CG mechanisms on FP in isolation. In summary, CS can minimize agency costs (Jensen & Meckling, 1976), whereas CG is designed to alleviate agency difficulties; consequently, both CG and CS are linked by their relationship to agency costs (Muhammad et al., 2021), which is associated with managers having access to free cash flows (Jensen, 1986).
Based on the previous explanation, CS can significantly influence the link between CG practices and their possible effects on FP by reducing or alleviating agency problems. Nonetheless, limited research has examined the influence of CS as a moderating variable in the CG-FP relationship, underscoring the need for further investigation of this association. To the best of the author’s knowledge, only two studies, namely Mansour et al. (2022) and Tripathi et al. (2024), have examined the moderating effect of CS on the link between CG and FP. Muhammad et al. (2021) contend that corporate financial decisions about CS are becoming increasingly vital to the firm’s survival and Development. Due to poor CG systems, businesses in developing nations rely primarily on debt to pay for their CS, which can lead to financial instability and limit their ability to invest in sustainable practices. The present study aims to address the following research inquiry: How does CG affect a firm’s performance? What effect does CS have on a FP, and how does CS moderate the association between CG and a FP?
There are several ways in which this study is different from those of Mansour et al. (2022) and Tripathi et al. (2024). Mansour et al. (2022) examined how CS affected the relationship between CG and firm FP in 95 non-financial firms listed on the Amman Stock Exchange. The CG index rates the quality of CG and is made up of three parts: disclosure and transparency, board efficiency and composition, and shareholder rights. Following the research by M. S. Nazir and Afza (2018) and M. Farooq et al. (2022), we evaluated CG quality using a CG index comprising 29 governance needs, including audit committees, board committees, remuneration, and ownership structure. Unlike Tripathi et al. (2024), who focused primarily on board processes, our score encompasses all four pillars of CG, underscoring the study’s broad reach and its importance to advancing CG research.
The seminal work of La Porta et al. (1998, 2000) established the basis for comparative corporate governance studies by highlighting the significance of legal origin, investor protection, and institutional Development in influencing governance frameworks across nations. Their findings indicate that variations in legal regimes substantially affect ownership concentration, investor protection, and financial Development. This study investigates corporate governance practices in an emerging market, where institutional contexts differ significantly from those in industrialized nations.
We chose Pakistan as an emerging economy for this study for various reasons. In response to international pressure for reforms in capital market governance, Pakistan has enacted several reforms, including new legislation to enhance the stock market liberalization framework and the Development and implementation of CG regulations. Secondly, the actual components of the corporate environment in Pakistan markedly diverge from the CG structure, which is less developed than those employed in industrialized nations, rendering Pakistan a compelling case study for this research. Third, unlike developed nations, Pakistan’s capital market shows significant concentration. A significant concentration of Ownership often leads to managerial entrenchment (Elghuweel et al., 2017), potentially undermining management conduct and incentives. Managerial entrenchment affects a company’s debt structure and is negatively correlated with debt specialization (Tut, 2023). Claessens et al. (2000) argued that wealth concentration may have negatively affected the establishment of legal and institutional frameworks for CG, as well as the conduct of economic activity. According to Rodríguez Valencia (2025), ownership concentration plays a key role in determining corporate value, underscoring the importance of operational effectiveness and shareholder oversight. Finally, due to its preference for bank loans over equity and its relatively underdeveloped stock market, Pakistan is a deeply indebted country with highly leveraged firms. These characteristics offer opportunities to explore various CG and CS dynamics within Pakistani enterprises.
Additionally, Pakistan provides a unique institutional setting for studying the relationship between CG and CS. Unlike many established economies, Pakistan has concentrated ownership structures, family-owned businesses, and generally weaker enforcement of governance systems. Firms also rely largely on bank-based financing due to the underdevelopment of equity markets. These characteristics create a distinct environment in which CS decisions and governance mechanisms differ from those in developed economies. As a result, our study adds to the literature by presenting findings from a setting where agency conflicts, financial restrictions, and institutional inefficiencies are more prevalent.
To achieve the research objectives, the final sample comprised 215 non-financial firms listed on the Pakistan Stock Exchange (PSX) from 2010 to 2022. This resulted in 2795 firm-year observations. CG quality was assessed using a governance index constructed from 29 provisions, including audit committees, board committees, pay structure, and ownership structure (M. S. Nazir & Afza, 2018; M. Farooq et al., 2022). Details of these provisions are provided in Table 3. FP measures by return on assets (ROA), calculated as net income divided by total assets, and return on equity (ROE), calculated as net income divided by shareholders’ equity. The CS of sample firms was defined as the ratio of total debt to total equity, both measured at book value. Panel data analysis utilized fixed-effect (FEM) and random-effects (REM) models, chosen via the Hausman test. To ensure robustness, system-GMM estimation and two-stage least squares (2SLS) were also employed. Additional profitability indicators, such as Tobin’s Q, were also analyzed. The sample was further divided by firm size, leverage, and governance level. The results show that CG has a significant positive impact, while CS has a significant negative impact on both profitability measures. The interactive variables show a significant positive impact on profitability, with a stronger effect on ROA than ROE. These findings are more pronounced in larger, highly leveraged, and better-governed firms. The results are guiding lawmakers, shareholders, and other non-financial stakeholders in Pakistan, potentially enhancing CG and financial decision-making outcomes.
The rest of this paper is organized as follows. Section 2 reviews the literature. Section 3 outlines the research methodology. Section 4 details the results and analysis. Section 5 provides the summary and conclusion

2. Literature Review

2.1. Corporate Governance and Firm Performance

According to the literature, effective CG practices can contribute to the following: promoting effective firm management, attracting investment, reducing debt costs, enhancing competitive advantage, and improving overall performance. In addition, they can contribute to long-term economic Development by safeguarding investors’ rights and fostering confidence in financial markets (Sarhan et al., 2019). Furthermore, effective governance is considered a fundamental requirement by numerous stakeholders (Ananzeh et al., 2022).
The majority of research has concentrated on specific CG instruments, including board attributes (Saidat, 2018), disclosure and transparency (Kamal Hassan, 2012), audit committees (Kallamu & Saat, 2015), and ownership structure (Anum Mohd Ghazali, 2010). However, research suggests that rating CG based on specific mechanisms may have a different effect than rating it based on overall quality (Brown & Caylor, 2009), warranting further exploration in this area. Using a CG Index as an assessment tool to measure governance in firms addresses the problem of an insufficient overall governance system, particularly in developing countries. It can encourage firms to establish optimal governance mechanisms to strengthen stakeholder relationships (Chang et al., 2015). The basic idea behind CG Index is that it can adequately depict the overall CG quality (Nerantzidis, 2018).
The CG Index has been employed in a limited number of studies to evaluate the character of governance and its influence on FP. Arora and Bodhanwala (2018) developed the CG Index for the Indian market by analyzing board and ownership structures, market competitiveness, and demand for corporate control. The research spans 2009 to 2014 and comprises 407 businesses listed on the Bombay Stock Exchange. The study employs random-effect estimation, revealing a significant positive correlation between the CG and FP. In a similar vein, M. Farooq et al. (2022) and M. S. Nazir and Afza (2018) use a sample of PSX-listed firms to examine the influence of CG quality on firm performance. Using the CG Index, they evaluated the governance quality of the sample firms and found that CG quality had a positive impact on FP. Likewise, Bhatt and Bhatt (2017), Mansour et al. (2022), and Shahwan (2015) examined Malaysian, Amman, and Egyptian enterprises, respectively, and identified a positive correlation in Malaysian and Amman firms, but a non-significant correlation in Egyptian firms.
Kaur and Vij (2018) used the CG Index to investigate the relationship between CG and the FP of Indian banking organizations. The regression analysis shows that the CG Index has a significant positive association with the FP of Indian banks, as measured by ROA, Tobin’s Q, and EVA. Based on the discussion, we formulated the following hypotheses:
H1. 
Corporate governance positively affects the financial performance of PSX-listed firms.

2.2. Capital Structure and Firm Performance

A company’s CS relates to how it finances capital investments and operations using a combination of liabilities and equity. The CS can act as a disciplining mechanism by limiting managers’ freedom of action when dealing with free cash flow (Jensen, 1986). The Miller and Modigliani (MM) theorem states that, in a tax-free market, the CS has no effect on the firm’s value or performance, known as the M&M CS argument. On the other hand, Miller and Modigliani’s second theorem holds that, when corporate taxes are taken into account, debt financing enhances firm value because the interest expense is tax-deductible in proportion to its significance. As a result, costs are reduced, and business value increases (Acharya & Heje Pedersen, 2019). Ross’s (1977) research has also demonstrated that an increase in debt levels sends a positive signal to the market because investors believe that the company can take on debt and repay it.
According to Gill et al. (2011), a greater leverage ratio is associated with better FP because it reduces agency costs and prompts management to prioritize shareholder interests. According to Ethiopian economist Ayalew (2021), leverage positively affects a firm’s success. Abor (2005) explored the connection between the profitability of Ghanaian-listed companies and their CS. Their findings indicate that ROE is strongly and positively associated with the short-term debt-to-assets ratio. In contrast, the long-term debt-to-assets ratio is negatively correlated with ROE. Similarly, Nirajini and Priya (2013) discovered a strong correlation between FP and CS in Sri Lankan firms. Berger and Di Patti (2006) discovered a positive correlation between increasing leverage and profit efficiency in the US banking industry. Elmagrhi et al. (2018) examined the association between CS and FP in a sample of UK NGOs and found that CS significantly improves the performance of UK charitable organizations.
Several studies have found a negative correlation between CS and a firm’s FP. Jaiswal and Elmarzouky (2025) used a sample of 516 UK enterprises to study the influence of CS on FP from 2018 to 2023. According to the FEM, leverage is negatively related to ROA and EPS, which supports the pecking-order and agency-cost arguments. Musah (2018) examined 23 Ghanaian banks and found that changes in financial leverage may detrimentally affect stock price. Similarly, King and Santor (2008) reported a negative relationship between CS and FP in Canadian enterprises. Furthermore, Shubita and Alsawalhah (2012) indicated that profitable businesses rely more on equity as their main funding source, highlighting a negative relationship between CS and FP. Likewise, Zeitun and Tian (2007) studied Jordanian business performance, finding that a company’s debt ratio negatively and significantly affects ROA and Tobin’s Q, while the short-term debt-to-total assets ratio significantly and positively affects Tobin’s Q.
Boubakri and Ghouma (2010) stated that, in emerging markets, the majority of enterprises exhibit greater ownership concentration. These increase the likelihood of expropriation from majority stockholders, which can lead to negative consequences for minority shareholders and overall CG. Furthermore, dominant stockholders typically pick managers from within their families. These firms prefer debt over equity financing because they are concerned about diluting their ownership rights. Assuming bondholders anticipate such conduct, they will demand a larger premium, resulting in a higher loan cost and minimum profitability.
Nevertheless, Connelly et al. (2012) contend that there is no correlation between CS and FP. They contend that increasing debt levels may subject companies to creditor supervision, leading highly leveraged companies to outperform low-leveraged enterprises. In the same vein, Chadha and Sharma (2015) investigated the relationship between CS and FP of Indian manufacturing enterprises and determined that CS does not affect ROA or Tobin’s Q. Taking into account the theoretical foundations and empirical evidence, particularly within the Pakistani context, we propose the following second hypothesis:
H2. 
Higher financial leverage (i.e., higher debt-to-equity ratio) negatively affects the financial performance of PSX-listed firms.

2.3. Corporate Governance, Capital Structure, and Firm Performance

Introducing moderation variables into models is increasingly widely used in the social sciences to enhance understanding of the causal link between variables (Wu & Zumbo, 2008). In this context, since corporate financial decisions are believed to be crucial to the relationship between CG and FP, many researchers suggest examining how CG and FP are connected while also considering specific firm characteristics, such as CS. Building on this, many academics emphasize the need to clarify how CS and CG together contribute to improved FP, highlighting their complementary relationship (Dimitropoulos, 2014).
The literature demonstrates that CG can mitigate agency issues and safeguard minority shareholders from expropriation by managers and controlling shareholders (Khan et al., 2020). Furthermore, Khan et al. (2020) assert that effective CG practices are principally concerned with reducing corporate failure and facilitating the acquisition of capital at reduced cost in emerging markets. Consequently, it is widely acknowledged that firms with superior CG are associated with higher firm value and accounting profitability (Claessens & Yurtoglu, 2013; Gompers et al., 2003), indicative of a lower cost of capital (Khan et al., 2020). Huang et al. (2025) consistently observe a substantial negative correlation between CG and CS in a sample of 1723 Taiwanese listed firms, encompassing 11,940 firm-year observations from 2017 to 2024. These findings indicate that the quality of the CG is inversely correlated with CS.
In addition to CS, the recent literature underscores the significance of financial smoothing and payout sensitivity as complementary governance instruments. E. C. Hoang and Hoxha (2015) contend that firms modify their payout policies in response to financing decisions, hypothesizing that payout sensitivity is indicative of the quality of governance and financial discipline. Firms with more robust governance structures are more likely to demonstrate consistent, transparent compensation behaviour, thereby promoting investor confidence. Moreover, E. Hoang and Hoxha (2019) illustrate that corporate payout policies differ across governance regimes, underscoring the influence of institutional environments on financial decision-making. Given the potential for weakened external monitoring mechanisms in emerging markets, payout policies are even more crucial as indicators of firm quality.
The notion of payout smoothing provides greater insight into how companies manage financial stability and governance. E. Hoang and Hoxha (2019) and E. C. Hoang and Hoxha (2021) demonstrate that companies frequently uphold consistent and foreseeable payout patterns to mitigate uncertainty and convey long-term financial stability. This behaviour can reduce information asymmetry and act as an implicit promise to shareholders. This viewpoint is especially pertinent in the context of concentrated ownership structures, as emphasized by Faccio et al. (2001), where the risk of expropriation by controlling shareholders is heightened. In these situations, consistent distribution practices and judicious financial management serve as protections for minority investors.
Together, CS, payout sensitivity, and financial smoothing should not be considered in isolation, but rather as interconnected governance mechanisms. How firms manage agency conflicts, allocate resources, and signal credibility to the market is jointly influenced by these instruments. In this regard, this investigation situates CS within a broader governance framework, in which its interaction with firm performance indicates the efficacy of complementary governance practices and financing decisions. Based on this integrated framework, this study argues that the impact of CG on firm performance is conditioned by financial policies, particularly capital structure, which operates alongside payout-related mechanisms in shaping firm outcomes.
Based on this integrated framework, this study argues that the impact of CG on FP is conditioned by financial policies, particularly CS, which operates alongside payout-related mechanisms in shaping firm outcomes.
The interactions between CG quality and governance mechanisms such as CS have been disregarded in previous studies, even though this variable offers a potential pathway to a more nuanced understanding of the causal relationship between CG mechanisms and FP, particularly given the ambiguous empirical findings (Burks et al., 2019). CS can affect the direction and magnitude of the impact of CG quality on corporate performance. Akbar et al. (2016) strongly supported the use of CS as a governance instrument, citing its potential to improve organizational performance and enhance governance effectiveness. CS, like CG, may reduce agency costs by aligning stakeholders’ interests and fostering transparency in corporate practices. This can result in improved decision-making and increased trust among investors and customers. Consequently, the role of CS as a secondary variable necessitates examining its influence on the relationship between CG quality and FP (La Rocca, 2007).
According to Ronoowah and Seetanah (2023), CG and CS can reduce agency costs arising from managers’ access to free cash flows, thereby lessening the conflict of interest between management and shareholders. The agency theory perspective, which holds that the CS can lower agency costs, provides the foundation for this argument (Jensen & Meckling, 1976). The CS is seen as a way to manage the company because it prevents spending on projects that would lose money, which helps lower the costs associated with free cash flows. Dimitropoulos (2014) states that an ideal CS may limit managers’ ability to manage free cash flows. Harvey et al. (2004) consistently contended that CS serves as a powerful disciplinary mechanism when the CG mechanism is weak.
Managers generally have the exclusive authority to decide on CS (Bokpin & Arko, 2009). However, instead of choosing a CS that maximizes shareholder wealth, managers may select a suboptimal CS that best suits their preferences. By strengthening the alignment between managers’ and shareholders’ interests, effective governance can act as a check-and-balance, reducing the likelihood of this kind of agency problem (Dimitropoulos, 2014). According to Chang et al. (2015), effective CG enables stakeholders and management to engage in trade-offs. However, for CG to be successful, it must prevent management from engaging in opportunistic behaviour, such as selecting a CS that is not optimal. Thus, the optimal CS substitutes CG in minimizing agency conflicts (Jiraporn et al., 2012).
Furthermore, Hodgson et al. (2011) propose that enterprises with more considerable debt can raise their CG standards while lowering their capital costs. Thus, the CS can serve as a means to keep things in check and support other control methods, thereby improving their effectiveness. Additionally, companies can use CS to establish new ways to manage and oversee their operations, thereby preventing conflicts of interest and reducing the costs of monitoring their corporate governance. Based on the previous discussion, we propose the following hypotheses and sub-hypotheses:
H3. 
Financial leverage moderated the relationship between corporate governance and firm performance such that a moderate level of leverage strengthens this relationship, while excessive leverage weakens it.

2.4. Theoretical Framework of the Study

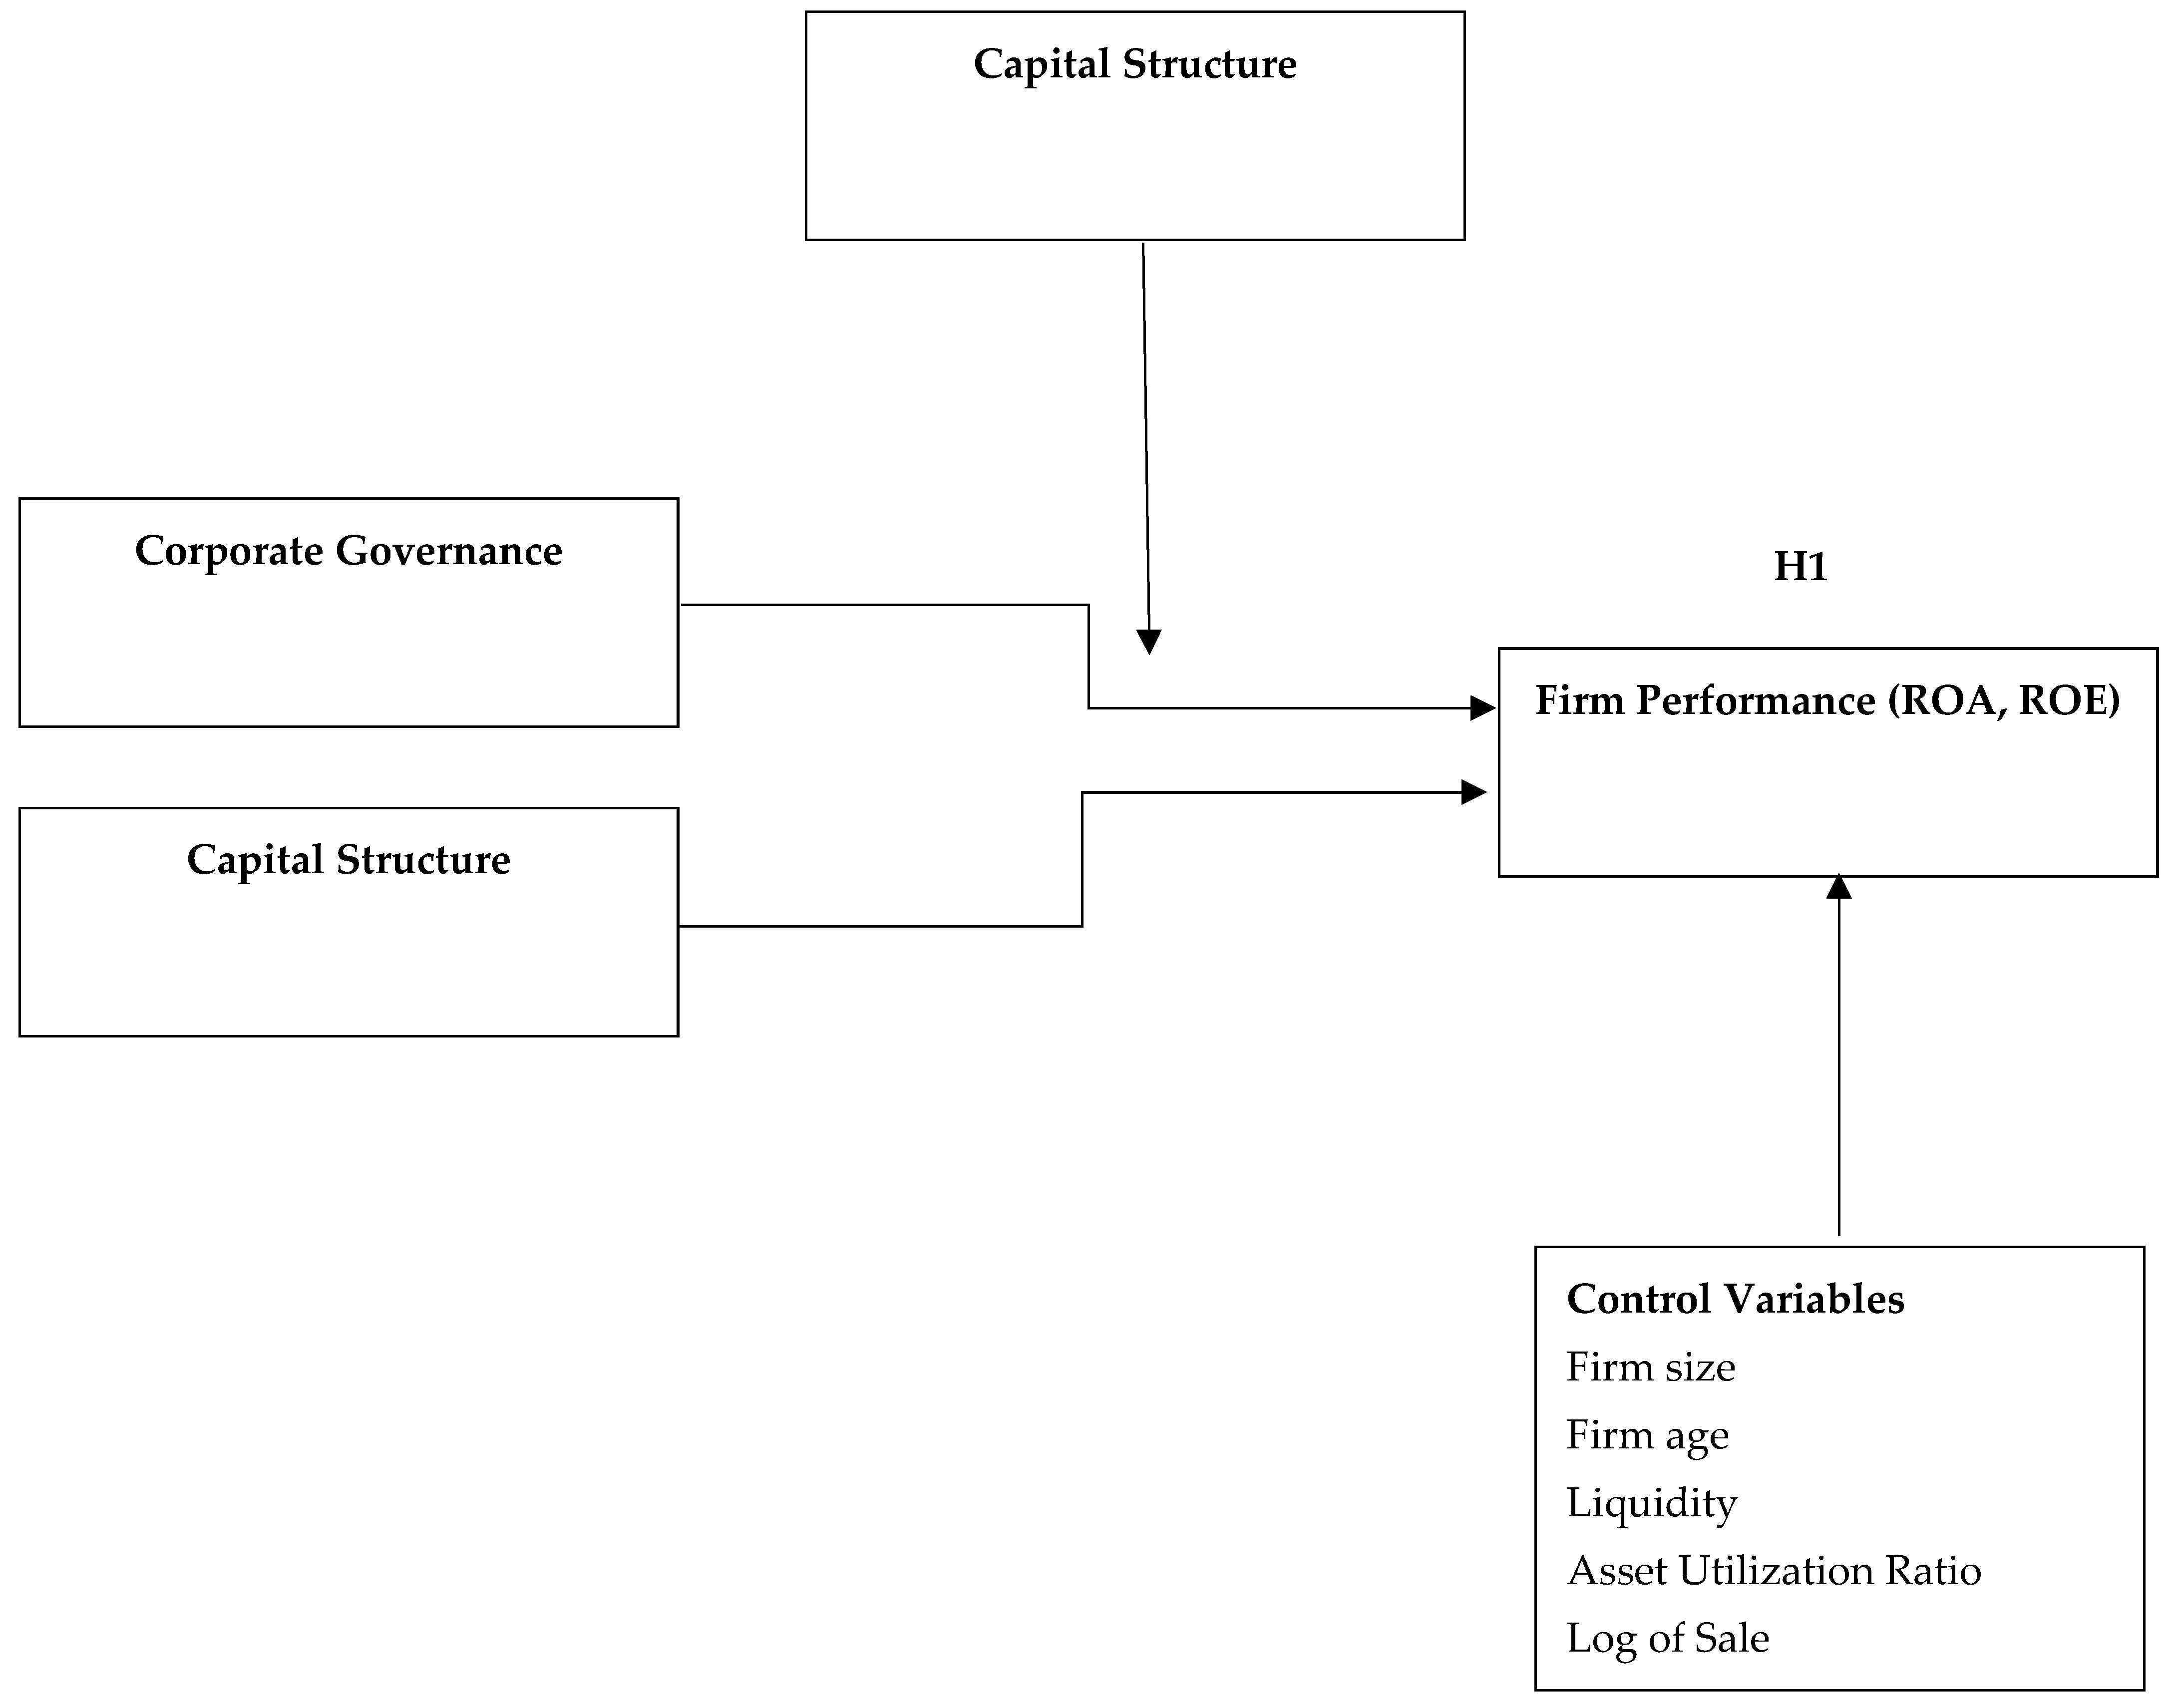
Figure 1 illustrates the conceptual framework of the study derived from a literature review. The arrows indicate the relationship between two variables.

3. Research Design

3.1. Sample and Population

The study covers the period from 2010 to 2022. The primary sample for the study comprises all firms listed on the PSX as of 30 June 2022, totalling 530. 129 financial enterprises were eliminated from the sample due to various accounting and tax laws (Elmagrhi et al., 2016), leaving 401 firms. Furthermore, the analysis did not include ten state-owned enterprises. The study included firms that met several criteria. Each firm operated continuously during the study period. None underwent mergers or acquisitions during this time. The firms remained consistently listed on the Pakistan Stock Exchange (PSX) from 2010 to 2022. Each provided complete data for profitability, capital structure (CS), and corporate governance (CG).
Based on these selection criteria, 176 non-financial firms were omitted from the study. The final sample includes 215 firms, totaling 2795 firm-year observations and representing 41% of the PSX-listed firm population. Comprehensive details of the sample selection are provided in Table 1. To obtain necessary secondary variable data, company annual reports were consulted, along with the State Bank of Pakistan, Securities and Exchange Commission of Pakistan, and business records websites. After data collection, variables were winsorized at the first and 99th percentiles to reduce the influence of outliers.

3.2. Measurement of Variables

3.2.1. Firm Performance

Following the research of M. Farooq et al. (2022), M. S. Nazir and Afza (2018), and Tripathi et al. (2024), we evaluated FP using two proxies: ROA and ROE. We provide more information on how we measured these variables in Table 2.

3.2.2. Corporate Governance

To evaluate how well the sample organizations are governed, we use the studies by S. Nazir (2016), M. S. Nazir and Afza (2018), Ehsan (2019), and M. Farooq et al. (2022) to create a CG Index based on 29 governance provisions covering audit committee, board committee, compensation structure, and ownership structure of the sample firms. Each governance provision in the index is coded so that higher values consistently indicate better governance quality. Continuous variables are converted into binary indicators using the sample median: observations above the median are assigned “1,” and those below the median are assigned “0.” Several provisions in the corporate governance (CG) index are inherently binary and thus are treated as dummy variables. These include variables such as Independent Chairman of Audit Committee (1 = chairman is independent; 0 = otherwise), External Auditor Quality (1 = audited by a Big 5 firm; 0 = otherwise), CEO Duality (1 = CEO also serves as board chair; 0 = otherwise), CEO Dominance (1 = CEO serves on multiple board committees; 0 = otherwise), Blockholders Ownership (1 = largest shareholder owns >10% of shares; 0 = otherwise), and Family Controlled Ownership (1 = family ownership >30% of There is no need for any additional transformations on these variables. The coding is consistent with the governance objective: a “1” value always indicates stronger governance. For provisions with a “1” indicating inferior governance (e.g., CEO duality, CEO domination, and family control), reverse coding is used such that higher values consistently imply superior governance quality throughout all firm-year data. When creating the overall CG index, the dummy variables are added to the median-dichotomized continuous variables. This enables the index to combine both continuous and categorical dimensions of governance into a single, comprehensive measure of governance quality. Dummy variables are incorporated explicitly. This ensures that the CG index accurately assesses governance quality across all firm-year observations. It standardizes values measured on several scales while reducing the impact of outliers. All provisions are weighted equally in the index. This approach prevents subjective bias when attributing differential value to governance provisions, especially in the absence of globally agreed weighting factors. Equal weighting is a commonly established method in CG research that promotes transparency and replication. We realize that dichotomizing continuous variables may lower information granularity. However, this process reduces measurement noise, mitigates the impact of extreme values, and ensures greater comparability, which is especially important in emerging market contexts. Higher governance indexes reflect improved governance quality, and vice versa. The literature contains multiple studies that employed the same technique to calculate the governance index of sample firms (S. Nazir, 2016; M. S. Nazir & Afza, 2018; Ehsan, 2019; M. Farooq et al., 2022). Table 3 covers details about these 29 governance provisions.

3.2.3. Capital Structure

This study examines how CS moderates the relationship between CG and FP. Following Tripathi et al. (2024), CS is defined as the ratio of the total book value of debt to shareholder equity.

3.2.4. Control Variables

Following the literature, we employed numerous control factors that may impact business performance, including firm size, firm age, liquidity, asset utilization ratio, and sales log. Table 3 provides details on how these variables were measured.

3.3. Model of the Study

In the current study, we examined the influence of CG, as quantified by the CG index, on FP, as indicated by ROA and ROE. In addition, we investigated the moderating impact of CS on the performance of this CG-firm relationship, as measured by the debt-to-equity ratio. Initially, we provide an explanation of the econometric model of the CG-FP relationship using the following model:
(Firm Performance)it = β0 + β1CG_Indexit + β2Sizeit + β3Ageit + β4Liqit + β5AURit + β6Saleit + εit
In the second model, we investigated the impact of CS on firm performance through the following model:
(Firm Performance)it = β0 + β1TDit + β2Sizeit + β3Ageit + β4Liqit + β5AURit + β6Saleit + εit
In the third step of the analysis, we explain the moderating impact of CS on this CG-firm performance relationship through the following model:
(Firm Performance)it = β0 + β1CG_Indexit + β2TDit + β3CG_Indexit × TDit + β4Sizeit + β5Ageit + β6Liqit + β7AURit + β8Saleit + εit

3.4. Econometric Methodology

The analysis in the current study used panel data. For panel data analysis, the three most commonly used estimation techniques are ordinary least squares (OLS), fixed-effect models (FEM), and random-effect models (REM) (Bokpin & Arko, 2009). To estimate the equations, the researchers combined the ordinary least squares regressions and assumed that the invisible individual effect was zero. The assumption leads to heterogeneity across sectors and within enterprises and industries. As a result, the researchers propose employing FEM and REM to solve this problem. The Hausman test is used to identify which of the two models is most suited for data analysis.

4. Empirical Results and Discussion

4.1. Descriptive Statistics

Table 4 summarizes the descriptive statistics for key variables. The average return on assets (ROA) is 6.40% (SD = 0.081), while return on equity (ROE) is 12.1% (SD = 0.177). The CG Index averages 0.579 (range: 0.345–0.759), and the mean debt-to-equity ratio (D/E) is 0.708 (SD = 0.771). The firm size has an average of 9.843 (range: 8.706–11.005), and the firm age is 44 years (range: 14–108). Liquidity averages 1.936 (range: 0.028–138.52), indicating firms typically hold twice as many current assets as current liabilities. The average asset utilization ratio (AUR) is 1.173 (SD = 0.671), and the mean sales log is 9.813 (range: 8.43–11.109).
Table 5 presents the Pearson correlation matrix, which assesses multicollinearity among the explanatory variables. Andersen et al. (1990) concluded that any correlation coefficient greater than 0.7 indicated multicollinearity among explanatory variables. The findings show that none of the explanatory variables exceeds 0.7 in magnitude, indicating that the model does not suffer from multicollinearity. Furthermore, the variance inflation factor test results are well below the threshold of 10 (Hair et al., 2010), indicating that the explanatory variables do not exhibit severe multicollinearity.

4.2. Regression Results

The Hausman test is commonly used in panel data analysis to determine whether the FEM or the REM is more appropriate. In this study, the test results are reported at the bottom of Table 6. Table 6 indicates that CG has a significant and positive effect on FP. The profitability indices, ROA (β = 0.013, p < 0.05) and ROE (β = 0.061, p < 0.01), provide support for hypothesis H1. These findings are consistent with previous research by Bhatt and Bhatt (2017), Wahyudin and Solikhah (2017), Mansour et al. (2022), Tripathi et al. (2024), M. Farooq et al. (2022), and Bui and Krajcsak (2024), all of whom report a positive relationship between CG and FP. The research suggests that strong CG procedures lead to better FP by assuring effective resource allocation, improving management supervision, and reducing self-interested behavior. Furthermore, good governance enables organizations to access funding on favorable terms and lowers knowledge asymmetry between managers and shareholders, resulting in improved organizational performance.
The second part of the investigation assessed the influence of CS on firm FP. The findings demonstrate a statistically significant inverse correlation between leverage and corporate profitability. Specifically, leverage exhibits negative correlations with ROA (β = −0.026, p < 0.05) and ROE (β = −0.078, p < 0.05), thereby corroborating H2. This indicates that elevated debt financing levels increase interest obligations, thereby diminishing the residual income available to equity holders (Ronoowah & Seetanah, 2023). Moreover, excessive leverage may indicate increased financial risk to investors, thereby undermining market trust and applying downward pressure on share prices. The identified negative correlation aligns with the assertion of Boubakri and Ghouma (2010), who argue that enterprises with concentrated ownership structures, especially in emerging markets, are more inclined to utilize debt financing to prevent ownership dilution. Nonetheless, such techniques may increase the risk of expropriation by dominant shareholders, prompting creditors to demand higher risk premiums. As a result, the expense of debt increases, ultimately limiting corporate profitability. The results align with previous empirical research (Boshnak, 2023; Danso et al., 2021; Mansour et al., 2022; Nguyen & Nguyen, 2020; Sakr & Bedeir, 2019; Tripathi et al., 2024), all indicating a negative correlation between leverage and FP.
In the third step, the moderating effect of CS on the correlation between CG and firm FP was evaluated by adding an interaction term (CS × CG) to the regression model. The findings demonstrate that the interaction term exerts a positive and statistically significant influence on company performance, as assessed by ROA (β = 0.036, p < 0.10) and ROE (β = 0.015, p < 0.10). The interaction coefficient exceeds that of the independent CG variable for ROA (0.036 vs. 0.013), indicating that CS amplifies the effect of CG on accounting-based performance. This discovery corresponds with Harvey et al. (2004), who contend that leverage functions as a disciplinary tool that limits management autonomy, especially in environments with deficient governance frameworks. Moreover, the synergistic effect of CG and CS appears to alleviate agency conflicts by reducing managerial opportunism and associated agency costs (Hussainey & Aljifri, 2012; Shahwan, 2015).
Furthermore, it demonstrates the synergistic effect of the association between CG and CS on FP. Thus, the CS becomes a complementary control mechanism, implying that using it as a monitoring mechanism improves the effectiveness of the CG (O. Farooq et al., 2017). Ronoowah and Seetanah (2023) contended that, with an efficient CG framework, heightened company leverage will enhance management, reduce information costs, and mitigate inefficiencies, thereby improving FP.
However, this is not the case with the ROE, as the coefficient value of interactive variable is minimum as compare to standalone impact of CG on ROE (e.g., 0.061 vs. 0.015), suggesting that market participant consider leverage not a good disciplinary mechanism as high leverage introduces financial risk and obligations (such as interest payments), which can reduce firms’ ability to translate good governance practices, therefore interactive variable have a weaker effect on profitability in terms of ROE. Even though strong governance improves decision-making, transparency, and monitoring, the burden of debt limits the firm’s financial flexibility; the combined impact is less significant than the independent impact of CG alone on profitability.

4.3. Robustness Test

We performed two additional analyses, changing the profitability measure and applying different econometric techniques (e.g., system-GMM and instrumental variable regression (2SLS)) to strengthen and confirm the robustness of the results.

4.3.1. Alternative Profitability Measure (Tobin’s Q)

FP was additionally assessed using Tobin’s Q, a market-based metric defined as the ratio of the market value of stock to the book value of total assets (Mansour et al., 2022). The association between CG and FP was re-evaluated with CS incorporated as a moderating variable. The results reported in Table 7 are consistent with the baseline findings in Table 6, thereby confirming the robustness and reliability of the empirical results.

4.3.2. GMM Estimation Methodology

We use a dynamic panel data approach to investigate the association between CG and FP, with CS serving as a moderating variable. This method is driven by the limitations of static estimators, which may yield biased and inconsistent results in the presence of autocorrelation, heteroscedasticity, and endogeneity (Hasan et al., 2022). Endogeneity is a well-documented issue in corporate finance panel studies (M. Farooq et al., 2025), often arising from simultaneity, measurement error, and reverse causation, and necessitating the use of appropriate econometric tools.
To overcome these difficulties, we use the generalized method of moments (GMM) estimator, which is intended to reduce endogeneity in dynamic panel data (Guizani & Abdalkrim, 2023). We use the Blundell and Bond (1998) system GMM estimator rather than Arellano and Bond’s (1991) difference GMM technique, as it is more efficient and has less small-sample bias. The system GMM estimator increases efficiency by merging equations in initial differences and levels, making it ideal for short panel datasets (Nyeadi et al., 2018). It also handles endogeneity by utilizing lagged values of endogenous variables as internal instruments (Kim, 2021). In this paradigm, lagged changes between the dependent and explanatory variables are used as instruments. The Hansen and Sargan overidentifying constraints tests (Roodman, 2009) are used to examine instrument validity, while the Arellano and Bond (1991) AR(1) and AR(2) tests are used to detect first- and second-order serial correlation in the error terms.
Furthermore, Wald test statistics are furnished to evaluate the effectiveness of the system-GMM models. Wald tests are highly significant because they indicate the model’s fitness. The system-GMM underwent the application of the subsequent econometric equations:
(Firm Performance)it = β0 + β1(Firm Performance)it−1 + β2CG_Indexit + β3Sizeit + β4Ageit + β5Liqit + β6AURit + β7Saleit + εit
(Firm Performance)it = β0 + β1(Firm Performance)it−1 + β2TDit + β3Sizeit + β4Ageit + β5Liqit + β6AURit + β7Saleit + εit
(Firm Performance)it = β0 + β1(Firm Performance)it−1 + β2CG_Indexit + β3TDit + β4CG_Indexit × TDit + β5Sizeit + β6Ageit + β7Liqit + β8AURit + β9Saleit + εit
The system-GMM results were carefully verified for model validity using the Arellano-Bond AR(1) and AR(2) tests. Significant AR(1) and insignificant AR(2) data revealed the absence of second-order autocorrelation, validating the model design (Arhinful & Radmehr, 2023) and supporting the consistency of the estimators. Furthermore, the Sargan test was used to assess the exogeneity of the instrumental variables, yielding negligible p-values across all models (p-values > 0.10), confirming their suitability and validating the analysis’s robustness (Semadeni et al., 2014). In addition, the Hansen J-test evaluated instrument validity by examining correlations with error terms, and overidentification tests indicated that the GMM estimates were reliable (p-value ranging from 0.901 to 0.942 in all models) (Roodman, 2009). Importantly, the total number of instruments (42) is significantly less than the number of cross-sectional units (215), which falls well within the acceptable range proposed in the literature. This suggests that the model avoids the problem of instrument proliferation while preserving the reliability of the Hansen test. In addition, the specification uses a limited lag structure and instrument-reduction techniques to ensure a compact instrument set, thereby maintaining the model’s efficiency and validity by minimizing potential overfitting and enhancing robustness. Table 8 shows the system’s GMM regression results, which are consistent with our baseline results.

4.3.3. Endogeneity Issue (Instrumental-Variable (2SLS) Regression)

To mitigate potential endogeneity arising from omitted-variable bias, reverse causation, and simultaneity among CG, CS, and company financial performance, we employ two-stage least squares (2SLS). In accordance with Ananzeh et al. (2025), we develop instrumental variables derived from industry-level averages of corporate governance (CG_Ind) and capital structure (CS_Ind). These instruments fulfill the relevance criterion, as enterprises within the same industry are prone to exhibit similar governance structures and financial patterns due to peer influence, regulatory frameworks, and reputational factors. Furthermore, the exclusion constraint is deemed credible, as industry-average governance and leverage are presumed not to directly affect an individual firm’s financial performance, except via their impact on the endogenous variables.
Table 9 reports the results. In the first-stage regression, both instruments are highly relevant: CG_Ind and CS_Ind exhibit strong positive associations with their endogenous regressors (p-values < 0.01), satisfying the relevance condition. The second-stage results reveal that CG remains positively and significantly associated with FP, confirming that higher CG performance is associated with higher FP. Consistently, TD retains a negative and significant coefficient, indicating that higher leverage lowers the FP. The interaction term (CG × CS) remains positive and statistically significant (p < 0.01), reinforcing CS’s moderating role in the association between CG and FP. Moreover, diagnostic tests, including the Durbin–Wu–Hausman, under-identification, and weak-instrument tests, validate the instruments’ exogeneity and confirm that the 2SLS specification is robust. Collectively, these results strengthen the causal interpretation that CG strengthens FP. At the same time, the interactive variable of CG and CS is significantly positively associated with FP in both profitability measures.

4.3.4. Endogenous Relationship Between CG and Firm Value (Reverse Causality)

Although substantial research has been conducted in both developed and developing nations to investigate the impact of CG on FP, little attention has been paid to reverse causality and potential endogeneity. This study directly addresses the endogeneity of CG and FP. To this purpose, the CG Index is regressed on FP. Table 10 presents the results, with the CG Index as the dependent variable and FP as the explanatory variable. The findings indicate that FP has a significant impact on CG quality, with highly financially performing firms having stronger governance systems. These findings are consistent with Demsetz and Villalonga (2001) and S. Nazir (2016), who suggest that information asymmetry between managers and external stakeholders may create incentives for insiders to modify governance structures in response to expectations of company value.

4.4. Additional Analysis

Following the robustness test, we further enhance the analysis by categorizing firms by size, leverage, and CG quality. Then, we re-examine the investigation. In an additional analysis, we employed only one profitability indicator, ROA.

4.4.1. Additional Analysis 1: GMM Estimation for Large and Small-Sized Firms

First, following M. Farooq et al. (2022), we divided firms into large and small based on their median firm size. The median firm size in our sample is 9.786; all firms with a size of 9.786 or more are classified as large firms, while the remainder are categorized as small enterprises. Table 11 presents the results of the association between CG and FP, with CS acting as a moderator in both large and small firms.
Table 11 indicates a significant positive relationship between CG and FP in larger firms. The CG Index coefficient is higher for these enterprises than for smaller firms, suggesting that the positive effect of improved governance quality is greater in larger organizations. This finding aligns with the assertion that larger firms face higher agency costs (Hamidah et al., 2017), underscoring the importance of effective governance. The results further confirm that larger organizations have higher governance scores compared to smaller firms. The interaction between CG and CS significantly benefits FP in larger enterprises, whereas it has a minor impact in smaller firms. This data confirms our prior argument that while agency costs are higher in larger firms, they have better governance; as a result, the interaction of CG and CS leads to better FP in larger firms.

4.4.2. Additional Analysis 2: GMM Estimation for High- and Low-Leveraged Firms

Secondly, following Tripathi et al. (2024), we categorized firms into high- and low-leveraged groups. As with firm size, we categorized firms into two groups based on the median leverage. The median leverage for sample firms is 0.446. Firms with leverage levels greater than 0.446 are categorized as high-leveraged, and the remaining firms are classified as low-leveraged. Table 12 shows that CG significantly impacts FP in high- and low-leveraged firms.
In the same way, leverage significantly negatively impacts FP in high- and low-leveraged firms. The results indicate that the combination of CG and CS positively affects FP in high-leveraged firms but has little to no effect in low-leveraged firms, consistent with Tripathi et al. (2024). The evidence suggests that leverage moderates the link between CG and FP in highly leveraged firms. Larger firms require more financing to meet business requirements; therefore, they have greater leverage in their CS.

4.4.3. Additional Analysis 3: GMM Estimation for High- and Low-Governed Firms

Finally, we divide the sample data into two categories based on CG quality. Consistent with company size and leverage, we divide the sample firms into two groups based on the median CG index value (0.586). Firms with a CG index greater than 0.586 are classified as high CG index firms, while the others are classified as low-governed firms. Table 13 demonstrates that in highly governed enterprises, CG significantly benefits FP across both profitability indicators. In contrast, in low-governed firms, CG has no significant effect on FP. The interactive variables of CG and CS also have a significant, favourable impact on FP. However, in low-governance businesses, the interactive effect of CG and CS is small.

5. Summary and Conclusions

There is an increasing interest in studying CG and its impact on performance in emerging economies. Each country’s institutional Development determines a CG mechanism, which varies across nations (Judge et al., 2008). The current study adds to the existing literature by highlighting the importance of CS in the relationship between CG and FP. Using a panel data set of 215 firms listed on PSX from 2010 to 2022, the governance quality of the sample firms was measured using the CG index, constructed from 29 governance provisions covering audit committees, boards, Compensation, and ownership structures. The firms’ governance quality improves as their CG Index increases. FP is measured through two proxies, i.e., ROA and ROE, and CS is measured through the debt-to-shareholders’ equity ratio. Panel data techniques, i.e., the FEM and REM models, were applied for the analysis.
Empirical results show that CG significantly enhances FP. Firms with stronger governance achieve higher profitability, as measured by ROA and ROE. These findings indicate that effective CG improves monitoring, reduces agency conflicts, and promotes efficient resource use. In contrast, CS has a significant negative effect on FP. Greater reliance on debt increases financial constraints and risk. This underscores the potential costs of excessive leverage, especially in emerging markets where financial systems may be less efficient.
The study finds that CS plays a conditional, complementary role in the relationships among CG and FP. The interaction between CG and CS is positive and statistically significant, especially when ROA is used as the performance measure. This suggests that leverage can strengthen CG by increasing management discipline and reducing agency costs. However, the moderating effect is weaker for ROE. Market participants may view high leverage as a risk that limits the impact of governance on shareholder returns. This difference between accounting-based and market-based measures is a key insight of the study.
Additional analyses confirm the robustness of these findings. The study uses alternative performance measures, such as Tobin’s Q. It employs dynamic panel estimation (System-GMM) and instrumental-variable techniques (2SLS) to address endogeneity concerns. The positive effects of governance and its interaction with CS are stronger in larger, highly leveraged, and higher-governance-quality firms. This highlights the importance of firm heterogeneity.
This study shows that CS is both a financing decision and a mechanism influencing CG. These findings indicate that governance and financing decisions are interdependent, and their interaction greatly affects FP. This research has numerous significant managerial implications. Initially, organizations must conduct a thorough assessment of the extent to which they have integrated long-term debt into their CS, as increased debt financing is associated with a substantial decrease in firm profitability. Excessive reliance on leverage may negatively impact FP and overall firm stability. Therefore, it is recommended that managers and proprietors maintain a moderate or optimal level of debt rather than implementing highly leveraged financing strategies.
Furthermore, internal financing sources, including retained earnings, should be prioritized as a more cost-effective and steady alternative to external financing for corporate operations and investments. This study’s conclusions may be advantageous to lenders. Before making any financial decisions, lenders should assess a company’s governance structure. The study’s usefulness for investors is that the composite measure of CG practices provides them with a measurable tool to evaluate the performance of non-financial PSX enterprises. Therefore, investors must analyze a firm’s governance process before making investment decisions. The findings are also relevant for regulators seeking to develop new strategies to strengthen the regulatory framework and attract more international investors. Legislators and policymakers in emerging economies must regularly revise, improve, and update CG code rules to promote corporate performance.
This research has certain drawbacks. First, when developing the CG index, we disregarded qualitative aspects such as the board decision-making process, directors’ perceptions of the board’s role, and directors’ ages and qualifications. We would use this qualitative feature in the future to enhance the governance index. The study sample consisted of listed non-financial firms, as unlisted firms lacked CG information. Including unlisted enterprises in future studies can enhance the understanding of CG dynamics in Pakistan. This research predominantly utilizes book-value measures of CS, with a particular emphasis on the debt-to-equity ratio. The market perceptions of firm leverage may not be fully captured by this approach, which is common in emerging-market research due to data availability constraints, as it overlooks the dynamic nature of market conditions and investor sentiment, which can significantly influence perceptions of firm leverage. Investors may gain further insights into the evaluation of firms’ financing decisions by using market-based metrics, such as market-value leverage. Further research may expand this analysis by integrating market-based indicators to improve comparability and robustness across institutional contexts. Finally, M. Farooq et al. (2025) argue that relying on internal CG factors is ineffective because emerging markets are highly uncertain and corrupt. It is important to consider country-specific factors, such as institutional differences, the economic environment, and the tax system, when studying the CS-FP relationship.

Funding

This research received no external funding.

Institutional Review Board Statement

Not applicable.

Informed Consent Statement

Not applicable.

Data Availability Statement

Data will be made available online upon reasonable request.

Conflicts of Interest

The author declares no conflict of interest.

References

  1. Abor, J. (2005). The effect of capital structure on profitability: An empirical analysis of listed firms in Ghana. The Journal of Risk Finance, 6(5), 438–445. [Google Scholar] [CrossRef]
  2. Acharya, V. V., & Heje Pedersen, L. (2019). Economics with market liquidity risk. Critical Finance Review, 8(1–2), 111–125. [Google Scholar] [CrossRef]
  3. Akbar, S., Poletti-Hughes, J., El-Faitouri, R., & Shah, S. Z. A. (2016). More on the relationship between corporate governance and firm performance in the UK: Evidence from the application of generalized method of moments estimation. Research in International Business and Finance, 38, 417–429. [Google Scholar] [CrossRef]
  4. Alexandridis, A. K., & Hasan, M. S. (2020). Global financial crisis and multiscale systematic risk: Evidence from selected European stock markets. International Journal of Finance & Economics, 25(4), 518–546. [Google Scholar]
  5. Ananzeh, H., Al Amosh, H., & Albitar, K. (2022). The effect of corporate governance quality and its mechanisms on firm philanthropic donations: Evidence from the UK. International Journal of Accounting & Information Management, 30(4), 477–501. [Google Scholar] [CrossRef]
  6. Ananzeh, H., Alshurafat, H., Yami, N., & Al Shbail, M. O. (2025). The influence of corporate governance committee presence and characteristics on capital structure: The role of CEO overconfidence in Jordan. Acta Psychologica, 260, 105742. [Google Scholar] [CrossRef]
  7. Anderson, D. R., Sweeney, D. J., & Williams, T. A. (1990). Statistics for business and economics. South Western College. [Google Scholar]
  8. Anum Mohd Ghazali, N. (2010). Ownership structure, corporate governance, and corporate performance in Malaysia. International Journal of Commerce and Management, 20(2), 109–119. [Google Scholar] [CrossRef]
  9. Arellano, M., & Bond, S. (1991). Some tests of specification for panel data: Monte Carlo evidence and an application to employment equations. The Review of Economic Studies, 58(2), 277–297. [Google Scholar] [CrossRef]
  10. Arhinful, R., & Radmehr, M. (2023). The impact of financial leverage on the financial performance of firms listed on the Tokyo stock exchange. Sage Open, 13(4), 21582440231204099. [Google Scholar] [CrossRef]
  11. Arora, A., & Bodhanwala, S. (2018). Relationship between corporate governance index and firm performance: Indian evidence. Global Business Review, 19(3), 675–689. [Google Scholar] [CrossRef]
  12. Ayalew, Z. A. (2021). Capital structure and profitability: Panel data evidence of private banks in Ethiopia. Cogent Economics & Finance, 9(1), 1953736. [Google Scholar] [CrossRef]
  13. Baron, R. M., & Kenny, D. A. (1986). The moderator–mediator variable distinction in social psychological research: Conceptual, strategic, and statistical considerations. Journal of Personality and Social Psychology, 51(6), 1173. [Google Scholar] [CrossRef]
  14. Berger, A. N., & Di Patti, E. B. (2006). Capital structure and firm performance: A new approach to testing agency theory and an application to the banking industry. Journal of Banking & Finance, 30(4), 1065–1102. [Google Scholar] [CrossRef]
  15. Bhagat, S., & Bolton, B. (2019). Corporate governance and firm performance: The sequel. Journal of Corporate Finance, 58, 142–168. [Google Scholar] [CrossRef]
  16. Bhatt, P. R., & Bhatt, R. R. (2017). Corporate governance and firm performance in Malaysia. Corporate Governance: The International Journal of Business in Society, 17(5), 896–912. [Google Scholar] [CrossRef]
  17. Blundell, R., & Bond, S. (1998). Initial conditions and moment restrictions in dynamic panel data models. Journal of Econometrics, 87(1), 115–143. [Google Scholar] [CrossRef]
  18. Bokpin, G. A., & Arko, A. C. (2009). Ownership structure, corporate governance and capital structure decisions of firms: Empirical evidence from Ghana. Studies in Economics and Finance, 26(4), 246–256. [Google Scholar] [CrossRef]
  19. Boshnak, H. (2023). The impact of capital structure on firm performance: Evidence from Saudi-listed firms. International Journal of Disclosure and Governance, 20(1), 15–26. [Google Scholar] [CrossRef]
  20. Boubakri, N., & Ghouma, H. (2010). Control/ownership structure, creditor rights protection, and the cost of debt financing: International evidence. Journal of Banking & Finance, 34(10), 2481–2499. [Google Scholar] [CrossRef]
  21. Brown, L. D., & Caylor, M. L. (2009). Corporate governance and firm operating performance. Review of Quantitative Finance and Accounting, 32(2), 129–144. [Google Scholar] [CrossRef]
  22. Bui, H., & Krajcsák, Z. (2024). The impacts of corporate governance on firms’ performance: From theories and approaches to empirical findings. Journal of Financial Regulation and Compliance, 32(1), 18–46. [Google Scholar] [CrossRef]
  23. Burks, J. J., Randolph, D. W., & Seida, J. A. (2019). Modeling and interpreting regressions with interactions. Journal of Accounting Literature, 42(1), 61–79. [Google Scholar] [CrossRef]
  24. Chadha, S., & Sharma, A. K. (2015). Capital structure and firm performance: Empirical evidence from India. Vision, 19(4), 295–302. [Google Scholar] [CrossRef]
  25. Chang, C. S., Yu, S. W., & Hung, C. H. (2015). Firm risk and performance: The role of corporate governance. Review of Managerial Science, 9(1), 141–173. [Google Scholar] [CrossRef]
  26. Claessens, S., Djankov, S., & Lang, L. H. (2000). The separation of ownership and control in East Asian corporations. Journal of Financial Economics, 58(1–2), 81–112. [Google Scholar] [CrossRef]
  27. Claessens, S., & Yurtoglu, B. B. (2013). Corporate governance in emerging markets: A survey. Emerging Markets Review, 15, 1–33. [Google Scholar] [CrossRef]
  28. Connelly, C. E., Zweig, D., Webster, J., & Trougakos, J. P. (2012). Knowledge hiding in organizations. Journal of Organizational Behavior, 33(1), 64–88. [Google Scholar] [CrossRef]
  29. Cuomo, F., Mallin, C., & Zattoni, A. (2016). Corporate governance codes: A review and research agenda. Corporate Governance: An International Review, 24(3), 222–241. [Google Scholar] [CrossRef]
  30. Danso, A., Fosu, S., Owusu-Agyei, S., Ntim, C. G., & Adegbite, E. (2021). Capital structure revisited. Do crisis and competition matter in a Keiretsu corporate structure? International Journal of Finance & Economics, 26(4), 5073–5092. [Google Scholar]
  31. Demsetz, H., & Villalonga, B. (2001). Ownership structure and corporate performance. Journal of Corporate Finance, 7(3), 209–233. [Google Scholar] [CrossRef]
  32. Dimitropoulos, P. (2014). Capital structure and corporate governance of soccer clubs: European evidence. Management Research Review, 37(7), 658–678. [Google Scholar] [CrossRef]
  33. Ehsan, S. (2019). Corporate social responsibility; measurement, and its nexus with earning’s management and corporate governance [Doctoral dissertation, COMSATS Institute of Information Technology]. [Google Scholar]
  34. Elghuweel, M. I., Ntim, C. G., Opong, K. K., & Avison, L. (2017). Corporate governance, Islamic governance and earnings management in Oman: A new empirical insights from a behavioural theoretical framework. Journal of Accounting in Emerging Economies, 7(2), 190–224. [Google Scholar]
  35. Elmagrhi, M. H., Ntim, C. G., Malagila, J., Fosu, S., & Tunyi, A. A. (2018). Trustee board diversity, governance mechanisms, capital structure and performance in UK charities. Corporate Governance: The International Journal of Business in Society, 18(3), 478–508. [Google Scholar]
  36. Elmagrhi, M. H., Ntim, C. G., & Wang, Y. (2016). Antecedents of voluntary corporate governance disclosure: A post-2007/08 financial crisis evidence from the influential UK combined code. Corporate Governance, 16(3), 507–538. [Google Scholar] [CrossRef]
  37. Faccio, M., Lang, L. H. P., & Young, L. (2001). Dividends and expropriation. American Economic Review, 91, 54–78. [Google Scholar] [CrossRef]
  38. Farooq, M., Al-Jabri, Q., Noor, A., Hunjra, A. I., & Hamayun, A. (2025). Corporate social responsibility and financial reporting quality: The role of board gender diversity. Journal of Financial Reporting and Accounting. [Google Scholar] [CrossRef]
  39. Farooq, M., Noor, A., & Ali, S. (2022). Corporate governance and firm performance: Empirical evidence from Pakistan. Corporate Governance: The International Journal of Business in Society, 22(1), 42–66. [Google Scholar]
  40. Farooq, O., Asgarov, Z., Guliyev, A., Islam, T., Kalinina, Y., & Pashayev, Z. (2017). Capital structure and value of reported earnings: Evidence from an emerging market. Applied Economics Letters, 24(10), 690–694. [Google Scholar]
  41. Gill, A., Biger, N., & Mathur, N. (2011). The effect of capital structure on profitability: Evidence from the United States. International Journal of Management, 28(4), 3. [Google Scholar]
  42. Gompers, P., Ishii, J., & Metrick, A. (2003). Corporate governance and equity prices. The Quarterly Journal of Economics, 118(1), 107–156. [Google Scholar] [CrossRef]
  43. Guizani, M., & Abdalkrim, G. (2023). Does gender diversity on boards reduce the likelihood of financial distress? Evidence from Malaysia. Asia-Pacific Journal of Business Administration, 15(2), 287–306. [Google Scholar]
  44. Gutiérrez-Ponce, H., Chamizo-González, J., & Arimany-Serrat, N. (2022). Disclosure of environmental, social, and corporate governance information by Spanish companies: A compliance analysis. Sustainability, 14(6), 3254. [Google Scholar] [CrossRef]
  45. Hair, J. F., Black, W. C., Babin, B. J., & Anderson, R. E. (2010). Multivariate data analysis. Pearson. [Google Scholar]
  46. Hamidah, H., Wicaksono, A., & Ahmad, G. N. (2017). The effect of firm performance, leverage, firm size, and firm growth on agency cost of trading company in Indonesia, Malaysia, and Thailand: Research period of 2009 –2013. JRMSI-Jurnal Riset Manajemen Sains Indonesia, 8(1), 120–138. [Google Scholar]
  47. Harvey, C. R., Lins, K. V., & Roper, A. H. (2004). The effect of capital structure when expected agency costs are extreme. Journal of Financial Economics, 74(1), 3–30. [Google Scholar] [CrossRef]
  48. Hasan, A., Aly, D., & Hussainey, K. (2022). Corporate governance and financial reporting quality: A comparative study. Corporate Governance: The International Journal of Business in Society, 22(6), 1308–1326. [Google Scholar] [CrossRef]
  49. Hoang, E., & Hoxha, I. (2019). An international study of the response of corporate payout policy. International Journal of Managerial Finance, 15(3), 335–349. [Google Scholar] [CrossRef]
  50. Hoang, E. C., & Hoxha, I. (2015). The sensitivity of payouts to corporate financing decisions. Journal of Financial Economic Policy, 7(4), 290–300. [Google Scholar] [CrossRef]
  51. Hoang, E. C., & Hoxha, I. (2021). A tale of two emerging market economies: Evidence from payout smoothing in China and Taiwan. International Journal of Managerial Finance, 17(3), 361–376. [Google Scholar]
  52. Hodgson, A., Lhaopadchan, S., & Buakes, S. (2011). How informative is the Thai corporate governance index? A financial approach. International Journal of Accounting & Information Management, 19(1), 53–79. [Google Scholar] [CrossRef]
  53. Huang, J. C., Lin, H. C., & Huang, D. (2025). The effect of corporate governance on the firm’s cost of capital: Evidence from the Taiwan corporate governance evaluation system. Sustainability, 17(22), 9991. [Google Scholar] [CrossRef]
  54. Hussainey, K., & Aljifri, K. (2012). Corporate governance mechanisms and capital structure in UAE. Journal of Applied Accounting Research, 13(2), 145–160. [Google Scholar] [CrossRef]
  55. Jaiswal, S., & Elmarzouky, M. (2025). Capital structure and firm performance: Evidence from FTSE all-share firms during COVID-19. Journal of Risk and Financial Management, 18(11), 648. [Google Scholar] [CrossRef]
  56. Jensen, M. C. (1986). Agency costs of free cash flow, corporate finance, and takeovers. The American Economic Review, 76(2), 323–329. [Google Scholar]
  57. Jensen, M. C., & Meckling, W. H. (1976). Theory of the firm: Managerial behavior, agency costs and ownership structure. Journal of Financial Economics, 3(4), 305–360. [Google Scholar] [CrossRef]
  58. Jiraporn, P., Kim, J. C., Kim, Y. S., & Kitsabunnarat, P. (2012). Capital structure and corporate governance quality: Evidence from the Institutional Shareholder Services (ISS). International Review of Economics & Finance, 22(1), 208–221. [Google Scholar] [CrossRef]
  59. Judge, W. Q., Douglas, T. J., & Kutan, A. M. (2008). Institutional antecedents of corporate governance legitimacy. Journal of Management, 34(4), 765–785. [Google Scholar] [CrossRef]
  60. Kallamu, B. S., & Saat, N. A. M. (2015). Audit committee attributes and firm performance: Evidence from Malaysian finance companies. Asian Review of Accounting, 23(3), 206–231. [Google Scholar] [CrossRef]
  61. Kamal Hassan, M. (2012). A disclosure index to measure the extent of corporate governance reporting by UAE-listed corporations. Journal of Financial Reporting and Accounting, 10(1), 4–33. [Google Scholar] [CrossRef]
  62. Kaur, M., & Vij, M. (2018). Corporate governance index and firm performance: Empirical evidence from Indian banking. Afro-Asian Journal of Finance and Accounting, 8(2), 190–207. [Google Scholar] [CrossRef]
  63. Khan, M. Y., Javeed, A., Cuong, L. K., & Pham, H. (2020). Corporate governance and cost of capital: Evidence from emerging markets. Risks, 8(4), 104. [Google Scholar] [CrossRef]
  64. Kim, M. (2021). Financial constraints, productivity, and the global financial crisis. Applied Economics, 53(57), 6570–6581. [Google Scholar] [CrossRef]
  65. King, M. R., & Santor, E. (2008). Family values: Ownership structure, performance, and capital structure of Canadian firms. Journal of Banking & Finance, 32(11), 2423–2432. [Google Scholar] [CrossRef]
  66. La Porta, R., Lopez-de-Silanes, F., Shleifer, A., & Vishny, R. (2000). Investor protection and corporate governance. Journal of Financial Economics, 58(1–2), 3–27. [Google Scholar] [CrossRef]
  67. La Porta, R., Lopez-de-Silanes, F., Shleifer, A., & Vishny, R. W. (1998). Law and finance. Journal of Political Economy, 106(6), 1113–1155. [Google Scholar] [CrossRef]
  68. La Rocca, M. (2007). The influence of corporate governance on the relation between capital structure and value. Corporate Governance: The International Journal of Business in Society, 7(3), 312–325. [Google Scholar] [CrossRef]
  69. Mansour, M., Al Amosh, H., Alodat, A. Y., Khatib, S. F., & Saleh, M. W. (2022). The relationship between corporate governance quality and firm performance: The moderating role of capital structure. Sustainability, 14(17), 10525. [Google Scholar] [CrossRef]
  70. Morellec, E., Nikolov, B., & Schürhoff, N. (2012). Corporate governance and capital structure dynamics. The Journal of Finance, 67(3), 803–848. [Google Scholar] [CrossRef]
  71. Muhammad, H., Migliori, S., & Mohsni, S. (2021). Capital structure and firm performance: The role of corporate governance. International Journal of Business Governance and Ethics, 15(4), 436–458. [Google Scholar] [CrossRef]
  72. Musah, A. (2018). The impact of capital structure on profitability of commercial banks in Ghana. Asian Journal of Economic Modelling, 6(1), 21–36. [Google Scholar] [CrossRef]
  73. Nasr, M. A., & Ntim, C. G. (2018). Corporate governance mechanisms and accounting conservatism: Evidence from Egypt. Corporate Governance: The International Journal of Business in Society, 18(3), 386–407. [Google Scholar] [CrossRef]
  74. Nazir, M. S., & Afza, T. (2018). Does managerial behavior of managing earnings mitigate the relationship between corporate governance and firm value? Evidence from an emerging market. Future Business Journal, 4(1), 139–156. [Google Scholar] [CrossRef]
  75. Nazir, S. (2016). The relationship between corporate governance and firm value: Role of discretionary earnings management [Doctoral dissertation, COMSATS Institute of Information Technology Lahore Campus-Pakistan]. [Google Scholar]
  76. Nerantzidis, M. (2018). The role of weighting in corporate governance ratings. Journal of Management and Governance, 22(3), 589–628. [Google Scholar] [CrossRef]
  77. Nguyen, T., & Nguyen, H. (2020). Capital structure and firm performance of non-financial listed companies: Cross-sector empirical evidence from Vietnam. Accounting, 6(2), 137–150. [Google Scholar] [CrossRef]
  78. Nirajini, A., & Priya, K. B. (2013). Impact of capital structure on financial performance of the listed trading companies in Sri Lanka. International Journal of Scientific and Research Publications, 3(5), 1–9. [Google Scholar]
  79. Nyeadi, J. D., Sare, Y. A., & Aawaar, G. (2018). Determinants of working capital requirement in listed firms: Empirical evidence using a dynamic system GMM. Cogent Economics & Finance, 6(1), 1558713. [Google Scholar] [CrossRef]
  80. OECD. (2004). Principles of corporate governance. Available online: www.oecd.org/corporate/ca/corporategovernanceprinciples/31557724.pdf (accessed on 7 April 2026).
  81. Rodríguez Valencia, L. (2025). Financial performance and corporate governance on firm value: Evidence from Spain. International Journal of Financial Studies, 13(3), 123. [Google Scholar] [CrossRef]
  82. Ronoowah, R. K., & Seetanah, B. (2023). The moderating and mediating effects of corporate governance and capital structure on firm performance: Empirical evidence from an emerging market. Managerial Finance, 49(9), 1377–1399. [Google Scholar] [CrossRef]
  83. Roodman, D. (2009). How to do xtabond2: An introduction to difference and system GMM in Stata. The Stata Journal, 9(1), 86–136. [Google Scholar] [CrossRef]
  84. Ross, S. A. (1977). The determination of financial structure: The incentive-signalling approach. The Bell Journal of Economics, 8, 23–40. [Google Scholar] [CrossRef]
  85. Saidat, Z. M. (2018). Corporate governance and corporate performance: Evidence from Jordanian family and non-family firms [Doctoral dissertation, Queen Margaret University]. [Google Scholar]
  86. Sakr, A., & Bedeir, A. (2019). Firm-level determinants of capital structure: Evidence from Egypt. International Journal of Financial Research, 10(1), 68–85. [Google Scholar] [CrossRef]
  87. Sarhan, A. A., Ntim, C. G., & Al-Najjar, B. (2019). Board diversity, corporate governance, corporate performance, and executive pay. International Journal of Finance & Economics, 24(2), 761–786. [Google Scholar]
  88. Schäuble, J. (2019). The impact of external and internal corporate governance mechanisms on agency costs. Corporate Governance: The International Journal of Business in Society, 19(1), 1–22. [Google Scholar] [CrossRef]
  89. Semadeni, M., Withers, M. C., & Trevis Certo, S. (2014). The perils of endogeneity and instrumental variables in strategy research: Understanding through simulations. Strategic Management Journal, 35(7), 1070–1079. [Google Scholar] [CrossRef]
  90. Shahwan, T. M. (2015). The effects of corporate governance on financial performance and financial distress: Evidence from Egypt. Corporate Governance, 15(5), 641–662. [Google Scholar] [CrossRef]
  91. Shubita, M. F., & Alsawalhah, J. M. (2012). The relationship between capital structure and profitability. International Journal of Business and Social Science, 3(16), 104–112. [Google Scholar]
  92. Song, H. J., Yoon, Y. N., & Kang, K. H. (2020). The relationship between board diversity and firm performance in the lodging industry: The moderating role of internationalization. International Journal of Hospitality Management, 86, 102461. [Google Scholar] [CrossRef]
  93. Tripathi, V., Goodell, J. W., Madhavan, V., & Kumar, S. (2024). Moderating effect of capital structure on the relationship between corporate governance mechanisms and firm value: Evidence from India. International Review of Economics & Finance, 92, 1336–1350. [Google Scholar] [CrossRef]
  94. Tut, D. (2023). Debt dynamic, debt dispersion, and corporate governance. International Journal of Managerial Finance, 19(4), 744–771. [Google Scholar] [CrossRef]
  95. Wahyudin, A., & Solikhah, B. (2017). Corporate governance implementation rating in Indonesia and its effects on financial performance. Corporate Governance: The International Journal of Business in Society, 17(2), 250–265. [Google Scholar] [CrossRef]
  96. Walsh, J. P., & Seward, J. K. (1990). On the efficiency of internal and external corporate control mechanisms. Academy of Management Review, 15(3), 421–458. [Google Scholar] [CrossRef]
  97. Wu, A. D., & Zumbo, B. D. (2008). Understanding and using mediators and moderators. Social Indicators Research, 87(3), 367–392. [Google Scholar] [CrossRef]
  98. Zeitun, R., & Tian, G. G. (2007). Capital structure and corporate performance: Evidence from Jordan. Australasian Accounting, Business and Finance Journal, 1(4), 40–61. [Google Scholar] [CrossRef]
Figure 1. Theoretical framework of the study.
Jrfm 19 00324 g001
Table 1. Description of sample selection.
Total PSX Firms Listed in June, 2022530
Less financial firms129
Less state-owned firms10
Less firms do not meet the sample selection criteria176
Final sample of the study215
Table 2. Description of variables used in the study.
NotationFull Variable NameDescription
Panel A: Firm Performance Measures
ROAReturn on assetsRatio of net income to total assets
ROEReturn on equityRatio of net income to shareholders’ equity
Panel B: Corporate Governance measure
CG_IndexCorporate Governance IndexCG_Index is an integrated, composite measure of 29 governance provisions covering four dimensions of governance, i.e., audit committee, board structure, compensation structure, and ownership structure of the firm (M. Farooq et al., 2022; M. S. Nazir & Afza, 2018).
Panel C: Capital Structure Measure
TDTotal debtTotal book value of debt/equity
Panel D: Control Measures
SizeFirm sizeMeasured by the natural Log of total assets
AgeFirm ageNumber of years since the firm was established
LiqLiquidityCurrent assets/current liabilities
AURAsset utilization ratioTotal sales/total assets
SaleLog of saleNatural Log of total sales
Source: Author’s work.
Table 3. Corporate Governance Index Checklist.
Audit Committee Structure
1Audit Committee Size: total members in the audit committee/total members in the board of directors committee.
2Audit Committee Independence: non-executive directors/total directors in the audit committee.
3Audit Committee Activity: Number of audit committee meetings held in a financial year.
4Audit Committee Independent Chairman: dummy variable equal to “1” if chairman is an independent director.
5External Auditor Quality: dummy variable equal to “1” if the firm got audited by one of the top five auditing firms.
Board Committee Structure
6Board Size: natural Log of the number of directors in the board committee.
7Board Independence: measured by 1/board size × outside directors/inside directors.
8Board Activity: number of board meetings held in a financial year.
9Board Participation: total number of board members attendance/required board members attendance.
10CEO Duality: dummy variable equal to “1” if the same person holds the position of CEO and chairman of the board.
11CEO Dominance: dummy variable equal to “1” if the CEO is also present in other board committees.
12Board diversity: number of women directors on the board.
13Financial Institution Nominee Director: dummy variable equal to “1” if financial institutions nominate their director to the board committee.
Compensation Structure
14Executive Compensation: natural Log of executive Compensation paid in a financial year (compensation + bonuses + perquisites).
15Director Compensation: natural Log of directors’ Compensation paid in a financial year (compensation + bonuses + perquisites).
16CEO Compensation: natural Log of CEO compensation paid in a financial year (compensation + bonuses + perquisites).
Ownership Structure
17Individual Ownership: total shares owned by individuals/total outstanding shares.
18Insider Ownership: total shares owned by insiders/total outstanding shares.
19Family Ownership: total shares owned by entire family members/total outstanding shares.
20Director Ownership: total shares owned by directors/total outstanding shares.
21CEO Ownership: total shares owned by the CEO/total outstanding shares.
22Large Director Ownership: total shares owned by large directors/total outstanding shares.
23Institutional Ownership: total shares owned by institutions/total outstanding shares.
24Foreign Ownership: total shares owned by foreign individuals and companies/total outstanding shares.
25Associated Ownership: total shares owned by associated companies/total outstanding shares.
26Ownership Concentration: total shares owned by the five big shareholders/total outstanding shares.
27Blockholders Ownership: dummy variable equal to “1” if the biggest shareholder owns greater than 10% outstanding shares.
28Joint Stock Companies Ownership: total shares owned by joint stock companies/total outstanding shares.
29Family Controlled Ownership: dummy variable equal to “1” if family shareholdings are greater than 30% outstanding shares.
Table 4. Descriptive Statistics.
VariableObs.MeanStd. Dev.MinMax
ROA27950.0640.081−0.080.241
ROE27950.1210.177−0.2760.506
CG_Index27950.5790.0950.3450.759
TD27950.7080.77102.711
Size27959.8430.6258.70611.005
Age279543.88017.51714108
Liq27951.9364.9650.028138.52
AUR27951.1730.6710.2232.690
Sale27959.8130.6788.43011.109
Source: Author’s work.
Table 5. Correlation analysis.
Variables(1)(2)(3)(4)(5)(6)(7)(8)(9)
ROA1.000
ROE0.8031.000
CG_Index0.1980.1491.000
TD−0.416−0.293−0.1241.000
Size0.1730.2190.3360.0661.000
Age0.023−0.0130.094−0.1130.0801.000
Liq0.0820.017−0.083−0.158−0.120−0.0161.000
AUR0.2890.282−0.082−0.077−0.1400.035−0.0671.000
Sale0.3010.3310.2920.0590.2870.109−0.1390.2631.000
VIFs                                    1.17         1.10       1.29         1.04         1.06           1.03           1.15
Tolerance                                0.853        0.912      0.774        0.966         0.947        0.972         0.86
Source: Author’s work.
Table 6. Regression results.
VariablesROAROEROAROEROAROE
Model 1Model 2Model 3
CG_Index0.013 **0.061 *** 0.021 **0.067 **
(0.024)(0.065) (0.029)(0.075)
TD −0.026 **−0.078 **−0.057 **−0.074 **
(0.003)(0.006)(0.012)(0.032)
CG_Index * TD 0.036 *0.015 *
(0.021)(0.056)
Size0.021 **0.060 **0.028 **0.035 **0.029 *0.086 **
(0.016)(0.043)(0.016)(0.028)(0.016)(0.041)
Age0.007 *0.008 **0.004 **0.005 **0.003 **0.002 **
(0.001)(0.002)(0.001)(0.000)(0.001)(0.001)
Liq0.006 **0.009 *0.005 *0.006 **0.005 *0.004 *
(0.000)(0.001)(0.000)(0.001)(0.000)(0.001)
AUR0.060 ***0.114 ***0.053 ***0.069 ***0.052 ***0.091 ***
(0.006)(0.016)(0.006)(0.013)(0.006)(0.016)
Sale−0.019 **−0.018 *−0.020 *−0.049 *0.021 *−0.021 *
(0.011)(0.030)(0.011)(0.026)(0.011)(0.029)
Constant−0.442 ***−0.828 ***−0.471 ***−0.706 ***−0.495 ***−0.939 ***
(0.103)(0.274)(0.099)(0.107)(0.100)(0.264)
Observations279527952795279527952795
R-squared0.1520.0750.202 0.2040.152
F-statistics47.9521.667.51 51.0435.67
Prob(F-stat)0.0000.0000.000 0.0000.000
Wald-statistics 383.44
Prob(Wald stat) 0.000
Number of coid215215215215215215
Hausman test59.52 (0.000)22.91 (0.008)51.57 (0.000)9.12 (0.167)61.23 (0.000)15.66 (0.0375)
Note: Standard errors in parentheses. *** p < 0.01, ** p < 0.05, * p < 0.1. Source: Author’s work.
Table 7. Regression results (Robustness check).
VariablesTobin’s QTobin’s QTobin’s Q
Model 1Model 2Model 3
CG_Index0.599 *** 1.363 ***
(0.229) (0.275)
TD −0.132 ***−0.444 ***
(0.025)(0.116)
CG_Index * TD 1.029 **
(0.204)
Size0.521 ***0.603 ***0.567 ***
(0.153)(0.151)(0.151)
Age0.059 ***0.059 ***0.055 ***
(0.005)(0.005)(0.005)
Liq0.002 **0.002 **0.001 *
(0.003)(0.003)(0.003)
AUR0.396 ***0.355 ***0.348 ***
(0.057)(0.057)(0.057)
Sale−0.070 *−0.058 **−0.052 **
(0.108)(0.107)(0.106)
Constant−6.677 ***−7.118 ***−7.427 ***
(0.972)(0.960)(0.964)
Observations279527952795
R-squared0.1990.2090.225
F-statistics66.1570.4657.83
Prob(F-stat)0.0000.0000.000
Number of Coid215215215
Hausman test240.90 (0.000)259.78 (0.000)175.64 (0.000)
Note: Standard errors in parentheses. *** p < 0.01, ** p < 0.05, * p < 0.1.
Table 8. GMM Regression results (Robustness check).
VariablesROAROEROAROEROAROE
ROA(-1)0.453 *** 0.413 *** 0.414 ***
(0.035) (0.035) (0.035)
ROE(-1) 0.414 *** 0.349 *** 0.348 ***
(0.032) (0.031) (0.031)
CG_Index0.0915 ***0.052 ** 0.023 ***0.023 **
(0.035)(0.097) (0.041)(0.110)
TD −0.023 ***−0.098 ***−0.083 **−0.085 **
(0.004)(0.010)(0.019)(0.049)
CG_Index * TD −0.0270.025 ***
(0.033)(0.087)
Size0.045 *0.109 *0.053 **0.169 ***0.052 **0.174 ***
(0.023)(0.067)(0.022)(0.062)(0.023)(0.063)
Age0.015 **0.022 **0.041 **0.049 ***0.041 **0.046 ***
(0.001)(0.002)(0.001)(0.002)(0.001)(0.002)
LIQ0.029 ***0.018 **0.021 **0.033 **0.021 ***0.042 **
(0.000)(0.001)(0.000)(0.001)(0.000)(0.001)
AUR0.047 ***0.048 *0.041 ***0.033 *0.041 ***0.033 **
(0.009)(0.026)(0.009)(0.024)(0.009)(0.024)
Sale−0.008 *−0.019−0.098 **−0.055 *−0.002 **0.054 *
(0.019)(0.053)(0.018)(0.050)(0.018)(0.050)
Constant−0.381 ***−1.129 ***−0.487 ***−1.918 ***−0.492 ***−1.949 ***
(0.131)(0.385)(0.126)(0.367)(0.129)(0.372)
Observations247824782478247824782478
Wald test (p-value)298.08 (0.000)214.82 (0.000)353.38 (0.000)339.13 (0.000)354.13 (0.000)339.57 (0.000)
Sargan test (p-value)0.110.190.170.210.160.19
Hansen test (p-value)0.9240.9320.9420.9010.9230.911
AR(1) p-value0.00020.00010.00040.00050.00020.0003
AR(2) p-value0.69180.71340.73920.68620.70610.7329
CoID215215215215215215
Instrument rank424242424242
Note: Standard errors in parentheses. *** p < 0.01, ** p < 0.05, * p < 0.1.
Table 9. Instrumental variable Regression (2SLS).
VariablesFirst StageSecond Stage
CG_IndexTDROAROEROAROE
CG_Index_Ind0.803 *** 0.548 ***0.845 **0.501 **0.708 **
(0.062) (0.194)(0.738)(0.224)(0.722)
TD_Ind 0.991 ***−0.0200 **−0.146 ***−0.0319 **−0.112 *
(0.147)(0.009)(0.036)(0.023)(0.074)
CG_Index_Ind * TD_Ind 0.045 **0.129 *
(0.078)(0.252)
Size0.009630.534 *−0.0395 **−0.041−0.0343 *−0.0557
(0.007)(0.277)(0.017)(0.064)(0.021)(0.066)
Age0.000197 *−0.00692−0.000665 ***−0.00182 **−0.000640 ***−0.00189 **
(0.000)(0.004)(0.000)(0.001)(0.000)(0.001)
LIQ−0.000968 **−0.02750.00261 ***−0.0009390.00271 **−0.00121
(0.000)(0.017)(0.001)(0.004)(0.001)(0.003)
AUR−0.00679 **0.07470.0130 **0.01950.0156 *0.0119
(0.003)(0.119)(0.006)(0.022)(0.008)(0.026)
Sale0.0201 ***−0.3940.0493 ***0.198 ***0.0444 ***0.212 ***
(0.007)(0.262)(0.013)(0.049)(0.017)(0.054)
Constant−0.177 ***−1.155−0.312 ***−0.744 ***−0.299 ***−0.781 ***
(0.038)(1.209)(0.064)(0.242)(0.074)(0.237)
Observations279527952795279527952795
R-squared0.1920.03 0.059
Firm and year effectsYesYesYesYesYesYes
F-value71.27 (0.000)9.42 (0.000)
Wald statistics 119.92 (0.000)86.57 (0.000)97.79 (0.000)98.50 (0.000)
Durbin statistics 21.1598 (0.000)7.1732 (0.0277)11.9505 (0.0076)4.9815 (0.0173)
Wu-Hausman statistics 10.6461 (0.000)3.5809 (0.0280)3.9834 (0.0077)1.6540 (0.0175)
Under the Identification test 23.595 (0.000)23.595 (0.000)6.453 (0.0111)6.543 (0.0111)
Weak Instruments test 11.90111.9012.1482.148
Note: Standard errors in parentheses. *** p < 0.01, ** p < 0.05, * p < 0.1.
Table 10. Endogenous relationship between corporate governance and firm value (Reverse Causality).
VariablesCG_IndexCG_Index
ROA0.0815 **
(0.038)
ROE 0.0229 *
(0.014)
Fsize0.113 ***0.114 ***
(0.022)(0.023)
Fage0.00397 ***0.00404 ***
(0.001)(0.001)
LIQ−0.00406−0.00316
(0.003)(0.003)
AUR−0.00921−0.00637
(0.009)(0.009)
Log_Sale−0.00403−0.00378
(0.014)(0.014)
Constant−0.680 ***−0.701 ***
(0.165)(0.164)
Observations27952795
R-squared0.2040.202
F-statistics32.6532.29
Prob(F-stat)0.0000.000
Number of coid215215
Hausman test63.67 (0.000)66.67 (0.000)
Note: Standard errors in parentheses. *** p < 0.01, ** p < 0.05, * p < 0.1.
Table 11. Regression analysis (Large vs. small firms).
VariablesLarge FirmsSmall Firms
Model 1Model 2Model 3Model 1Model 2Model 3
ROA(-1)0.563 ***0.560 ***0.558 ***0.350 ***0.311 ***0.311 ***
(0.057)(0.059)(0.059)(0.046)(0.045)(0.045)
CG_Index0.036 *** 0.029 **0.006 0.028
(0.047) (0.058)(0.053) (0.060)
TD −0.015 *0.022 * −0.034 ***−0.013 ***
(0.006)(0.028) (0.006)(0.027)
CG_Index * TD 0.011 ** 0.0385
(0.046) (0.050)
Size0.112 **0.733 **0.426 **0.097 *0.0960.095 *
(0.035)(0.034)(0.035)(0.042)(0.041)(0.041)
Age0.147 **0.147 **0.141 **0.131 *0.230 ***0.228 ***
(0.001)(0.001)(0.001)(0.001)(0.001)(0.001)
Liq0.016 ***0.016 ***0.016 ***0.001 **0.002 **0.002 **
(0.004)(0.004)(0.004)(0.000)(0.000)(0.000)
AUR0.045 ***0.045 ***0.045 ***0.059 ***0.047 ***0.047 ***
(0.011)(0.011)(0.011)(0.015)(0.015)(0.015)
Sale−0.025 *−0.027 *−0.026 **−0.018 *−0.006 **−0.004 *
(0.022)(0.022)(0.022)(0.033)(0.032)(0.032)
Constant0.155 **0.101 *0.145 **0.723 ***0.870 ***0.864 ***
(0.237)(0.231)(0.238)(0.241)(0.231)(0.233)
Observations139813981398139713971397
Wald test (p-value)199.26 (0.000)200.39 (0.000)201.66 (0.000)122.55 (0.000)161.26 (0.000)161.80 (0.000)
Sargan test (p-value)0.00180.00150.00170.0000.0000.000
AR(1) p-value0.00000.00000.00000.00000.00000.0000
AR(2) p-value0.6570.5830.6140.2080.2830.315
Instrument rank424244424244
Note: Standard errors in parentheses. *** p < 0.01, ** p < 0.05, * p < 0.1.
Table 12. Regression analysis (High vs. Low levered firms).
VariablesHigh-Leveraged FirmsLow Leveraged Firms
ROAROAROAROAROAROA
ROA(-1)0.396 ***0.348 ***0.361 ***0.311 ***0.299 ***0.305 ***
(0.106)(0.100)(0.103)(0.054)(0.053)(0.053)
CG_Index0.083 *** 0.058 ***0.048 * 0.041
(0.086) (0.170)(0.058) (0.066)
TD −0.024 **−0.034 ** −0.112 ***−0.363 **
(0.008)(0.042) (0.032)(0.167)
CG_Index * TD 0.018 ** 0.442
(0.075) (0.286)
Size0.014 **0.018 **0.031 **0.077 **0.087 ***0.084 **
(0.051)(0.050)(0.053)(0.033)(0.032)(0.033)
Age0.001 **0.008 **0.002 **0.003 ***0.003 ***0.003 ***
(0.001)(0.001)(0.001)(0.001)(0.001)(0.001)
Liq0.029 *0.014 *0.014 **0.018 **0.045 **0.012 **
(0.017)(0.016)(0.017)(0.000)(0.000)(0.000)
AUR0.048 **0.026 **0.026 **0.064 ***0.055 ***0.054 ***
(0.024)(0.024)(0.025)(0.013)(0.013)(0.013)
Sale−0.022 *−0.054 **−0.057 *−0.038−0.032 **−0.030 **
(0.045)(0.044)(0.046)(0.028)(0.028)(0.028)
Constant−0.426−0.272−0.194−0.293 *−0.410 **−0.384 **
(0.309)(0.297)(0.322)(0.168)(0.165)(0.168)
Observations139713971397139813981398
Wald test (p-value)54.64 (0.000)69.65 (0.000)69.88 (0.000)117.26 (0.000)131.60 (0.000)133.30 (0.000)
Sargan test (p-value)0.420.340.410.230.190.18
AR(1) p-value0.00010.00030.00020.00000.00030.0002
AR(2) p-value0.3650.3430.3130.2830.2910.286
Instrument rank424244424244
Note: Standard errors in parentheses. *** p < 0.01, ** p < 0.05, * p < 0.1.
Table 13. Regression analysis (High vs. Low governed firms).
VariablesHighly Governed FirmsLow-Governed Firms
Model 1Model 2Model 3Model 1Model 2Model 3
ROA(-1)0.443 ***0.399 ***0.397 ***0.461 ***0.420 ***0.425 ***
(0.072)(0.072)(0.072)(0.049)(0.047)(0.048)
CG_Index0.036 *** 0.017 ***0.054 0.041
(0.088) (0.106)(0.065) (0.079)
TD −0.027 ***−0.021 * −0.023 ***−0.032
(0.010)(0.089) (0.005)(0.031)
CG_Index * TD 0.008 ** 0.018
(0.125) (0.060)
Size0.012 **0.004 ***0.006 **0.024 **0.032 *0.028 **
(0.037)(0.035)(0.037)(0.035)(0.034)(0.034)
Age0.015 ***0.094 **0.088 **0.099 **0.012 ***0.013 **
(0.001)(0.001)(0.001)(0.001)(0.001)(0.001)
Liq0.012 ***0.011 ***0.011 ***0.015 **0.012 **0.011 ***
(0.004)(0.004)(0.004)(0.002)(0.003)(0.001)
AUR0.044 ***0.038 ***0.039 ***0.029 **0.023 *0.023 *
(0.013)(0.012)(0.013)(0.014)(0.014)(0.014)
Sale−0.024−0.023 *−0.024 *−0.026 **−0.013 **−0.012 **
(0.028)(0.027)(0.028)(0.028)(0.027)(0.028)
Constant0.373 *0.2170.222−0.204−0.369 *−0.343 *
(0.203)(0.202)(0.205)(0.206)(0.201)(0.204)
Observations139813981398139713971397
Wald test (p-value)95.49 (0.000)111.17 (0.000)110.85 (0.000)128.73 (0.000)155.64 (0.000)155.03 (0.000)
Sargan test (p-value)0.560.530.610.310.380.35
AR(1) p-value0.00000.00000.00000.00000.00000.0000
AR(2) p-value0.760.710.570.510.530.62
Instrument rank424242424242
Note: Standard errors in parentheses. *** p < 0.01, ** p < 0.05, * p < 0.1.
Disclaimer/Publisher’s Note: The statements, opinions and data contained in all publications are solely those of the individual author(s) and contributor(s) and not of MDPI and/or the editor(s). MDPI and/or the editor(s) disclaim responsibility for any injury to people or property resulting from any ideas, methods, instructions or products referred to in the content.