


Abstract
This paper examines the effect of a bonus cap on the compensation structure of top earners in the Dutch banking sector. Following concerns that performance-based pay may induce excessive risk-taking, regulators introduced caps on variable compensation. This paper analyzes how such regulation affects the composition of pay. The identification strategy exploits a unique institutional setting in which banks with their statutory seat in the Netherlands are subject to a stricter bonus cap than banks headquartered in other EU countries, while operating in the same market. This paper uses administrative microdata and a difference-in-differences approach to compare compensation outcomes across these groups before and after the introduction of the Dutch bonus cap in 2015. Consistent with the predictions of a principal–agent model of incentive contracting, the hourly variable wage decreases by 23 percent, while the hourly fixed wage component increases by 12 percent. The findings indicate that compensation regulation reshapes the composition of pay.
JEL Classification:
G21; G28; G35
1. Introduction
The financial crisis of 2008 exposed the macroeconomic consequences of excessive risk-taking in the banking sector. Rising mortgage defaults, increasing unemployment, and large-scale public bailouts reflected failures in incentive structures that encouraged excessive risk taking within the financial sector. In response, compensation practices in the banking sector came under increased scrutiny. Variable (bonus) payments were widely viewed as a key driver of excessive risk-taking. This led policymakers to intervene in compensation structures.
Policymakers therefore targeted managerial incentives in the financial sector. These regulatory interventions can be understood through the lens of principal–agent theory. This theory explains that compensation contracts are designed to balance incentives and risk-sharing between shareholders and managers. Regulatory interventions therefore focused on limiting variable pay to reduce incentives for excessive risk-taking. In 2015, the Dutch government imposed a bonus cap of maximum 20% of the employee’s annual salary for all banks with their statutory seat in the Netherlands. Banks headquartered in other EU member states—and operating in the Netherlands—are not subject to this regime.1
This institutional setting provides a natural comparison between banks operating under different incentive constraints. Banks with a statutory seat in the Netherlands are subject to a more restrictive bonus cap than banks headquartered in other EU countries. This setting enables a comparison of banking-sector employees exposed to distinct compensation regimes.
Building on principal-agent theory, a simple principal–agent model is developed that generates clear predictions on how a binding bonus cap affects the composition of compensation.2 Within this framework, restricting variable compensation weakens performance-based incentives. This leads to a reduction in bonus payments. To maintain participation, firms are expected to substitute toward higher fixed compensation. Therefore, the introduction of a bonus cap should decrease variable wage payments, while increasing fixed wage payments.
These hypotheses are tested by using rich administrative data from Statistics Netherlands (CBS) and the Dutch banking register. The administrative data from Statistics Netherlands contain data on the total annual wage payment and the annual number of hours worked. This can be decomposed into a total hourly wage payment, an hourly fixed wage payment, and an hourly variable wage payment. In addition, the datasets contain information on various socioeconomic variables such as age and gender. The Dutch banking register contains data on the statutory seat of banks operating in the Netherlands. This dataset makes it possible to distinguish banks subject to the Dutch bonus cap (treatment group) and those that are not subject to this restriction (control group).
Using a difference-in-differences framework, the introduction of the bonus cap is found to reduce hourly variable wage payments by 23 percent and increase hourly fixed wage payments by 12 percent. These estimates are robust to various sensitivity checks, including alternative definitions of the control and treatment groups.
This paper contributes to the literature in three ways. First, it exploits within-country variation in regulatory exposure. This allows the effect of the bonus cap to be isolated while holding constant institutional and macroeconomic conditions. This approach complements existing studies that rely on cross-country and cross-sector comparisons and extends the identification strategy used in earlier studies (Colonnello et al., 2023; Kleymenova & Tuna, 2021). Second, the analysis focuses on a broader group of top earners (top 10 percent) in the banking sector. This paper thereby complements prior work that concentrates on executive board members by examining a larger affected population (Colonnello et al., 2023; Kleymenova & Tuna, 2021). Third, the paper provides a direct empirical test of how compensation contracts adjust in response to regulatory constraints, offering evidence on the mechanisms predicted by principal–agent theory. In doing so, it also relates to recent contributions examining the interaction between compensation structures, regulation, and financial stability (Le et al., 2025; Eltahir et al., 2025).
The remainder of the paper is organized as follows3. Section 2 reviews the related literature and uses a model to build hypothesis. Section 3 describes the methodology. The section outlines the institutional framework, the data, and the estimation strategy. Section 4 presents the results. Lastly, Section 5 concludes.
2. Literature Review and Hypothesis Development
2.1. Literature Review
The analysis of this paper is grounded in principal–agent theory. This theory examines how compensation contracts are designed to align incentives between shareholders (principals) and managers (agents) under conditions of asymmetric information and risk. In this framework, managers are typically assumed to be risk-averse, while shareholders are relatively risk-neutral (Bull, 1987; MacLeod & Malcomson, 1989; Kini & Williams, 2012). As a result, optimal contracts balance the provision of incentives through variable payments with insurance through fixed compensation.4
A central prediction of principal–agent theory is that variable compensation plays a key role in inducing effort. By linking pay to firm performance, shareholders can incentivize managers to exert effort that increases firm value (Holmström, 1979; Grossman & Hart, 1983; Lazear, 2004). Empirical evidence supports this prediction. Several studies show that stronger incentive schemes increase the sensitivity of managerial actions to performance outcomes such as return on assets and return on equity (Kale et al., 2009; Heyman, 2005). Similar patterns are also observed in the financial sector, where compensation structures are closely tied to firm performance (Fahlenbrach & Stulz, 2011).
The interest of shareholders, however, need not coincide with public interest. In the aftermath of the Great Recession, the European Commission sought to realign managerial incentives by intervening in compensation structures within the financial sector. Under the CRD IV directive, implemented in 2013, variable compensation for bankers was capped at 100 percent of annual fixed salary. By constraining bonus-based incentives, the regulation signaled a shift in policy priorities toward financial stability and away from excessive risk-taking.
A growing empirical literature studies the effects of such compensation regulation. Colonnello et al. (2023) show that bonus caps lead to a reduction in variable compensation and an increase in fixed pay, while having limited effects on systemic risk. Kleymenova and Tuna (2021) study a similar reform in the United Kingdom and document some evidence of a reduction in systemic risk5 alongside higher CEO turnover. The difference might be explained by the difference between the reform in Europe and the United Kingdom.6 These findings suggest that compensation regulation affects the structure of pay and managerial behavior. Its effectiveness in reducing risk, however, depends on the specific institutional design and stringency of the reform.7
This paper contributes to the literature in three ways. First, it exploits within-country variation in regulatory exposure. This makes it possible to isolate the effect of a bonus cap while holding constant institutional and macroeconomic conditions. Existing studies typically rely on cross-country and/or cross-sector comparisons and therefore lack this identification strategy. Second, the analysis focuses on a broader group of top earners in the banking sector by considering the top decile. This provides evidence on how compensation regulation affects a wider segment of highly paid employees, extending beyond studies that focus solely on executive board members. Third, it provides a direct test of how compensation contracts adjust in response to regulatory constraints. This offers a clean empirical assessment of the mechanisms predicted by principal–agent theory.
2.2. Hypothesis Development
To formalize the theoretical mechanisms, a simple principal–agent model is developed (see Appendix A). In this model, a risk-neutral principal (shareholders) hires a risk-averse agent (the executive). The agent chooses effort, which affects firm performance but is not directly observable by the principal. Compensation therefore consists of a fixed component and a performance-based component tied to realized output.
In the absence of wage regulation, the optimal contract includes both fixed and variable pay. Variable compensation provides incentives for the agent to exert effort, while fixed pay ensures that the agent’s participation constraint is satisfied. The introduction of a bonus cap constrains the variable component of compensation. Within the principal–agent framework, this restriction weakens the link between performance and pay. This reduces the agent’s incentives to exert effort. At the same time, the principal must continue to satisfy the agent’s participation constraint. As a result, the principal adjusts the compensation structure by increasing the fixed component of pay to compensate for the reduction in variable compensation.
This framework therefore yields three testable hypotheses:
- (i)
- The variable component of compensation decreases following the introduction of a bonus cap
- (ii)
- The fixed component of compensation increases following the introduction of a bonus cap
- (iii)
- The effect on profits is theoretically ambiguous following the introduction of a bonus cap
These predictions provide a direct link between the theoretical framework and the empirical analysis.
3. Methodology
3.1. Institutional Framework
The regulation of compensation in the banking sector is motivated by concerns that performance-based pay induces excessive risk-taking. In the aftermath of the financial crisis, policymakers increasingly focused on limiting such incentives by constraining variable compensation. Bonus caps aim to reduce risk-taking by weakening the link between performance and pay. The Dutch institutional setting provides a useful environment to study these effects. It generates variation in regulatory exposure within a single country.
The Netherlands adopted a bonus cap of for the annual variable wage in 2015 (the WBFO). The regulation limits annual variable compensation to at most 20% of the annual fixed wage. This concerns both short- and long-term variable wage payments and covers all personnel. In addition, guaranteed variable wage payments are no longer allowed and the same also holds for extremely high severance payments.8 The regulatory objective is to preserve performance-based incentives while constraining excessive risk-taking with potential systemic consequences (House of Representatives, 2014).
The WBFO applies to financial institutions with their statutory seat in the Netherlands, including their foreign subsidiaries. The regulation primarily affects banks and insurance companies (Table 1). However, several financial institutions are exempted. Banks and insurers headquartered in other EU countries but operating in the Netherlands are not subject to the Dutch bonus cap, although they operate in the same sector. In addition, Dutch pension and investment funds are excluded. These groups form natural control groups for analyzing the effects of the bonus cap.
Table 1.
Overview of financial institutions that need and not need to comply with the Dutch bonus cap (WBFO).
Banks headquartered in other EU countries provide a particularly suitable comparison group. They operate under the same macroeconomic conditions, labor market, and broader regulatory environment. The key difference is exposure to the Dutch bonus cap. This institutional feature ensures a high degree of comparability between treated and control banks.
The WBFO is more stringent than the bonus cap introduced by the European Parliament and the Council of the European Union. CRD IV limits variable compensation to at most 100 percent of fixed salary and applies only to identified staff in the banking sector across EU member states (Publications Office of the European Union, 2013). More broadly, the CRD IV framework also aims to enhance financial stability through increased transparency and improved market discipline (see, e.g., Longo et al., 2025; Krause et al., 2025). Against this background, the WBFO imposes a tighter cap and applies more broadly across employees. The WBFO therefore provides a stronger test of how binding compensation constraints affect payment structures.
3.2. Data Collection
Administrative microdata from Statistics Netherlands (CBS, n.d.) covering the period 2011–2019 are used to study how a bonus cap (WBFO) affects the compensation structure of financial sector employees.9 The data provide detailed information on annual earnings, which is decomposed into an annual variable wage payment and an annual fixed wage payment. Using information on the total amount of hours workers, average hourly wages are constructed and decomposed into hourly fixed and variable components. The dataset also includes rich individual characteristics such as age and gender and an indicator for the average amount of hours worked per week.10
Using these data, a treatment and control group are constructed based on exposure to the bonus cap. The treatment group consists of employees in the top decile of the wage distribution at banks with their statutory seat in the Netherlands in the base year 2015. Restricting the sample to the top 10 percent ensures a focus on workers whose compensation is directly affected by the bonus cap.
The control group comprises banking personnel employed in the Netherlands at banks with their statutory seat in another EU member state.11 These employees operate under largely the same regulatory environment, with the exception of the Dutch bonus cap. They perform similar functions and possess comparable skill sets. They are also exposed to the same domestic macroeconomic conditions. For these reasons, this group provides an appropriate counterfactual.
Table 2 provides summary statistics for both control (column 1 and column 2) and treatment group (column 3 and column 4). Descriptive evidence shows that variable compensation declines after the implementation of the WBFO, while fixed pay increases for the treated group. In contrast, variable compensation in the control group remains broadly stable, while fixed pay increases modestly over the same period. As a result, total compensation grows more strongly in the treatment group than in the control group.
Table 2.
Summary statistics for the control group (banks that do not need to comply with a bonus cap) and the treatment group (banks that need to comply with a bonus cap).
Background characteristics, including gender, age, and average hours worked, remain stable over time within both groups. Baseline differences in outcome levels (total hourly wage, fixed hourly wage component, and variable hourly wage component) between the treatment and control groups do not invalidate the difference-in-differences design. The difference-in-differences estimator removes time-invariant level differences through the inclusion of group fixed effects. Identification instead relies on the parallel trends assumption: absent the reform, the treated and control groups would have experienced the same average change in outcomes. Provided this assumption holds, pre-existing differences in levels do not bias the estimated treatment effect.
3.3. Graphical Evidence: Common Trend Assumption
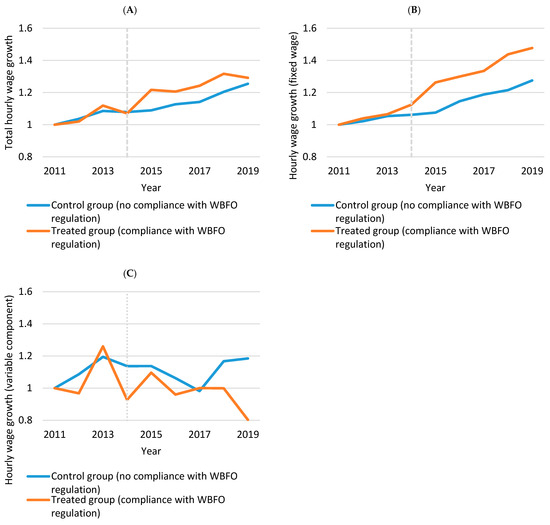
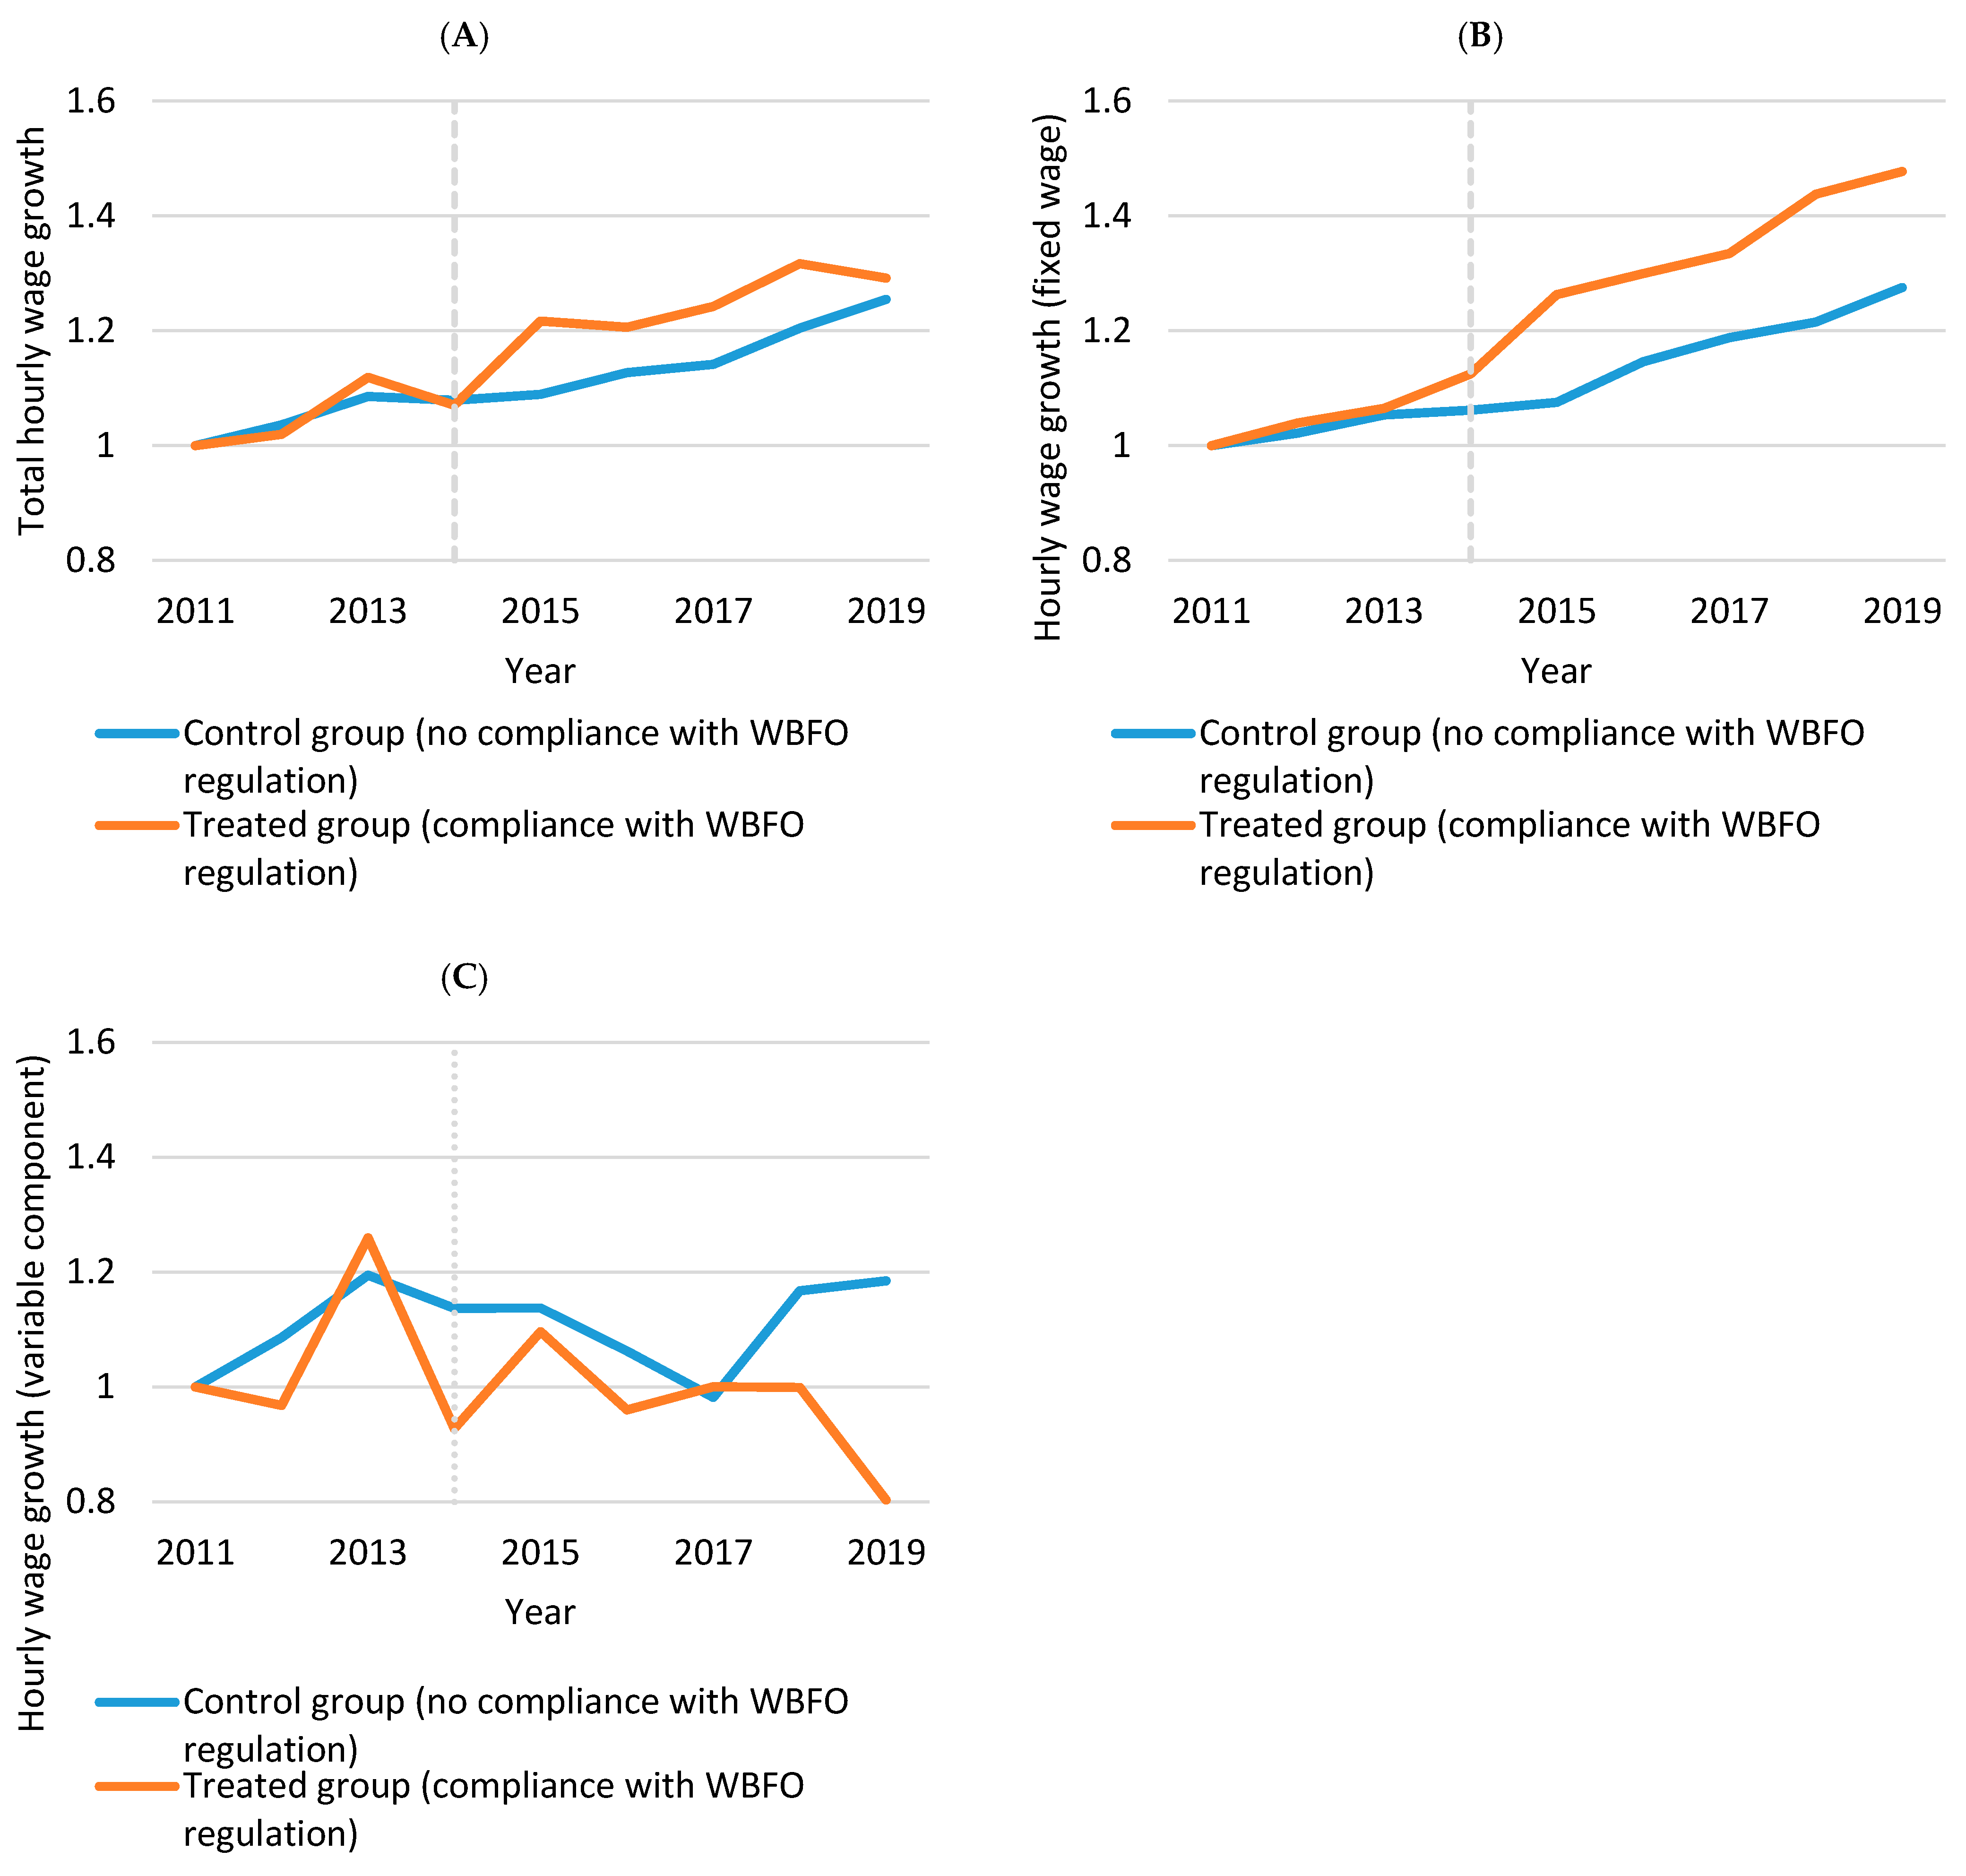
The validity of the difference-in-differences approach relies on the common trends assumption. Figure 1 illustrates pre- and post-reform trends in compensation for the treatment and control groups. This is done separately for the total hourly total wage (Panel A) the hourly fixed wage component (Panel B), and the hourly variable wage component (Panel C). For the annual hourly total wage (A), a clear common trend is visible up to 2015 (the year of the reform). After 2015, there is a sharp increase in the hourly wage growth. A similar pattern is visible for the fixed wage component (B) where a clear kink emerged in the year of the reform. Before the reform there is also a slight deviation, which might be due to a slight different reaction to the introduction of the CRD IV regulation. Lastly, when analyzing the variable wage component, the trend is less clear when compared to the graphs on the total wage payment and the fixed wage payment. Although variable compensation is more volatile, the overall pre-treatment trends do not display systematic divergence. The absence of pre-trends in the graphical analysis suggests that there are no anticipatory effects prior to the reform.
Figure 1.
Common trend graphs for the total hourly wage (Panel A), the hourly fixed wage component (Panel B), and the hourly variable wage component (Panel C). Source: CBS Microdata and Dutch banking register. Note: The observations are weighted by inverse probability weighting to correct for attrition. The baseline is set to 1 for all wage components in the baseline year 2011. Using this baseline, the change in the growth rate of each wage component is plotted over time. The dashed vertical line indicates the year prior to the reform (2015).
3.4. Estimation Strategy
Principal-agent theory predicts that the introduction of a bonus cap has different effects on the fixed and variable wage components. In the empirical analysis, these components are directly mapped to the fixed and variable components of hourly wages observed in the data. This makes it possible to test the model’s predictions on how a bonus cap affects payment composition. Following prior studies such as Colonnello et al. (2023) and Kleymenova and Tuna (2021), the effect of the bonus cap is estimated using a difference-in-differences framework. The regression equation is as follows:
In regression Equation (1), denotes the intercept and are year fixed effects for the years 2011–2019. The binary indicator equals one if an individual works at a bank subject to the bonus cap and zero otherwise. denotes the difference-in-differences estimator. This variable equals unity in case (i) individuals work at a bank, which has to comply with the bonus cap, and (ii) they work there after 2014, when the bonus cap became binding. If these conditions are not met, equals zero. The dependent variable denotes the outcome of interest for individual in group in year . The above regression is estimated using three dependent variables: the natural logarithm of the total hourly wage sum, the natural logarithm of the fixed hourly wage, and the natural logarithm of the variable hourly wage component12. To account for selective exit from the banking sector, inverse probability weighting is applied.13
The coefficient on the interaction term captures the effect of the bonus cap on each wage component. A positive (negative) sign indicates that the total wage sum or part of the compensation component increases (decreases). Since the dependent variables are natural logarithms, the coefficients multiplied by one hundred give the percentage change in the total wage or the change of a particular wage component. Based on the theoretical model, a negative (positive) coefficient is expected in the regression where the dependent variable is the variable (fixed) wage component. Table 3 shows the regression results.
Table 3.
The effect of a bonus cap on the compensation of banking personnel.
4. Results
Total hourly wages increase by an average of 7 percent following the introduction of the bonus cap (column (1), Table 3). The coefficient is significant at the one percent level. Including the control variables raises the estimated effect to 8 percent without affecting its sign or statistical significance (column (2), Table 3). This increase is driven by changes in the composition of pay. Fixed hourly wages rise by 11 percent (12 percent with controls; columns (3) and (4) in Table 3), while variable hourly wages decline by 25 percent (23 percent with controls; columns (5) and (6) in Table 3). All estimates are statistically significant at the 1 percent level. These results provide direct empirical support for the predictions of the principal–agent model. The observed reduction in variable pay and increase in fixed pay are consistent with the theoretical mechanism that firms substitute toward fixed wage payments when variable wage payments are constrained.
Sensitivity Analysis
Several robustness checks are conducted to assess whether the baseline estimates are driven by sample composition, differential selection, or the choice of control group. The identifying assumption in the difference-in-differences design is that, absent the bonus cap, wages of employees in Dutch banks and the control group would have followed parallel trends. Each sensitivity check therefore targets a specific threat to this assumption.
First, concerns are addressed that the estimated effects reflect changes in sample composition rather than changes in pay policies. In particular, if individuals exit employment around the introduction of the bonus cap, average wages could change mechanically even without any change in compensation practices. The sample is therefore restricted to individuals who are employed both four years prior to the policy change and in the implementation year. (“stayers up to implementation”). The results in row (1) of Table 4 show that the estimated effects are virtually unchanged in sign and statistical significance across all wage components. This suggests that the baseline findings are not driven by differential employment attrition before the policy takes effect.
Table 4.
The effect of a bonus cap on the compensation of banking personnel.
Second, the control group is redefined to improve comparability in terms of baseline earnings capacity. Since the control group (employees in the Netherlands working under foreign bank contracts) is heterogeneous, differences in wage levels could reflect differences in job mix and seniority rather than exposure to the bonus cap. To improve comparability with the treated group, the control group is restricted to individuals in the top 50 percent of the income distribution within that group.14 The results in row (2) of Table 4 show that the estimated effects remain robust across all wage components. This strengthens the interpretation that the findings are not driven by low-wage composition within the control group, but reflect differential wage dynamics following the introduction of the cap.
Third, the control group is modified by comparing employees in the top 10 percent of the wage distribution at Dutch banks to those in the top 10 percent at other Dutch financial institutions (pension and investment funds, see Table 1). The motivation is that these institutions operate in the same domestic labor market and face similar macroeconomic shocks. Since those institutions do not need to comply with the CRD IV requirement, regression (1) is changed by incorporating a dummy variable for the CRD IV regulation. This dummy equals unity after 2013 for banks and zero otherwise. In this specification, no statistically significant effect on total hourly wages is found. One possible explanation is that sectoral differences between banks and other financial institutions affect baseline compensation structures and wage-setting practices, thereby attenuating the estimated effect. Despite the absence of an effect on total wages, the decomposition into wage components yields consistent patterns. The hourly fixed wage increases, while the hourly variable wage decreases, with both estimates showing similar signs and levels of statistical significance as in the baseline specification.
Overall, the sensitivity analyses support the conclusion that the bonus cap primarily affected the composition of pay (reducing variable pay and increasing fixed pay), and that this pattern is not an artifact of pre-policy employment attrition or a particular control-group definition. The full regression output and graphs are displayed in Appendix C.
5. Discussion and Conclusions
This paper studies the effect of a bonus cap on compensation structures in the Dutch banking sector. Exploiting a regulatory reform that caps bonuses for banks with a statutory seat in the Netherlands, this paper provides causal evidence on how compensation contracts adjust when performance-based pay is constrained.
The reported results are consistent with the predictions of principal–agent theory. In standard models of incentive contracting, variable compensation aligns the incentives of risk-averse agents with those of shareholders, while fixed pay ensures participation. When regulation constrains the use of variable compensation, firms adjust compensation contracts to satisfy the participation constraint. In line with this mechanism, this paper finds that the introduction of the bonus cap leads to a substantial reduction in variable compensation and a corresponding increase in fixed pay. This close alignment between theoretical predictions and empirical findings suggests that the observed adjustment in compensation structure is driven by the incentive and participation constraints highlighted in the principal–agent framework.
Empirically, the results closely align with Colonnello et al. (2023), who document a similar shift from variable to fixed compensation following the introduction of bonus caps at the European level. These findings extend this evidence in three important ways. First, this paper focuses on a broader group of top earners rather than only executive board members, thereby providing evidence on a wider segment of the wage distribution. Second, this paper exploits within-country variation in regulatory exposure, allowing the effect of the bonus cap to be isolated from confounding cross-country institutional differences. Third, it provides a direct test of how compensation contracts adjust in response to regulatory constraints. This offers a clean empirical assessment of the mechanisms predicted by principal–agent theory.
Although this analysis focuses on the Dutch banking sector, the underlying mechanisms are grounded in principal–agent theory and are therefore likely to apply more broadly. In particular, in settings where regulation constrains performance-based pay, firms can be expected to adjust compensation structures in similar ways. At the same time, the extent to which these findings generalize may depend on institutional features such as labor market flexibility, the competitiveness of the financial sector, and the strictness of enforcement.
From a policy perspective, these findings suggest that bonus caps primarily alter the structure of compensation rather than its overall level. Imposing a binding constraint on variable pay not only reduces bonuses but also leads to an increase in fixed wages. Banks adjust the entire compensation package, without reducing total pay. In addition, these changes in compensation structure have important implications for incentives and risk-taking. A shift from variable to fixed pay makes compensation less sensitive to performance, which may increase risk aversion among employees. While this is consistent with the regulatory objective of limiting excessive risk-taking, it may also weaken incentives for effort and performance.
Finally, several limitations of this study should be acknowledged. First, this paper focuses on compensation structures and does not directly observe bank risk-taking or performance outcomes. This limits the ability to assess the effectiveness of bonus caps in achieving their primary policy objective. Future research could build on these findings and use the estimation strategy by Kleymenova and Tuna (2021) to analyze how changes in compensation composition translate into changes in bank behavior, financial stability, and long-term performance. Second, the identification strategy relies on the parallel trends assumption. While graphical evidence supports this assumption, the presence of unobserved differences in trends between the treatment and control groups cannot be fully ruled out. For instance, differences in organizational structure or business models between domestic and foreign banks may still affect comparability.
Author Contributions
Conceptualization, J.W. and A.R.; Methodology, A.R. and J.W.; Formal analysis, A.R.; Resources, J.W.; Writing—original draft, A.R.; Writing—review & editing, A.R. and J.W. All authors have read and agreed to the published version of the manuscript.
Funding
This research received no external funding.
Institutional Review Board Statement
Not applicable.
Informed Consent Statement
Not applicable.
Data Availability Statement
Restrictions apply to the availability of these data. Data were obtained from Statistics Netherlands (CBS) and are available from CBS-microdataportaal (https://microdata.cbs.nl/en, accessed on 26 February 2026) with the permission of CBS.
Acknowledgments
We would like to thank Daniël van Vuuren for his feedback on an earlier version of this paper. All remaining errors are our own.
Conflicts of Interest
The authors declare no conflict of interest.
Appendix A. Theoretical Model
In this section, a simple principal–agent model is developed. In this model, compensation consists of a fixed and a performance-based (variable) component. The analysis builds on Becker and Stigler (1975). The model features a risk-neutral principal (shareholders) who hires a risk-averse agent (the executive). This risk-averse agent can exert effort , where more effort increases the firms’ profit . Therefore, the firm’s profit is determined by:
where , where denotes a random noise component representing outcome uncertainty. The final term denotes the wage the principal needs to pay to the agent. The agent’s utility function is given by:
In Equation (A2), the pay-off for the agent consists of a fixed wage component and a variable wage component that consists of a share of the profits , hence: It is assumed that indicating that a higher profit share and more effort both result in higher variable payments (). The second term indicates the marginal disutility of effort. In line with the literature15, it is assumed that these costs are convex and given by . This implies that exerting more effort is costly for the agent. The last term indicates the agent’s risk tolerance from variable payments.
In order for the agent to participate in the contract, both the participation constraint (PC) and the incentive compatibility constraint (ICC) need to be satisfied. Those are given by, respectively:
If the participation constraint is not satisfied, the agent will choose the outside option with a utility level of . The incentive compatibility constraint gives the agent an incentive to induce effort.16
Case 1: No bonus cap
In case there is no bonus cap, we find the following outcomes for effort , variable wage component , fixed wage component , and profits :
Proof.
See Appendix A.1. □
The results show that when the agent receives a share of profits, both total compensation and firm profits increase.17 Intuitively, profit sharing raises the agent’s incentives to exert effort, which increases output. The fixed component of the wage is increasing in the agent’s outside option through the participation constraint , implying that better external opportunities raise the fixed wage component. A higher profit share reduces the fixed wage component, although the net effect on total salary payment is positive.18 Lastly, firm profits are also increasing in the agent’s profit share .19
Case 2: bonus cap
In case of a bonus cap the variable wage component is restricted up to . Therefore, the pay-off for the agent becomes . Given the sharp decrease in the amount of variable wage components, the upper bound of variable payment is assumed to be equal to . This yields the following outcomes for effort , the variable wage component , the fixed wage component , and profits :
Proof.
See Appendix A.2. □
By definition, implies that the equilibrium level of effort is lower in case of a binding bonus cap than in the absence of this constraint. Based on these results, three testable hypotheses are derived regarding the effect of a bonus cap:
- (i)
- The variable component of compensation decreases following the introduction of a bonus cap
- (ii)
- The fixed component of compensation increases following the introduction of a bonus cap
- (iii)
- The effect on profits is theoretically ambiguous following the introduction of a bonus cap
Proof.
See Appendix A.3. □
By construction, the bonus cap reduces the variable component of compensation. To satisfy the participation constraint, firms respond by increasing fixed pay. The effect on profits is ambiguous, as the cap lowers both output—through reduced effort—and total compensation costs, making the net effect theoretically ambiguous.
Appendix A.1. Derivation: Optimal Outcome Without Bonus Cap
To derive the optimal solution in the absence of a bonus cap, the first-order condition of the incentive compatibility constraint is taken with respect to effort . This yields:
Intuitively, a higher risk premium or a higher tolerance for risk both increase the agent’s wage payment .
Using the optimal level of effort , the expected bonus payment equals:
Given the optimal amount of effort , the fixed salary component equals (from PC constraint):
And when it binds:
The principal’s profit function then becomes:
where is the sum of the variable and fixed wage. Hence, the principal’s profit function can be written as:
Appendix A.2. Derivation: Optimal Outcome with a Bonus Cap
Given the institutional framework Section 3.1, it is assumed that the bonus cap binds, hence variable payment is equal to:
Meaning that the bonus payment equals the cap. Therefore the optimal amount of effort becomes:
This effort level is lower because once the cap is hit, the marginal benefit of additional effort becomes zero. Therefore, it follows that the agent exerts less effort under a bonus cap:
Given the optimal amount of effort from the ICC constraint, the PC constraint equals:
Or, when PC binds, the fixed salary equals:
The principal’s profit function then becomes:
where is the sum of the variable and fixed wage. Hence, the principal’s profit function can be written as:
Appendix A.3. Derivation: Comparison Bonus Cap and No Bonus Cap
A comparison of the outcomes under a bonus cap and in its absence shows that, by construction, the variable component of compensation is lower when a bonus cap is imposed. Hence:
To analyze whether the fixed wage component is higher in case of a bonus cap:
Since , define , where to find:
Since , and , the above equation is always larger than zero. Therefore, the fixed wage component is higher in case of a bonus cap.
To check whether profits are lower due to the bonus cap:
where is used again, where to find:
It is given that , and but . Therefore, it is ambiguous whether profits will increase or decrease in case of a bonus cap.
Appendix B. Full Regression Output
Appendix B.1. Total Hourly Wage
Table A1.
The effect of a bonus cap on the compensation of banking personnel.
Appendix B.2. Fixed Hourly Wage
Table A2.
The effect of a bonus cap on the compensation of banking personnel.
Appendix B.3. Variable Hourly Wage
Table A3.
The effect of a bonus cap on the compensation of banking personnel.
Appendix C. Sensitivity Check
Appendix C.1. Employed Since 2011
Figure A1.
Common trend graphs for the total hourly wage (Panel A), the hourly fixed wage component (Panel B), and the hourly variable wage component (Panel C). Source: CBS Microdata and Dutch banking register. Note: Only individuals who are employed in the baseline year 2011 are selected. Using this baseline, the change in the growth rate of each wage component is plotted over time. The dashed vertical line indicates the year prior to the reform (2015).
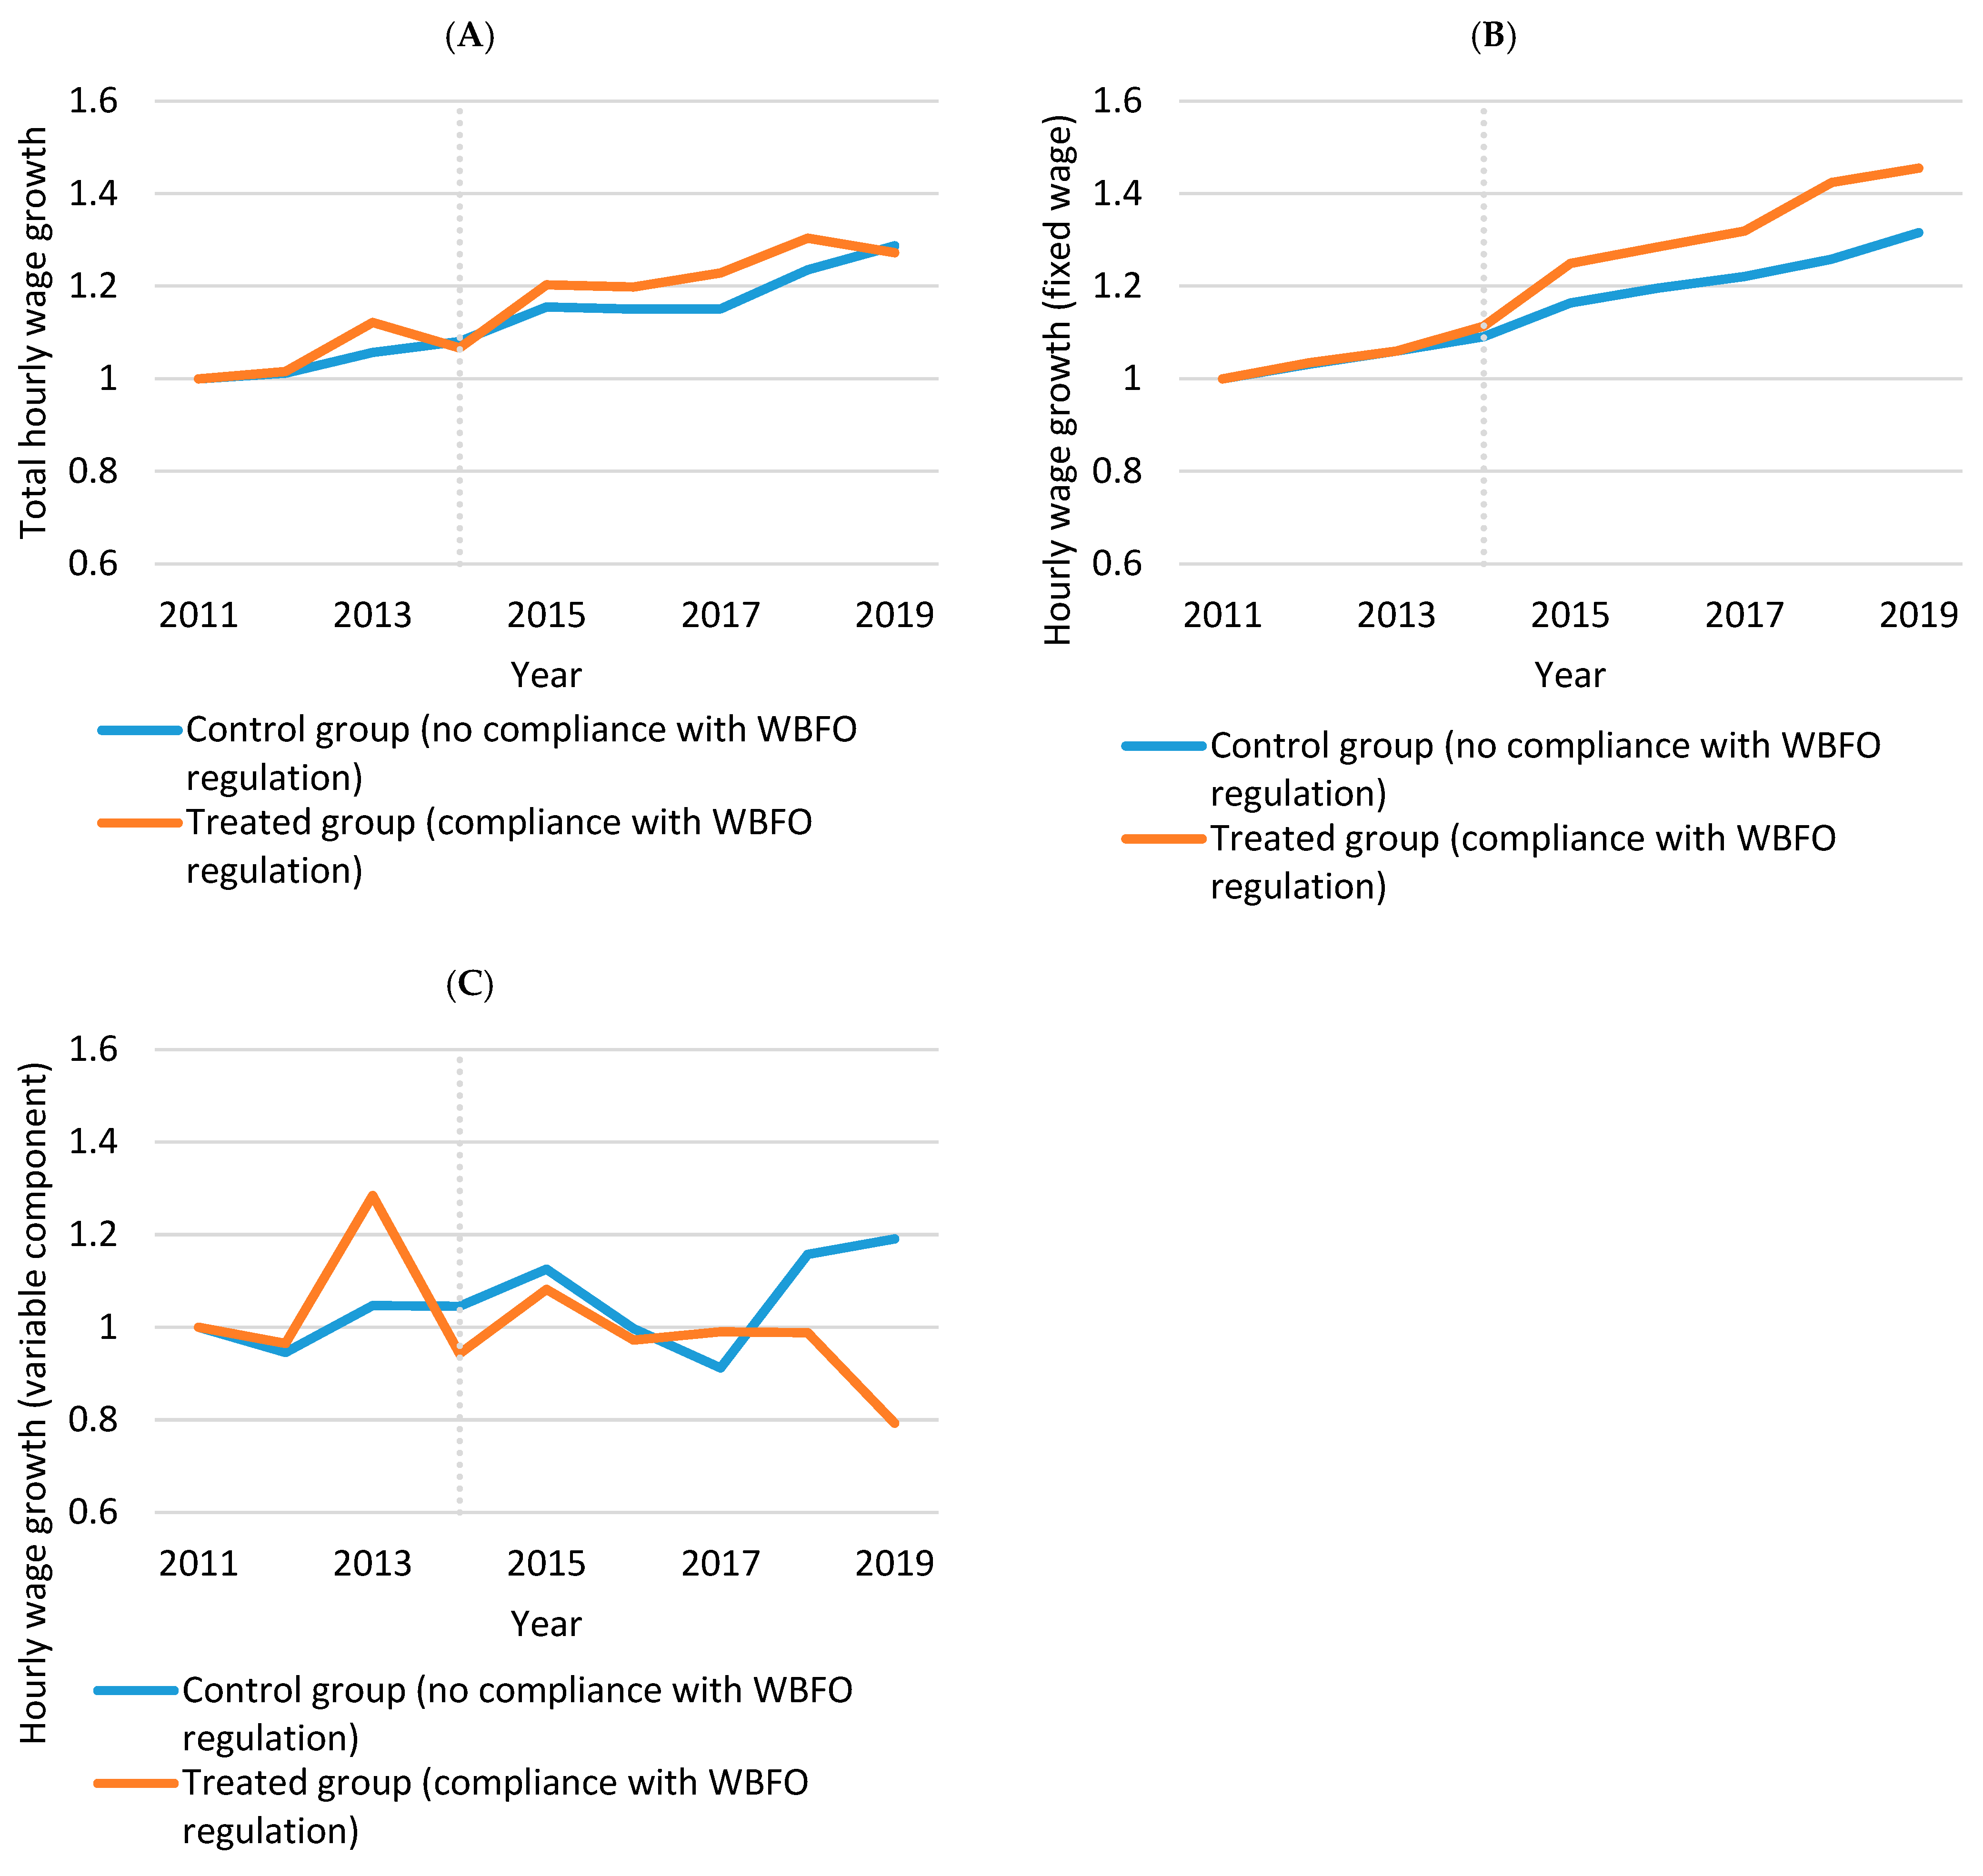
Table A4.
The effect of a bonus cap on the compensation of banking personnel.
Appendix C.2. Control Group: Top 50% of Non-Wbfo Banks
Figure A2.
Common trend graphs for the total hourly wage (Panel A), the hourly fixed wage component (Panel B), and the hourly variable wage component (Panel C). Source: CBS Microdata and Dutch banking register. Note: only individuals who belong to the top 50 percent of the income distribution for banks that do not need to comply with the WBFO regulation are selected. Using this baseline, the change in the growth rate of each wage component is plotted over time. The dashed vertical line indicates the year prior the implementation to the reform (2015).
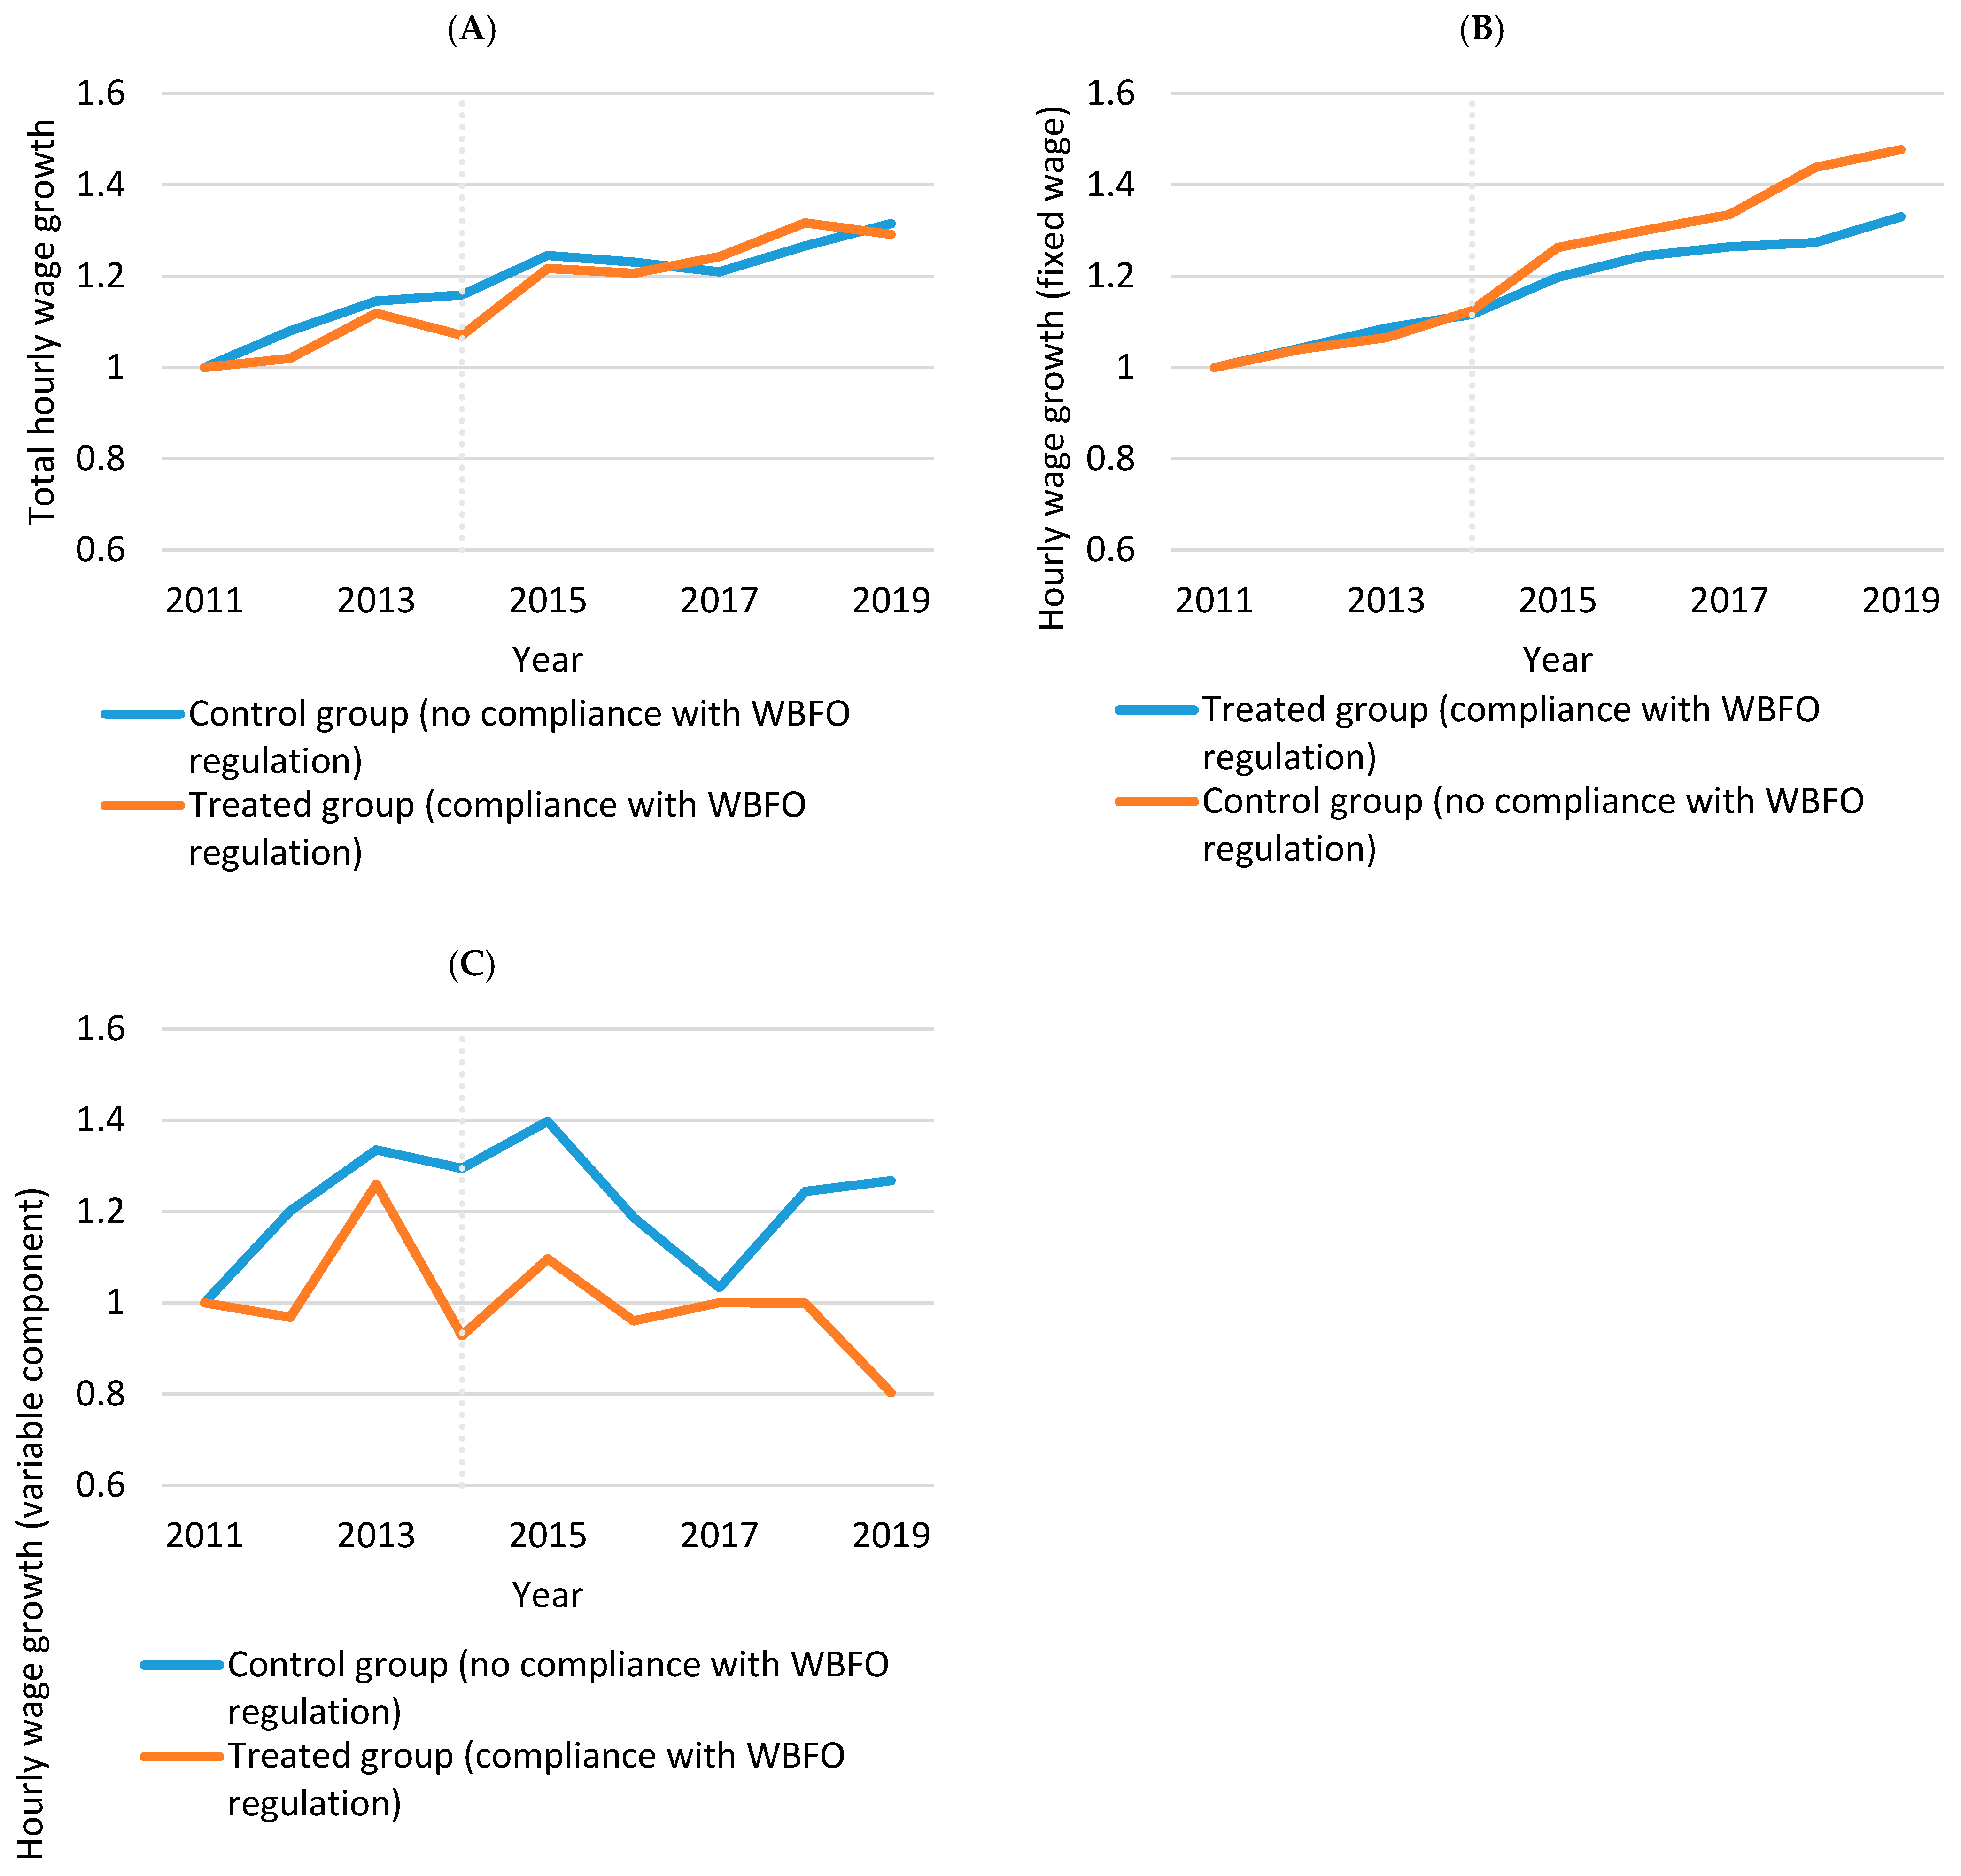
Table A5.
The effect of a bonus cap on the compensation of banking personnel.
Appendix C.3. Control Group: Top 10% of Dutch Pension and Investment Funds
Figure A3.
Common trend graphs for the total hourly wage (Panel A), the hourly fixed wage component (Panel B), and the hourly variable wage component (Panel C). Source: CBS Microdata and Dutch banking register. Note: Individuals that belong to the top 10% in the banking sector and the Dutch pension and investment funds are selected. Using this baseline, the change in the growth rate of each wage component is plotted over time. The dashed vertical line indicates both the CRD IV reform (after 2013) and the WBFO reform (after 2014).
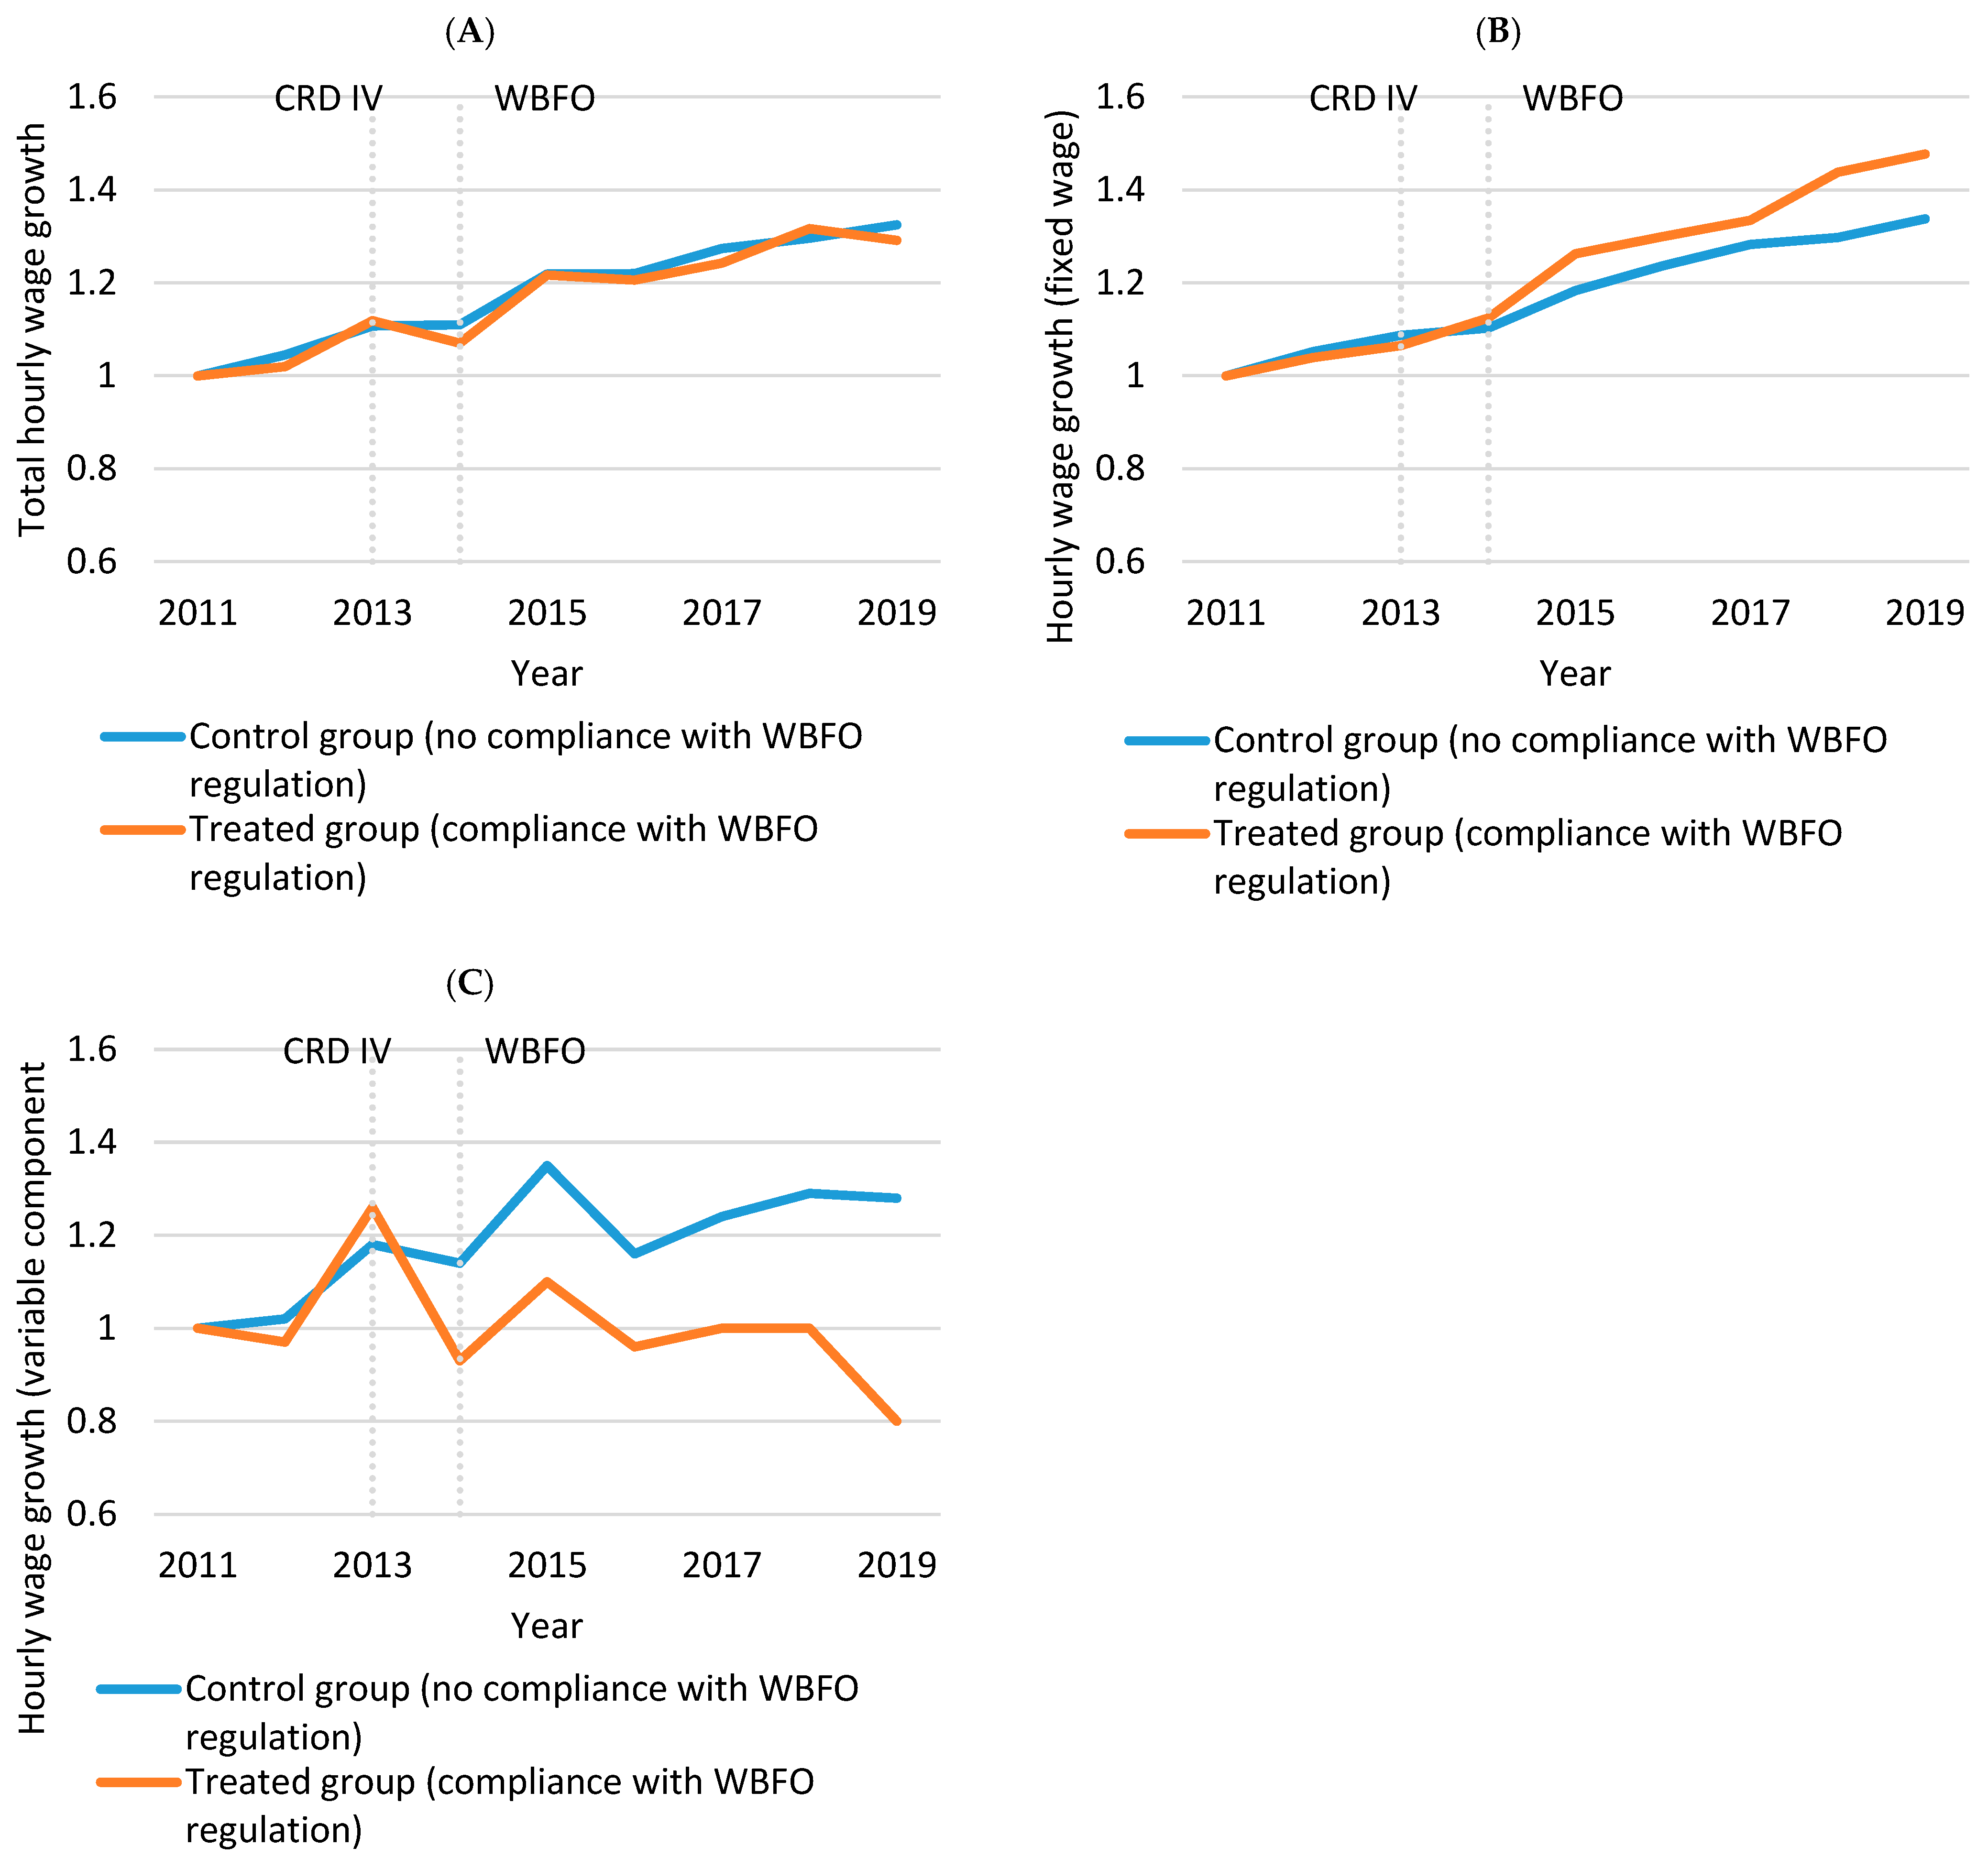
Table A6.
The effect of a bonus cap on the compensation of banking personnel.
Notes
| 1 | Other European banks are capped by the CRD IV directive. The European Commission introduced the CRD IV directive in 2013. This directive capped variable compensation at 100 percent of fixed annual salary. |
| 2 | This paper does not analyze the effect of a bonus cap on bank-performance and risk taking as adequate data for such analysis are not available to the authors. |
| 3 | This paper is an extended version of the conference paper ‘The Effect of a Bonus Cap on Compensation Structure in the Banking Sector’, presented at the RSEP International Conference on Economics, Finance and Business in Lisbon, January 2026 (Rutten & Witteman, 2026). |
| 4 | See Lazear (2018) for an overview on how reward structurers affects behavior and therefore affect choices. |
| 5 | More precisely, they find a decrease in effective risk taking when compared to other firms, but not when compared to other banks in Europe and the US. |
| 6 | In Europe there was a cap on the variable pay, while in the United Kingdom the bonus pay was capped and mandatory linked to long term performance goals. |
| 7 | In addition, differences in board behavior may contribute to these divergent findings. Boards aligned with shareholder interests may resist strategies that reduce risk-taking when such strategies conflict with shareholders’ preferences (Kolm et al., 2017). This limits the effectiveness of compensation regulation. |
| 8 | In addition, extreme welcome bonuses are limited by the financial market regulators. Financial market regulators are authorized to classify welcome bonuses as extreme without any political intervention. |
| 9 | The sample is restricted to the period 2011–2019 for two reasons. First, data availability allows wages to be consistently decomposed into fixed and variable components from 2011 onwards, providing a clean pre-treatment window to assess parallel trends. Second, the period 2015–2019 captures the medium-term adjustment of compensation structures following the reform. The sample ends in 2019 to avoid confounding effects from the COVID-19 period. |
| 10 | Those six categories are (i) less than 12 h, (ii) 12 up to 20 h, (iii) 20 up to 25 h, (iv) 25–30 h, and (v) 30 up to 35 h, and (vi) more than 35 h. |
| 11 | The sensitivity check restricts the selection of employees in the control group. The results do not change in terms of sign or significance. |
| 12 | More formally a regression is estimated using the natural logarithm of one plus the variable wage component, as this component is equal to zero for some individuals in certain years. |
| 13 | Not weighting the observations does not lead to substantial different outcomes in terms of size or sign. |
| 14 | It is not possible to do this for the top 10% of the income distribution due to a lack of observations. The control group would become too small for regression analysis. |
| 15 | Assuming convex effort costs is standard in principal–agent models. Holmström (1979) and Grossman and Hart (1983) show that convex disutility of effort ensures interior solutions and well-behaved incentive contracts. Empirical evidence is consistent with this assumption. Paarsch and Shearer (2000) and Shaerer (2004) find that models with convex effort costs provide a good fit to observed behavior under performance-based compensation schemes. |
| 16 | An alternative interpretation of the incentive compatibility constraint (ICC) is to view it as a mechanism that disciplines shirking. In this framework, the contract must provide sufficient incentives to induce effort rather than opportunistic behavior. See Blinder and Choi (1990), Hall (1993), Agell and Lundborg (1995) and Bewley (1995). |
| 17 | Formally, it is possible to express the share of the profit as a function of exogenous parameters. This is not pursued here, as it does not contribute to illustrating the main difference between the situation with and without a bonus cap. |
| 18 | To see this, total salary equals . The first order condition with respect to is positive. |
| 19 | , which is by definition larger than zero. |
References
- Agell, J., & Lundborg, P. (1995). Theories of pay and unemployment: Survey evidence from Swedish manufacturing firms. The Scandinavian Journal of Economics, 97(2), 295–307. [Google Scholar] [CrossRef] [Scilit]
- Becker, G., & Stigler, G. (1975). Law enforcement, malfeasance, and compensation of enforcers. Journal of Legal Studies, 3(1), 1–18. [Google Scholar] [CrossRef] [Scilit] [PubMed]
- Bewley, T. (1995). A depressed labor market as explained by participants. American Economic Review, 85(2), 250–254. [Google Scholar]
- Blinder, A., & Choi, D. (1990). A shred of evidence on theories of wage stickiness. Quarterly Journal of Economics, 105(4), 1003–1015. [Google Scholar] [CrossRef] [Scilit]
- Bull, C. (1987). The existence of self-enforcing implicit contracts. Quarterly Journal of Economics, 102(1), 147–159. [Google Scholar] [CrossRef] [Scilit]
- Colonnello, S., Koetter, M., & Wagner, K. (2023). Compensation regulation in banking: Executive director behavior and bank performance after the EU bonus cap. Journal of Accounting and Economics, 76(1), 101576. [Google Scholar] [CrossRef] [Scilit]
- Eltahir, I. A., Taha, M. A., Alnor, N. H., Adam, S. H., & Musa, E. H. (2025). The role of financial compensation oversight committees in improving the financial performance governance of Saudi Banks. Journal of Risk and Financial Management, 18(9), 514. [Google Scholar] [CrossRef] [Scilit]
- Fahlenbrach, R., & Stulz, R. M. (2011). Bank CEO incentives and the credit crisis. Journal of Financial Economics, 99(1), 11–26. [Google Scholar] [CrossRef] [Scilit]
- Grossman, S. J., & Hart, O. (1983). Implicit contracts under asymmetric information. The Quarterly Journal of Economics, 98, 123–156. [Google Scholar] [CrossRef] [Scilit]
- Hall, J. (1993). The wage setters guide to wage rigidity [Master’s thesis, University of Southampton]. [Google Scholar]
- Heyman, F. (2005). Pay inequality and firm performance: Evidence from matched employer–employee data. Applied Economics, 37(11), 1313–1327. [Google Scholar] [CrossRef] [Scilit]
- Holmström, B. (1979). Moral Hazard and observability. The Bell Journal of Economics, 10(1), 74–91. [Google Scholar] [CrossRef] [Scilit]
- House of Representatives. (2014). Wijziging van de wet op het financieel toezicht houdende regels met betrekking tot het beloningsbeleid van financiële ondernemingen (Wet beloningsbeleid financiële ondernemingen). Overheid.nl. [Google Scholar]
- Kale, J., Ebru, R., & Venkateswaran, A. (2009). Rank-order tournaments and incentive alignment: The effect on firm performance. The Journal of Finance, 64(3), 1479–1512. [Google Scholar] [CrossRef] [Scilit]
- Kini, O., & Williams, R. (2012). Tournament incentives, firm risk, and corporate policies. Journal of Financial Economics, 103(2), 350–376. [Google Scholar] [CrossRef] [Scilit]
- Kleymenova, A., & Tuna, I. (2021). Regulation of compensation and systemic risk: Evidence from the UK. Journal of Accounting Research, 59(3), 1123–1175. [Google Scholar] [CrossRef] [Scilit]
- Kolm, J., Laux, C., & Lóránth, G. (2017). Bank regulation, CEO compensation, and boards. Review of Finance, 21(5), 1901–1932. [Google Scholar] [CrossRef] [Scilit]
- Krause, T., Sfrappini, E., Tonzer, L., & Zgherea, C. (2025). How do EU banks’ funding costs respond to the CRD IV? An assessment based on the banking union directives database. Journal of Financial Stability, 78, 101416. [Google Scholar] [CrossRef] [Scilit]
- Lazear, E. P. (2004). Output-based pay: Incentives, retention or sorting? In Accounting for worker well-being (pp. 1–25). Emerald Group Publishing Limited. [Google Scholar]
- Lazear, E. P. (2018). Compensation and incentives in the workplace. Journal of Economic Perspectives, 32(3), 195–214. [Google Scholar] [CrossRef] [Scilit]
- Le, B., Reddy, N., & Moore, P. H. (2025). The determinants of CEO compensation in the banking sector: A comparison of the influence of cross-listing and loan growth in developed versus developing countries. Journal of Risk and Financial Management, 18(3), 163. [Google Scholar] [CrossRef] [Scilit]
- Longo, S., Fabrizi, M., & Parbonetti, A. (2025). Market reaction to EU CRD IV regulation in the banking industry. Research in International Business and Finance, 73, 102652. [Google Scholar] [CrossRef] [Scilit]
- MacLeod, W., & Malcomson, J. (1989). Implicit contracts, incentive compatibility, and involuntary unemployment. Econometrica, 57(2), 447–480. [Google Scholar] [CrossRef] [Scilit]
- Paarsch, H., & Shearer, B. (2000). Piece rates, fixed wages, and incentive effects: Statistical evidence from payroll records. International Economic Review, 41(1), 59–92. [Google Scholar] [CrossRef] [Scilit]
- Publications Office of the European Union. (2013). Directive 2013/36. Official Journal of the European Union. Available online: https://eur-lex.europa.eu/legal-content/EN/TXT/HTML/?uri=CELEX:32013L0036 (accessed on 30 January 2026).
- Rutten, A., & Witteman, J. (2026, February 4–5). The effect of a bonus cap on compensation structure in the banking sector. RSEP International Conference on Economics, Finance and Business, Lisbon, Portugal. [Google Scholar]
- Shaerer, B. (2004). Piece rates, fixed wages, and incentives: Evidence from a field experiment. The Review of Economic Studies, 71(2), 513–534. [Google Scholar] [CrossRef] [Scilit]
- Statistic Netherlands (CBS). (n.d.). CBS Microdata: Dutch administrative data on wages and employment. Available online: https://microdata.cbs.nl/en (accessed on 26 February 2026).
- Witteman, J., van Kesteren, J., Verheuvel, N., Klinker, I., Rutten, A., & Barge, F. (2024). Nadere evaluatie wet beloningsbeleid financiële ondernemingen. SEO Amsterdam Economics. [Google Scholar]

Disclaimer/Publisher’s Note: The statements, opinions and data contained in all publications are solely those of the individual author(s) and contributor(s) and not of MDPI and/or the editor(s). MDPI and/or the editor(s) disclaim responsibility for any injury to people or property resulting from any ideas, methods, instructions or products referred to in the content. |
© 2026 by the authors. Licensee MDPI, Basel, Switzerland. This article is an open access article distributed under the terms and conditions of the Creative Commons Attribution (CC BY) license.