1. Introduction
Over the last decade, the global economy has been changing rapidly with new technologies that have reshaped the economic perspective due to better and more accessible financial services. In particular, the rise in financial technologies has introduced a new tool of easily accessible finance. Fintech is particularly important for underbanked populations and countries where digital financial adoption remains limited. It provides easier access to finance through digital banking platforms, alternative credit scoring systems, mobile payments, and peer-to-peer lending platforms (
Aduba et al., 2022;
Jena, 2025;
Irfan et al., 2024). In developing countries, traditional banking is less accessible and remains limited; financial technologies play a critical role and hold tremendous potential for adoption, bridging financial gaps that foster inclusive economic participation. While some emerging economies have experienced rapid growth, many others are still in the earlier stages of economic expansion. The rapid growth does not necessarily translate into improved financial access or greater financial equality. Multiple persistent barriers, including weak infrastructure, geographic isolation, economic exclusion, limited education, poor institutional quality, and labor market segmentation, continue to prevent large segments of the population from accessing financial services (
Blancheton & Chhorn, 2021;
Ismail et al., 2024;
Asongu & Odhiambo, 2019). Restricted access to financial services and unequal income distribution constrain economic progress, limiting the disadvantaged groups’ ability to escape poverty. Remarkable progress has been seen in Sub-Saharan Africa, South Asia, Latin America, Central and Eastern Europe, and the Asia–Pacific region, where mobile financial technologies have enabled millions of people to integrate into the global or regional financial ecosystem (
Asongu & Odhiambo, 2019;
Rivera et al., 2025;
Kshetri & Acharya, 2012;
de Oliveira Barbosa et al., 2018;
Panait et al., 2024;
Miftari et al., 2024;
Irfan et al., 2024).
The increased access to mobile phones, internet access, and the cost efficiency and effectiveness of digital technology make it appealing to low-income groups, who are sensitive to higher bank fees and geographical limitations. As a result, fintech makes a substantial contribution to economic resilience, but the benefits are not always distributed uniformly. Socioeconomic factors, political stability, institutional quality, and government impact can significantly influence the degree of financial inclusion. In addition, disparities in education and digital literacy may exclude disadvantaged groups from exploring the full potential of financial technologies (
Cevik, 2024;
Cicchiello et al., 2021).
Whereas the above studies use data from different countries, our main objective is to investigate the role of financial technology (fintech) in expanding financial inclusion in emerging countries. Despite a growing body of research on fintech and financial inclusion, several gaps remain, specifically regarding the focus on a limited number of countries, reliance on cross-sectional data, or examination of only a narrow set of outcome measures. This study addresses these gaps as (1) it employs a cross-national sample panel data from 121 developing countries between 2011 and 2021; (2) it introduces a PCA-based composite institutional quality index derived from six World Bank governance indicators; and (3) it investigates fintech’s effect across multiple proxies of financial inclusion simultaneously, enabling direct comparison across these dimensions, alongside a set of macroeconomic, demographic, and institutional control variables.
We find that fintech emerges as a highly significant variable across all models, affecting financial inclusion. Broader financial infrastructure, GDP growth, and trade openness also support inclusion, though their effects vary across savings, borrowing, and technology adoption. Increased income reduces borrowing demand, while government expenditure shows mixed significance. Population growth negatively affects inclusion, reflecting infrastructure gaps. Education consistently enhances account ownership and borrowing, as digital literacy empowers individuals to leverage fintech. Institutional quality—through trust, stability, and effective governance—remains crucial for sustaining fintech adoption and ensuring reliable financial access.
The remainder of the paper is structured as follows.
Section 2 includes the literature review and formulates our primary hypothesis.
Section 3 outlines data and methodology.
Section 4 presents the empirical results, and
Section 5 and
Section 6 discuss and draw conclusions.
2. Literature Review
2.1. The Theories Behind
The fintech framework is built on several major theories that highlight its transformative role in financial inclusion and intermediation. For example,
Ozili (
2020) emphasizes the importance of context-specific policies rather than universal solutions, recognizing that each country has distinct characteristics shaping financial access. In recent years, financial inclusion outcomes have been closely tied to the diffusion of innovation and the delivery of services, positioning fintech as a stronger alternative to traditional intermediaries. Conventional theories of financial intermediation, such as those by
Gurley and Shaw (
1960) and
Diamond and Dybvig (
1983), originally underscored the role of banks in reducing transaction costs and providing liquidity. However, technological advancements have modernized this perspective, with mobile money platforms and AI-driven fintech emerging as new forms of financial intermediaries that expand functionality and global reach. These innovations reduce barriers to access and reshape the financial landscape. Moreover,
Ismail et al. (
2024), through their analysis of Financial Intermediation Theory, further validate fintech’s role as a modern intermediary that mitigates asymmetries and transaction costs, and explore its potential long-term impact on adoption and human development.
2.2. Fintech: A New Foundation for Financial Management
According to
Vasile et al. (
2021), the five pillars of financial inclusion are access, education, resilience, corporate social responsibility, and support tools. Financial tools empower households and businesses to manage their resources effectively, growing and strengthening economic resilience and stability. The growth projections for most developing countries are faster and higher than those of developed countries, offering an excellent environment for fintech companies, which find less regulation and more growth opportunities in these countries.
Yoon et al. (
2023) show that the global adoption of digital payments has steadily increased, from 54% in 2014 to 62% in 2017, and reaching 70% by 2021. Fintech solutions could offer tools previously inaccessible to lower-income populations and small businesses, including budgeting, expense tracking, and savings mechanisms that foster financial responsibility and long-term planning. Digital platforms facilitate access to credit, promoting growth and job creation. Cultural resistance and a lack of education can be driven by skepticism, but financial technology will prevail due to its benefits and the advantages it offers.
Furthermore, structural factors include behaviors, account ownership barriers, limited infrastructure, lower levels of digital literacy, and cultural factors that contribute to financial exclusion (
Fernández-Olit et al., 2020). This perspective aligns with the findings of
Chummun et al. (
2014) and
Njogo et al. (
2022), who argue that digital inclusion must consider not only access to technology but also trust and financial literacy.
2.3. Mobile Money and the Evolution of Financial Access
Mobile money and financial technology have revolutionized the financial landscape, breaking traditional barriers and promoting economic participation.
Telukdarie and Mungar (
2023) employ a systemic dynamics approach to confirm that digital technologies, AI, and mobile platforms facilitate revenue growth for micro-enterprises, promoting economic participation and enabling informal workers and rural communities to access credit and engage in local commerce. In addition,
Gaibulloev et al. (
2024) treat fintech as a strategically valuable investment that outperforms traditional banking on operational efficiency and reach. Moreover,
Kim et al. (
2018) confirm that mobile financial services promote financial inclusion and economic development by providing services to the underserved, thereby enhancing broader economic development.
Cicchiello et al. (
2021) find that in low-income countries with weak banking systems, financial inclusion is strongly correlated with GDP growth and poverty reduction, particularly in rural regions.
Asongu and Odhiambo (
2019) demonstrate that higher mobile phone usage is associated with improved growth quality and reduced income inequality, particularly when accompanied by robust institutional frameworks. Mobile money platforms have enabled secure, efficient, and cost-effective transactions without requiring formal institutions or physical infrastructure. Supporting this,
Chummun et al. (
2014) indicate that the full potential of mobile money, particularly supporting savings and credit services, remains underutilized mainly due to low awareness and limited financial education among users.
Kshetri and Acharya (
2012) emphasize that mobile payments in emerging markets significantly reduce transaction costs and broaden access to open banking services for low-income populations. From this synthesis of information, it is clear that the evolution to Fintech has expanded beyond basic payments to include savings accounts, microloans, insurance, and investment opportunities, enabling the population and small businesses to access tools previously unavailable and unreachable (
Ajambo, 2023).
2.4. Fintech’s Cost Efficiency and Service Expansion
Fintech significantly reduces the cost of delivering financial services, a key factor influencing the development of payment platforms.
Ha et al. (
2025) find that Fintech innovations lower transaction costs and reshape market dynamics; however, their long-term success depends on digital trust, positive regulatory frameworks, and well-designed inclusion strategies.
Demir et al. (
2020) emphasize that market imperfections, such as transaction costs or information asymmetries, can hinder access to finance and exacerbate inequality, suggesting that digital financial inclusion is crucial in mitigating these effects. For this reason, developing countries should consider promoting financial inclusion through fintech. By leveraging these platforms, financial service providers can minimize operational costs and deliver services more efficiently and affordably over time. However, the presence of hidden fees, limited internet access, and weak regulatory oversight can still pose challenges. These issues underscore the need for government intervention to ensure that Fintech systems are equitable, transparent, and trustworthy.
2.5. Digital Infrastructure and Behavioral Drivers
Mobile phones and portable devices connected to the internet infrastructure are now more accessible and affordable than ever, serving as a transformative force and a critical driver of financial inclusion.
Ha et al. (
2025) emphasize that mobile-based financial services have the potential to democratize access to finance despite remaining underutilized and limited by infrastructure and policy gaps. According to
Aduba et al. (
2022), Fintech strongly promotes financial development in emerging markets and developing economies with weak financial infrastructure.
Fernández-Olit et al. (
2020) examine the impact of infrastructure in developed countries and suggest that while digital financial services can enhance financial inclusion, they may also contribute to exclusion. They indirectly suggest that reliable internet access is a significant challenge, particularly in developing countries.
Odei-Appiah et al. (
2021) demonstrate that countries with favorable institutional conditions, strong performance expectations, and a clear understanding of the practical benefits of financial mobile technologies can experience faster adoption and diffusion of these technologies.
Vasile et al. (
2021) emphasize that the lack of internet and mobile access creates a digital divide that intersects with culture, gender, and socio-economic status, affecting how Fintech reaches different groups of the population.
Panait et al. (
2024) suggest that developing a robust digital network and closing digital connection gaps are essential for financial inclusion and the underprivileged population. Another study by
Ismail et al. (
2024) emphasizes the need for infrastructure and public–private collaborations to bridge the digital divide and maximize inclusion. In addition,
Jena’s (
2025) evidence from rural India shows that fintech adoption depends on ease of use and usefulness, while insecurity and digital discomfort can attenuate its positive effects.
Despite its promise, large segments of the population could be excluded due to literacy gaps and limited digital infrastructure. Technological advancements hold significant potential but require complementary efforts and appropriate support to address access and usability limitations.
Panait et al. (
2024) highlight the dark sides of Fintech and persistent inequalities in Central and Eastern Europe, where poor internet access, trust issues, and low digital literacy prevent individuals from fully benefiting from Fintech. Similarly,
Ismail et al. (
2024), in a panel of 7 developing economies, state that greater internet access and subscriptions were significant predictors of Fintech adoption and financial inclusion.
2.6. Institutional Quality, Governance, and Regulatory Capacity
Policies, government support, and institutional quality factors significantly influence the success of fintech solutions and financial inclusion initiatives. The role of government has been proven to directly influence traditional financial inclusion, which is now increasingly interconnected with fintech. Transparent regulation and strong governance could create an environment conducive to rapid fintech adoption.
Blancheton and Chhorn (
2021) demonstrate that, for Asia-Pacific countries, progressive government intervention and higher institutional quality (characterized by low corruption and regulations) are associated with lower income inequality.
Furthermore, mobile financial platforms integrated into government payment systems may significantly reduce administrative costs and corruption, increase the net benefits of social programs, and boost transparency in public spending.
Iqbal et al. (
2021) state that government quality strengthens the relationship between finance and growth, suggesting improved public-sector efficiency and promoting financial development.
Njogo et al. (
2022) show that the adoption of digital payment platforms has complex effects on corruption; for example, increased use of mobile money without oversight can sometimes correspond to higher corruption indices in Western African countries.
The unregulated expansion of Fintech may have unintended governance consequences; therefore, clear Fintech regulations, robust consumer protection policies, and governmental and institutional support for digital literacy are necessary. A recent study by
Polishchuk et al. (
2024) demonstrated that Ukraine’s digital financial system strongly opposed the Russian invasion, owing to its resilient legal frameworks, wartime regulatory flexibility, and fintech. Similarly,
Panait et al. (
2024) identified different levels of Fintech maturity across CEE nations, arguing that countries with low regulatory oversight experienced less effective financial integration. The government plays a crucial role in establishing a robust regulatory environment and promoting stable, long-term cooperation among institutions, policymakers, and stakeholders.
2.7. Education and Inequality, Human Capital as a Moderator
Education is considered one of the most critical factors in enhancing the impact of fintech on financial inclusion. The higher the educational level and the larger the educated population, the stronger the positive correlation between increased financial literacy and improved money management using digital financial tools.
Jena (
2025) demonstrates that digital literacy initiatives can enhance adoption and effectiveness.
In the context of Fintech, the more educated individuals are, the higher the rates at which they adopt digital financial services, suggesting that improving literacy and technical skills is essential for inclusive Fintech (
Azmeh & Al-Raeei, 2024). However, educational disparities can also make fintech exclusionary: better-off, better-educated groups are more likely to capture digital financial benefits, potentially widening inequality (
Telukdarie & Mungar, 2023).
2.8. Literature Synthesis and Raising Hypotheses
Summarizing the above, the existing literature highlights the potential of fintech, particularly mobile financial technologies, to expand financial access and help to increase financial inclusion in developing countries. Fintech platforms help underserved and rural populations, but benefits are not evenly distributed due to factors such as institutional quality, government effectiveness, corruption, regulatory frameworks, socio-cultural factors, and politics. While mobile money platforms have demonstrated success and their expansion is inevitable, gaps remain in understanding how these technologies affect financial inclusion metrics in promoting equal opportunities for financial participation. Furthermore, the literature emphasizes the importance of supporting policies, digital literacy, digital infrastructure, and educational support to maximize this impact.
The literature converges on two empirically testable relationships. First, fintech adoption—proxied by digital payment usage—is consistently associated with greater formal account ownership, though its effects on savings and borrowing are more variable, suggesting that mere access to digital payment infrastructure is necessary but not sufficient for deeper financial integration (H1). Second, country-level heterogeneity in financial inclusion outcomes is systematically shaped by macroeconomic conditions (GDP growth, inflation, trade openness), demographic pressures (population growth), human capital (education), and institutional quality (governance, rule of law, corruption control). These contextual factors either amplify or constrain fintech’s inclusion benefits, and failing to account for them risks overstating fintech’s standalone impact (H2). The hypotheses below are thus grounded in this two-level framework: a direct fintech-to-inclusion pathway, and a set of moderating structural conditions.
H1. Financial inclusion is positively related to the use of fintech solutions (measured by the dependent variable “made or received a digital payment”).
H2. Differences in financial inclusion across countries are determined by underlying economic, social, and institutional conditions.
3. Data and Methodology
Country-level data are retrieved from the World Bank Global Findex surveys (2011, 2014, 2017, and 2021). This database is released periodically and provides detailed indicators of financial inclusion, incorporating fintech usage based on national surveys of the adult population over time. We have used unbalanced panel data on 121 developing countries. In addition, our database includes several macroeconomic and institutional variables obtained from the World Development Indicators, World Governance Indicators, International Monetary Fund (IMF), the World Institute for Development Economics Research (UNU-WIDER), and the Peace Research Institute Oslo (PRIO) (see
Table 1 and
Table 2).
Furthermore, we have constructed the Institutional Quality Index using six variables derived from Principal Component Analysis (PCA) based on governance indicators from the World Bank, including voice and accountability, rule of law, control of corruption, government effectiveness, regulatory quality, and political stability.
Although the initial dataset encompasses 121 developing countries across four Global Findex survey waves (2011, 2014, 2017, 2021), the estimation sample for models including the fintech variable is reduced to 89 countries and 205 observations. This reduction arises from two sources. First, the digital payment variable was not collected in the 2011 Findex survey, eliminating all 121 observations from that wave. Second, listwise deletion due to missing fintech and control variable values across 2014–2021 further reduces the sample. The robustness specification (Model 5), which excludes fintech, retains 94 countries, as five additional countries—Algeria, Angola, China, Lao PDR, and Yemen—have sufficient data for that model only. The 121-country figure refers to the total panel used for descriptive statistics and the institutional quality PCA construction, while 89 countries constitute the core estimation sample.
Table 3 provides descriptive statistics of our main variables used in the article. The dataset shows substantial cross-country variation across all variables. Financial inclusion indicators reflect similarly wide disparities: formal account ownership has a mean of 43.298 (min 0.4, max 98.17, SD 25.673), formal savings average 14.039 (min 0.12, max 59.77, SD 10.306), and formal borrowing averages 14.159 (min 0.6, max 46.13, SD 9.768). These low mean values and large ranges suggest that access to and usage of traditional financial services remain uneven and often limited across countries. Broader account ownership—including financial institution and mobile money accounts—has a mean of 46.411 with high variation (min 0.4, max 98.46, SD 24.841), while digital payment activity averages 41.867 (min 4.17, max 97.41, SD 23.270), highlighting significant differences in fintech adoption and digital readiness across developing economies. The IMF Financial Development Index also varies extensively, with a mean of 25.18 (min 2.933, max 73.136, SD 15.511), reflecting unequal levels of financial system sophistication across countries.
Macroeconomic variables exhibit even more pronounced volatility. GDP growth averages 2.916 but spans from −49.128 to 33.769 (SD 5.344), demonstrating periods of severe economic contraction as well as rapid expansion across different nations. Inflation shows a mean of 9.309 but ranges dramatically from −26.7 to 235.515 (SD 18.498), indicating that while some countries experience stable or even deflationary environments, others face extreme inflationary pressures. Government final consumption expenditure averages 14.887% of GDP, with moderate variation (min 2.36, max 43.702, SD 5.841), and trade openness has a mean of 77.616% (min 4.128, max 186.676, SD 34.726), illustrating differing levels of economic integration into global markets.
Demographic and human-capital indicators also show broad dispersion. Population growth averages 1.529% annually but ranges from −5.416 to 9.992 (SD 1.495), indicating that while some countries face population decline, others experience rapid demographic expansion. Secondary school enrollment averages 76.182% (min 5.46, max 141.203, SD 26.915), reflecting substantial differences in educational access and quality—including cases exceeding 100% due to grade repetition or delayed enrollment. Institutional quality, measured through a PCA-based index, is centered at 0 with a standard deviation of 2.151 and a range from −3.978 to 5.252, confirming large differences in governance performance across developing countries. Finally, the conflict dummy variable has a mean of 0.25 and a standard deviation of 0.433 (range 0–1), indicating that one-quarter of the observations occur in conflict-affected settings, which can significantly influence economic stability, inclusion, and inequality outcomes.
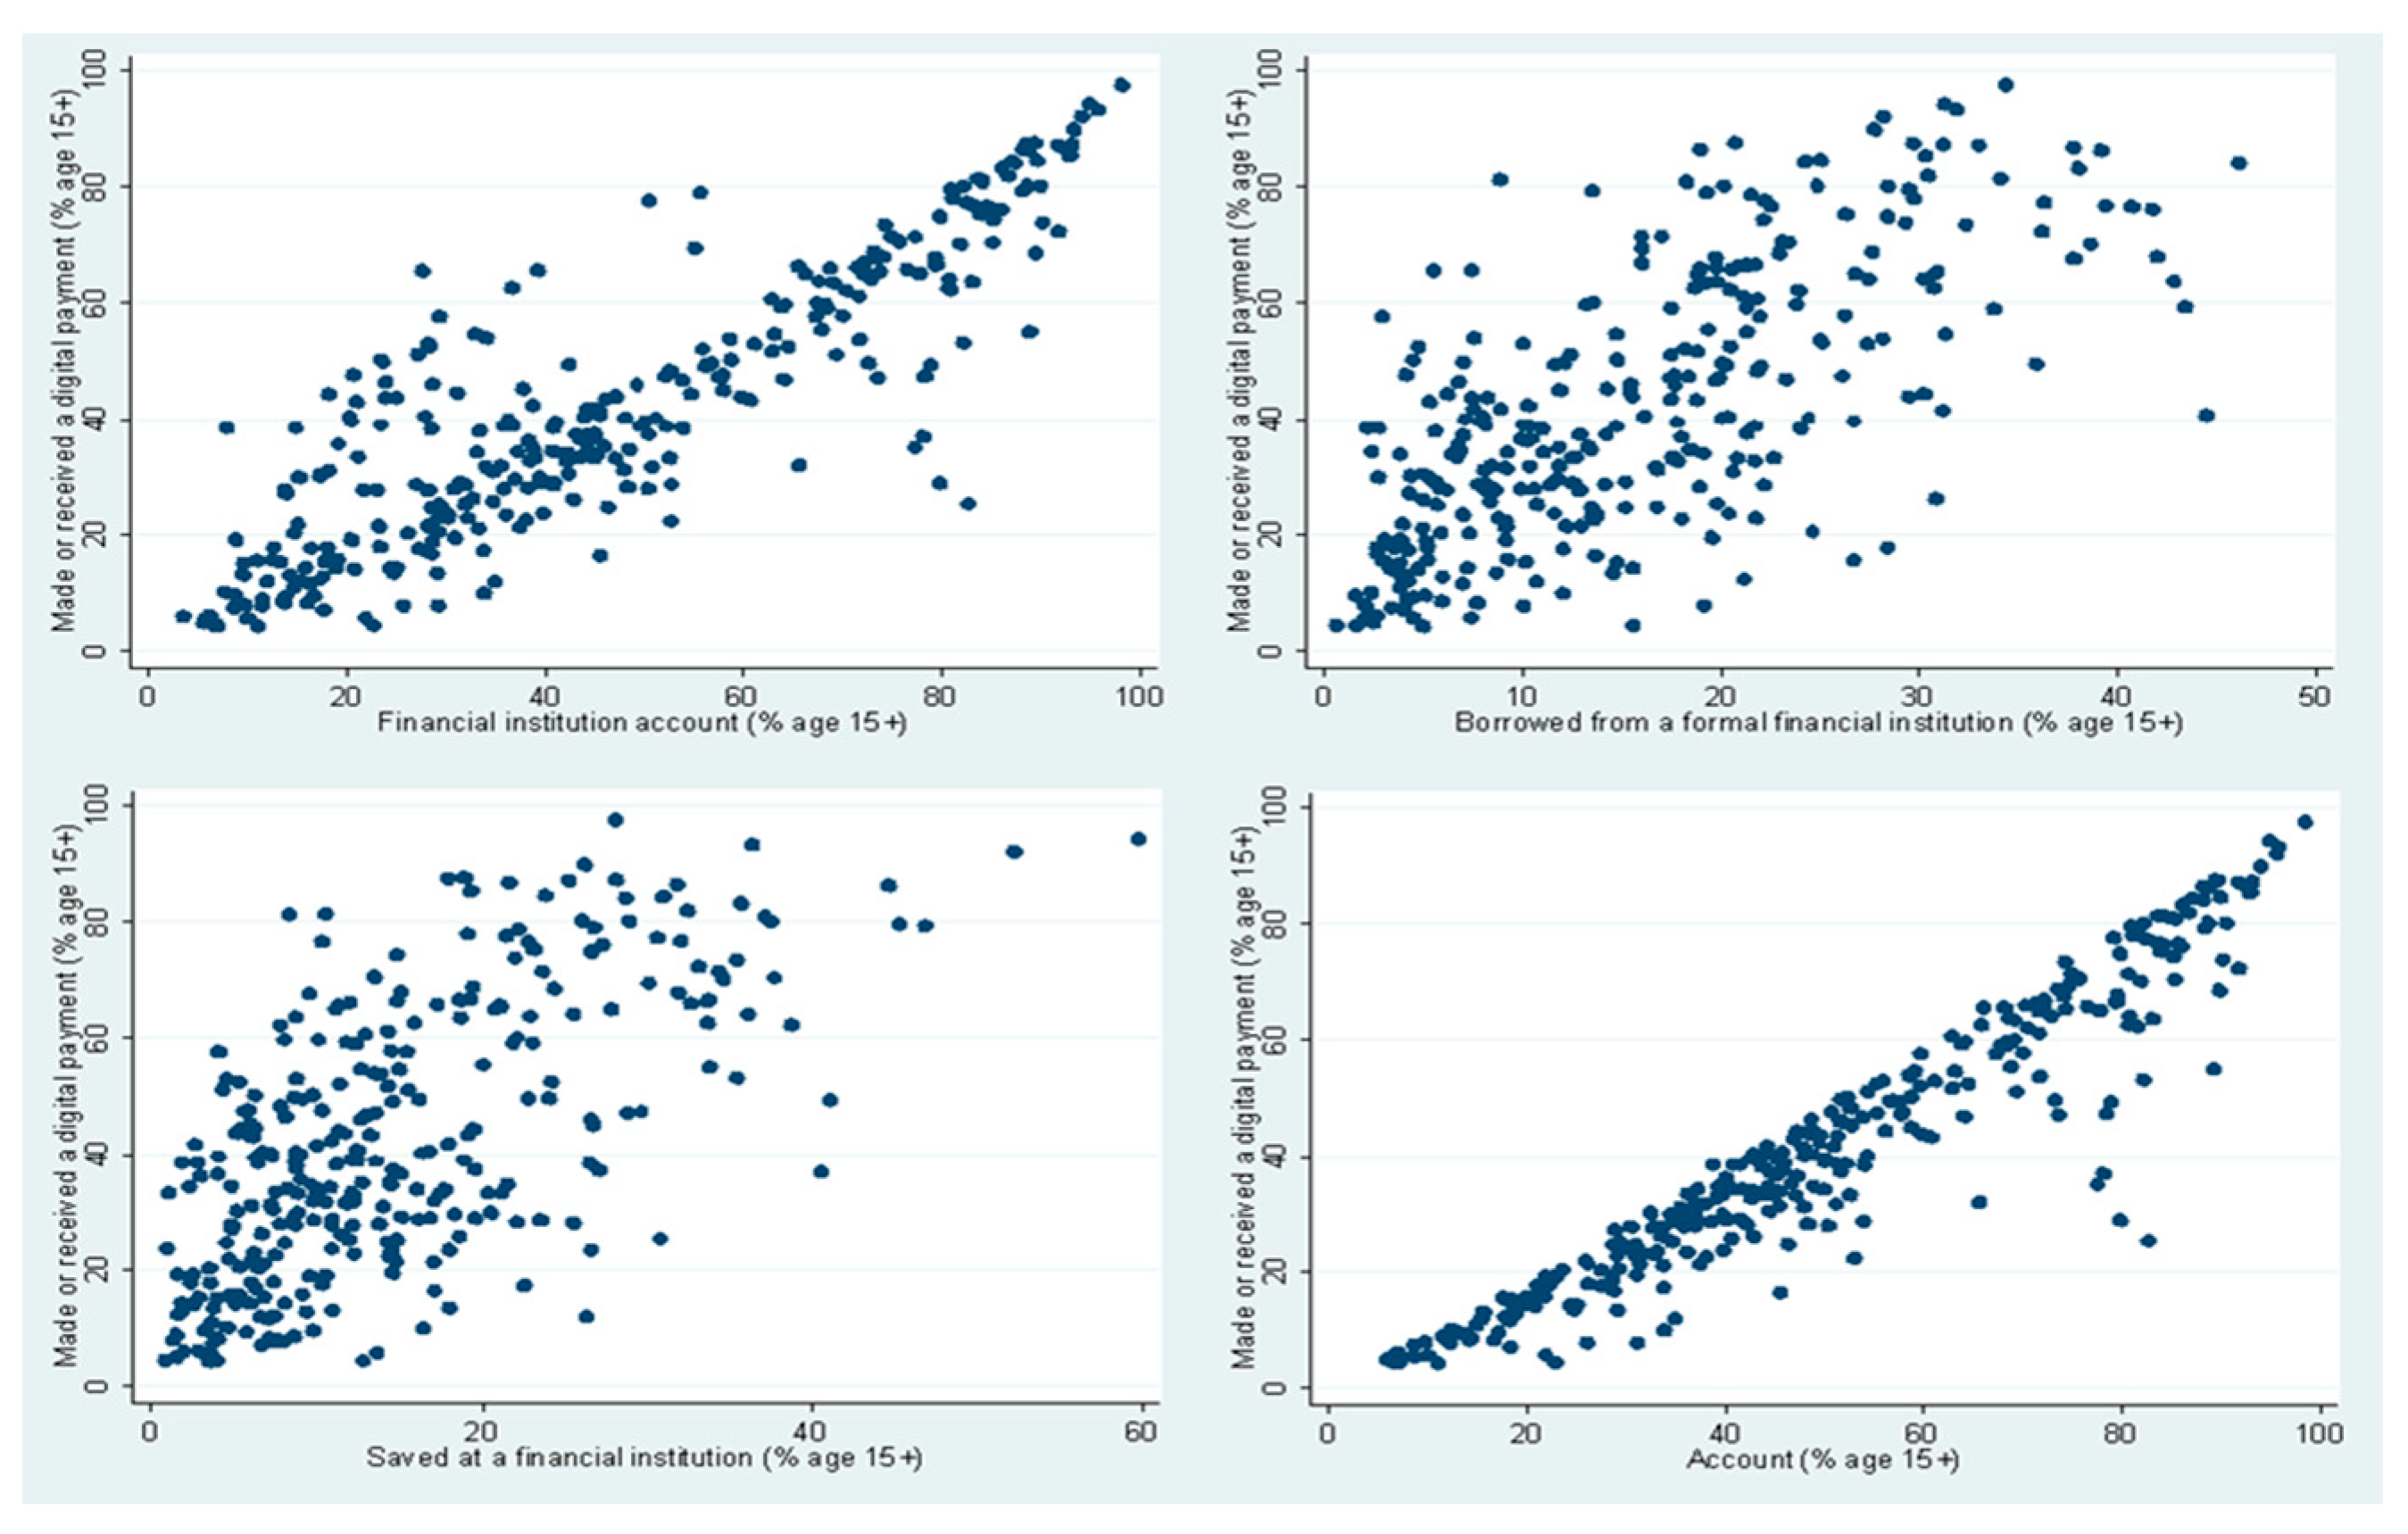
In a preliminary investigation of our variables as shown in
Figure 1, the relationship between digital financial activity—measured by making or receiving digital payments—and several financial inclusion indicators reveals a clear and consistent positive correlation. As the share of adults engaging in digital payments increases, the percentage of individuals holding formal accounts, saving at financial institutions, or borrowing from them also rises. This upward trend suggests that greater interaction with digital payment systems is strongly associated with higher levels of integration into the formal financial sector. The visual clustering of data points along an upward-sloping pattern reflects fintech’s role as a catalyst for expanding financial access and supports the conclusion that fintech serves as a complementary mechanism to traditional banking, enabling underserved populations to participate more actively in financial services. As such, further investigation into this relationship is pursued by building the model below. An important conceptual distinction should be noted between the fintech variable and the dependent variables. The fintech proxy—the share of adults who made or received a digital payment—measures active digital financial behavior, specifically participation in digital payment ecosystems. The dependent variables, by contrast, capture formal financial integration: holding an account, saving, or borrowing at a regulated financial institution. While these constructs are correlated (r = 0.87 for formal account ownership), they are conceptually distinct: digital payment activity is the enabling mechanism, while formal financial inclusion represents the outcome. The partial exception is the broad account variable (Model 4), which includes mobile money accounts.
The empirical studies examining the relationship between fintech and financial inclusion draw on a range of panel data methodologies.
Olaoye et al. (
2026) combine GMM with random-effects models to assess whether fintech enhances financial inclusion in reducing income inequality in Sub-Saharan Africa.
Miftari et al. (
2024) apply fixed-effects regression to examine digital payment adoption and banking access across Balkan countries, while
Rivera et al. (
2025) employ a balanced panel data model to investigate the role of digital connectivity in promoting financial inclusion in Latin America.
Mbarek (
2025) and
Ashenafi and Dong (
2022) address endogeneity through instrumental variable approaches—the former using a general IV framework and the latter relying on 2SLS—to isolate the causal effect of institutional quality and governance on fintech-driven inclusion.
Azmeh and Al-Raeei (
2024) apply PCSE and FGLS regressions across 108 nations, while
Kanga et al. (
2022) adopt an Error Correction Model to capture long-run effects of fintech diffusion on GDP per capita. More structurally oriented approaches include the SEM used by
Chinoda and Mashamba (
2021) to examine fintech’s role in poverty reduction in Africa, and the quantile regression employed by
Demir et al. (
2020) to explore distributional effects on income inequality.
Among the methods identified in this literature, the random-effects model—as used by
Olaoye et al. (
2026)—offers several advantages in the fintech–financial inclusion context. Unlike fixed-effects estimators, random effects preserve between-country variation, allowing to estimate the influence of slowly changing or time-invariant country characteristics, such as institutional quality or geographic factors, which are theoretically relevant to fintech adoption and financial access. Random-effects models are also statistically more efficient when the panel has many cross-sectional units relative to time periods, a common feature in emerging and developing countries datasets. However, this approach rests on the strong assumption that country-specific unobserved heterogeneity is uncorrelated with the regressors. To overcome that we addressed reverse causality, following
Olaoye et al. (
2026) using GMM, to handle endogeneity.
We initially employed both fixed effects (FE) and random effects (RE) panel regression models with clustered standard errors to address potential heteroskedasticity and serial correlation within the panel structure. All the testing tables are shown in
Appendix A. We then conducted the Hausman test and the results indicate that the random effects (RE) estimator is both consistent and more efficient for our dataset. In continuance we applied GMM, to handle endogeneity. Accordingly, the final estimates are based on a random-effects model with clustered standard errors and GMM robustness check, applied to an unbalanced panel dataset.
The financial inclusion indicators are introduced separately as dependent variables, while fintech serves as the key explanatory variable, alongside relevant control variables to ensure robust and reliable results. The model is as follows:
In this regression model, the determinants of inclusion are used as the dependent variables as defined in
Table 1. Each dependent variable is separately used in a different regression. The variables are expressed as a percentage of the adult population aged 15 and above. The independent variables include both the fintech measure and the control variables, as reported in
Table 2.
4. Empirical Results
This section presents empirical results from five random-effects models (
Table 4) that measure the impact of fintech on financial inclusion. Each model includes a proxy for financial inclusion as the dependent variable, measured as the percentage of adults (15 years and older) who have an account at a formal financial institution, have borrowed from one, or have saved money at one. Model 4 includes a robust specification of formal account ownership by utilizing general account access in mobile money accounts, banks, and other financial institutions (FIs).
The overall R-squared values range from 0.554 for formal savings to 0.913 for general account ownership, indicating that the models capture a substantial proportion of the total variation in financial inclusion indicators. The savings and borrowing models have lower explanatory power (0.554–0.609), suggesting that these behaviors are influenced by additional unobserved factors such as cultural attitudes or personal preferences. The formal account model achieves an overall R-squared of 0.871, further reinforcing fintech’s robust predictive performance.
The highest explanatory power is observed in the account ownership model, with an overall R-squared of 0.913, showing that fintech and related macroeconomic and institutional factors are highly effective in predicting whether individuals hold accounts. It should be noted that the broad account variable used in Model 4 includes mobile money accounts, which overlap with the fintech proxy—the share of adults making or receiving digital payments. This partial construct overlap likely inflates the fintech coefficient (0.841) and R2 (0.913) relative to other models, and Model 4 should therefore be interpreted as an upper-bound estimate of fintech’s association with financial access rather than as a primary causal finding.
The regression results presented in
Table 4 demonstrate that fintech is the most powerful and consistent determinant of financial inclusion across developing countries. The coefficients for fintech are highly significant in all models, with values of 0.616 for formal account ownership, 0.166 for formal savings, 0.155 for formal borrowing, and an even stronger 0.841 for general account ownership. These figures confirm that the use of digital payments directly translates into greater access to financial services, particularly in expanding account ownership, which is the most robust outcome.
The IMF Financial Development Index also shows positive effects, particularly on formal account ownership, with coefficients of 0.316 and 0.759 across different specifications. This suggests that broader financial sector development complements fintech adoption, though its influence is weaker in savings and borrowing.
Macroeconomic variables display mixed relationships: GDP growth negatively affects borrowing (−0.246), implying that rising incomes reduce reliance on credit, while in the robust model it becomes strongly positive (0.578), indicating context-dependent effects. Government expenditure is generally insignificant but turns positive in the robust specification (0.531), highlighting its potential role when directed toward financial infrastructure. Trade openness is significant only for savings (0.052), suggesting that global integration encourages saving behavior.
Demographic and social factors reveal important constraints. Population growth exerts a negative influence on inclusion, with coefficients of −0.831 for accounts and −0.903 for savings, reflecting infrastructure gaps in rapidly expanding populations. Education, measured through secondary enrollment, consistently enhances inclusion, with positive coefficients for account ownership (0.178), borrowing (0.080), and the robust model (0.293). This underscores the importance of digital literacy and education in enabling individuals to benefit from fintech. Institutional quality emerges as another strong driver, with coefficients above 0.9 across models, confirming that governance, trust, and stability are essential for sustaining fintech adoption. Conflict, by contrast, is generally insignificant, though it negatively affects borrowing (−1.111), showing that instability discourages credit access.
Overall, the numerical results highlight fintech as the most significant enabler of financial inclusion, particularly in account ownership. Education and institutional quality reinforce this effect, while population growth and inequality remain major barriers. Macroeconomic factors contribute unevenly, suggesting that fintech’s transformative potential is maximized when paired with supportive governance, infrastructure, and literacy.
To address concerns about potential endogeneity between fintech adoption and financial inclusion, we re-estimate all models using a two-step efficient GMM estimator, instrumenting the fintech variable with its first lag. The GMM results are reported in
Table 5 and cover 116 observations from 71 countries across the 2017 and 2021 survey waves—a reduced sample relative to the RE models, as the lag construction requires at least two consecutive observations with non-missing fintech data per country.
According to the results above, the central finding on fintech is confirmed. The GMM coefficient on fintech remains positive and highly significant for formal account ownership (0.531, p < 0.01) and broad account ownership (0.846, p < 0.01), closely replicating the RE estimates of 0.616 and 0.841 respectively. The slight downward revision in the formal account coefficient—from 0.616 in the RE model to 0.531 in the GMM—is consistent with the expectation that RE estimates carry a modest upward endogeneity bias: countries with higher financial inclusion may attract greater fintech investment, generating reverse causality that inflates the OLS and RE coefficients. The GMM corrects for this, and the result remains both statistically and economically significant, providing strong support for H1.
Fintech loses significance for savings and borrowing under GMM. The fintech coefficients for formal savings (−0.215) and formal borrowing (−0.187) become negative and insignificant in the GMM specification, reversing the small positive and significant effects found in the RE models. This reversal should not be interpreted as evidence that fintech harms savings or borrowing behavior. Rather, it reflects the combination of a smaller and less balanced GMM sample (71 versus 89 countries, with only two time periods) and the correction for reverse causality. In the RE models, countries with deeper formal savings and borrowing markets may independently attract fintech platforms, artificially inflating the positive coefficient. Once this reverse causality is removed through instrumentation, the net effect on savings and borrowing becomes statistically indistinguishable from zero. This finding underscores that fintech’s primary contribution to financial inclusion operates through account access rather than through the deeper financial behaviors of formal saving and borrowing, which are more strongly governed by income levels, financial literacy, and institutional trust—as discussed in
Section 5.
Instrument validity diagnostics support the GMM specification. The AR(1) test confirms significant first-order serial correlation in residuals (p < 0.001 across all models), which is expected and does not invalidate the instruments. More importantly, the AR(2) test—the critical diagnostic for GMM instrument validity—yields p-values of 0.719 (formal account), 0.800 (formal save), and 0.459 (broad account), all well above the conventional 0.05 threshold, confirming the absence of second-order autocorrelation and supporting the validity of lagged fintech as an instrument. The formal borrowing model shows a marginally significant AR(2) statistic (p = 0.047), suggesting some caution in interpreting that specific GMM estimate, consistent with the already-noted instability of the borrowing result across specifications.
Control variables show mixed consistency across RE and GMM. GDP growth becomes significantly positive for formal account ownership (0.383, p < 0.01) and broad account ownership (0.237, p < 0.01) under GMM, a stronger effect than in the RE models, suggesting that the growth-inclusion relationship is partly obscured by reverse causality in the RE specification. Inflation is significantly positive for savings (0.268, p < 0.05) and borrowing (0.288, p < 0.05) under GMM—a finding absent from RE—consistent with precautionary motives: households in high-inflation environments may increase formal saving and borrowing activity to hedge against purchasing power erosion. Population growth shows large and significant negative effects on savings (−7.069, p < 0.01) and borrowing (−3.200, p < 0.01), reinforcing the infrastructure-constraint interpretation from the RE models, though magnitudes are amplified in the GMM. Institutional quality loses significance across all GMM models, likely reflecting the shorter time span (2017–2021 only) in which within-country governance variation is limited. Secondary education reverses sign and becomes significantly negative in several GMM models, a result that is difficult to interpret causally and may reflect compositional changes in the reduced 71-country sample rather than a genuine education-inclusion trade-off.
5. Discussion
The empirical results reveal a structured hierarchy in fintech’s relationship with financial inclusion that carries important theoretical and policy implications. Fintech adoption is most powerfully associated with formal account ownership (coefficient = 0.616, Model 1) and broad account access (0.841, Model 4), while its relationship with formal savings (0.166) and formal borrowing (0.155) is significantly weaker. This reflects a fundamental distinction between entry-level and depth-level financial inclusion. Account ownership requires a single, low-friction threshold decision, whereas saving and borrowing are recurrent behaviors governed by income stability, financial literacy, risk preferences, and institutional trust. Fintech lowers access barriers most effectively at the point of entry, but its capacity to sustain deeper financial engagement depends on factors that digital payment infrastructure alone cannot supply. This dimension-specific pattern is one of the paper’s substantive contributions to the literature: unlike most prior studies that treat financial inclusion as a single composite indicator, this analysis disaggregates inclusion into four distinct proxies and demonstrates that the fintech effect diminishes systematically as the depth of financial behavior increases.
Cevik (
2024) and
Rivera et al. (
2025) corroborate the account-ownership finding, while
Demir et al. (
2020) similarly find fintech effects concentrated in account access rather than savings or borrowing. The contrasting finding from
Ashenafi and Dong (
2022), who report strong fintech-savings links in Africa, may reflect the specific role of mobile money platforms in substitute saving in contexts with very limited formal alternatives—a dynamic less prevalent in the broader 89-country sample used here.
A second original contribution of this study is the explicit decomposition of fintech’s explanatory power relative to conventional macroeconomic determinants. When fintech is excluded from the formal account model, the overall R
2 collapses from 0.871 to 0.248—a reduction of more than 60 percentage points. This magnitude far exceeds what would be expected if fintech were simply a proxy for economic development or financial system sophistication. It demonstrates that digital payment adoption captures a distinct behavioral and infrastructural channel—one that GDP growth, trade openness, government expenditure, and even the IMF Financial Development Index collectively cannot replicate. This finding adds precision to the broader argument in
Aduba et al. (
2022) and
Irfan et al. (
2024) that fintech functions as a structural shifter of financial access rather than a mere outcome of development: it is not that richer or more financially developed countries happen to have more fintech, but that fintech itself reorganizes the relationship between macroeconomic conditions and financial participation (
Aduba et al., 2022;
Irfan et al., 2024;
Miftari et al., 2024).
The role of the IMF Financial Development Index further clarifies the relationship between fintech and traditional financial infrastructure. The index is significant only for account ownership (Models 1 and 5), not for savings or borrowing, suggesting that conventional financial deepening—measured through the breadth and depth of banks, capital markets, and credit institutions—complements fintech at the point of entry into the financial system but has no independent effect on the deeper financial behaviors that matter most for poverty reduction. This is a nuanced result: it implies that fintech and traditional finance are not substitutes competing for the same users, but complementary mechanisms that jointly determine account access while diverging in their influence on savings and borrowing outcomes. The practical implication is that policies promoting fintech adoption in countries with underdeveloped formal financial systems may still yield inclusion gains at the account level, but deeper inclusion requires parallel investments in financial infrastructure, consumer protection regulation, and credit market development that fintech alone cannot deliver.
The contrasting GDP growth effects across models are among the most theoretically interesting findings. In Model 5 (without fintech), GDP growth is a strong positive predictor of formal account ownership (+0.578), yet this coefficient becomes small and insignificant in Model 1 (with fintech). This pattern suggests that fintech partially mediates or absorbs the growth-inclusion relationship: in countries where digital payment adoption is higher, economic growth translates into financial inclusion primarily through fintech adoption rather than through independent channels such as rising incomes or expanding branch networks. In Model 3, a one percentage-point increase in GDP growth reduces formal borrowing by 0.246 percentage points, which is consistent with lifecycle theory: as household incomes rise, the urgency of external credit falls, and individuals rely more on self-financing. This finding is not a paradox but a meaningful signal that credit demand is countercyclical in low-income settings.
The behavior of government expenditure across models illustrates a pattern of fintech displacement that is theoretically important. In Model 5—the specification without fintech—government expenditure is marginally significant and positive, suggesting that public spending supports formal account penetration when digital financial channels are absent or weak. Once fintech is included (Models 1–4), the expenditure effect collapses to insignificance. This is consistent with a mediation or substitution hypothesis: in countries where digital payment infrastructure is well-developed, the inclusion-promoting functions of public spending—such as disbursing social transfers or paying government employees—are increasingly channeled through fintech platforms rather than traditional bank branches, making the independent contribution of aggregate government spending difficult to detect. This finding resonates with evidence from
Iqbal et al. (
2021) on the contingent role of public sector quality in financial development.
Trade openness and population growth present contrasting cross-model profiles that reveal the heterogeneous structural conditions shaping inclusion. Trade openness is significant only for formal savings (Model 2, coefficient = 0.052), and insignificant for account ownership, borrowing, or broad access. This narrow significance is theoretically interpretable: global economic integration raises household exposure to foreign income flows, exchange rate uncertainty, and cross-border remittances, all of which provide precautionary motives for formal saving. By contrast, trade openness does not materially alter account ownership or credit access, which are more strongly governed by domestic institutional conditions. Population growth is negatively associated with account ownership and savings (coefficients of −0.831 and −0.903, respectively) but statistically insignificant for borrowing. The asymmetry across outcomes is meaningful: rapidly growing populations place acute pressure on physical financial infrastructure—bank branches, agent networks, digital connectivity—which suppresses account formation and saving capacity, but formal credit markets may remain accessible to higher-income or urban segments within fast-growing populations, muting the population effect on borrowing. These results align with
Ashenafi and Dong (
2022) and
Cicchiello et al. (
2021) on the infrastructure-constraint mechanism, though they differ from
Demir et al. (
2020), who find weaker demographic effects, likely reflecting differences in sample composition and the time horizons covered.
In contrast, secondary school enrolment is a consistent driver of inclusion. A higher rate of secondary education is associated with higher formal account ownership (Models 1 and 4) and positively influences borrowing (Model 3). The insignificance of education for savings (Model 2) deserves specific attention: it suggests that the decision to save formally is tied more closely to disposable income than to educational attainment per se. This is consistent with the precautionary savings motive—individuals save only when they have sufficient surplus income, and secondary schooling alone does not guarantee that. The education-borrowing link (Model 3), by contrast, likely reflects better credit awareness and reduced information asymmetry among more educated borrowers. These nuances indicate that policy interventions combining education with income support are needed to yield gains across all dimensions of inclusion, not just account ownership.
Cevik (
2024) provides corroborating evidence that education and institutional quality jointly determine inclusion outcomes, a pattern fully supported here.
The institutional quality index is significant or marginally significant across Models 1–4, confirming that governance quality—encompassing rule of law, control of corruption, and government effectiveness—creates the enabling environment for both fintech adoption and formal financial participation. Its insignificance in Model 5—the robust account ownership specification without fintech—is notable and warrants interpretation: when fintech is absent, governance quality ceases to predict account ownership at conventional significance levels, suggesting that institutions matter primarily as an enabler of digital financial adoption rather than as a direct driver of formal account penetration. This finding extends
Demir et al.’s (
2020) argument on institutional quality and inclusion by identifying fintech adoption as the channel through which governance quality translates into measurable inclusion gains.
Taken together, the discussion reveals a picture of financial inclusion that is more structurally layered than most existing studies acknowledge. The paper’s central contribution is not simply confirming that fintech promotes financial inclusion—this is well-established—but demonstrating that this relationship is dimension-specific, mediator-dependent, and conditioned on an interlocking set of institutional, human capital, and macroeconomic factors that interact differently depending on which aspect of inclusion is being measured. Unlike single-outcome studies that report a uniform fintech effect, this analysis shows that the same fintech variable produces coefficients ranging from 0.155 (borrowing) to 0.841 (broad account access) across otherwise identical model specifications, a range that reflects genuine behavioral and institutional heterogeneity rather than model instability. The identification of institutional quality as a channel—rather than a mere control—through which fintech translates into inclusion gains, and the mediation of the GDP growth effect by fintech adoption, constitute further novel contributions to a literature that has largely treated these variables as additive rather than interactive. The evidence supports H1 and H2 not as parallel hypotheses but as components of an integrated framework: fintech is the primary inclusion mechanism, but its effectiveness is bounded by structural conditions that vary systematically across developing economies.
6. Conclusions
This paper investigated the role of financial technologies in advancing financial inclusion across 89 developing countries over four Global Findex survey waves (2011–2021). Three original contributions distinguish this study from existing work. First, it employs one of the broadest developing-country panels in the fintech-inclusion literature, covering four distinct inclusion outcomes—formal account ownership, formal savings, formal borrowing, and broad account access—simultaneously within a unified framework, enabling direct comparison of fintech’s effects across dimensions rather than treating inclusion as a single composite. Second, it introduces a PCA-based composite institutional quality index derived from six World Bank governance indicators, providing a more comprehensive and internally validated measure of governance than the single-indicator proxies used in most prior studies. Third, it explicitly tests the mediation hypothesis: that fintech, rather than operating additively alongside macroeconomic conditions, partially absorbs and reorganizes the relationship between GDP growth, government spending, and formal financial participation—a finding not previously documented in the panel literature on developing economies.
The core empirical finding—that fintech is the single most powerful predictor of formal account ownership, with a coefficient nearly three times larger than that of the IMF Financial Development Index—establishes digital payment adoption as a qualitatively distinct inclusion mechanism, not a proxy for broader economic development. The dimension-specific nature of this effect, however, is equally important: fintech’s relationship with formal savings and borrowing is substantially weaker and less robust, indicating that entry into the financial system through digital payments does not automatically translate into the deeper financial behaviors—saving, investing, borrowing—that generate long-term welfare gains. This distinction has direct policy relevance: strategies that promote fintech adoption as an end in itself risk overstating the inclusion dividend unless accompanied by parallel investments in financial literacy, income support, and institutional quality that enable households to move beyond account ownership into active financial participation. Education and institutional quality consistently moderate fintech’s effects, confirming H2 and suggesting that the returns to fintech investment are highest in countries that have already made foundational investments in human capital and governance. Population growth and, in some specifications, income inequality act as binding constraints that fintech alone cannot overcome, pointing to the limits of technology-driven inclusion strategies in contexts of rapid demographic expansion and persistent structural inequality.
From a broader perspective, this study situates fintech within a two-level framework of financial inclusion that distinguishes between access and depth and between direct effects and conditional effects. This framework generates more precise and actionable policy implications than approaches that treat fintech as a uniformly beneficial force. Policymakers in developing economies should prioritize regulatory environments that enable digital payment infrastructure to reach underserved populations—the entry-level gains are large and robust—while simultaneously investing in the complementary conditions—governance quality, secondary education, and macroeconomic stability—that determine whether initial account access converts into sustained financial participation. Future research should examine the dynamic trajectory of fintech adoption using higher-frequency data and exploit natural experiments—such as mobile money platform launches or regulatory reforms—to sharpen causal identification. Extending the analysis to firm-level or household-level microdata would allow direct testing of the behavioral mechanisms—financial literacy, digital trust, income effects—that this country-level study can identify but not fully decompose. The accelerating pace of fintech innovation, including AI-driven credit scoring and embedded finance, makes the empirical regularities documented here likely to evolve, underscoring the need for continuous monitoring of the inclusion dividend from digital financial transformation in the developing world.