1. Introduction
Artificial intelligence (AI) has become an increasingly prominent feature of corporate disclosure. In recent years, large publicly listed firms have expanded references to AI in their Form 10-K filings, describing it not only as a strategic investment but also as an embedded capability in operations, analytics, compliance systems, and decision support. As digital transformation accelerates, AI is frequently portrayed as a driver of efficiency, innovation, and competitive advantage. Yet growing AI disclosure intensity in mandatory filings also has governance implications. Disclosure shapes stakeholder attention. What firms emphasize in their annual reports influences how boards, investors, auditors, and regulators interpret organizational risks, assess internal controls, and evaluate accountability structures.
Because disclosures regarding internal control weaknesses, restatements, non-reliance statements, and regulatory investigations can affect firm valuation, litigation exposure, and financing conditions, governance-risk disclosure is not merely a compliance issue but also a corporate finance concern. Financial markets rely on 10-K filings as authoritative signals of risk exposure and control quality. As firms integrate AI into core processes, understanding whether AI disclosure intensity is associated with governance-risk disclosures becomes central to evaluating the transparency and development of digital governance arrangements.
The governance implications of AI remain theoretically unsettled. One perspective suggests that AI strengthens monitoring by enabling automation, anomaly detection, real-time reporting, and enhanced data analytics. From this view, AI should reinforce internal controls, reduce information asymmetry, and improve oversight quality. If AI systems enhance traceability and auditability, greater AI disclosure intensity may signal improved governance capacity and reduced reporting risk.
A competing perspective emphasizes that AI introduces organizational complexity and can diffuse responsibility across human–machine interfaces. Algorithmic decision systems may obscure causal chains, complicate oversight for non-expert monitors, and create ambiguity regarding accountability when errors occur. In transitional phases of digital transformation, organizations may face implementation frictions, integration risks, and control weaknesses as new systems interact with legacy processes. Under this view, increased AI disclosure intensity may coincide with heightened governance-risk exposure, particularly when AI adoption outpaces institutional adaptation.
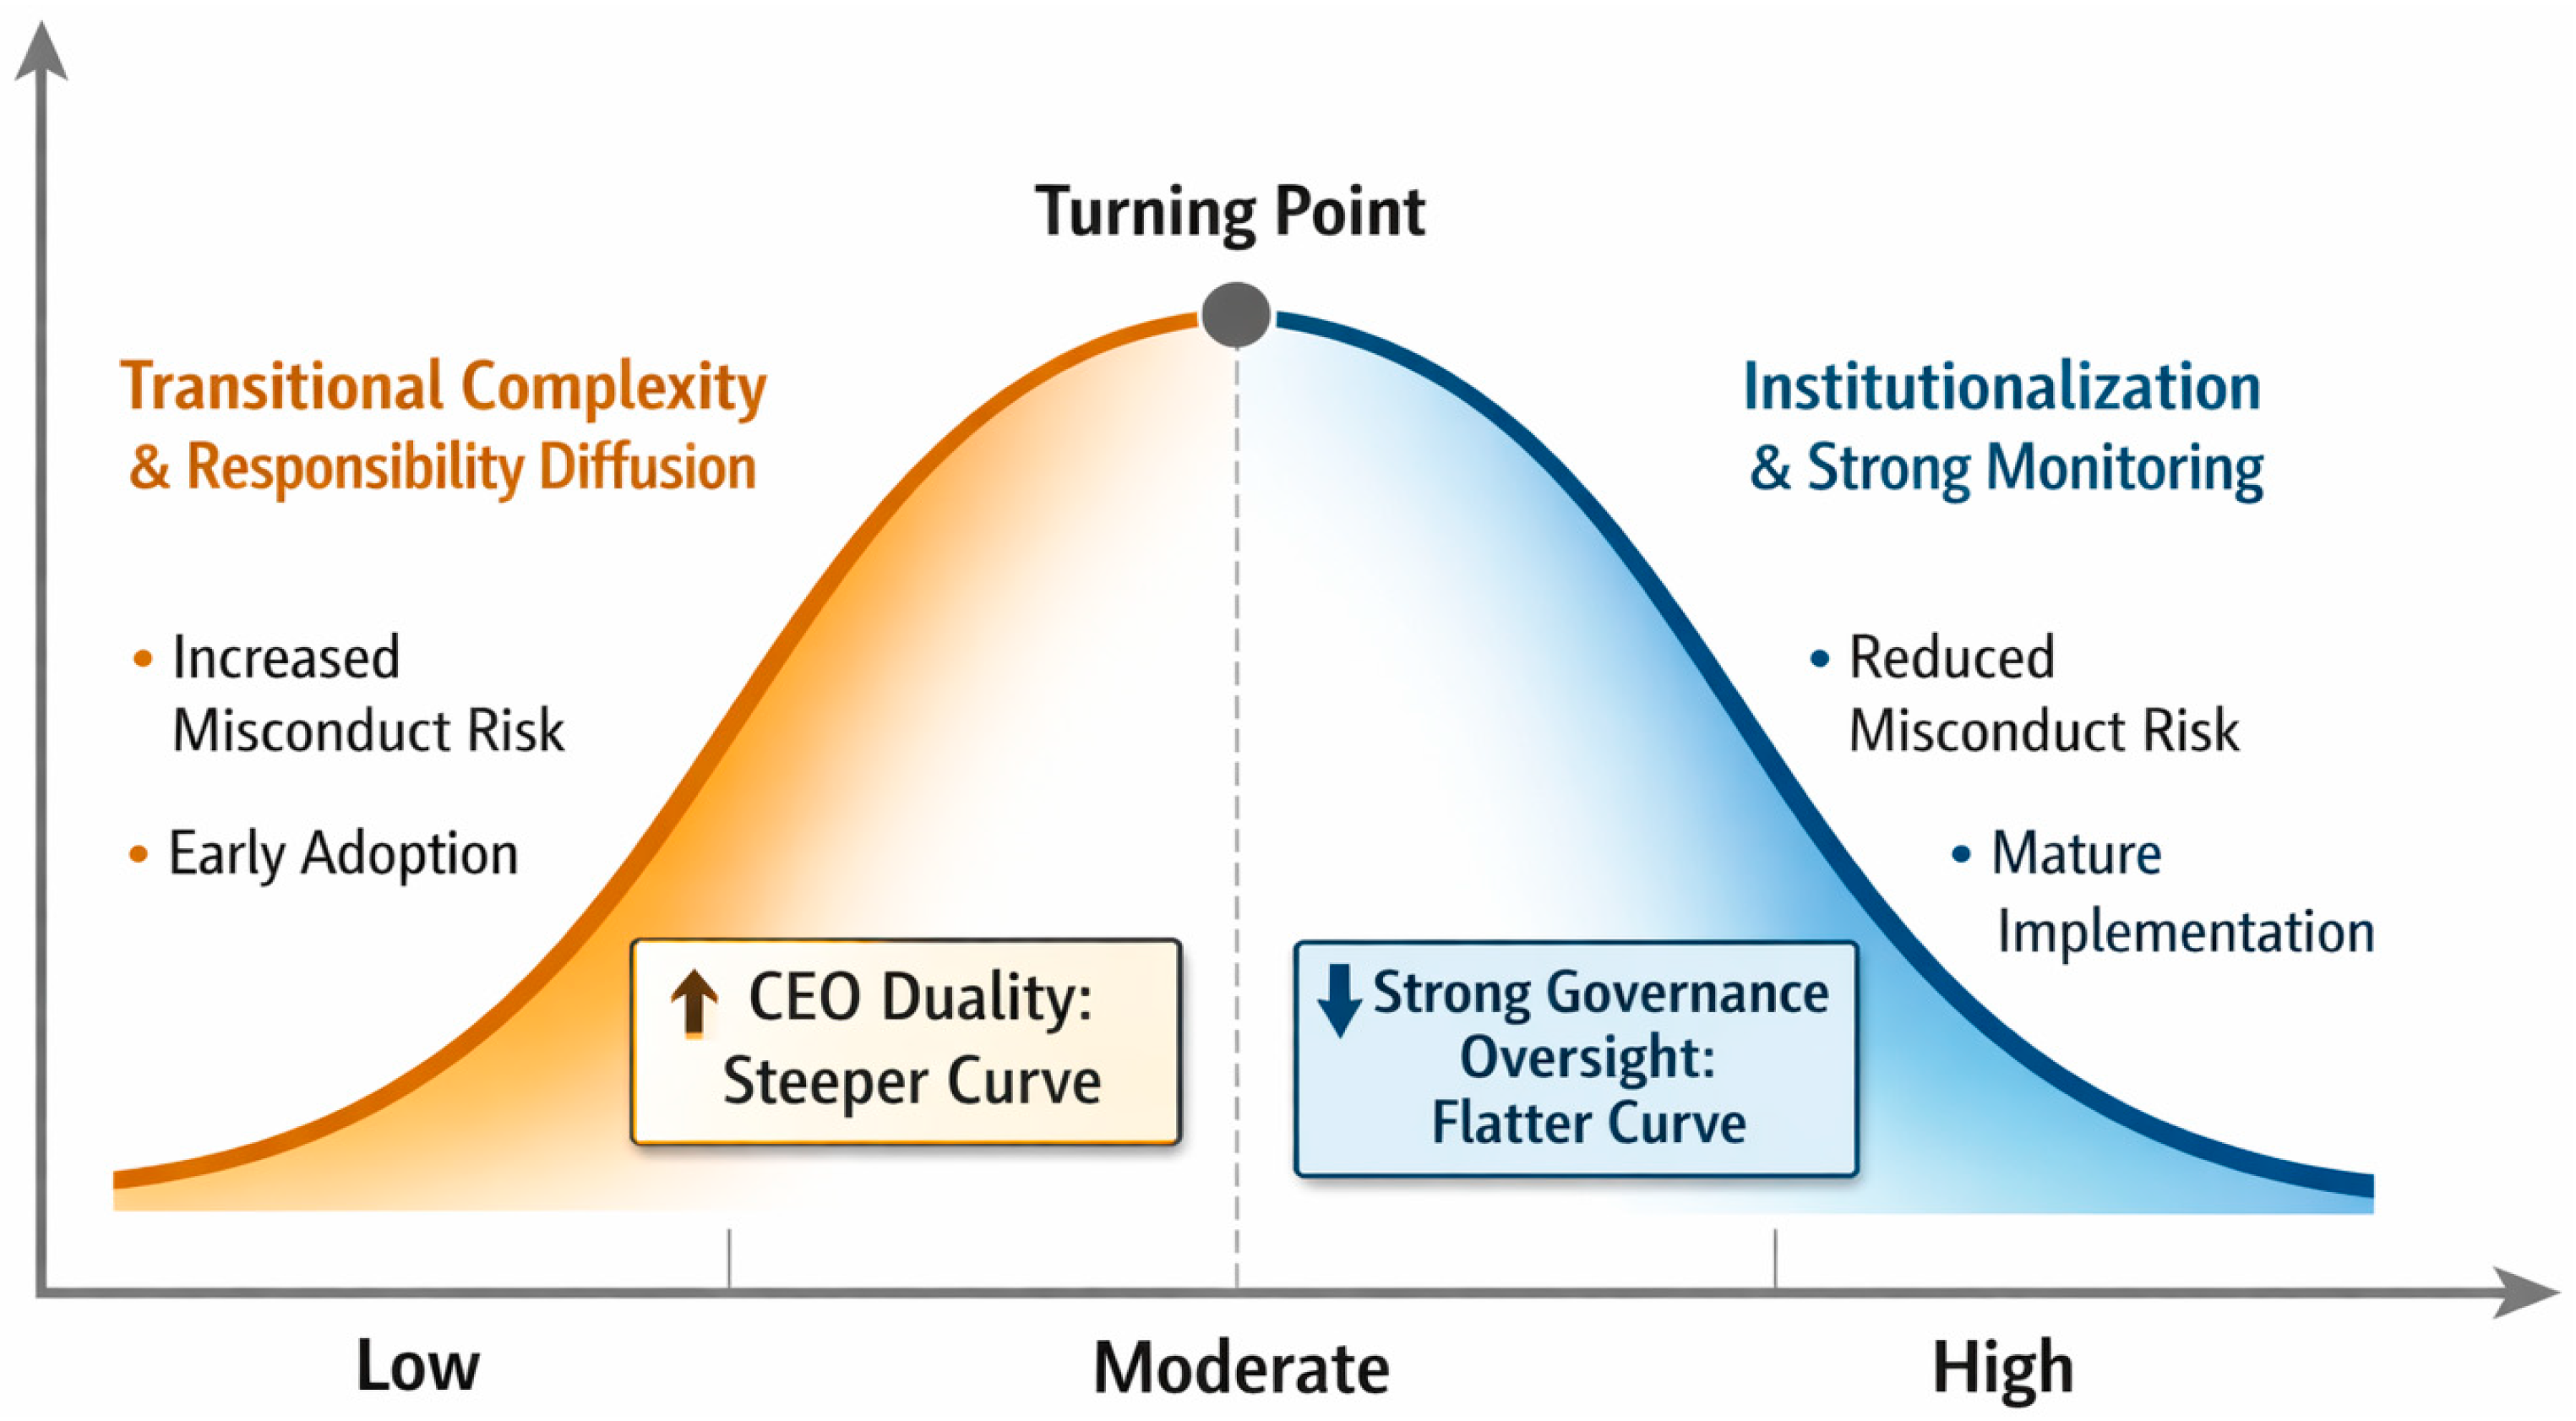
These contrasting mechanisms suggest that the relationship between AI disclosure and governance-risk disclosure is unlikely to be uniformly linear. As AI disclosure intensity increases in corporate reporting, firms may move through stages of experimentation, integration, and institutionalization. During early or intermediate phases, governance risks may intensify as organizations adjust internal control frameworks and compliance structures to new technological environments. At later stages of AI disclosure intensity, governance-risk disclosures may stabilize or decline if AI-related processes become more fully embedded within oversight routines and monitoring capabilities improve.
Despite growing scholarly attention to AI and corporate governance, empirical evidence on how AI disclosure intensity relates to governance-risk disclosures remains limited. Existing studies often examine AI adoption, innovation outcomes, or performance effects, but fewer investigate how AI references in mandatory financial reporting correlate with disclosure-based indicators of control weaknesses and regulatory scrutiny. Moreover, much of the prior discussion implicitly assumes either uniformly beneficial or uniformly adverse effects, overlooking the possibility that governance consequences vary across levels of AI disclosure intensity.
This study addresses this gap by examining whether AI disclosure intensity in Form 10-K filings is associated with governance-risk disclosures in a stage-dependent manner. By focusing on disclosure intensity rather than self-reported adoption levels, the analysis captures how prominently firms integrate AI into their public governance narratives. In doing so, it contributes to the literature on digital transformation, corporate transparency, and financial reporting by clarifying how AI disclosure functions as a signal of evolving governance structures within large U.S. public firms.
2. Literature Review and Hypotheses Development
2.1. Governance Failures and Disclosure-Based Risk Signals
Research on governance failures provides the starting point for this study because reporting problems tend to emerge when monitoring and accountability no longer constrain managerial discretion effectively (
Jensen & Meckling, 1976;
Fama & Jensen, 1983;
Shleifer & Vishny, 1997). In financial reporting settings, these failures commonly appear through material weaknesses in internal control, restatements, non-reliance statements, and regulatory investigations. Such disclosures are economically important because they are associated with enforcement exposure, litigation risk, valuation penalties, and broader reputational costs that affect firm behavior and market perception (
Amiram et al., 2018;
Wang et al., 2019;
Velte, 2023;
Freeman, 1984;
Amis et al., 2020).
Behavioral research helps explain why these failures can arise even when formal governance structures exist. The fraud triangle identifies pressure, opportunity, and rationalization as the core conditions that make wrongdoing more likely, and later work shows that these mechanisms remain central in complex organizational settings where monitoring is difficult and responsibility can become blurred (
Cressey, 1953;
Wolfe & Dana, 2004;
Dorminey et al., 2012;
Trompeter et al., 2013;
Schnatterly et al., 2018). This perspective is especially relevant in AI-related organizational change, where new systems can complicate supervision and create temporary gaps between operational innovation and control adaptation.
Accounting and governance research also supports the use of governance-risk disclosures in 10-K filings as meaningful indicators of reporting risk. Material weakness disclosures predict future misstatements and related irregularities, while stronger audit committees, higher-quality internal audit functions, and relevant information technology expertise improve reporting quality and reduce the persistence of control problems (
Dechow et al., 2011;
Ghafran & O’Sullivan, 2013;
DeFond & Zhang, 2014;
Ege, 2015;
Ashraf et al., 2020). Research on corporate misconduct reaches a similar conclusion by showing that oversight quality shapes whether reporting problems are contained or allowed to persist (
Shi et al., 2017;
Neville et al., 2019;
Braun & Mueller, 2025). For this reason, governance-risk disclosures in 10-K filings provide a meaningful disclosure-based indicator of internal-control and reporting-risk conditions.
2.2. Executive Power and Monitoring Constraints
Executive power matters because governance systems are less effective when decision authority is concentrated and independent challenge is weakened. In financial reporting contexts, concentrated CEO power has been linked to weaker internal controls and less effective audit committee monitoring in substance (
Lisic et al., 2016). CEO duality is especially relevant because it combines managerial and board leadership roles in ways that can shape how risks are framed, communicated, and overseen (
Daily & Johnson, 1997;
Ozgen et al., 2025). In this study, CEO duality therefore serves as a parsimonious structural indicator of executive power and is used to assess whether the nonlinear relationship between AI disclosure intensity and governance-risk disclosure becomes steeper when oversight is more concentrated.
2.3. Disclosure, AI Disclosure Intensity, and Organizational Accountability
Disclosure research provides further insight because narrative framing influences how external monitors interpret firm behavior. Text-based approaches show that language in annual reports reveals misreporting risk and managerial intent (
Hobson et al., 2012). At the same time, disclosure language can be strategically managed, raising questions about the reliability of narrative cues (
Cho et al., 2024).
AI-related disclosures are particularly relevant because firms can frame technological initiatives as innovation signals, efficiency tools, or transformative capabilities. Research distinguishes between substantive and rhetorical AI signals, suggesting that market and governance responses depend on credibility and embeddedness (
Nishant et al., 2024).
Recent evidence also shows that AI-related narratives in annual reports can serve legitimacy and impression-management functions, indicating that disclosure may reflect both substantive adoption and strategic communication (
Elsayed, 2025). In addition, evidence from the U.S. banking sector suggests that AI disclosure is increasingly tied to transparency, accountability, and financial-reporting outcomes, with governance conditions shaping how such disclosures are interpreted (
Alzeghoul & Alsharari, 2025). As AI becomes more prominent in mandatory filings, AI disclosure intensity may function as a governance-relevant signal rather than merely a technical description (
Li, 2026).
However, existing research rarely examines whether the governance implications of AI disclosure vary across levels of AI disclosure intensity. Most studies focus on performance or innovation outcomes, implicitly assuming linear effects. There remains limited empirical evidence on how AI disclosure intensity in 10-K filings relates to governance-risk disclosures that signal internal control weaknesses and regulatory exposure. This gap is critical because digital transformation may alter both monitoring capacity and accountability dynamics.
2.4. AI Adoption, Dual Attributes, and Nonlinear Governance Risk
AI adoption has expanded rapidly across industries and is embedded in forecasting, compliance monitoring, and operational processes (
Anthony et al., 2023;
Babina et al., 2024). Advanced AI systems increasingly participate in decisions and are perceived as agentic actors within firms (
Humberd & Latham, 2025;
Vanneste & Puranam, 2025). This development intensifies debates about responsibility allocation when outcomes are shaped by opaque models and distributed human–machine interactions (
Henderson, 2025;
Llorca Albareda, 2025). Governance guidance now emphasizes auditability, oversight routines, and accountability mapping for agentic AI systems (
Shavit et al., 2023).
Related recent governance research on generative AI also underscores persistent concerns around opacity, control challenges, data governance, and implementation risk, reinforcing the importance of oversight structures when AI becomes embedded in organizational decision processes (
Taeihagh, 2025;
Chesterman, 2025;
Khanal et al., 2025).
The AI ethics literature offers competing predictions for governance risk. A tool-based perspective argues that AI strengthens monitoring through improved detection, consistency, and traceability, suppressing opportunity for wrongdoing (
Khalid et al., 2025;
Shavit et al., 2023). Experimental evidence suggests algorithmic collaboration can reduce unethical choices in some contexts (
Gaczek et al., 2026).
In contrast, an agency-oriented view highlights opacity and blame shifting. Individuals may attribute responsibility to AI systems and diffuse accountability, expanding the space for rationalization (
Joo, 2024;
Llorca Albareda, 2025). Governance outcomes depend on which attribute dominates at a given stage of AI disclosure intensity (
Henderson, 2025;
Vanneste & Puranam, 2025).
Consistent with this possibility, recent evidence suggests that AI adoption can improve annual-report disclosure quality by enhancing information processing and internal control over disclosure activities (
Zeng & Wang, 2025;
Li, 2026).
Accordingly:
H1. AI disclosure intensity is related to governance-risk disclosures in an inverted U-shaped manner, such that governance-risk disclosures increase at lower levels of AI disclosure intensity and decrease at higher levels.
H2. CEO duality strengthens the inverted U-shaped relationship between AI disclosure intensity and governance-risk disclosures, resulting in steeper curvature.
H3. Strong governance oversight attenuates the inverted U-shaped relationship between AI disclosure intensity and governance-risk disclosures, flattening the curvature and shifting the turning point rightward.
Figure 1 summarizes the theoretical framework and the hypothesized nonlinear dynamics.
These hypotheses advance a stage-contingent view of AI disclosure, proposing that governance-risk outcomes depend not only on the level of AI disclosure intensity but also on the strength of internal power and oversight structures.
3. Materials and Methods
3.1. Sample and Data
The empirical setting is a balanced panel of large, non-financial U.S. listed firms operating in technology- and data-intensive environments. The sample was constructed using a purposive, availability-based design anchored on the NASDAQ-100 as a reference universe of large firms where AI adoption and digital disclosure are economically salient. Accordingly, the study examines a selected sample of U.S. public firms, with the NASDAQ-100 used only as a reference universe rather than as the sample itself. Firms were retained if they met three inclusion criteria: (i) U.S. listed and non-financial; (ii) availability of a complete and consistent sequence of annual reports/Form 10-K filings for 2020–2024 via the firm’s investor relations website; and (iii) sufficient narrative content in the filing to support dictionary-based text measures.
To preserve cross-sector heterogeneity while maintaining comparability in size and disclosure practices, the final panel includes mostly information technology firms, alongside selected firms from health care/biotech, communication services, consumer discretionary, consumer staples, and industrials that satisfy the same inclusion criteria. Financial firms are excluded because their disclosures are shaped by sector-specific regulation and risk-reporting templates that are not directly comparable to non-financial 10-K narrative language used in this study.
An initial pool of approximately 60 large non-financial U.S. firms (anchored on the NASDAQ-100 reference universe) was screened; firms were retained only if a complete and consistently searchable sequence of five annual 10-K filings (2020–2024) was available from investor relations archives, yielding a final balanced panel of 53 firms. A small number of candidates were excluded due to missing years, inconsistent filing availability, or non-searchable document formats that prevented reliable text counts.
The final dataset contains 53 firms observed annually from 2020 to 2024, yielding 265 firm-year observations. The 2020–2024 window is selected because explicit AI language in 10-K narratives is minimal prior to 2019 for most large firms, limiting meaningful variation in AI disclosure intensity in earlier years. Restricting the window improves measurement relevance and avoids dilution from structurally zero AI disclosure. Because the identification relies on within-firm variation in a fixed-effects design, the primary objective is internal validity over time rather than population representativeness.
The dataset integrates three sources of information. First, annual Form 10-K filings provide the textual corpus used to construct measures of AI disclosure intensity and governance-risk intensity. Second, the same filings supply firm-level financial statement data used to compute control variables. Third, governance attributes, including CEO duality and external auditor identity, are collected from publicly disclosed firm-year governance information.
CEO duality was verified from the board leadership disclosure reported in the firm’s proxy statement or annual governance materials for the corresponding fiscal year. External auditor identity was verified from the signed independent auditor report included in the corresponding Form 10-K. These governance attributes were cross-checked at the firm-year level to maintain consistency with the filing year used for the text-based measures.
For each firm, the author manually accessed the company’s investor relations website and downloaded the annual report/Form 10-K for each fiscal year from 2020 to 2024 (five filings per firm). All filings were processed in PDF format in Adobe Acrobat; the Acrobat AI Assistant was used only to execute pre-specified keyword searches (based on the fixed dictionaries) and to record raw hit counts, not to interpret, summarize, or generate text. Counts were computed on the main 10-K document (e.g., risk factors, MD&A, and the audited financial statements) and excluded exhibits/appendices and non-text elements without searchable text. The same filings were used to extract annual financial statement items for the control variables, ensuring consistent fiscal-year alignment across text measures and accounting data.
Before counting, each filing was checked for searchable text and processed using consistent search rules across firm–years. Searches were limited to the main 10-K document and excluded exhibits, appendices, and non-text elements. Matching was case-insensitive, hyphen and space variants were normalized, and the token “AI” was counted only when appearing as a standalone term. These procedures were designed to improve comparability across filings and reduce spurious matches.
Focusing on large, technology-intensive firms enhances within-firm variation in AI disclosure intensity and governance structures, while the fixed-effects design exploits temporal shifts rather than cross-sectional differences, mitigating concerns related to cross-firm heterogeneity. The integrated firm–year panel combining AI disclosure proxies, governance characteristics, and governance-risk indicators is publicly archived to ensure replicability and transparency (
Bonelli, 2026b).
3.2. Measures and Text Extraction
AI disclosure intensity is measured as the intensity of AI-related language in each firm’s annual Form 10-K filing, using case-insensitive phrase matching combined with prefix (stem) matching for selected terms; “AI” is matched as a standalone token and hyphen/space variants are normalized, while governance-risk terms are identified using case-insensitive exact phrase matching, including plural and hyphenated forms. The dictionary includes explicit AI terminology and capability-oriented terms commonly used to describe algorithmic systems in corporate narratives. The primary independent variable is the raw count of AI-related mentions in firm-year t, denoted AIit. To capture potential nonlinearity, the squared term AIit2 is included in the empirical models.
To strengthen construct validity, the baseline AI dictionary combines explicit AI terminology with capability-oriented terms that frequently appear in corporate descriptions of AI-enabled systems. Because some broader terms may also capture adjacent digitalization rhetoric, the baseline measure is best interpreted as an AI-related disclosure proxy rather than as a pure measure of AI deployment itself. To assess whether the filings also contain clearly AI-specific disclosure, the study supplements the baseline measure with a targeted manual validation exercise and a narrower AI-only count exercise based on explicit AI terminology.
The dictionaries were constructed ex ante in an iterative but rule-based manner. Candidate AI terms were assembled from recurrent terminology in corporate AI discourse and prior disclosure research, then screened to retain terms likely to capture AI-related capabilities in 10-K narratives. To reduce false positives, ambiguous expressions were either excluded or constrained through matching rules: “AI” was counted only as a standalone token, prefix matching was limited to selected stems, and hyphen/space variants were normalized. The governance-risk dictionary was constructed more conservatively from disclosure markers with relatively stable institutional meaning in SEC reporting, such as material weakness, restatement, non-reliance, and investigation-related language. Once finalized, both dictionaries were fixed before full-sample counting and then applied uniformly across all firm–year observations.
As a supplementary construct-validity exercise, a stratified subsample of 15 filings from 2024 spanning low-, medium-, and high-intensity observations was manually reviewed. Using the main narrative text of each filing, three non-duplicate passages linked to explicit AI-related terminology were reviewed in context, yielding 45 reviewed passages in total. The reviewed passages consistently referred to actual AI-related products, services, operations, or capabilities rather than to generic digitalization rhetoric. In parallel, a narrow AI-only count exercise based on explicit AI terminology produced a clear gradient across the 2024 validation groups, with average counts of 3.2 for the low group, 7.2 for the medium group, and 26.2 for the high group. Accordingly, the baseline measure is best interpreted as an AI-related disclosure proxy, while the targeted validation confirms that sampled firms do use clearly AI-specific language in their 10-K narratives.
Governance-risk disclosure is operationalized as the intensity of disclosed control and compliance concerns in the 10-K. This measure captures high-salience disclosures associated with internal control breakdowns and heightened regulatory exposure, including references to material weaknesses, internal control deficiencies, restatements, non-reliance statements, and investigation-related language. The total count of such phrases in each filing is denoted Gov_Riskit.
The dependent variable is defined as:
The logarithmic transformation reduces skewness while preserving zero values. CEO duality is coded as an indicator equal to one if the CEO also serves as board chair in the fiscal year, and zero otherwise. External audit oversight is captured using a Big 4 indicator coded as one if the external auditor is Deloitte, PwC, EY, or KPMG, and zero otherwise. In large-firm samples, Big 4 coverage is typically high; accordingly, audit quality is treated as a baseline governance control and used cautiously in interaction tests.
Control variables follow established governance and reporting-risk research practice, while firm size is measured as the natural logarithm of total assets. Profitability is measured as return on assets (net income divided by total assets). Leverage is computed as total debt divided by total assets. Sales growth is measured as the annual percentage change in total revenue. All accounting variables are aligned to the fiscal year of the 10-K filing.
Text-based measures and financial items are generated through a constrained extraction procedure in which an AI tool functions strictly as a deterministic parser. The tool performs exact string matching and returns counts for pre-specified terms and phrases. It does not infer meaning, classify content, summarize narratives, or generate new text. Given identical filing text and dictionary rules, the procedure produces identical outputs. The dictionaries are fixed ex ante and applied uniformly across all firm-years.
Detailed definitions of all variables are presented in
Table 1.
Table 1 summarizes the operationalization of all variables used in the empirical analysis. The specific dictionaries and matching rules used to construct the text-based measures are detailed in
Table 2.
The broader baseline dictionary is designed to capture AI-related disclosure as it appears in practice, including capability-oriented language that may overlap with adjacent digitalization rhetoric. Illustrative examples from the targeted validation exercise are reported in
Appendix A Table A1.
These procedures ensure that key constructs are measured consistently, transparently, and in a manner suitable for panel-based inference.
3.3. Empirical Strategy and Inference
The core tests estimate a quadratic fixed-effects panel model with firm and year fixed effects:
Firm fixed effects δi absorb time-invariant characteristics such as baseline compliance culture, industry positioning, or disclosure style. Year fixed effects θt absorb common macro-level trends, including shifts in disclosure norms and regulatory attention. Standard errors are clustered at the firm level.
Because the theory predicts an inverted U-shaped relationship, nonlinearity is evaluated using three criteria. First, the coefficient on the squared term (β2) must be negative. Second, the implied turning point −β1/(2β2) must lie within the observed range of AI disclosure intensity. Third, the marginal effect of AI disclosure should be positive at lower levels of AIit and negative at higher levels, evaluated at meaningful points in the empirical distribution.
To examine moderation by CEO duality, the baseline model is extended to allow both the slope and curvature to vary with executive power:
The key parameter for moderated curvature is β5. Interpretation is supported by plotting predicted values over the observed AI range separately for duality and non-duality firms and by computing conditional turning points. When alternative governance oversight proxies are used as moderators, the same moderated quadratic structure is estimated to assess whether oversight attenuates curvature and shifts the turning point.
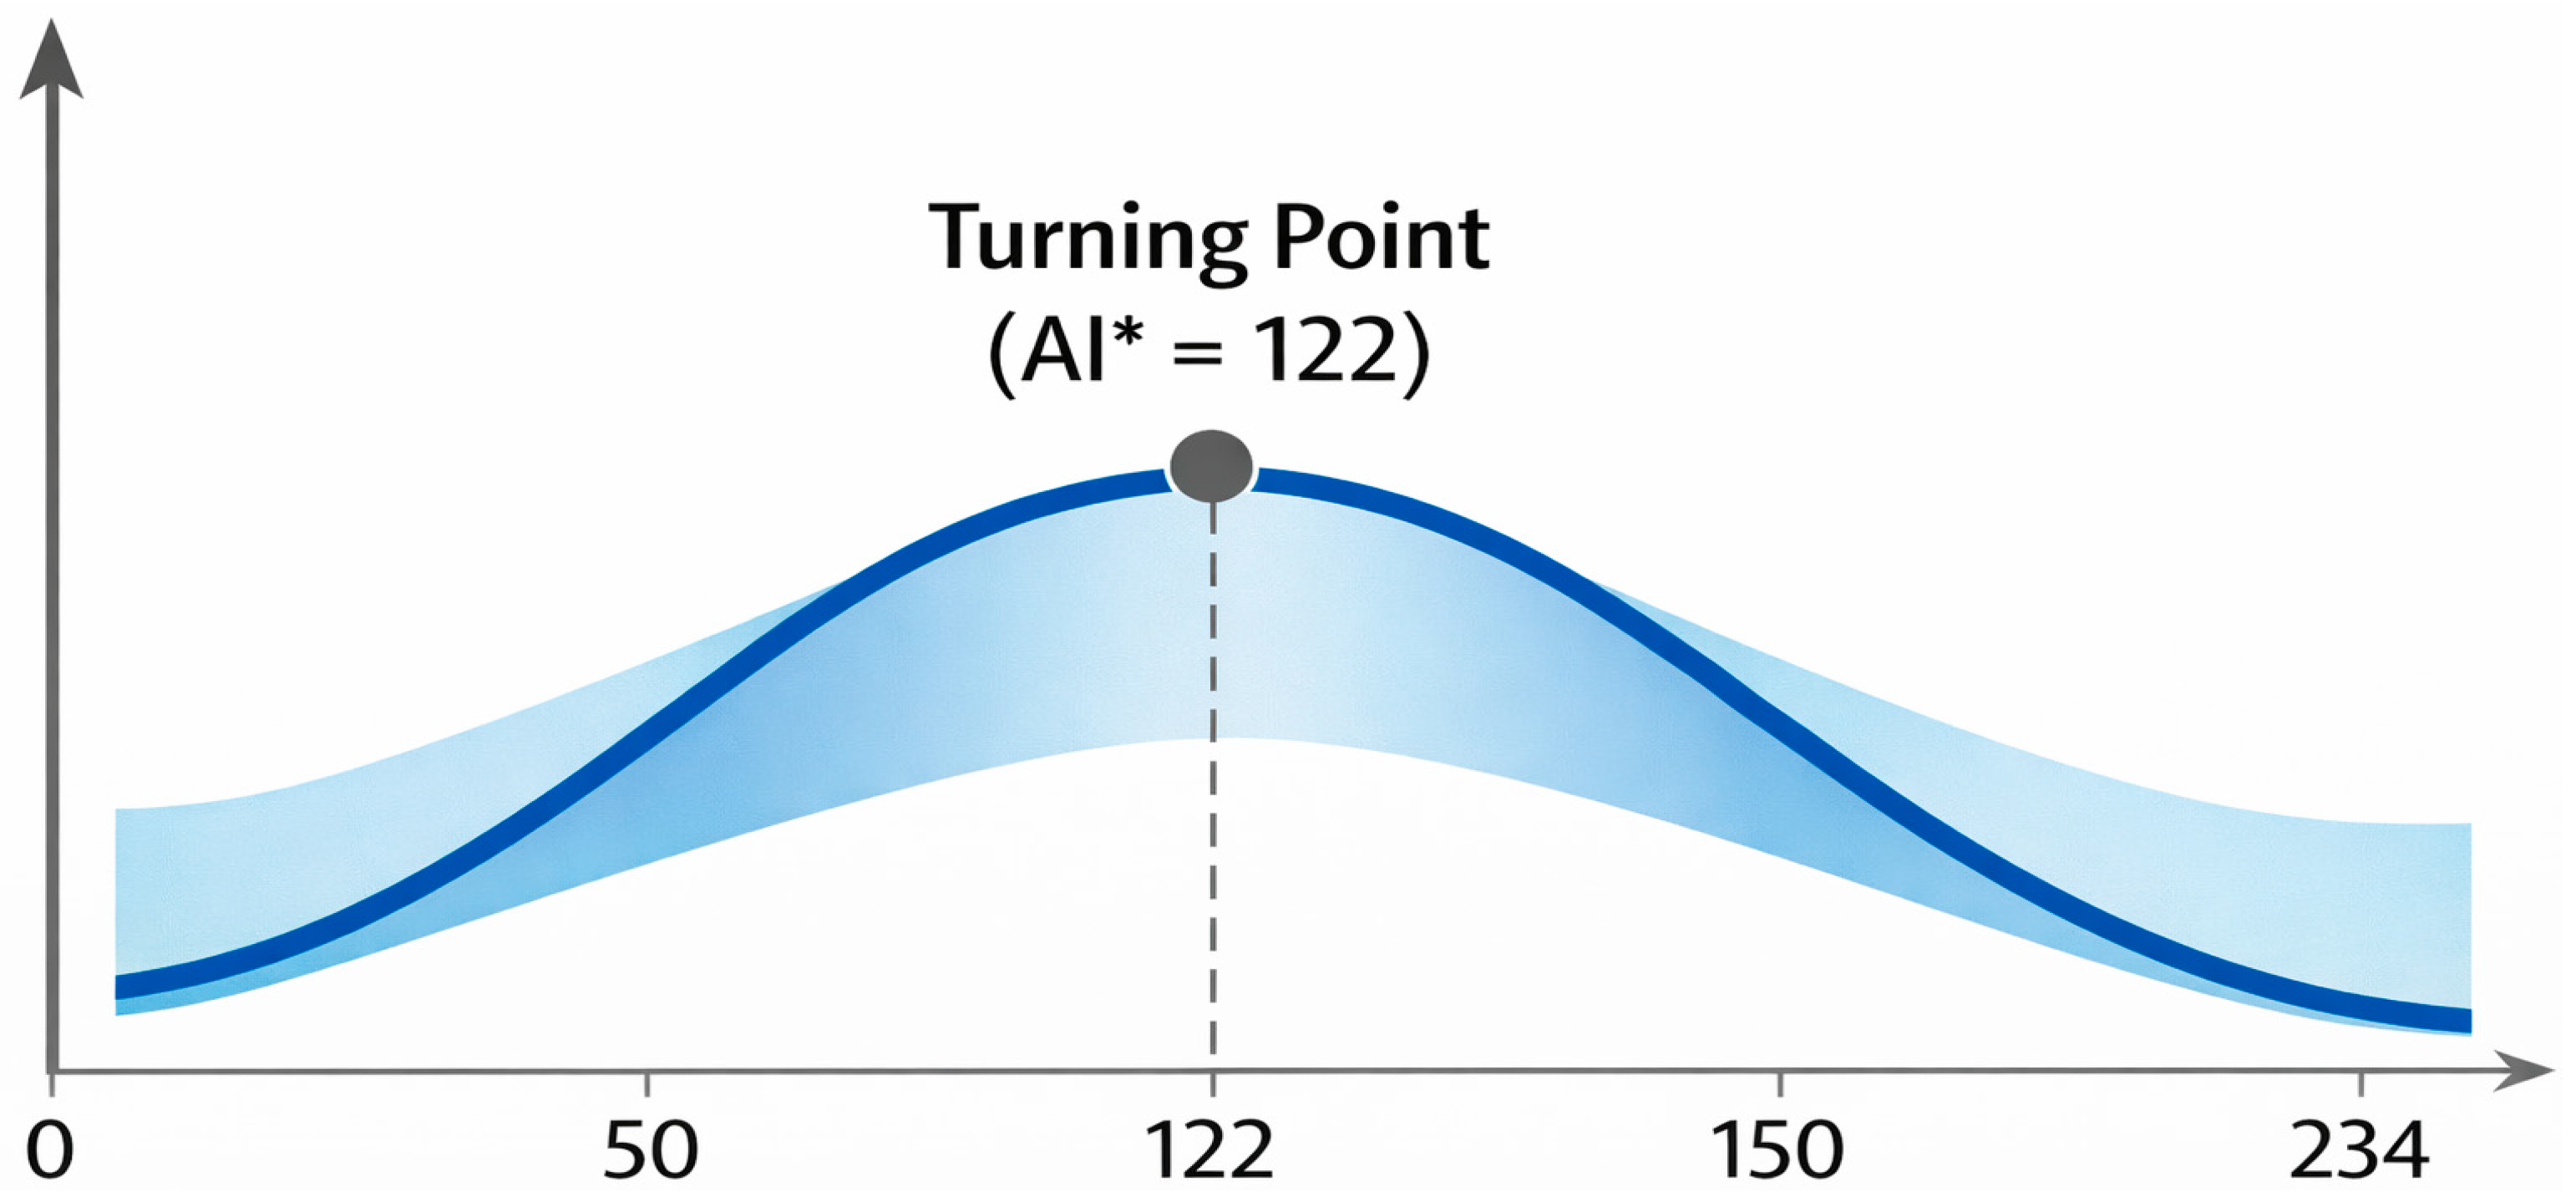
Figure 2 and
Figure 3 plot model-implied fitted values generated from the estimated coefficients over the observed range of AI disclosure intensity.
Figure 2 visualizes the fitted inverted U-shaped relationship, with the dashed vertical line marking the estimated turning point and the shaded band reporting 95% confidence intervals around the fitted curve.
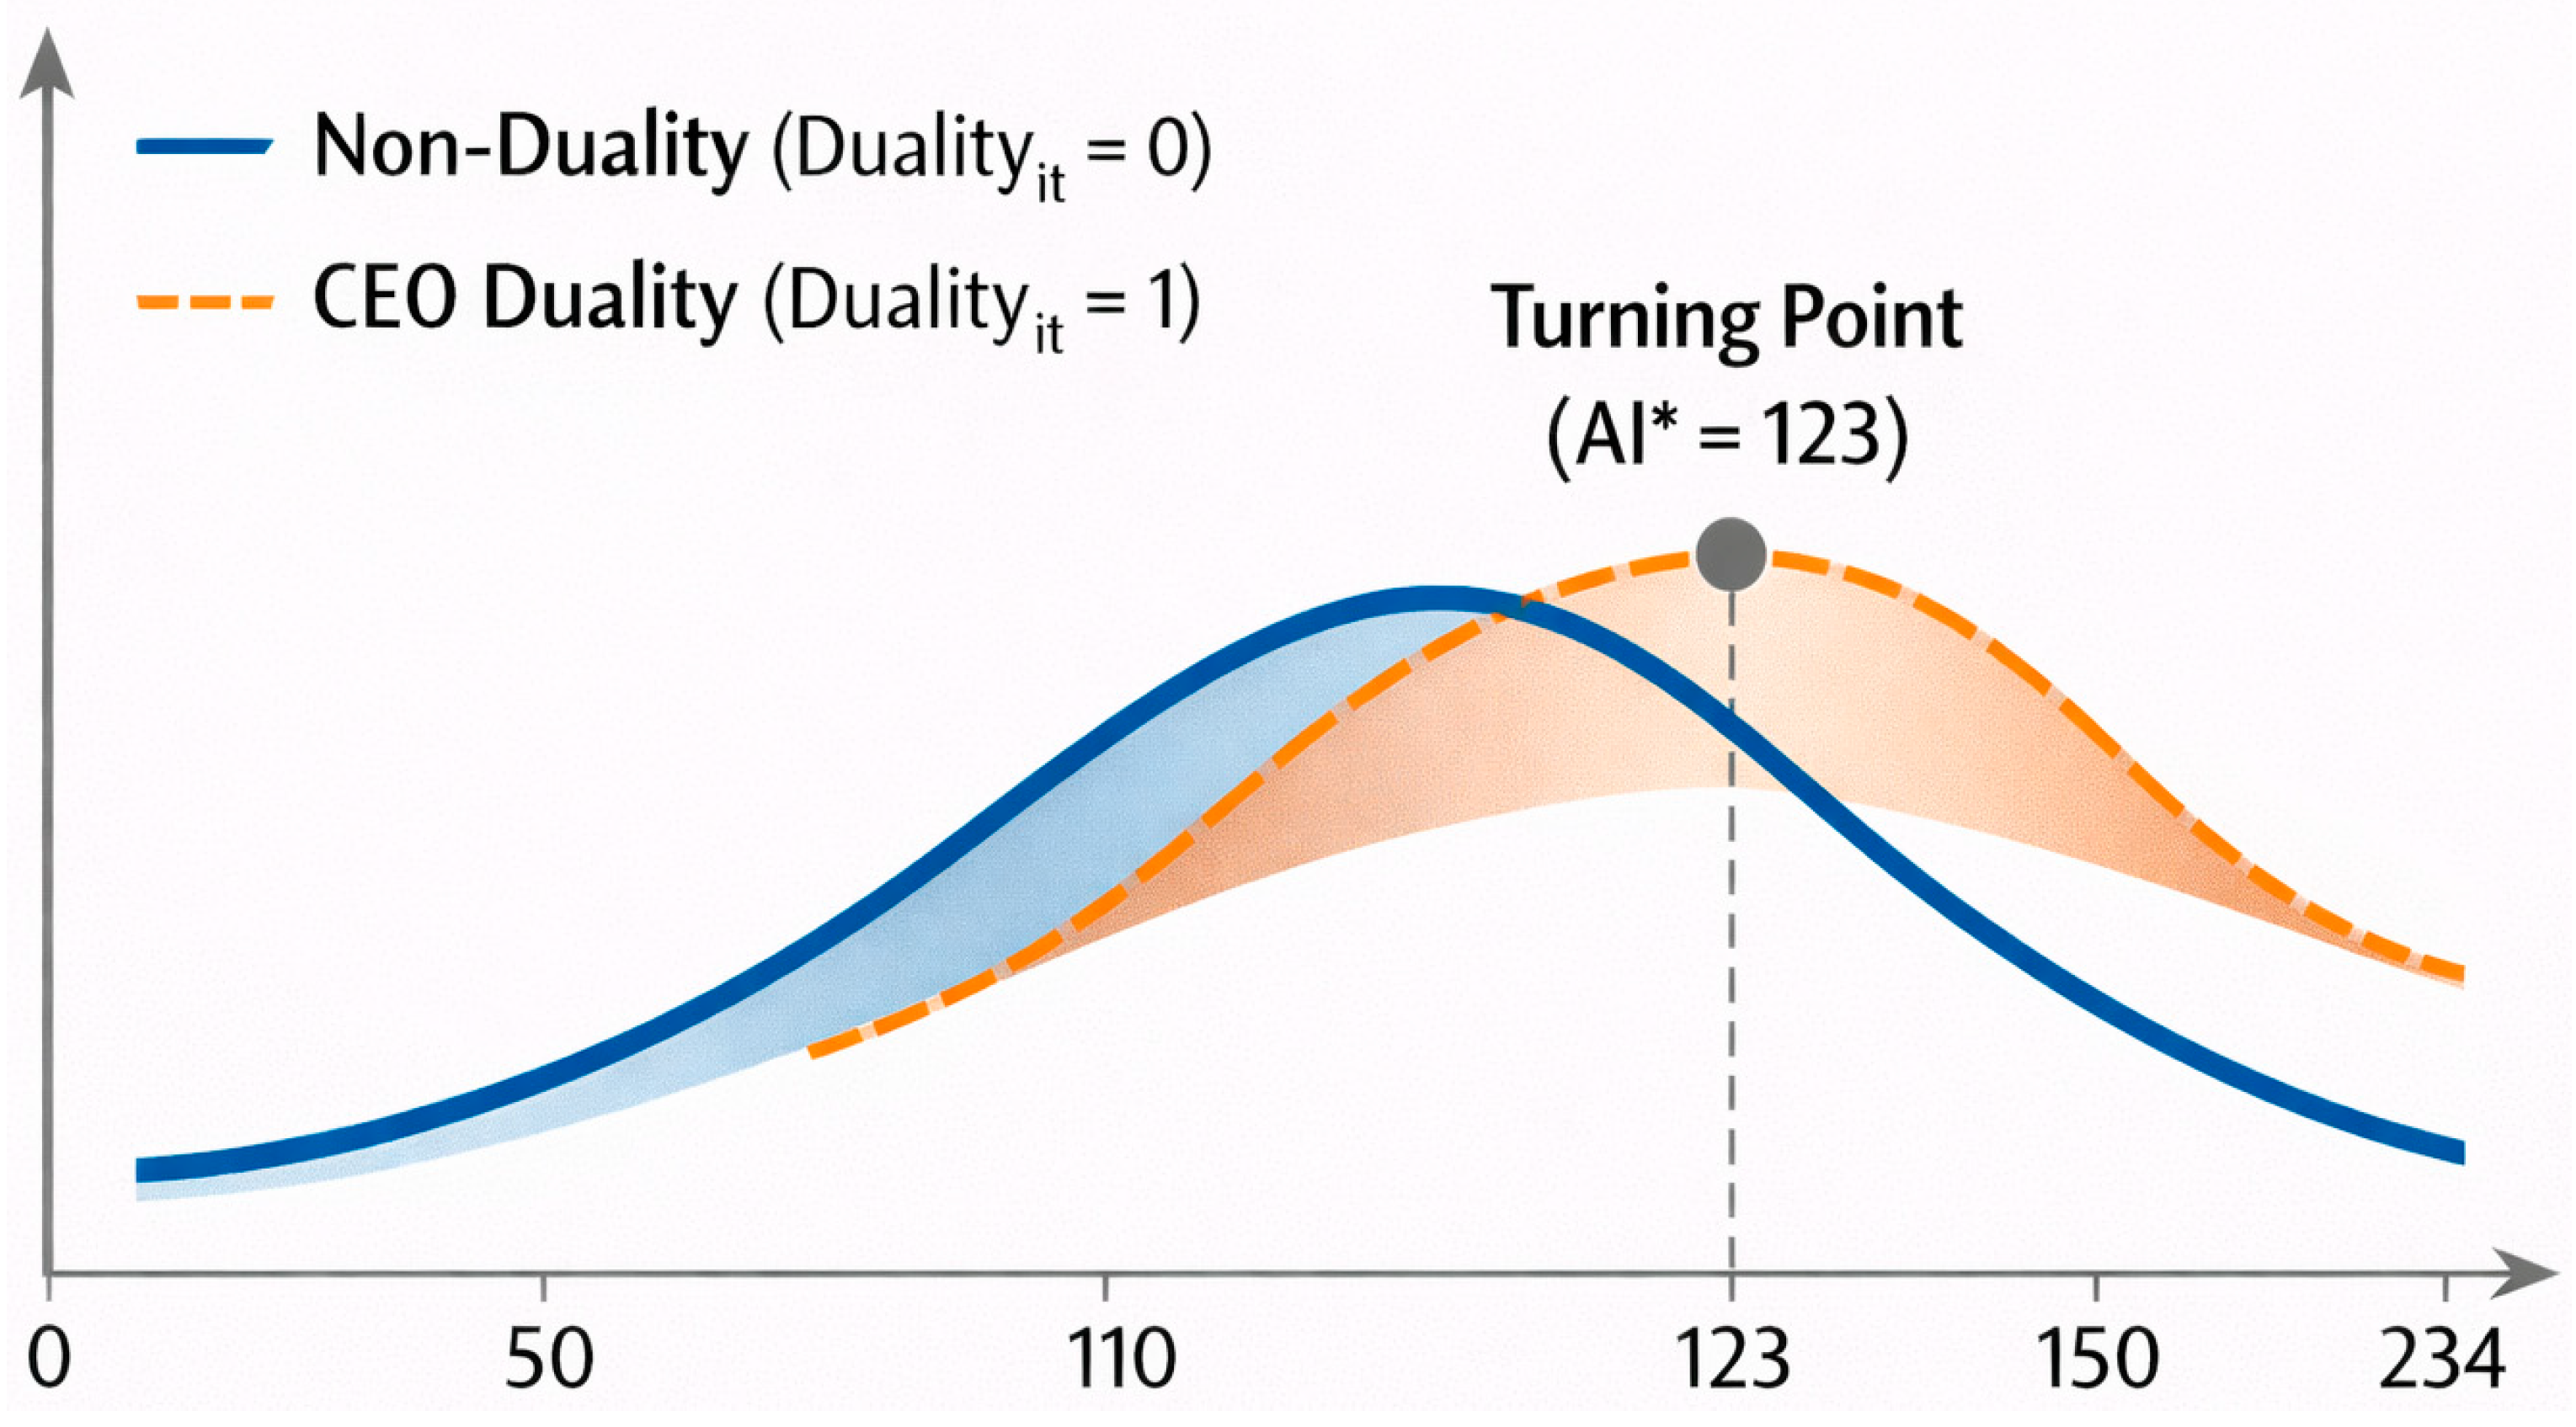
Figure 3 plots separate fitted curves for Duality
it = 0 and Duality
it = 1 to illustrate directional differences in curvature across governance conditions. These figures serve as interpretive aids for visualizing nonlinear patterns and conditional turning points, whereas statistical inference continues to rely on the reported coefficients and firm-clustered standard errors.
Robustness checks assess whether curvature is sensitive to scaling or extreme observations. Models are re-estimated using a log-transformed AI measure, winsorized AI counts, and specifications excluding the highest AI disclosers.
4. Results
Figure 2 and
Figure 3 plot model-implied fitted values generated from the estimated coefficients over the observed range of AI disclosure intensity.
Figure 2 visualizes the fitted inverted U-shaped relationship, with the dashed vertical line marking the estimated turning point and the shaded band reporting 95% confidence intervals around the fitted curve.
Figure 3 plots separate fitted curves for Duality
it = 0 and Duality
it = 1 to illustrate directional differences in curvature across governance conditions. These figures serve as interpretive aids for visualizing nonlinear patterns and conditional turning points, whereas statistical inference continues to rely on the reported coefficients and firm-clustered standard errors.
Table 3 presents descriptive statistics.
Overall, the descriptive statistics indicate substantial cross-sectional and temporal variation in AI disclosure and governance-risk intensity, providing a suitable basis for testing the nonlinear hypotheses.
4.1. Baseline Quadratic Fixed-Effects Model
Table 4 presents quadratic fixed-effects estimates with firm and year fixed effects and firm-clustered standard errors.
Column (1) provides thaseline test of curvature. The linear term on AIit is positive and statistically significant (β1 = 0.0148, p < 0.01), while the quadratic term is negative and statistically significant (β2 = −0.000060, p < 0.01). This pattern supports an inverted U-shaped association between AI disclosure intensity and governance-risk disclosures, consistent with H1.
The implied turning point is AI = 122.86 mentions. This turning point lies within the observed range of AIit (0 to 234), although it is located in the upper tail of the distribution. While the declining segment is identified from this upper portion of the sample, the turning point remains well within observed support and is stable across specifications. Approximately 7.5% of firm-year observations lie above AI*, indicating that the declining portion of the curve is identified from a meaningful, though relatively small, segment of the data. Because the turning point lies in the upper tail of the observed distribution, the declining segment should be interpreted cautiously and as consistent with, rather than conclusive proof of, more routinized governance conditions at high levels of AI disclosure intensity.
Below the turning point, increases in AI disclosure are associated with higher governance-risk disclosures; above the turning point, the association reverses.
Figure 2 visualizes the inverted U-shaped relationship estimated in
Table 4 using fitted values from the controlled specification.
The curve increases at low to moderate levels of AI disclosure intensity and declines beyond the turning point, consistent with the stage-dependent nonlinear pattern. Because
Figure 2 is model-based, it should be interpreted as a visualization of the estimated nonlinear association rather than as a plot of raw observations.
4.2. Stability Checks
Columns (2) through (4) assess whether the estimated curvature is sensitive to controls and influential observations. An additional construct-validity and robustness check uses a narrower AI-only dictionary restricted to explicit AI terminology and applies it to the full 2024 cross-section to assess whether clearly AI-specific disclosure is concentrated among firms classified as higher-intensity disclosers. Adding financial controls in Column (2) preserves the inverted-U pattern: the coefficient on AIit2 remains negative and statistically significant, and the turning point remains close to the baseline estimate at 121.72. Column (3), which winsorizes AIit at the 99th percentile, again produces a negative and statistically significant quadratic term with a similar turning point of 121.25. Column (4) excludes the highest AI-disclosing firm (NVDA), and the curvature remains statistically significant, with a turning point of 120.96. Overall, the evidence for nonlinearity is not driven by a single outlier or by the omission of financial controls, and the estimated turning point remains stable at approximately 121 to 123 mentions.
Applying the narrower AI-only dictionary to the full 2024 cross-section yields a clear gradient in explicit AI-specific disclosure. Across the 53 firms, the AI-only count ranges from 0 to 33, with a mean of 8.42 and a median of 7. In the targeted validation groups, average 2024 AI-only counts are 3.2 for the low group, 7.2 for the medium group, and 26.2 for the high group. This pattern supports the construct validity of the narrower dictionary and indicates that explicit AI-specific disclosure is concentrated most strongly among firms classified as higher-intensity disclosers.
4.3. Exploratory CEO Duality Moderation (H2)
While the nonlinear stage effect is the primary focus of the study, CEO power and oversight conditions are examined as boundary factors that may shape curvature.
Table 5 reports the moderated quadratic fixed-effects model that allows both slope and curvature of the AI–governance-risk relationship to vary with CEO duality. Interaction terms are included as AI
it × Duality
it and AI
it2 × Duality
it, with firm and year fixed effects and firm-clustered standard errors.
Given the limited within-sample prevalence of CEO duality in this panel, these moderation results are interpreted as exploratory boundary analyses rather than decisive tests of heterogeneous curvature.
The baseline inverted-U pattern remains present, with AIit positive and AIit2 negative. However, the curvature interaction AIit2 × Dualityit is not statistically significant, and the slope interaction AIit × Dualityit is also not statistically significant. This indicates that, in this sample, CEO duality does not measurably shift curvature in a statistically detectable way. Turning points computed from conditional coefficients differ modestly across duality and non-duality firms, but these differences are interpreted cautiously given the imprecision of the interaction estimates.
For reference, the implied turning point for non-duality firms is approximately AI ≈110.41, while the implied turning point for duality firms is approximately AI ≈ 123.45, based on conditional coefficients. Because the interaction terms are not statistically significant, these turning-point differences are descriptive rather than conclusive.
Figure 3 provides a visual aid for interpretation. The curve for duality firms exhibits slightly greater curvature than that of non-duality firms, consistent with the proposed direction in H2, but the absence of statistically significant interaction terms indicates that the evidence is not conclusive in this sample.
The visual patterns align directionally with the theoretical framework, but do not provide definitive evidence of moderation. Accordingly,
Figure 3 is used to illustrate the direction of fitted differences across duality conditions, whereas inference on moderation continues to rely on the interaction coefficients reported in
Table 5.
4.4. Exploratory Governance Oversight Moderation (H3)
Table 6 evaluates moderation by governance oversight. In this sample, external audit oversight is proxied by Big4
it. Because Big 4 coverage is very high among large U.S. firms, the moderation test focuses on whether audit oversight is associated with a change in curvature via AI
it2 × Big4
it. Firm and year fixed effects are included, and standard errors are clustered at the firm level.
Because Big 4 status exhibits very limited variation in this large-firm sample, the oversight moderation analysis should likewise be interpreted as exploratory and as a test based on a relatively coarse proxy.
The curvature interaction is not statistically significant, suggesting that, in this dataset, external audit oversight does not measurably attenuate the inverted-U relationship. This result is interpreted in light of the limited variation in Big 4 status in large-firm panels. Overall, the data do not provide strong evidence that audit-based oversight moderates curvature (H3), potentially because the proxy is too coarse or too invariant in this setting.
4.5. Full Model with Both Moderators
Table 7 reports a combined specification that includes CEO duality moderation and the audit-oversight curvature interaction. The purpose of this model is to verify that the baseline inverted-U pattern is not an artifact of estimating moderators separately. Firm and year fixed effects are included, and inference is based on firm-clustered standard errors.
The combined specification continues to show a nonlinear baseline association, while interaction terms remain statistically weak, consistent with
Section 4.3 and
Section 4.4. Overall, the results provide strong support for the baseline nonlinear association (H1), whereas evidence for curvature moderation by CEO duality (H2) and audit-based oversight (H3) is limited in this sample. This pattern is consistent with the possibility that moderation effects require richer governance measures or larger samples to detect reliably, particularly in large-firm panels with limited variation in key oversight indicators.
4.6. Alternative Outcome Specifications
Alternative outcome specifications were estimated to assess whether the nonlinear association depends on the logarithmic transformation of the dependent variable. Count and binary models yielded directionally consistent results, indicating that the main pattern is not driven by the specific functional form of the baseline specification. Full coefficient tables are reported in the replication repository (
Bonelli, 2026b).
An extensive-margin specification was estimated using a binary indicator equal to one when Gov_Riski > 0. Logistic fixed-effects models yielded directionally consistent patterns, with AI disclosure initially associated with a higher probability of governance-risk disclosure and subsequently associated with a lower probability at high levels of AI disclosure intensity. These alternative outcome specifications indicate that the nonlinear association is not an artifact of the logarithmic transformation and is robust across functional forms.
4.7. Timing and Reverse-Causality Checks
A potential concern is that governance-risk events may prompt firms to increase AI-related disclosure ex post, rather than AI disclosure intensity shaping governance-risk outcomes. To address this issue, the model was re-estimated using lagged AI disclosure intensity (AIi,t−1 and AIi,t−12) to predict contemporaneous governance-risk disclosures. The inverted-U pattern persisted under the lagged specification, with a positive linear term and a negative quadratic term. The estimated turning point remained within the empirical range of AI disclosure intensity.
As a complementary placebo test, the temporal ordering was reversed by examining whether current AI disclosure predicted prior governance-risk intensity (GovernanceRiski,t−1). In these placebo specifications, the curvature weakened substantially and was not consistently statistically significant. This pattern supports the intended temporal interpretation in which AI disclosure intensity precedes, rather than follows, governance-risk dynamics. The timing tests mitigate concerns that the nonlinear association reflects simple reverse causality or contemporaneous reporting adjustments.
5. Discussion and Implications
The central empirical result is that AI disclosure intensity is associated with governance-risk disclosures in a stable inverted U-shaped pattern, with an interior turning point and robustness to standard controls and influence checks. This finding reframes what AI language in mandatory filings can signal for governance: not a uniformly “good” or “bad” technology story, but a stage-dependent accountability environment in which transitional complexity can precede institutionalized control.
A linear interpretation would imply that increasing AI disclosure intensity steadily tightens controls (a monitoring story) or steadily worsens opacity (a diffusion story). The inverted U instead implies that both forces can operate, with their net effect changing as AI becomes more prominent in corporate narratives. In the lower-to-middle range of AIit, rising AI disclosure intensity plausibly captures a transition period in which firms scale AI initiatives, integrate data pipelines, and reconfigure decision routines. That transition can increase organizational complexity faster than governance routines adjust. Responsibility boundaries become less clear, monitors may struggle to distinguish model error from discretionary choices, and organizations may rely more heavily on algorithm-informed judgments without fully mature assurance routines. Even absent malicious intent, these conditions can elevate disclosed governance-risk intensity through a greater likelihood of internal control weaknesses, restatements, or investigation-related references during periods of rapid process change.
At higher levels of AI disclosure intensity, the decline in GovernanceRisk suggests a different equilibrium that may reflect more routinized governance and reporting arrangements. In that regime, the same technologies that increase complexity can also improve traceability and comparability, tightening controls and reducing the scope for concealment or rationalization. This interpretation does not require AI to be intrinsically “ethical.” Rather, it suggests that firms with higher AI disclosure intensity may also have more developed monitoring routines around AI-related processes and therefore exhibit fewer disclosure-based signals of governance risk. At the same time, this interpretation remains inferential rather than directly observed, particularly because the turning point is estimated from the upper tail of the sample distribution and the measure captures disclosure intensity rather than verified governance capability. The contribution, therefore, is not simply that AI disclosure correlates with governance risk, but that the relationship is stage-contingent, with AI disclosure intensity serving as a disclosure-based indicator of evolving socio-technical control environments rather than a direct measure of governance capability.
The moderation tests were intentionally demanding: they asked whether CEO duality and governance oversight proxies shift curvature itself, not merely the level of disclosed risk. In this sample, curvature interactions were imprecisely estimated and moderation was not statistically decisive. This does not undermine the stage-dependent mechanism, but it clarifies what can be claimed and where measurement limits may bind. Methodologically, CEO duality is relatively infrequent and slow-moving in large-firm panels, while Big4it is nearly invariant; limited within-sample variation reduces power to detect moderated curvature even if moderation exists in the population. Conceptually, lifecycle dynamics may be driven by operational and assurance routines that converge across large U.S. firms as AI disclosure intensity increases, leaving less room for differences attributable to single, coarse governance indicators. Substantively, governance may matter through more granular channels than CEO duality or Big 4 status alone can capture—such as board AI expertise, audit committee technology competence, internal audit capabilities for model governance, and firm-specific model risk management structures. In that sense, the moderation results are informative boundary evidence: they caution against assuming that standard governance proxies will reliably explain variation in AI-stage dynamics in large-firm environments and motivate a more technology-specific view of governance capacity.
The findings have direct implications for boards, auditors, and regulators. For boards, rising AI disclosure intensity in mandatory disclosures may be a warning flag even when the narrative is optimistic. The upward-sloping portion of the curve is consistent with a period in which organizational change outpaces control adaptation. Boards can treat early-to-mid increases in AI disclosure as a prompt to scrutinize governance infrastructure—model validation routines, documentation, auditability, escalation processes, and accountability assignments for AI-enabled decisions. The implication is procedural rather than punitive: oversight should tighten when AI disclosure intensity rises sharply, not only after adverse events.
For auditors and assurance functions, the results align with the view that technology-driven process change can amplify risk before it becomes a control enhancer. This strengthens the case for integrating AI-related workflow understanding into audit planning, internal control evaluation, and internal audit scoping, emphasizing traceability, reviewability, and responsibility mapping. For regulators, the stage-dependent pattern suggests that disclosure may contain signals about where governance attention should focus. Sharp increases in AI disclosure intensity may indicate transition risk, especially if accompanied by weak internal control language or vague responsibility statements. This supports incremental guidance encouraging clearer accountability mapping in AI-related disclosures rather than immediate prescriptive disclosure rules.
Several limitations bound interpretation and point to research opportunities. Accordingly, the findings should be interpreted as disclosure-based evidence from a selected sample of large U.S. public firms rather than as direct evidence of AI governance capability or broad firm-level generalizability. First, the measure captures AI disclosure intensity rather than verified deployment intensity. Because AI disclosure intensity reflects narrative emphasis rather than operational implementation, the measure may capture both substantive adoption and strategic framing. Future research linking AI disclosure intensity to direct indicators of AI deployment and model governance would strengthen causal interpretation. Second, the dependent variable is disclosure-based. It reflects both underlying problems and disclosure incentives or obligations, so it is best interpreted as governance-risk exposure rather than confirmed misconduct incidence. Third, the sample consists of large, technology-exposed U.S. firms; governance convergence in this environment may differ from smaller firms or non-U.S. settings. Accordingly, the findings are best interpreted as evidence from large-firm disclosure environments rather than from corporate settings more generally.
Finally, although fixed effects absorb stable firm traits and common year shocks, time-varying confounds remain possible, which motivates complementary timing and placebo checks alongside the baseline design.
6. Conclusions
This study examines whether AI disclosure intensity in Form 10-K filings is associated with governance-risk disclosures in a linear or nonlinear manner. Using a balanced panel of 53 selected large U.S. public firms, observed from 2020 to 2024, and a transparent dictionary-based measure of AI language, the evidence indicates an inverted U-shaped relationship: disclosed governance-risk intensity increases as AI disclosure intensity rises from low levels, but declines once AI disclosure intensity becomes very high, with an interior turning point within the observed disclosure range.
The core implication is that the governance consequences of AI disclosure intensity are stage-dependent. Early increases in AI disclosure intensity are consistent with a transition period in which complexity and responsibility diffusion can outpace monitoring routines, whereas higher levels of AI disclosure intensity may be associated with more routinized governance and reporting arrangements, auditability, and tighter opportunity suppression. This reframes AI disclosure intensity as a disclosure-based indicator of evolving socio-technical control environments rather than a monotonic signal of stronger governance. Because the evidence is based on disclosure patterns in a selected sample of large U.S. public firms, the results should be generalized cautiously beyond similar reporting environments. Accordingly, the evidence should be read as supporting a stage-dependent interpretation of disclosure patterns rather than as direct evidence of AI governance maturity or implementation quality.
Moderation tests do not provide strong statistical evidence that CEO duality or an audit-based oversight proxy shifts curvature in this large-firm sample. Rather than undermining the framework, this pattern motivates sharper governance measurement: AI-specific oversight capacity, board and audit committee technology expertise, internal audit model-governance capability, and explicit model risk governance disclosures are likely to be more diagnostic moderators than general governance architecture alone.
Future research can extend this design in three directions. First, it can link AI disclosure intensity to more direct measures of AI deployment and model governance, including disclosures tied specifically to automated decision systems and control redesign. Second, it can test whether AI-specific board expertise and assurance capabilities explain cross-firm heterogeneity in stage dynamics. Third, it can broaden the setting to smaller firms and international contexts where disclosure practices and governance convergence differ, enabling a more complete understanding of when AI disclosure intensity mitigates versus amplifies accountability risk.