1. Introduction
The analysis of business cycle synchronization across a group of countries such as the G7, European Union, and ASEAN 5 can be fundamental in international macroeconomics. Empirical studies on international business cycle synchronization are characterized by several distinct analytical frameworks in the existing literature. In this context, we can cite the works of
Frankel and Rose (
1998),
Imbs (
2004,
2006),
Davis (
2014),
Araujo et al. (
2017),
H. S. Lee et al. (
2022),
Arzoumanian (
2024), etc. These types of studies permit the analysis of the transmission of global shocks, the efficacy of domestic policy, and the possible feasibility of monetary union cooperation among a group of countries. Most of these studies were interested in giving answers to the following question: what are the main drivers of business cycle synchronization?
Conventional economic models, rooted in Optimum Currency Area and endogenous synchronization theories, assert a clear causal link between main drivers of business cycle synchronization: deepened economic integration through trade, financial linkages, and structural similarity certainly leads to more correlated business cycles (
Frankel & Rose, 1998;
Imbs, 2004).
Other works insisted on the significance of other factors on business cycle synchronization. In this context, political and institutional proximity can act as a locomotive force to enhance synchronization. The prevailing wisdom suggests that countries with aligned political ideologies, coordinated policy stances, and similar institutional quality are better positioned to foster a convergent economic environment, thereby enhancing business cycle synchronization. To confirm this view, this paper tries to examine the negative role of political distance on business cycle synchronization in the G7.
To the best of our knowledge, although a limited number of studies have investigated the impact of institutional and political proxies on business cycle synchronization, the existing literature examines the relationship between stock market synchronization and institutional distance (
Berry et al., 2010;
Guo & Tu, 2021). The main contribution of this paper is firstly to construct the political distance indicator based on differences in government orientation, and secondly, to identify and empirically examine the significant role of the political distance, alongside standard economic channels, notably trade and financial integration on business cycle synchronization.
According to this political distance variable, we assume that, in a highly integrated economic block exposed to common global shocks from financial crises and commodity price swings to pandemics, divergent political leadership can catalyze heterogeneous policy responses. A fiscally conservative, market-oriented government in one country may respond to a global recession in a partner country and may deploy aggressive fiscal stimulus. Rather than isolating these economies, we argue that such policy divergence, when filtered through the dense, pre-existing channels of G7 trade and finance, can generate powerful cross-border spillovers. The stimulus in one nation boosts import demand, involuntarily pulling its trading partners, even those pursuing contractionary policies, toward recovery. Thus, the convergence in political response creates a functional, if unintentional, coordination that synchronizes the cyclical outcomes.
To empirically investigate this idea, this study employs an analysis of the G7 country-pairs from 2013 to 2023. We construct a nuanced, multi-dimensional index of political distance, capturing both government partisanship and broader institutional quality, and examine their impact on synchronization. Our findings support the traditional view, revealing a statistically significant negative relationship between institutional distance and business cycle synchronization.
This research makes a critical contribution to the political economy of international business cycles. It highlights the significant link between political proximity and economic comovement, therefore suggesting that for a group of highly integrated, advanced economies, the forces of macroeconomic interdependence may be more effective in that they can transform political convergence into a source of cyclical synchronicity. The implications for international policy coordination are profound, suggesting that managing the spillovers of inevitable policy similarities is as important as striving for political consensus.
The structure of the paper is the following: after introduction,
Section 2 gives a short literature review on business cycle synchronization and highlights the main drivers leading to higher scores of business cycle synchronization.
Section 3 describes the data and methodology. In this section, we present variables used in this paper with more details, as we present the political distance as an institutional proximity variable that can foster business cycle synchronization.
Section 4 is devoted to the empirical results and their discussions. In
Section 5 we present the robustness of our findings. Finally,
Section 6 concludes the paper.
2. Literature Review
Business cycles represent the study of the economic activity fluctuations between the phases of expansion and contraction. In an increasingly interconnected global economy, the phases of upwards and downwards of one country can significantly influence the economic activity fluctuations of other countries, especially with those having strong relationships. This phenomenon is known as business cycle synchronization for which we are interested in measuring the degree of business cycles of two or more countries that move together in same way.
Understanding the degree and drivers of the synchronization for a group of countries is crucial for policymakers, investors, and multinational corporations. For instance, highly synchronized cycles can facilitate international policy coordination but can also mean that a global recession spreads rapidly among countries. Conversely, non-synchronized or desynchronized cycles can represent a barrier, where growth in one region can weaken the growth in another, creating diversification opportunities for global investors.
In this section we will explore the concept of business cycle synchronization and examine the essential forces that drive this synchronization. Firstly, we will analyze how the traditional drivers, like trade linkages and financial integration, create transmission channels for economic shocks and lead to synchronized business cycles. Secondly, we will examine the growing role of institutional factors in influencing the level of synchronization. Furthermore, by examining these drivers, we can better analyze the dynamics of the global economic fluctuations and the forces that lead national economic activities to move together in the same direction.
2.1. Traditional Drivers of Business Cycle Synchronization
To guarantee a great global economic interconnection between a group of countries, we should verify that business cycle synchronization (BCS) between the group of countries is high, i.e., the economic fluctuations of the countries move similarly over time and the periods of expansions and recessions between countries are highly correlated. This fact reinforces policy coordination and economic stability. Some factors such as agreements between two or more countries (for example, The US–Mexico–Canada Agreement, USMCA), trade blocs (for example, Association of Southeast Asian Nations, ASEAN; Free Trade Area, AFTA) or currency union (EURO currency for example).
When economies are perfectly synchronized authorities and policymakers can easily implement programs of monetary union or unified fiscal policy systems, as these economies share similar shocks. With high levels of business cycle synchronization, uncertainty diminishes and investors and traders become more confident as the macroeconomic conditions across borders become more stable; this promotes cross-border investments and stabilizes trade flows. According to research findings, trade volumes significantly affect business cycle synchronization and can be considered the most important factor (for instance,
Frankel & Rose, 1998). The second important factor mentioned by authors in affecting synchronization is financial integration (for instance,
Kalemli-Ozcan et al., 2013;
Gong & Kim, 2018;
Böhm et al., 2022). However, the transmission of financial shocks and the amplification of credit cycles through cross-border capital flow movements, including banking and portfolio investment, can significantly lead to perfect cyclical synchronization (
Imbs, 2004).
Additionally, when countries have similar industrial compositions, they appear to be more correlated and often experience perfect synchronization because of similar sector-specific shocks.
Beck (
2013) concluded that similar economic structures among countries have a significant impact on business cycle synchronization, for which these similarities adopt more similar responses to external exogenous shocks. By exploring the main factors influencing business cycle synchronization,
Kose and Yi (
2006) concluded that industrial structure similarity significantly affects GDP synchronization and that different industrial structures between countries respond in different cycles when facing the same industry shock.
Also, another important driver of business cycle synchronization is monetary and fiscal policy coordination, where when nations share the same currency or when their monetary and fiscal policies are highly coordinated, they can associate economic responses with shocks, therefore improving synchronization. In this way,
Diendere et al. (
2024), examined the impact of central bank independence on monetary integration and business cycle synchronization within the economic community of West African States (ECOWAS). Their findings showed that monetary integration has a significant and positive effect on business cycle synchronization in the long run. Additionally, they highlighted that central bank independence significantly and positively affects synchronization. They concluded that by adopting stronger policy coordination, institutional capacity, and transparency, ECOWAS can plan a successful monetary union. Meanwhile, according to the optimum currency area theory connection, we can say that similar economies face similar inflationary pressures, leading their central banks to raise or lower interest rates at the same time. This monetary policy synchronization can be considered a powerful driver of business cycle synchronization, i.e., the European Central Bank’s policy represents the ultimate example for the significant positive effect of monetary policy on business cycle synchronization.
Based on a study of seven West African Economic and Monetary Union (WAEMU) countries for the period 1995–2018,
Chedi (
2024) found that the impact of economic policy coordination on business cycle synchronization is mixed. Using a cross-sectionally augmented ARDL model, he concluded that the coordination of inflation rates significantly strengthens synchronization. Conversely, he distinguished that the coordination of budgetary balances negatively affects synchronization which leads to economic divergence over time.
Wuri et al. (
2025) were interested in explaining how the countries that participate in global value chains (GVCs), their industrial sectors become interconnected across borders, implying that economic fluctuations in one nation can rapidly transmit to others through trade in intermediate goods. Indeed, within the framework of GVCs, production processes become fragmented across borders, the transmission of shocks through trade in intermediate goods intensifies comovements in economic activity, and therefore GVCs can be considered as a key determinant of business cycle synchronization. However, when a country decides to move toward higher-value challenging activities, such as R&D, high technology, and design, it can enhance economic resilience and foster synchronized growth across integrated regions, thereby making business cycles more synchronized through shared production networks and technology transfer. Such a finding confirms the pioneer studies of
Frankel and Rose (
1998) and
Imbs (
2004) who concluded that deeper trade and financial linkages foster synchronized cycles. Intra-industry specialization and vertical integration within GVCs, where countries are trading intermediate goods within the same industry, tend to align business cycles and create stronger cross-border spillovers (
Duval et al., 2014). Recent empirical work in regional blocks like ASEAN confirms that policy coordination and production network integration significantly shaped BCS.
In summary, a high level of synchronization between a group of countries can serve as a significant tool for risk sharing, as correlated economic cycles can avert asymmetric shocks that could otherwise jeopardize political and economic partnerships. Consequently, comprehending and raising the factors that drive BCS, such as credible monetary policy, as emphasized by
Delgado et al. (
2020), is essential for advancing deeper economic integration, alleviating regional crises, and attaining sustained collective growth.
2.2. Institutional Drivers of Business Synchronization: Impact of Political Distance
Along with bilateral trade, financial linkages and specialization, business cycle synchronization is influenced by other drivers, including the institutional dimensions, which have been considered along with economic and financial variables. Certain studies have highlighted the significant role of political factors in the synchronization of business cycles across countries. For instance, simultaneous left-wing governments tend to enhance synchronization, whereas right-wing governments may have an opposite effect, although this finding is statistically weaker (
Cerqueira & Martins, 2011). The political environment, including the ideological alignment of governments and election timings, significantly impacts economic-cycle synchronization. The role of these institutional factors can be a complementary economic determinant to traditional factors rather than a substitution (
Cerqueira & Martins, 2007). Furthermore, differences in political parties between countries can lower business cycle comovement, particularly when partisan effects are considered over several quarters post-election (
Sng et al., 2017). While economic factors like trade and financial integration remain crucial, with trade integration—especially through intermediate input trade—being a strong driver of synchronization (
H. H. Lee et al., 2024), political factors add a complex dimension to the comprehension of these dynamics. In the Mediterranean context, despite political efforts to foster regional integration, business cycles remain largely asynchronous, suggesting that political initiatives alone may not suffice to achieve synchronization without addressing underlying economic disparities (
Medhioub, 2010).
Afonso and Morão (
2024) studied the impact of institutional factors such as capital controls and political stability on business cycle synchronization. Their findings suggested that equity flows are more intense between countries in the same phase of the business cycle, which discourages international risk sharing. However, this concept of synchronization is largely driven by financial and macroeconomic factors, such as correlated returns and trade linkages, rather than by institutional variables. Institutional factors are shown to be more relevant for explaining smaller and medium-sized capital flows, whereas business cycle synchronization plays a deep role in larger flows. Overall, the relationship between political and economic factors is complex, and both concepts must be considered to fully understand and enhance business cycle synchronization across countries.
Traditionally, three institutional theories developed the concept of institutional distance: organizational institutionalism, institutional economics, and comparative institutionalism. Regarding the first theory, organizational institutionalism, its roots are extracted from sociology, positing that distance creates challenges for multinational companies that can make different social contexts to reinforce their power in the market. Contrary, the second theory considers that distance can increase transactions costs and operational risks to distinguish between formal and informal institutions among countries. The third theory underlines how nations can establish coherent yet divergent systems within complementary institutions in domains such as corporate governance or innovation.
Based on their paper,
Kostova et al. (
2020) constructed a proxy for institutional distance that permits the measurement of the differences between the institutional profiles of two countries. This variable allows us to capture the possible cross-national variation among different institutional dimensions, primarily drawing from these three theoretical perspectives mentioned above.
2.2.1. Political Distance and Business Cycle Synchronization
Like the notion of institutional distance framework, we can use the concept of political distance to explain its role in business cycle synchronization. We consider this framework to reflect the institutional variations between countries such as the regulatory and formal dimensions (for example, the quality of governance, the rule of law, the political stability, the governing party, etc.,). A significant difference between countries can create divergences and therefore economic actors respond to shocks differently. In addition, political distance can capture differences in political systems, ideologies, and policy-making preferences. In this light, a smaller political distance would enhance business cycle synchronization through various mechanisms that can be derived from institutional theory. However, a low political distance that refers to a pair of countries with similar political institutions and ideologies is more likely to implement synchronized fiscal and monetary policies in response to economic shocks. Conversely, a high political distance heightens uncertainty for both investors and businesses. Nevertheless, when the political environment is unstable or unpredictable between two countries, investors are discouraged from making investments.
Therefore, we can notice that a strong economic linkage between countries can be considered a driver of business cycle synchronization, as shocks to demand in one country can be directly transmitted to the other through trade and investment channels.
On the other hand, legitimacy of supranational coordination can lead to low political distance in which each of them is more likely to view the other’s adopted policy as legitimate. This may also be more enthusiastic to yield sovereignty to supranational entities, such as the EU, the G7, or more recently the BRICS). This fact accelerates the establishment of formal institutions that explicitly designate policy coordination, thereby promptly synchronizing their economic cycles.
In conclusion, with respect to institutional theories, it can be stated that lower political distance, which is a crucial element of formal institutional distance, creates aligned institutional environments that foster coordinated policy actions, deeper economic integration, and diminished uncertainty. These factors are fundamental mechanisms for enhancing business cycle synchronization among countries.
2.2.2. How to Construct Political Distance?
The principles of policy coordination indicate that countries sharing similar political and economic objectives are more inclined to harmonize their fiscal and monetary policies, which consequently leads to more synchronized business cycles. In this context, it is noted that political environment closeness improves the synchronization of business cycles by promoting economic channels (
Chang et al., 2013), i.e., it facilitates trade agreements, minimizes investment risks, and fosters policy coordination.
In this paper, we rely on the theoretical foundations of the traditional partisan model
Hibbs (
1977) and the rational partisan model
Alesina (
1988) to construct a measure of political distance defined as the absolute difference between political codes of each pair of countries. This variable is expressed as follows:
where
This system makes it possible to analyze whether political alignment influences the coordination of economic policies within countries. It is based on a set of economic, social and international criteria which allow for a coherent classification between the G7 countries.
From an economic perspective, right-wing governments (code 1) generally favor tax cuts, deregulation, and free-trade policies, while left-wing governments (code −1) emphasize taxation, regulatory intervention, and social welfare. Centrist governments (code 0) typically adopt moderate or mixed approaches.
Social criteria reinforce this categorization: right-wing parties generally defend conservative values and the maintenance of bilateral institutions, while left-wing parties advocate for progressive reforms and greater equality of rights. Centrist parties, for their part, generally adopt a pragmatic position based on compromise.
This codification also establishes an international alignment of political parties, where affiliation with the European People’s Party (EPP) indicates a right-wing position, the Progressive Alliance represents a left-wing position, and the Liberal Alliance denotes a centrist position. This classification is uniformly applied to all other G7 countries. Among the countries where right-wing parties are predominant are the United States, under a Republican administration; Canada, when governed by the Conservative Party; Japan, under the Liberal Democratic Party; and the United Kingdom, when the Conservatives hold power. Left-wing governments include Democratic administrations in the United States, the New Democratic Party in Canada, the Progressive and Constitutional parties in Japan, and the Labour government in the United Kingdom. The centrist classification is primarily applied to the Liberal Party of Canada, which consistently maintains a centrist position.
The political distance variable takes the values 0, 1, or 2. From an economic perspective, a higher political distance value indicates that both countries have significantly different institutions, political regimes, or regulatory frameworks, which tend to weaken the transmission of economic shocks and reduce the synchronization of business cycles. Conversely, a small political distance reflects institutional similarity, or political compatibility, which facilitates macroeconomic coordination and increases the likelihood of cyclical convergence. Therefore, the expected sign related to the coefficient of political distance in explaining synchronization is negative; as political distance increases, synchronization is expected to decline.
3. Data and Methodology
3.1. Data and Descriptive Statistics
In this paper, our estimations are based on annual data covering the years 2013 to 2023 concerning the G7 countries: Canada, France, Germany, Italy, Japan, the United Kingdom, and the United States.
For the proxy variable representing the synchronization, we employ the same metric used by
Kalemli-Ozcan et al. (
2013), which is defined as follows:
where
and
represent the actual GDP growth rates of countries i and j, respectively, during year t.
In terms of explanatory variables for analyzing business cycle synchronization within the G7, we consider three important latent factors that illustrate the transmission channels of business cycles: trade integration, financial integration and political distance. For trade integration we consider the measure of
Frankel and Rose (
1998) calculated as follows:
where
,
represent the exports and imports between countries i and j, respectively, in year t. GDP refers to the gross domestic product for each country.
Financial integration is proxied by the bilateral portfolio investment relationship which is calculated as:
where
is the sum of bilateral portfolio investment between both countries i and j in year t. For both variables data were collected from the OECD database.
Finally, the calculation of the variable political distance is performed as outlined in the previous section. The data pertaining to this variable were collected from the historical records of G7 country governments between the years 2013 and 2023. The main variables’ descriptive statistics are shown in
Table 1.
The analysis reveals distinct patterns across key international relationship variables. The synchronization index (Synch variable) exhibits a wide range, a minimum value of −25.24 and a maximum value of −0.11. The standard deviation for this variable is approximately 5.443, characterized by a left-skewed distribution where most country pairs show moderate divergence while a few of them experience significant differences. Trade intensity exhibits extreme concentration with a notably high right-skewed distribution, suggesting that most pairs maintain limited trade relationships, whereas a small subset accounts for excessively high volumes of trade. Portfolio investments demonstrate a moderate right-skewness with significant variability, reflecting generally limited financial integration among most pairs, with only a few exceptional cases showing substantial linkages. Finally, the political distance variable operates on a scale ranging from 0 to 2 with a symmetric distribution centered around moderate political divergence (mean: 0.95, median: 1). The balanced spread across all three possible values (0, 1, 2) indicates the absence of a prevailing alignment pattern, reflecting roughly equal proportions of country pairs with minimal, moderate, and maximum political differences. The flat distribution (negative kurtosis) suggests a variety of political relationship configurations among the country pairs, with no particular distance category predominating the sample.
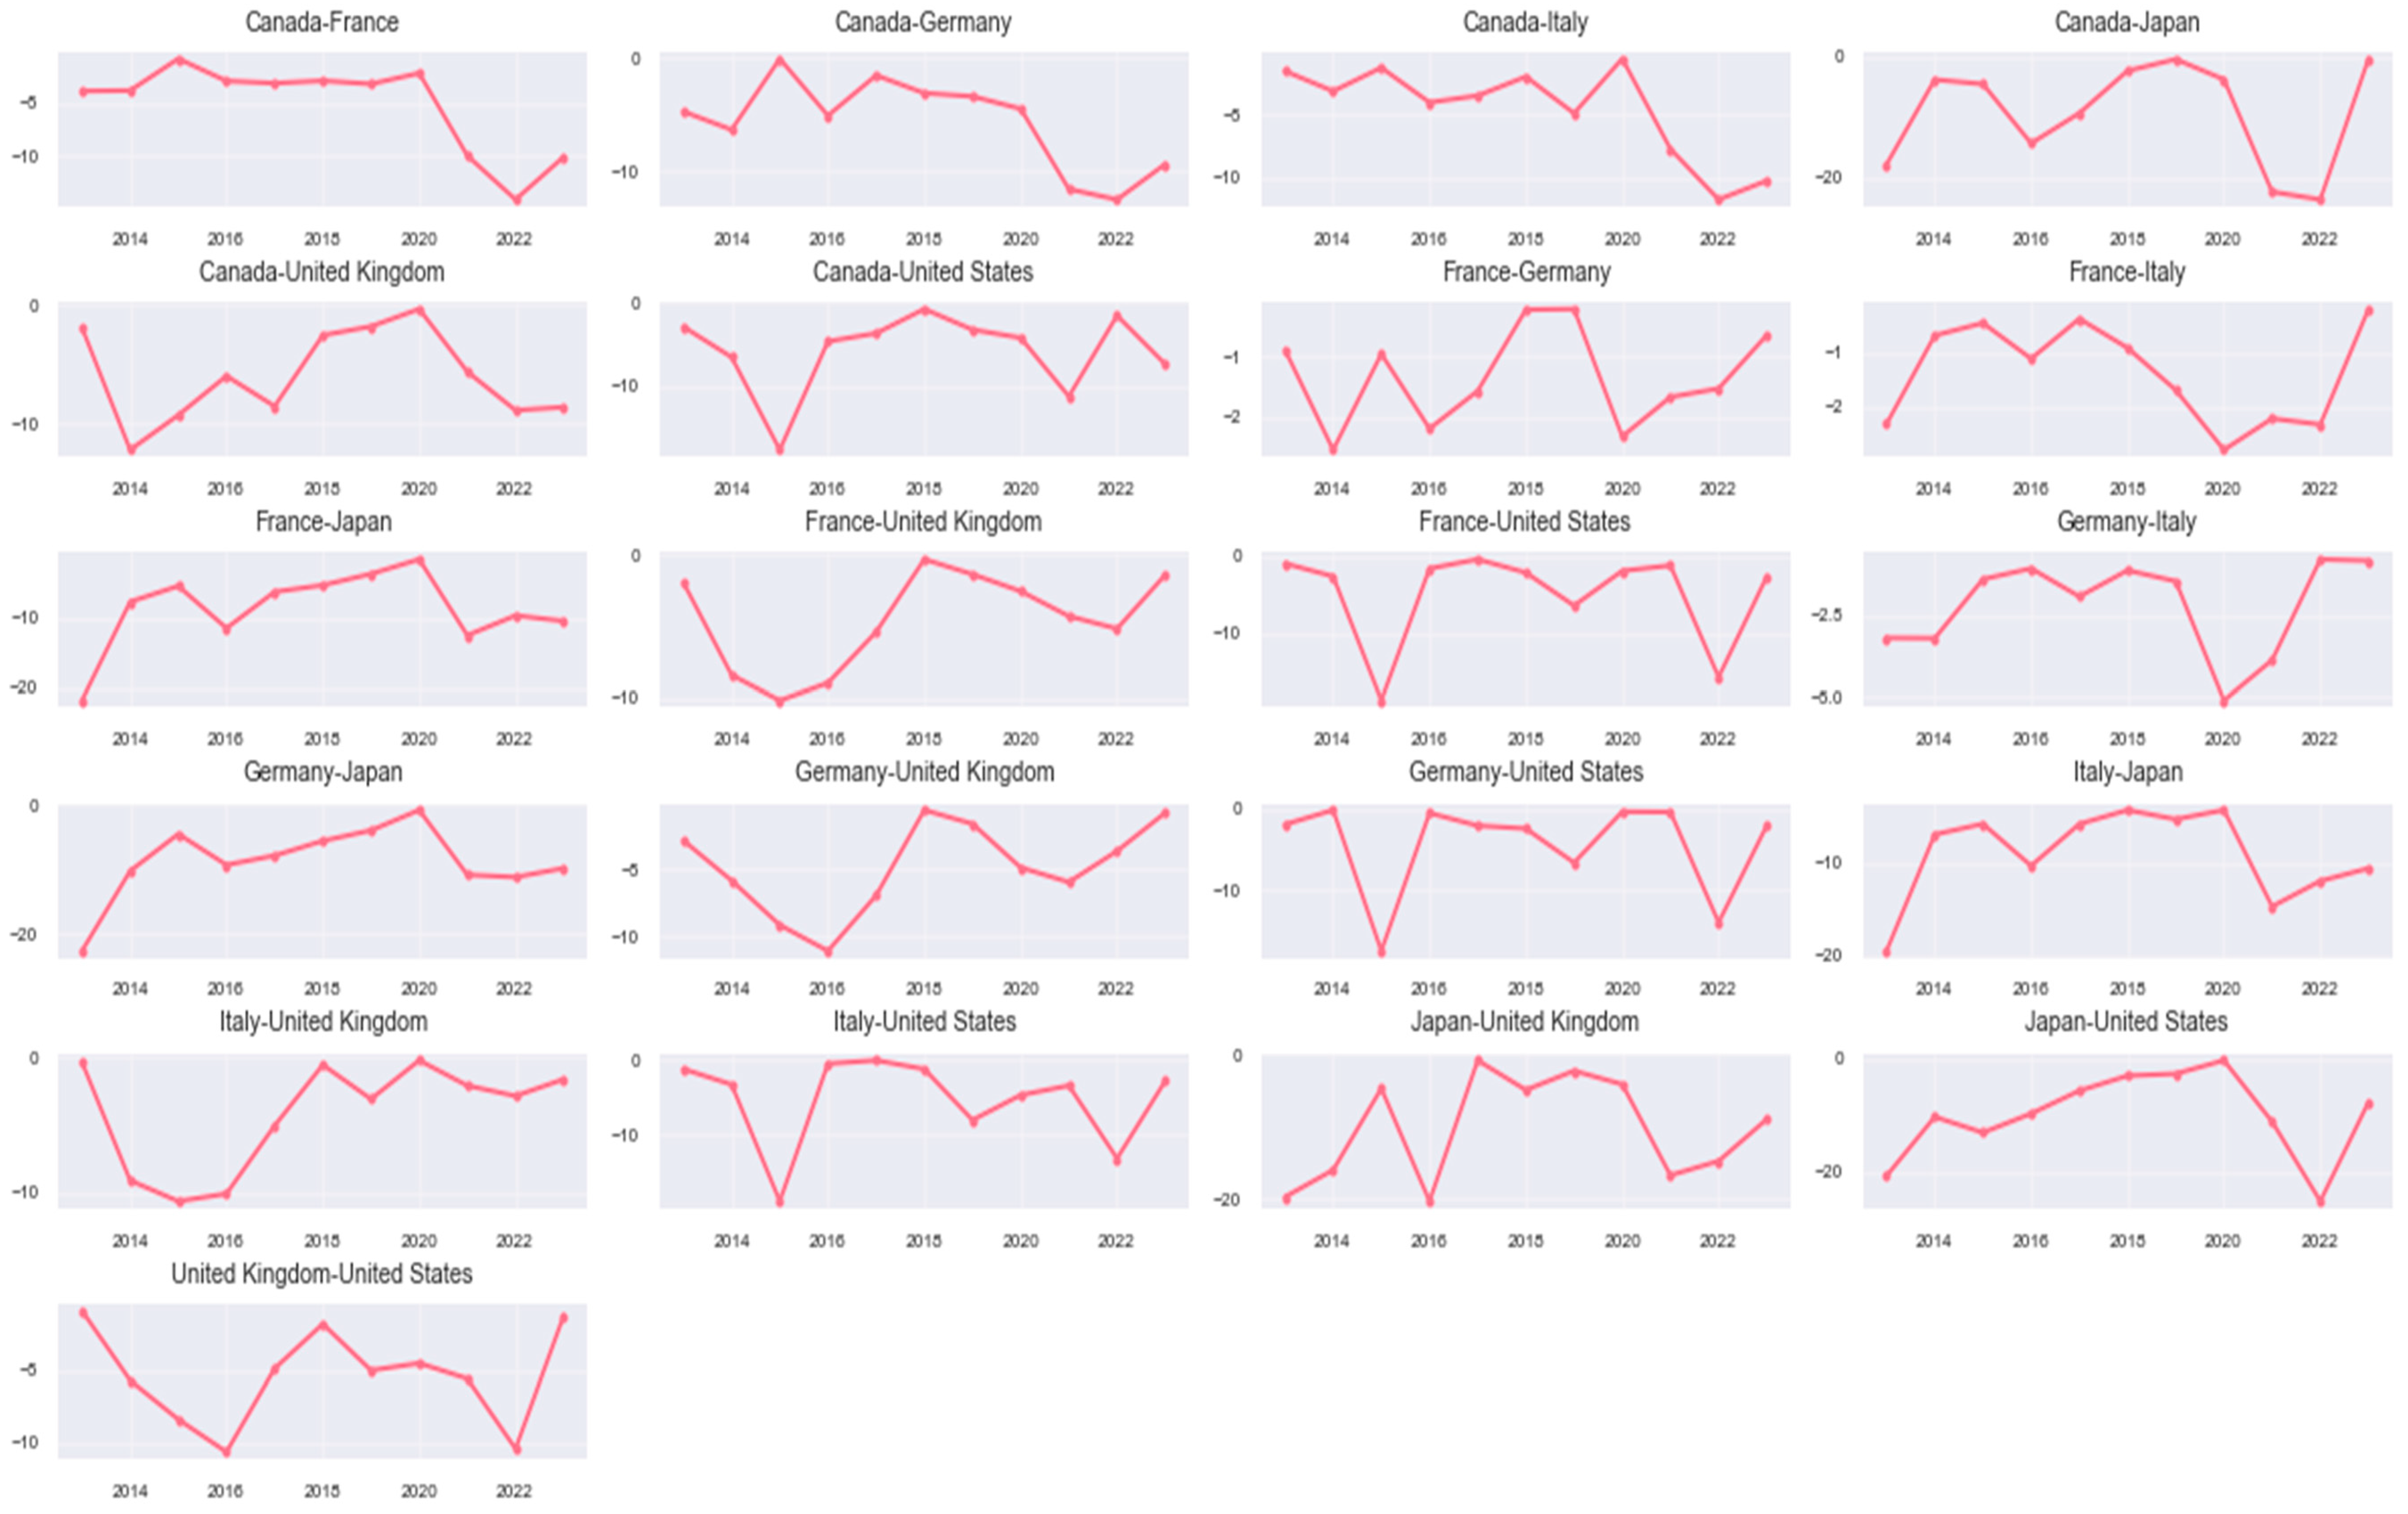
Figure 1 shows significant differences in synchronization among pairs of G7 countries. Additionally, several European pairs such as France–Germany, France–Italy, and Germany–Italy, tend to remain relatively close to zero, while pairs including Japan consistently exhibit the most negative values, indicating that they are the least synchronized in the chart for this country. Canada–USA curve also remains comparatively less negative than most others, indicating a stronger synchronization between these two economies. A noticeable drop is observed across many pairs around 2020–2021, reflecting a clear break in the data consistent with the COVID-19 shock visible in the figure.
Furthermore, some pairs related to the UK exhibit increased divergence following the period of 2016–2020, a pattern consistent with the changes observed in the curves during the post-Brexit period. Overall, the most negative and volatile curves are associated with the least synchronized country pairs, whereas those that maintain a flatter trajectory and that are closer to zero represent the most synchronized relationships in the figure. To confirm these findings,
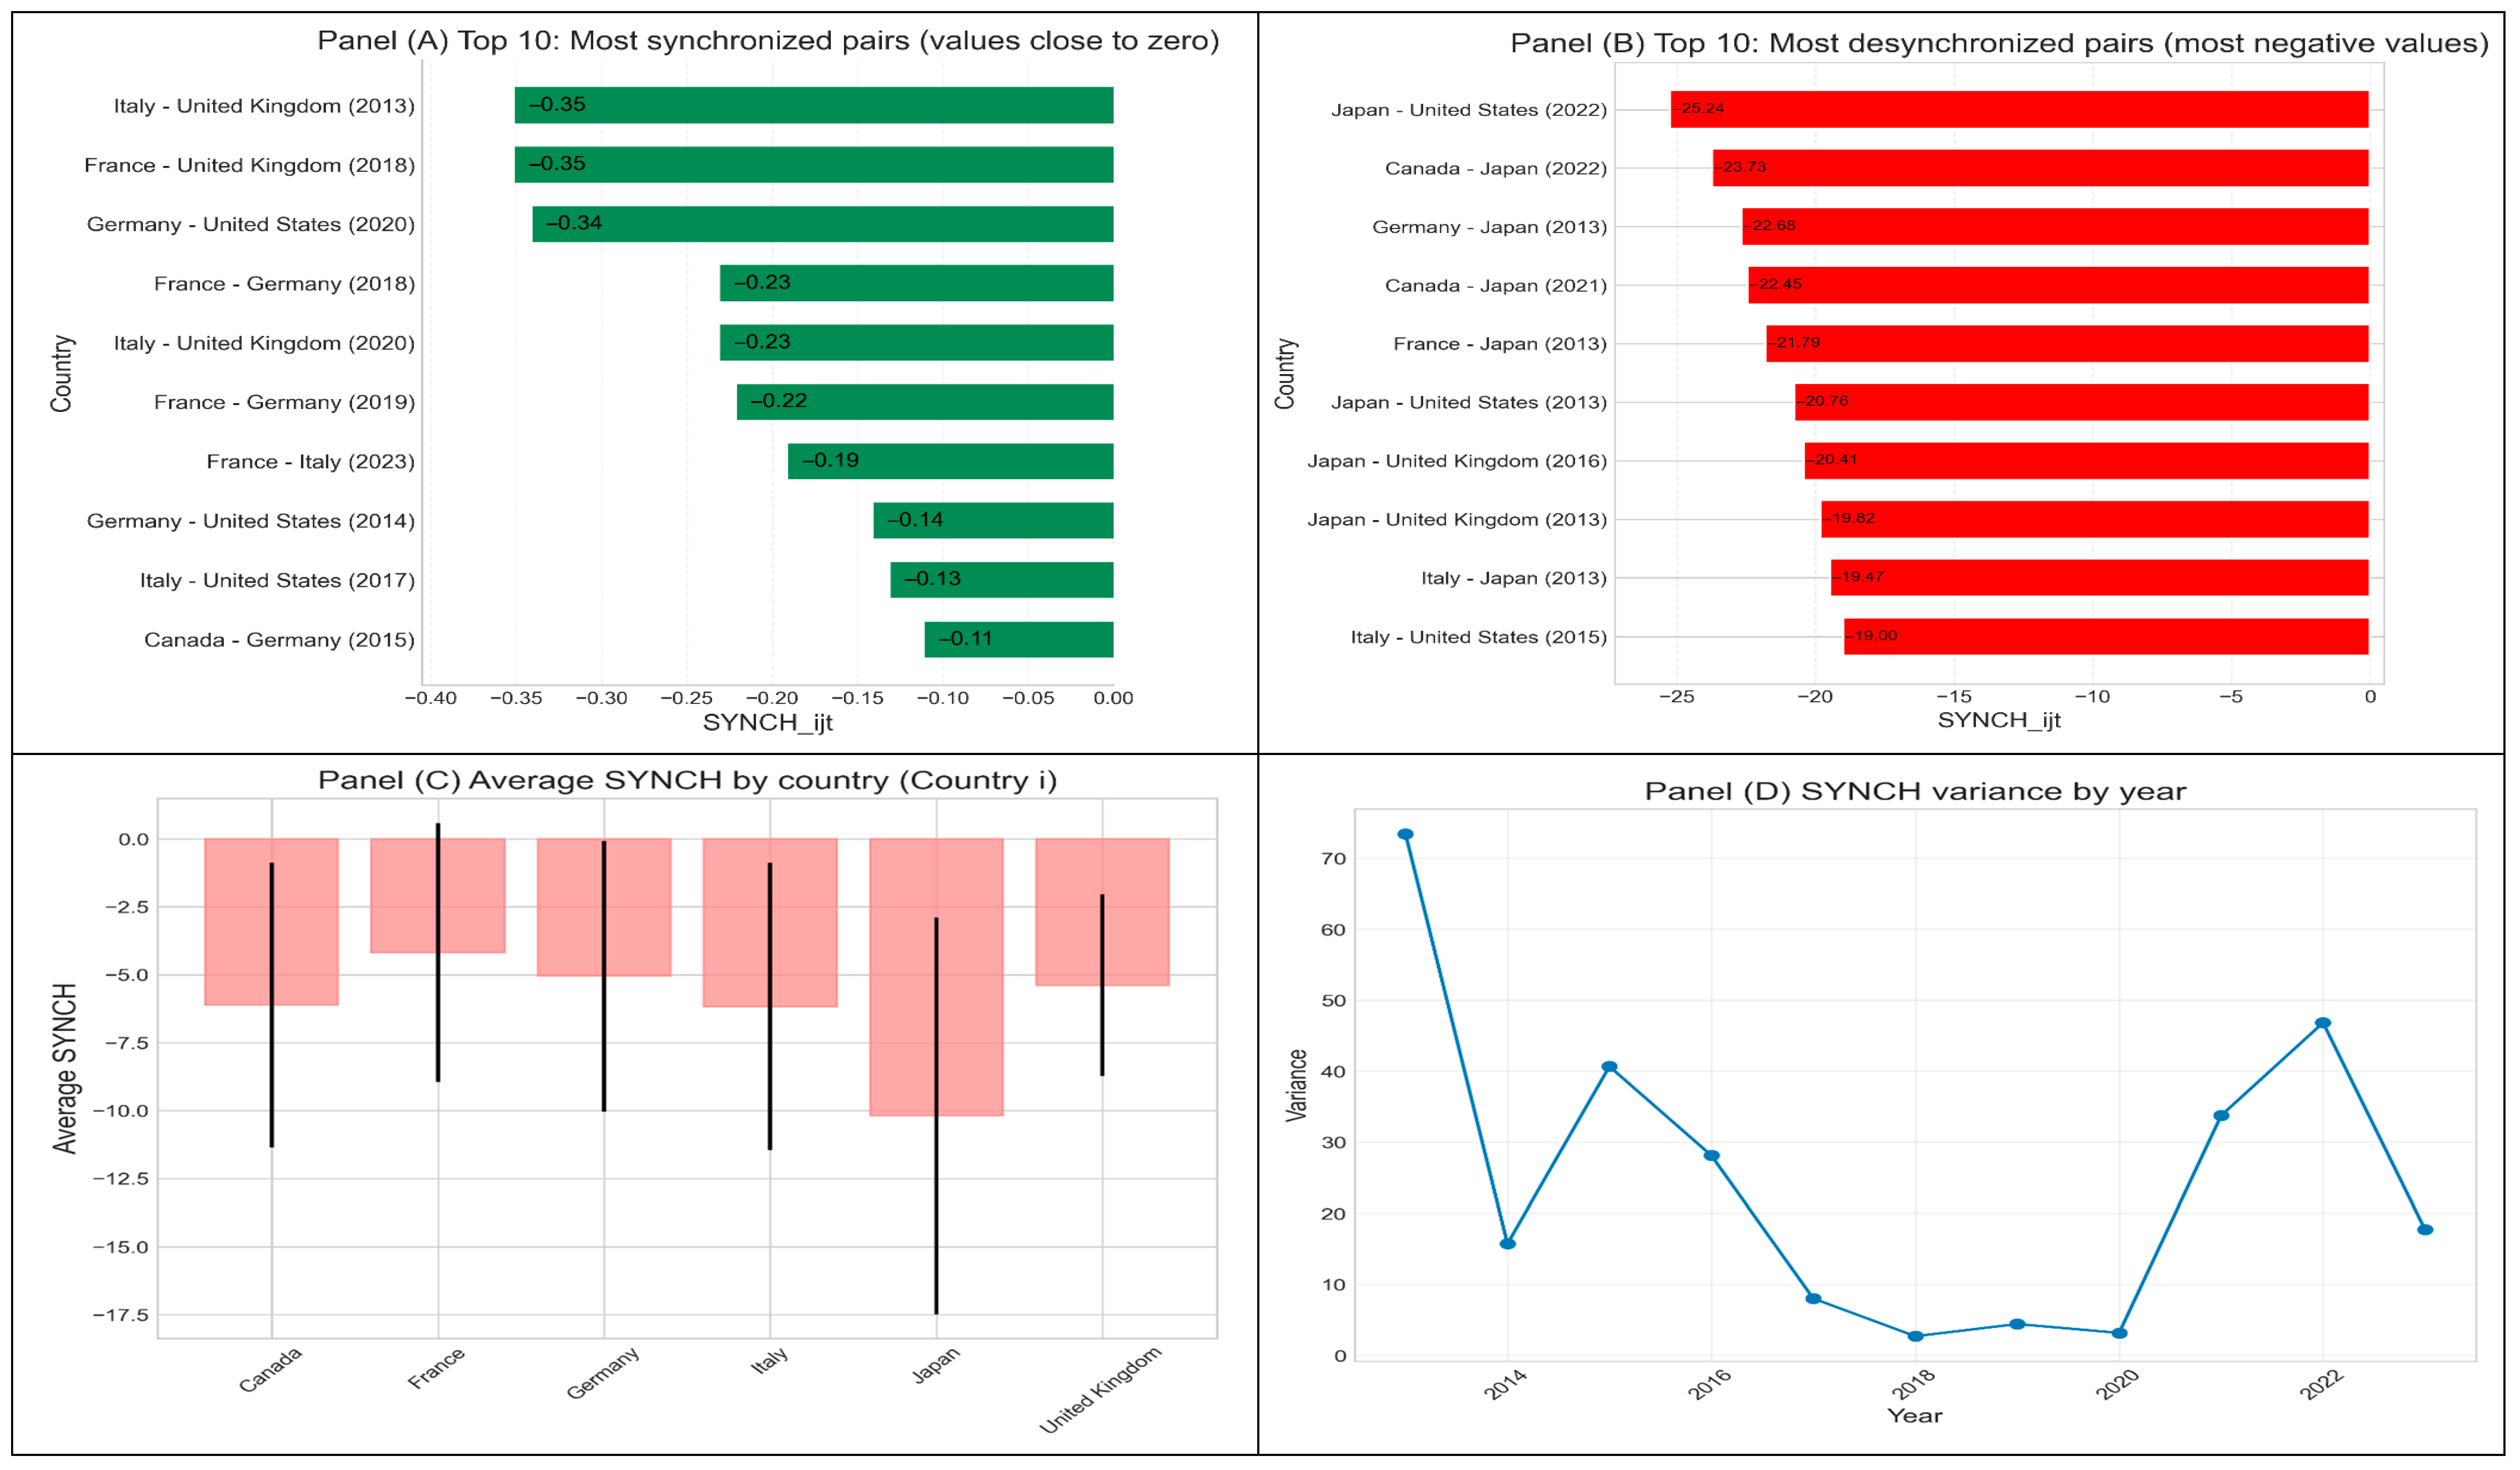
Figure 2A–D examines various forms of synchronization among G7 countries over time.
From
Figure 2, we can illustrate evidence of significant variations in business cycle synchronization among G7 country pairs across the four panels. European pairs, such as France–Germany, France–Italy, and Germany–Italy, exhibit SYNCH values that are relatively close to zero, thereby indicating a higher degree of comovements. Conversely, pairs that include Japan consistently register the most negative values and highlight the episodes of extreme desynchronization. The most synchronized observations are essentially concentrated among European pairs over several years within the sample, while the least synchronized episodes, many of which occurred in 2013, are almost exclusively associated with Japan. The variance plot displays a significant rise during the years 2020–2021, highlighting the distinct trouble produced by the COVID-19 pandemic, which is evidently reflected as a marked drop in synchronization across various pairs. Furthermore, several pairs related to the UK exhibit increased divergence after 2016 and around 2020, a pattern that aligns with the timing of the Brexit referendum and the UK’s official exit from the EU. Overall, the four panels presented in
Figure 2 reveal a stronger synchronization within European countries, persistent desynchronization for Japan, and significant disruptions closely linked to the COVID-19 pandemic and Brexit throughout the period from 2013 to 2023.
3.2. Model Specification
To examine the drivers of business cycle synchronization, we estimate the following linear regression model using a panel of G7 country-pairs:
where:
is the bilateral business cycle comovements between country i and country j in year t
is the bilateral trade intensity between country i and country j at year t.
represents the financial linkages measured by bilateral portfolio investment between country i and country j at year t relatively to their GPD.
is a cross-country political alignment between country i and country j at year t.
3.3. Estimation Strategy and Data Constraints
The empirical analysis is based on a bilateral panel consisting of G7 country pairs, where each cross-sectional unit corresponds to a pair (i, j) observed over a relatively brief time horizon spanning from 2013 to 2023. Two key features of the dataset support the selection of estimators. First, the time dimension is limited, and the effective number of observations is further diminished due to missing values and the requirements to create bilateral variables. Second, several crucial regressors, particularly the political distance variable, remain almost time-invariant within each country pair, whereas trade intensity and portfolio flows change slowly and exhibit significantly more variation across pairs than over time. These characteristics suggest that standard within-transformation estimators have minimal exploitable variation, necessitating a relatively careful distinction between the impacts of cross-sectional and time-series dynamics.
To address these issues, four panel estimators are evaluated: pooled OLS, fixed effects (within), random effects, and the between estimators. The pooled OLS model ignores unobserved heterogeneity; fixed effects rely exclusively on time variation within pairs; random effects combine both dimensions based on a robust orthogonality assumption between regressors and unobserved pair-specific effects; and finally, the between estimator performs a regression of pair-specific averages of synchronization against pair-specific averages of the regressors, thereby focusing on the cross-sectional dimension only.
In addition to these methods, maximum likelihood can also be applied to further address concerns related to small samples. This approach explicitly models the composite error structure and accommodates pair-specific random effects. However, the maximum likelihood specification is designed to capture within and between variation, which does not fully align with our primary objective of identifying long-run cross-sectional relationships. Furthermore, future research could extend this analysis by exploring the maximum likelihood approach more extensively and by examining the robustness of the findings across other regional blocs, such as ASEAN and BRICS, in order to assess the broader generalizability of the results.
In this paper, we have focused our analysis on the application of the between estimator method as we are trying to investigate the significant differences between countries, rather than temporal changes within them. Our objective is to perform a cross-sectional analysis based on the time-averaged data, with particular emphasis on the negative impact of political distance on business cycle synchronization.
4. Empirical Results and Discussion
In this paper, our analysis is conducted by comparing several econometric estimators to evaluate the robustness of the relationship between business cycle synchronization and its determinants within the G7. The model reveals several key relationships with
as the dependent variable, depending on the estimation method applied. The results are summarized in
Table 2.
Initially, pooled OLS estimates suggest that bilateral trade intensity has a significant positive association with business cycle synchronization, along with portfolio investment which exhibits a strong statistically significant positive effect showing the crucial impact of financial linkages on the G7 synchronization. Conversely, political distance is negatively correlated with synchronization. However, by ignoring unobserved country-pair heterogeneity, the pooled OLS model is likely to overstate the accuracy of these estimates, though they offer an initial indication that structural links may be important.
Secondly, we address the unobserved time-invariant heterogeneity by employing fixed effects. According to this specification, all coefficients, except for the constant, are insignificant. This null result can be attributed to the model’s dependence on within-pair variation over time. Given the short time span and the slow-moving, structural nature of the regressors, the fixed-effects estimator does not contain sufficient temporal variation to identify meaningful effects.
Thirdly, regarding the random-effects estimator, which combines both within- and between-pair variation, the results obtained lie between the pooled OLS and fixed-effects estimates. Portfolio investment remains positive and significant determinant of synchronization, whereas the impact of bilateral trade intensity is not significant, and the political distance also is insignificant. The pooled specification fails to account for unobserved heterogeneity across country pairs, while the random-effects model is rejected by the Hausman test (χ2 = 13.384 ***), indicating a correlation between regressors and unit-specific effects. Although the fixed-effects estimator corrects for this issue, it removes the cross-sectional variation that is central to our structural research question. Given that political distance and integration variables exhibit high persistence and vary mainly across country pairs rather than within them, we utilize the between estimator, which directly captures the long-run cross-sectional relationship between average synchronization and the average levels of its determinants.
The between estimates reveal significant economic impacts regarding the main drivers of synchronization in the G7. We identify a large and highly significant impact of bilateral trade intensity on synchronization, as evidenced by the estimated coefficient which is equal to 28.57 with a p-value less than 1%. This suggests that a 1% increase in average trade intensity raises the synchronization index by approximately 0.285 points. Consequently, country pairs with stronger long-run trade integration exhibit significantly higher cyclical alignment, confirming the structural importance of real economic linkages. Additionally, portfolio investment also has a positive and statistically significant coefficient of 8.21, with a p-value less than 5%, indicating that greater financial integration fosters sustained macroeconomic comovements. Conversely, political distance exhibits a negative and significant impact on synchronization, as the estimated coefficient is equal to −1.84 with a p-value less than 10%, implying that a one unit increase in political divergence reduces long-run synchronization by 1.84 units. Therefore, the findings suggest that country pairs characterized by persistent ideological or institutional divergence display structurally lower cyclical comovements. Overall, the results confirm that synchronization differences are driven by standard economic channels and political distance, supporting the significant role of the between estimator in our analysis.
In conclusion, it is evident to show that the between estimator approach appears as the most revealing specification, offering a thorough explanation of how long-run structural factors, specifically bilateral trade intensity, financial integration, and political proximity, can serve as crucial determinants of business cycle synchronization among G7 economies.
Our findings are in line with a large body of previous empirical research which highlighted the positive significant role of trade integration in fostering business cycle synchronization across countries, especially for developed countries and countries belonging to a common group. Authors like
H. H. Lee et al. (
2024),
Kang (
2025),
Berge (
2012), and
Frankel and Rose (
1998) concluded that bilateral trade intensity constitutes one of the most robust and consistent determinants of cross-country comovements. Several other authors show that deeper commercial ties enhance the transmission of demand, supply, and productivity shocks, thereby amplifying cyclical convergence. For instance,
Misztal (
2016) identifies international trade as the principal factor explaining the convergence of cycles among NAFTA economies, underscoring the dominant role of trade in highly integrated regional blocks. Additionally,
Misztal (
2013) highlights that not only the intensity but also the structure and composition of trade flows are considered significant drivers for explaining synchronization within the European Union and the Euro Area.
While trade integration emerges as the primary driver of synchronization, the effects of financial integration play a consistent and more nuanced role for explaining synchronization. Many studies such as those by
Imbs (
2004,
2006) found that financial integration enhances output and consumption comovement among advanced economies.
H. H. Lee et al. (
2024) noted that short-term debt market integration may synchronize cycles through balance-sheet transmission channels and credit market spillovers. Conversely,
Heathcote and Perri (
2004) argue that greater financial integration may arise precisely when real shocks become less correlated, thereby enabling countries to diversify risk and potentially reducing synchronization.
Overall, there is evidence that trade integration exerts a strong, positive, and systematic influence on business cycle synchronization, while financial integration remains a secondary and more complex driver, with effects that depend on market structure, the nature of financial flows, and the characteristics of the economies involved. This contrast underscores the need to distinguish between real and financial channels of international interdependence when assessing the determinants of cyclical comovements.
5. Robustness Analysis
In this section, we perform robustness analysis to ensure the robustness of the findings. Testing results based on different measures of synchronization and repeating the research on the same model can serve as a robustness check to validate the results obtained and confirm the significant impact of political distance on synchronization.
In this section, we extend our analysis by considering an alternative measure of synchronization and the core explanatory variables. We replace the dependent variable
in variable (4) by the temporal correlation variable as proposed by
Cerqueira and Martins (
2009). According to these Authors, temporal correlations between each pair of countries i and j are measured as follows:
where
and
are the GDP growth rate components of countries i and j.
We use the between estimation method which, indicated previously, is the approach that is well-suited to our context. The results are presented in
Table 3. From this table, the results demonstrate the consistency and the significance of our findings. They also indicate that the measure of synchronization based on bilateral trade intensity is the primary driver of business cycle synchronization. Political distance negatively and significantly affects business cycle synchronization. But, in this model financial linkages are not significant. In fact, the impact of this financial driver is not stable among previous studies; it can be positive, negative or insignificant. Additionally, results highlight that the between estimation method is the best method of estimation. Compared to pooled OLS, fixed and random effects models, and based on the AIC criteria, we confirm the study’s findings drawn from the analysis.
In conclusion, according to the analysis conducted, we confirm the robustness of the central findings of this paper. The role of political proximity, combined with bilateral trade intensity and financial integration in enhancement of business cycle synchronization.
6. Conclusions
This paper provides a comprehensive and insightful investigation into the drivers of business cycle synchronization among advanced economies. Our study aims to provide a thorough analysis of the main factors affecting cross-country pairs’ business cycle synchronization, contributing to the existing literature by rigorously integrating the impact of political distance. Greater political divergence leads to lower synchronization between countries. To achieve this objective, we apply the methodology of
Frankel and Rose (
1998), with a little modification in the basic model by introducing the variable political distance, to analyze the main drivers of business cycle synchronization in the G7 countries. Our findings reveal that political proximity can be designed as a significant driver to the analysis of business cycle synchronization and show that political
distance impedes long-run comovement. Additionally, policymakers must treat politically aligned countries versus politically distant countries differently, even if they have similar trade volumes. The negative and significant effect of political distance can be tested and verified in other block countries to generalize results. This can be explored in future research by testing the impact of political distance on the synchronization of emerging countries and European Union countries. In addition, we acknowledge that future research may investigate whether political distance interacts with GVCs-based integration measures, which could potentially amplify or mitigate synchronization through supply-chain channels.
In line with the limitations highlighted by
Hill et al. (
2020) regarding small sample size, which may reduce statistical power and increase the risk of unstable estimates, the results should be interpreted with caution. Furthermore, exploring additional transmission channels and alternative identification strategies presents opportunities for future research. Finally, regarding the measurement of synchronization, the annual GDP growth differences can capture idiosyncratic shocks like COVID-19. Therefore, future studies may concentrate on employing cyclical comovement to examine synchronization. The Hodrick–Prescott or King Baxter filters can be utilized to extract cyclical components across rolling windows.