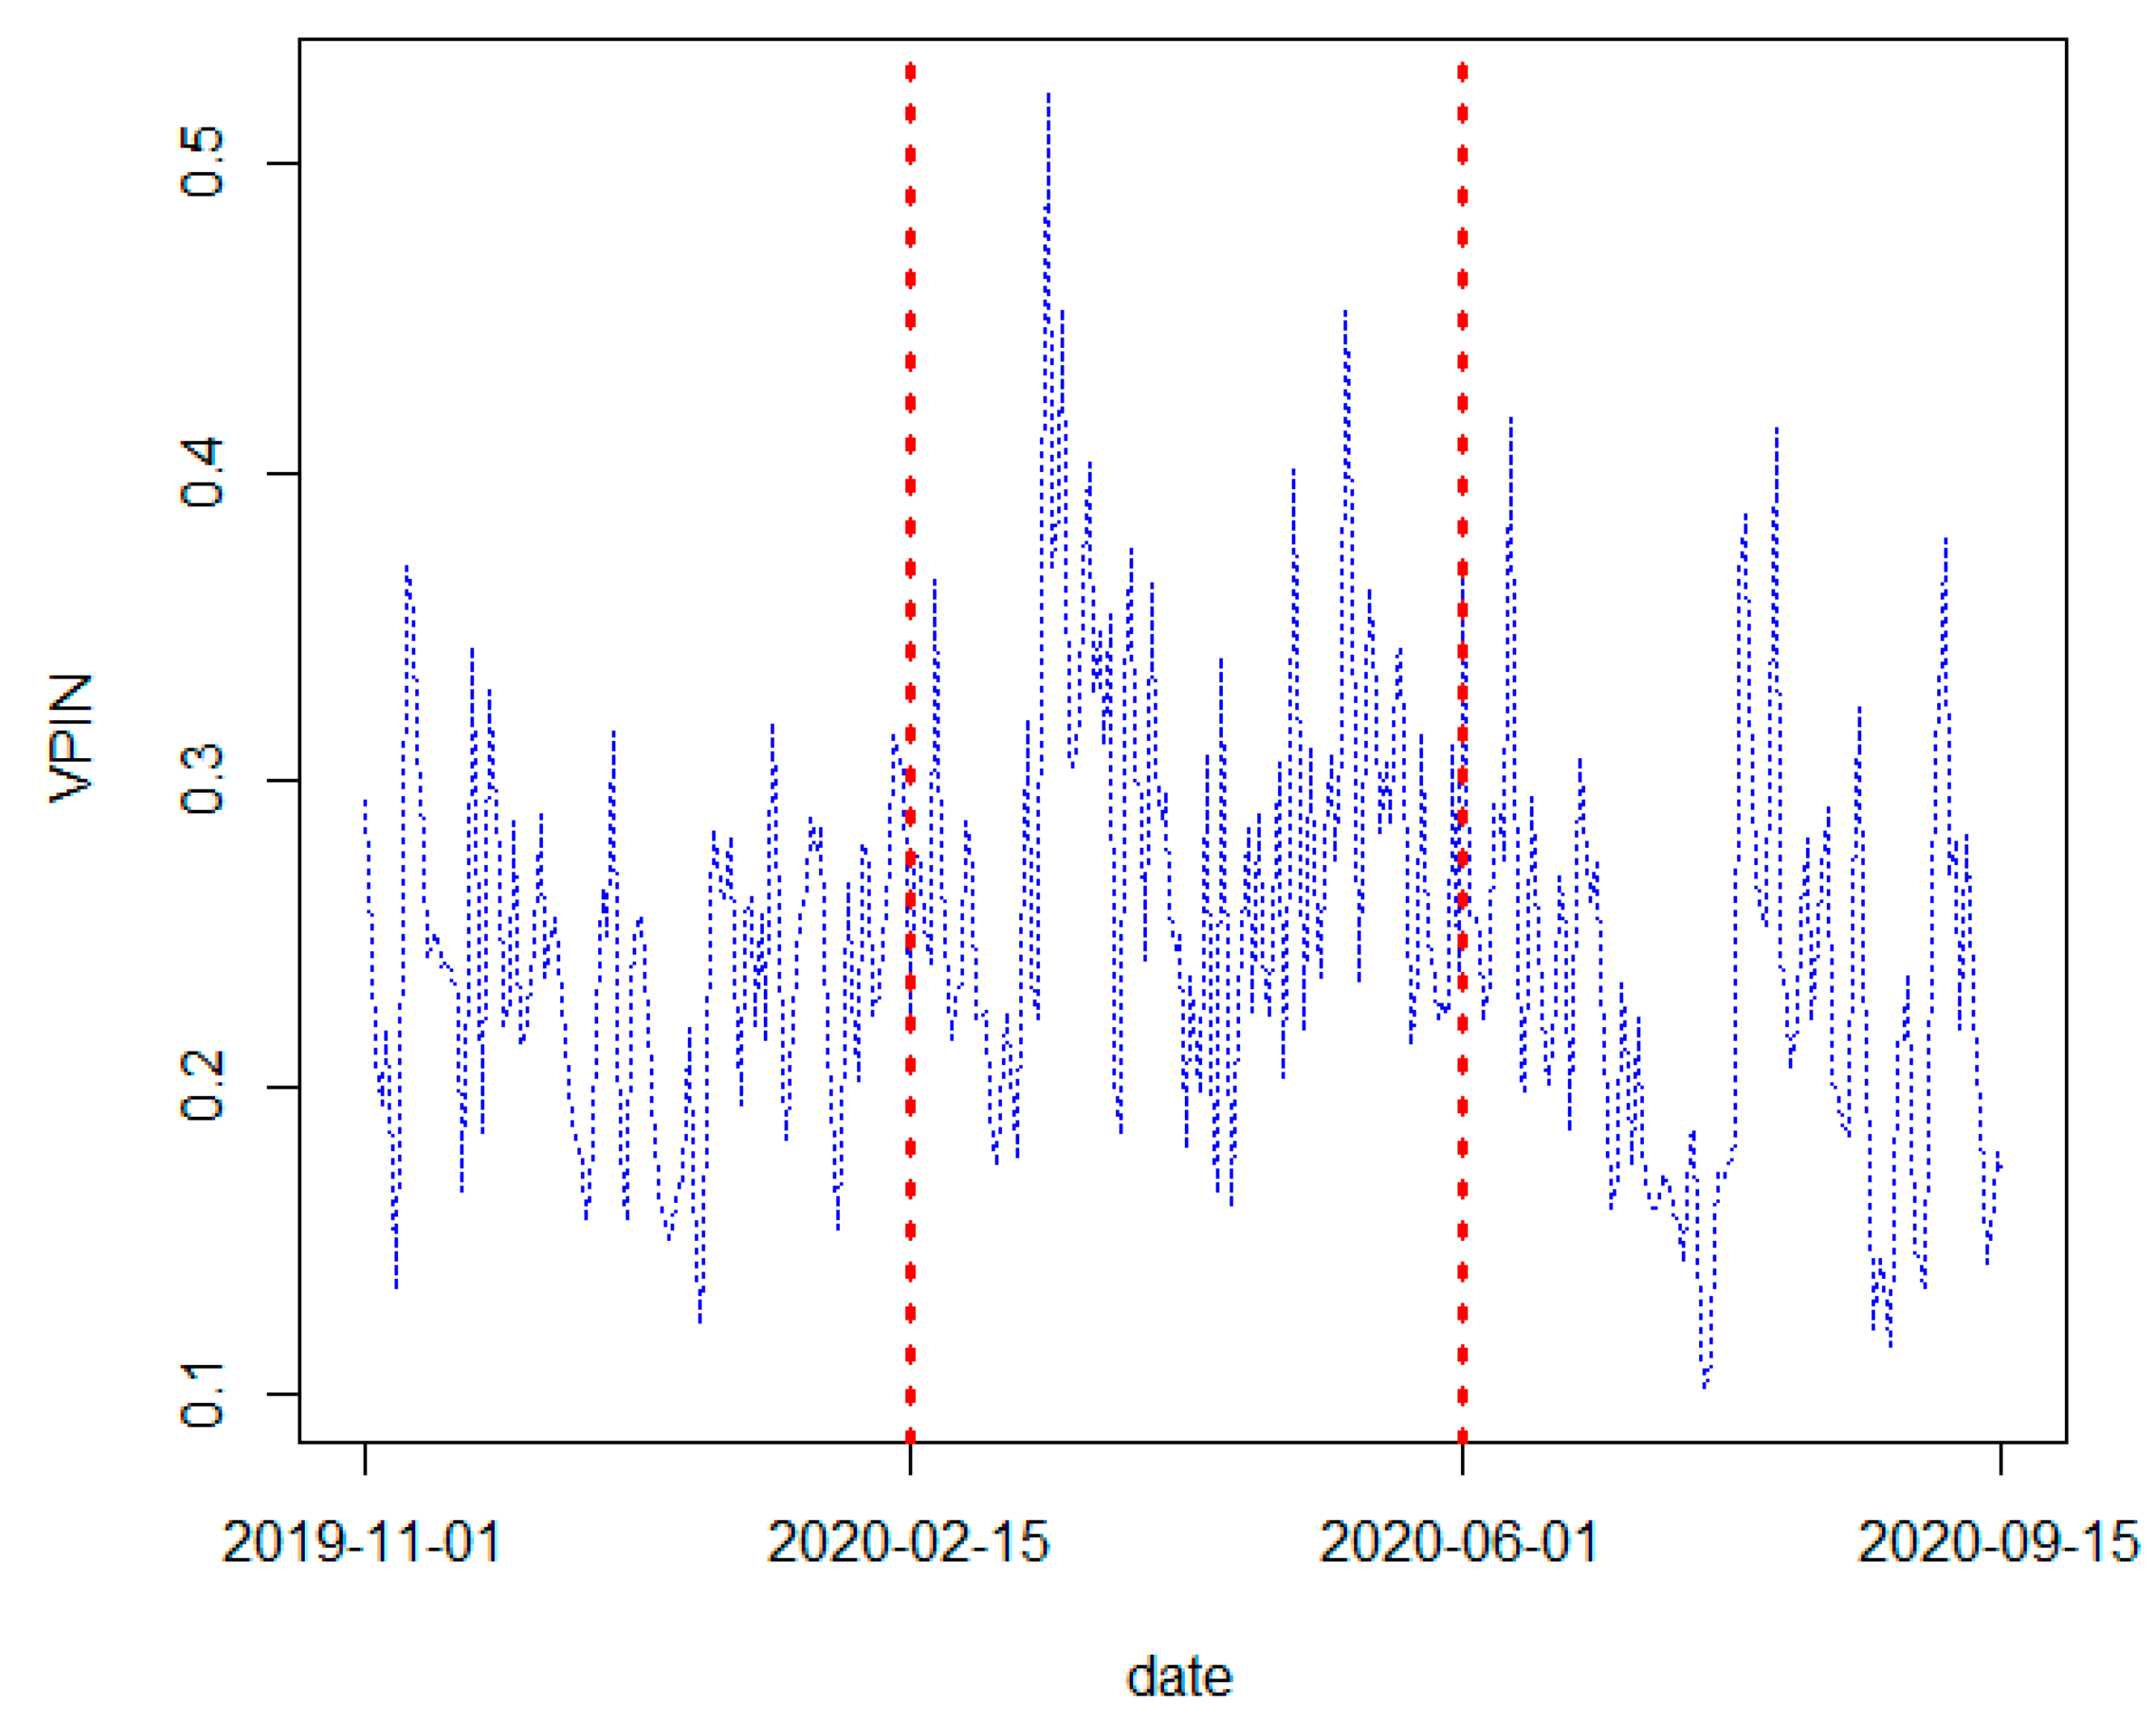
Informed Trading Through the COVID-19 Pandemic: Evidence from the Bitcoin Market



Abstract
1. Introduction
2. Data, Variables and Methodology
3. Findings
4. Conclusions
Author Contributions
Funding
Institutional Review Board Statement
Informed Consent Statement
Data Availability Statement
Acknowledgments
Conflicts of Interest
Appendix A

| Intervals, Dates | Description | Explanation |
|---|---|---|
| 1 November 2019–15 September 2020 | Full sample window | Overall observation period used for VPIN estimation and regressions. |
| 1 November 2019–14 February 2020 | Pre-COVID subsample | Benchmark period before the COVID-19 shock period defined in the study. |
| 15 February 2020–31 May 2020 | COVID-19 stage I subsample | Initial COVID-19 phase intended to capture the period of high uncertainty and strict government measures. |
| 1 June 2020–15 September 2020 | COVID-19 stage II subsample | Later COVID-19 phase intended to capture reduced uncertainty and the easing of restrictions relative to stage I. |
| 15 February 2020 | Cutoff: start of stage I | Chosen because it coincides with the first reported COVID-19 death outside Asia (France), signaling broader international spread. |
| 1 June 2020 | Cutoff: start of stage II | Used to mark the beginning of widespread easing of lockdown restrictions and a shift toward lighter restrictions in many countries. |
| 11 March 2020 | Alternative cutoff: start of stage I | WHO characterized COVID-19 as a pandemic on this date. |
| 11 May 2020 | Alternative cutoff: start of stage II | Date associated with the first easing actions of lockdown restrictions in Europe (France). |
| 16 September 2019–31 December 2019 | Alternative window: pre-COVID subsample | Used to avoid potential early COVID-related effects already present in early-2020 data. |
| 1 | Thus, informed trading is not only about access to superior information; it can also arise from investors’ superior ability to process information, faster access to the market, or superior trading skills, each of which can generate informational asymmetry among investors (see, e.g., Ahn et al., 2008, for a careful definition). |
| 2 | See, e.g., J. Goodell and Goutte (2021) for a recent review of the research on how cryptocurrencies have been affected by the COVID-19 pandemic. |
| 3 | |
| 4 | Market microstructure commonly distinguishes between informed traders and liquidity (or “noise”) traders. Informed traders trade because they believe they have an advantage about value—through private information, superior information-processing, faster reaction, or better execution, whereas liquidity traders trade mainly for non-informational reasons such as rebalancing, hedging, meeting cash needs, or implementing longer-horizon portfolio decisions (Kyle, 1985). These motives interact: liquidity trading creates a steady background of order flow, and informed traders can trade within that flow (often gradually) so their information-based orders are less identifiable (e.g., Kyle, 1985). Because liquidity suppliers (e.g., market makers/passive limit-order traders) cannot perfectly observe who is informed, they face adverse-selection risk: trading at unfavorable prices against better-informed counterparties. Classic models show that this risk is reflected in wider bid–ask spreads and/or reduced displayed depth, and that transaction prices adjust as trades reveal information (e.g., Glosten & Milgrom, 1985; Easley & O’Hara, 1987). More broadly, market microstructure views these mechanisms such as quote revisions, spread/depth choices, and price impact as the way markets translate heterogeneous trading goals into observed prices, volumes, and trading costs (Madhavan, 2000). |
| 5 | https://blog.kaiko.com/tether-vs-usd-is-a-dollar-a-dollar-when-it-comes-to-trading-4632380f4284 (accessed on 1 September 2020). Bitstamp data is commonly used in the literature (X. Li et al., 2020; Wang et al., 2020). |
| 6 | The side of trade initiation information is already available in the data urging no need for the use of trade-initiation-identifying algorithms such as the algorithm of Lee and Ready (1991). |
| 7 | See studies such as Takahashi and Yamada (2021) and Erdem (2020) for findings and discussion on the lack of significant COVID-19 impacts prior to mid-February. |
| 8 | Note that the resulting COVID-19 subsamples have unequal lengths. |
| 9 | |
| 10 | http://www.ourworldindata.org/covid-deaths (accessed on 1 September 2020). |
| 11 | For example, Duarte and Young (2009) argue for the liquidity shock component in the PIN model of Easley et al. (1996). |
| 12 | Multivariate regression analysis that controls for the effects of trading volume and price volatility provides identical results, i.e., positive and significant (insignificant) coefficient for stage I (II) dummy variable. The results are not reported for the sake of brevity. |
| 13 | The measure is firmly grounded in the literature measuring the within-day price variation using high-frequency data (Andersen et al., 2003). At the same time, using very high sampling frequencies (e.g., tick-by-tick) can make realized variance sensitive to market microstructure noise, motivating the use of coarser sampling such as 5 min intervals (Hansen & Lunde, 2006). Consistent with this practice, Liu et al. (2015) provide large-scale evidence across many assets and many realized measures that 5 min realized variance is a strong benchmark and is rarely outperformed, supporting its use as a robust volatility control. In our checks, the 5 min realized volatility exhibits materially lower collinearity with the pandemic growth variables (corr ≈ 0.25). Alternatively, we also obtain a daily volatility variable from a standard GARCH(1,1) model (Engle, 1982; Bollerslev, 1986), but in our COVID-stage sample it is highly correlated with the pandemic growth variables (corr ≈ 0.85). A plausible reason is that GARCH volatility is designed to capture persistent volatility clustering, and during the pandemic this volatility regime co-moves tightly with the evolution of pandemic news and uncertainty; in a short crisis window, that leaves limited independent variation to separately identify “pandemic growth” effects once conditional volatility is included. In linear regressions, multicollinearity can inflate variances and destabilize inference (O’Brien, 2007). For this reason, we do not rely on the GARCH-based volatility control in our robustness set and instead use an intraday realized volatility proxy constructed from 5 min returns. |
| 14 | There are seven dates associated with holidays in our sample: 17 February 2020 (NYSE—Washington’s Birthday/Presidents’ Day), 10 April 2020 (NYSE & Euronext—Good Friday), 13 April 2020 (Euronext—Easter Monday), 1 May 2020 (Euronext—Labor Day), 25 May 2020 (NYSE—Memorial Day), 3 July 2020 (NYSE—Independence Day), and 7 September 2020 (NYSE—Labor Day). |
References
- Abad, D., & Yagüe, J. (2012). From PIN to VPIN: An introduction to order flow toxicity. Spanish Review of Financial Economics, 10(2), 74–83. [Google Scholar] [CrossRef]
- Ahn, H. J., Kang, J., & Ryu, D. (2008). Informed trading in the index option market: The case of KOSPI 200 options. Journal of Futures Markets: Futures, Options, and Other Derivative Products, 28(12), 1118–1146. [Google Scholar] [CrossRef]
- Andersen, T. G., Bollerslev, T., Diebold, F. X., & Labys, P. (2003). Modeling and forecasting realized volatility. Econometrica, 71(2), 579–625. [Google Scholar] [CrossRef]
- Andersen, T. G., & Bondarenko, O. (2014). VPIN and the flash crash. Journal of Financial Markets, 17, 1–46. [Google Scholar] [CrossRef]
- Ardia, D., Bluteau, K., & Rüede, M. (2019). Regime changes in Bitcoin GARCH volatility dynamics. Finance Research Letters, 29, 266–271. [Google Scholar] [CrossRef]
- Arı, Y. (2020). COGARCH models: An explicit solution to the stochastic differential equation for variance. In Emerging applications of differential equations and game theory (pp. 79–97). IGI Global. [Google Scholar]
- Assaf, A., Demir, E., & Ersan, O. (2025). What drives the return and volatility spillover between DeFis and cryptocurrencies? International Journal of Finance & Economics, 30(2), 1302–1318. [Google Scholar]
- Aysan, A. F., Demir, E., Gozgor, G., & Lau, C. K. M. (2019). Effects of the geopolitical risks on Bitcoin returns and volatility. Research in International Business and Finance, 47, 511–518. [Google Scholar] [CrossRef]
- Bollerslev, T. (1986). Generalized autoregressive conditional heteroskedasticity. Journal of Econometrics, 31(3), 307–327. [Google Scholar] [CrossRef]
- Bouri, E., Molnár, P., Azzi, G., Roubaud, D., & Hagfors, L. I. (2017). On the hedge and safe haven properties of Bitcoin: Is it really more than a diversifier? Finance Research Letters, 20, 192–198. [Google Scholar] [CrossRef]
- Conlon, T., Corbet, S., & McGee, R. J. (2020). Are cryptocurrencies a safe haven for equity markets? An international perspective from the COVID-19 pandemic. Research in International Business and Finance, 54, 101248. [Google Scholar] [CrossRef] [PubMed]
- Coskun, E. A., Lau, C. K. M., & Kahyaoglu, H. (2020). Uncertainty and herding behavior: Evidence from cryptocurrencies. Research in International Business and Finance, 54, 101284. [Google Scholar] [CrossRef]
- Demir, E., Bilgin, M. H., Karabulut, G., & Doker, A. C. (2020). The relationship between cryptocurrencies and COVID-19 pandemic. Eurasian Economic Review, 10(3), 349–360. [Google Scholar] [CrossRef]
- Demir, E., Gozgor, G., Lau, C. K. M., & Vigne, S. A. (2018). Does economic policy uncertainty predict the Bitcoin returns? An empirical investigation. Finance Research Letters, 26, 145–149. [Google Scholar] [CrossRef]
- Dimpfl, T., & Peter, F. J. (2021). Nothing but noise? Price discovery across cryptocurrency exchanges. Journal of Financial Markets, 54, 100584. [Google Scholar] [CrossRef]
- Ding, W., Levine, R., Lin, C., & Xie, W. (2021). Corporate immunity to the COVID-19 pandemic. Journal of Financial Economics, 141(2), 802–830. [Google Scholar] [CrossRef]
- Duarte, J., & Young, L. (2009). Why is PIN priced? Journal of Financial Economics, 91(2), 119–138. [Google Scholar] [CrossRef]
- Dyhrberg, A. H. (2016). Bitcoin, gold and the dollar—A GARCH volatility analysis. Finance Research Letters, 16, 85–92. [Google Scholar] [CrossRef]
- Easley, D., Engle, R. F., O’hara, M., & Wu, L. (2008). Time-varying arrival rates of informed and uninformed trades. Journal of Financial Econometrics, 6(2), 171–207. [Google Scholar] [CrossRef]
- Easley, D., Kiefer, N. M., O’Hara, M., & Paperman, J. B. (1996). Liquidity, information, and infrequently traded stocks. The Journal of Finance, 51(4), 1405–1436. [Google Scholar] [CrossRef]
- Easley, D., López de Prado, M. M., & O’Hara, M. (2012). Flow toxicity and liquidity in a high-frequency world. Review of Financial Studies, 25(5), 1457–1493. [Google Scholar] [CrossRef]
- Easley, D., López de Prado, M. M., & O’Hara, M. (2014). VPIN and the flash crash: A rejoinder. Journal of Financial Markets, 17, 47–52. [Google Scholar] [CrossRef]
- Easley, D., & O’Hara, M. (1987). Price, trade size, and information in securities markets. Journal of Financial Economics, 19(1), 69–90. [Google Scholar] [CrossRef]
- Easley, D., O’Hara, M., Yang, S., & Zhang, Z. (2024). Microstructure and market dynamics in crypto markets. SSRN Electronic Journal. [Google Scholar] [CrossRef]
- Engle, R. F. (1982). Autoregressive conditional heteroscedasticity with estimates of the variance of United Kingdom inflation. Econometrica, 50(4), 987–1007. [Google Scholar] [CrossRef]
- Erdem, O. (2020). Freedom and stock market performance during COVID-19 outbreak. Finance Research Letters, 36, 101671. [Google Scholar] [CrossRef] [PubMed]
- Ersan, O., & Ekinci, C. (2016). Algorithmic and high-frequency trading in Borsa Istanbul. Borsa Istanbul Review, 16(4), 233–248. [Google Scholar] [CrossRef]
- Fang, L., Bouri, E., Gupta, R., & Roubaud, D. (2019). Does global economic uncertainty matter for the volatility and hedging effectiveness of Bitcoin? International Review of Financial Analysis, 61, 29–36. [Google Scholar] [CrossRef]
- Feng, W., Wang, Y., & Zhang, Z. (2018). Informed trading in the Bitcoin market. Finance Research Letters, 26, 63–70. [Google Scholar] [CrossRef]
- Gao, M., & Huang, J. (2016). Capitalizing on capitol hill: Informed trading by hedge fund managers. Journal of Financial Economics, 121(3), 521–545. [Google Scholar] [CrossRef]
- Glosten, L. R., & Milgrom, P. R. (1985). Bid, ask and transaction prices in a specialist market with heterogeneously informed traders. Journal of Financial Economics, 14(1), 71–100. [Google Scholar] [CrossRef]
- Goodell, J., & Goutte, S. (2021). Cryptocurrencies and COVID-19: What have we learned? ⟨halshs-03211702⟩. Available online: https://shs.hal.science/halshs-03211702v1/document (accessed on 1 September 2020).
- Goodell, J. W., & Goutte, S. (2021). Co-movement of COVID-19 and Bitcoin: Evidence from wavelet coherence analysis. Finance Research Letters, 38, 101625. [Google Scholar] [CrossRef]
- Hansen, P. R., & Lunde, A. (2006). Realized variance and market microstructure noise. Journal of Business & Economic Statistics, 24(2), 127–161. [Google Scholar] [CrossRef]
- Harris, L. (2003). Trading and exchanges: Market microstructure for practitioners. OUP USA. [Google Scholar]
- Heflin, F., & Shaw, K. W. (2000). Blockholder ownership and market liquidity. The Journal of Financial and Quantitative Analysis, 35(4), 621. [Google Scholar] [CrossRef]
- Ibrahim, I., Kamaludin, K., & Sundarasen, S. (2020). COVID-19, government response, and market volatility: Evidence from the Asia-Pacific developed and developing markets. Economies, 8(4), 105. [Google Scholar] [CrossRef]
- Kang, J., Kwon, K. Y., & Kim, W. (2020). Flow toxicity of high-frequency trading and its impact on price volatility: Evidence from the KOSPI 200 futures market. Journal of Futures Markets, 40(2), 164–191. [Google Scholar] [CrossRef]
- Katsiampa, P. (2019). An empirical investigation of volatility dynamics in the cryptocurrency market. Research in International Business and Finance, 50, 322–335. [Google Scholar] [CrossRef]
- Kirilenko, A., Kyle, A. S., Samadi, M., & Tuzun, T. (2017). The flash crash: High-frequency trading in an electronic market. Journal of Finance, 72(3), 967–998. [Google Scholar] [CrossRef]
- Kitvanitphasu, A., Kyaw, K., Likitapiwat, T., & Treepongkaruna, S. (2025). Bitcoin wild moves: Evidence from order flow toxicity and price jumps. Research in International Business and Finance, 81, 103163. [Google Scholar] [CrossRef]
- Kraaijeveld, O., & De Smedt, J. (2020). The predictive power of public Twitter sentiment for forecasting cryptocurrency prices. Journal of International Financial Markets, Institutions and Money, 65, 101188. [Google Scholar] [CrossRef]
- Kumar, A. (2009). Hard-to-value stocks, behavioral biases, and informed trading. Journal of Financial and Quantitative Analysis, 44(6), 1375–1401. [Google Scholar] [CrossRef]
- Kyle, A. S. (1985). Continuous auctions and insider trading. Econometrica, 53(6), 1315–1335. [Google Scholar] [CrossRef]
- Landier, A., & Thesmar, D. (2020). Earnings expectations during the COVID-19 crisis. The Review of Asset Pricing Studies, 10(4), 598–617. [Google Scholar] [CrossRef]
- Lee, C. M. C., & Ready, M. J. (1991). Inferring trade direction from intraday data. The Journal of Finance, 46(2), 733–746. [Google Scholar] [CrossRef]
- Li, W. X., French, J. J., & Chen, C. C. S. (2017). Informed trading in S&P index options? Evidence from the 2008 financial crisis. Journal of Empirical Finance, 42, 40–65. [Google Scholar] [CrossRef]
- Li, X., Li, S., & Xu, C. (2020). Price clustering in Bitcoin market—An extension. Finance Research Letters, 32, 101072. [Google Scholar] [CrossRef]
- Liu, L. Y., Patton, A. J., & Sheppard, K. (2015). Does anything beat 5-minute RV? A comparison of realized measures across multiple asset classes. Journal of Econometrics, 187(1), 293–311. [Google Scholar] [CrossRef]
- Madhavan, A. (2000). Market microstructure: A survey. Journal of Financial Markets, 3(3), 205–258. [Google Scholar] [CrossRef]
- Maghyereh, A., & Abdoh, H. (2020). Tail dependence between Bitcoin and financial assets: Evidence from a quantile cross-spectral approach. International Review of Financial Analysis, 71, 101545. [Google Scholar] [CrossRef]
- Miyakawa, D., Oikawa, K., & Ueda, K. (2021). Firm exit during the COVID-19 pandemic: Evidence from Japan. Journal of the Japanese and International Economies, 59, 101118. [Google Scholar] [CrossRef]
- Nagar, V., Schoenfeld, J., & Wellman, L. (2019). The effect of economic policy uncertainty on investor information asymmetry and management disclosures. Journal of Accounting and Economics, 67(1), 36–57. [Google Scholar] [CrossRef]
- Nguyen, K. Q. (2022). The correlation between the stock market and Bitcoin during COVID-19 and other uncertainty periods. Finance Research Letters, 46, 102284. [Google Scholar] [CrossRef]
- O’Brien, R. M. (2007). A caution regarding rules of thumb for variance inflation factors. Quality & Quantity, 41(5), 673–690. [Google Scholar] [CrossRef]
- Ormos, M., & Timotity, D. (2016). Market microstructure during financial crisis: Dynamics of informed and heuristic-driven trading. Finance Research Letters, 19, 60–66. [Google Scholar] [CrossRef]
- Panyagometh, K. (2024). The effect of COVID-19 and U.S. monetary policy on Bitcoin and stock market volatility: An application of DCC-GARCH model. Humanities and Social Sciences Communications, 11, 1735. [Google Scholar] [CrossRef]
- Phan, D. H. B., & Narayan, P. K. (2020). Country responses and the reaction of the stock market to COVID-19—A preliminary exposition. Emerging Markets Finance and Trade, 56(10), 2138–2150. [Google Scholar] [CrossRef]
- Ramelli, S., & Wagner, A. F. (2020). Feverish stock price reactions to COVID-19. The Review of Corporate Finance Studies, 9(3), 622–655. [Google Scholar] [CrossRef]
- Salisu, A. A., Ebuh, G. U., & Usman, N. (2020). Revisiting oil-stock nexus during COVID-19 pandemic: Some preliminary results. International Review of Economics and Finance, 69, 280–294. [Google Scholar] [CrossRef]
- Sensoy, A. (2019). The inefficiency of Bitcoin revisited: A high-frequency analysis with alternative currencies. Finance Research Letters, 28, 68–73. [Google Scholar] [CrossRef]
- Sharif, A., Aloui, C., & Yarovaya, L. (2020). COVID-19 pandemic, oil prices, stock market, geopolitical risk and policy uncertainty nexus in the US economy: Fresh evidence from the wavelet-based approach. International Review of Financial Analysis, 70, 101496. [Google Scholar] [CrossRef]
- Su, J.-B. (2025). Does the COVID-19 pandemic affect the asset allocation performance? Evidence from a composite asset selection approach. Humanities and Social Sciences Communications, 12, 1287. [Google Scholar] [CrossRef]
- Takahashi, H., & Yamada, K. (2021). When the Japanese stock market meets COVID-19: Impact of ownership, China and US exposure, and ESG channels. International Review of Financial Analysis, 74, 101670. [Google Scholar] [CrossRef]
- Thorbecke, W. (2020). The impact of the COVID-19 pandemic on the U.S. economy: Evidence from the stock market. Journal of Risk and Financial Management, 13(10), 233. [Google Scholar] [CrossRef]
- Urquhart, A. (2016). The inefficiency of Bitcoin. Economics Letters, 148, 80–82. [Google Scholar] [CrossRef]
- Wang, J.-N., Liu, H. C., & Hsu, Y. T. (2020). Time-of-day periodicities of trading volume and volatility in Bitcoin exchange: Does the stock market matter? Finance Research Letters, 34, 101243. [Google Scholar] [CrossRef]
- Wang, J.-N., Liu, H.-C., Zhang, S., & Hsu, Y.-T. (2021). How does the informed trading impact Bitcoin returns and volatility? Applied Economics, 53(28), 3223–3233. [Google Scholar] [CrossRef]
- Wei, J., & Zhou, X. (2016). Informed trading in corporate bonds prior to earnings announcements. Financial Management, 45(3), 641–674. [Google Scholar] [CrossRef]
- Yarovaya, L., Brzeszczyński, J., Goodell, J. W., Lucey, B., & Lau, C. K. M. (2022). Rethinking financial contagion: Information transmission mechanism during the COVID-19 pandemic. Journal of International Financial Markets, Institutions and Money, 79, 101589. [Google Scholar] [CrossRef]
- Yildiz, S., Van Ness, B., & Van Ness, R. A. (2020). VPIN, liquidity, and return volatility in the U.S. equity markets. Global Finance Journal, 45, 100479. [Google Scholar] [CrossRef]
- Zaremba, A., Kizys, R., Aharon, D. Y., & Demir, E. (2020). Infected markets: Novel coronavirus, government interventions, and stock return volatility around the globe. Finance Research Letters, 35, 101597. [Google Scholar] [CrossRef] [PubMed]
- Zaremba, A., Kizys, R., Tzouvanas, P., Aharon, D. Y., & Demir, E. (2021). The quest for multidimensional financial immunity to the COVID-19 pandemic: Evidence from international stock markets. Journal of International Financial Markets, Institutions and Money, 71, 101284. [Google Scholar] [CrossRef]
- Zhang, D., Hu, M., & Ji, Q. (2020). Financial markets under the global pandemic of COVID-19. Finance Research Letters, 36, 101528. [Google Scholar] [CrossRef] [PubMed]

| Mean | SD | Min | 25% | Median | 75% | Max | |
|---|---|---|---|---|---|---|---|
| VPIN, whole period | 0.237 | 0.066 | 0.100 | 0.188 | 0.234 | 0.279 | 0.514 |
| VPIN, pre-COVID-19 period | 0.227 | 0.050 | 0.111 | 0.195 | 0.231 | 0.259 | 0.334 |
| VPIN, COVID-19 stage I | 0.269 | 0.068 | 0.148 | 0.218 | 0.259 | 0.310 | 0.514 |
| VPIN, COVID-19 stage II | 0.214 | 0.067 | 0.100 | 0.162 | 0.201 | 0.252 | 0.418 |
| diff1 (COVID-19 stage I— pre-COVID-19 period) | 0.042 *** | ||||||
| diff2 (COVID-19 stage II— pre-COVID-19 period) | −0.013 | ||||||
| priceVolat | 0.055 | 0.054 | 0.010 | 0.027 | 0.040 | 0.062 | 0.501 |
| tradVol (billion USD) | 0.081 | 0.057 | 0.012 | 0.044 | 0.065 | 0.105 | 0.360 |
| COVID-19 Deaths | 4335 | 2280 | 38 | 3377 | 4813 | 5850 | 10,491 |
| COVID-19 Cases | 136,938 | 94,783 | 523 | 72,909 | 110,998 | 225,031 | 305,691 |
| Model 1 | Model 2 | Model 3 | Model 4 | Model 5 | Model 6 | |
|---|---|---|---|---|---|---|
| growthC | 1.047 *** | 0.786 *** | 0.817 *** | |||
| (0.196) | (0.205) | (0.189) | ||||
| growthD | 0.747 *** | 0.622 *** | 0.660 *** | |||
| (0.134) | (0.133) | (0.121) | ||||
| priceVolat | 0.051 | 0.034 | −0.018 | −0.047 | ||
| (0.191) | (0.191) | (0.184) | (0.184) | |||
| tradVol | 0.819 *** | 0.845 *** | 0.928 *** | 0.966 *** | ||
| (0.094) | (0.098) | (0.104) | (0.106) | |||
| Tuesday | −0.007 | −0.005 | ||||
| (0.011) | (0.011) | |||||
| Wednesday | −0.012 | −0.013 | ||||
| (0.011) | (0.011) | |||||
| Thursday | −0.015 | −0.015 | ||||
| (0.013) | (0.013) | |||||
| Friday | −0.011 | −0.008 | ||||
| (0.012) | (0.012) | |||||
| Saturday | 0.006 | 0.007 | ||||
| (0.012) | (0.012) | |||||
| Sunday | 0.023 * | 0.026 ** | ||||
| (0.012) | (0.012) | |||||
| Intercept | 0.212 *** | 0.219 *** | 0.150 *** | 0.152 *** | 0.146*** | 0.147 *** |
| (0.007) | (0.006) | (0.007) | (0.006) | (0.011) | (0.011) | |
| Adj-R | 0.134 | 0.126 | 0.569 | 0.579 | 0.584 | 0.598 |
| F-Stat | 33.96 *** | 31.67 *** | 94.66 *** | 98.73 *** | 34.16 *** | 36.20 *** |
| Observations | 214 | 214 | 214 | 214 | 214 | 214 |
| VPIN 1-50-250 | VPIN 1-50-250 | VPIN 1-5-5 | VPIN 1-5-5 | VPIN 1-50-50 (Equal Weight) | VPIN 1-50-50 (Equal Weight) | |
|---|---|---|---|---|---|---|
| growthC | 0.823 *** | 0.222 ** | 0.715 *** | |||
| (0.143) | (0.095) | (0.166) | ||||
| growthD | 0.582 *** | 0.220 *** | 0.588 *** | |||
| (0.101) | (0.065) | (0.104) | ||||
| priceVolat | 0.095 | 0.108 | 0.051 | 0.023 | 0.152 | 0.121 |
| (0.139) | (0.146) | (0.071) | (0.070) | (0.124) | (0.124) | |
| tradVol | 0.566 *** | 0.579 *** | 0.379 *** | 0.403 *** | 0.937 *** | 0.974 *** |
| (0.106) | (0.109) | (0.065) | (0.067) | (0.102) | (0.104) | |
| Tuesday | 0.008 | 0.010 | −0.003 | −0.003 | −0.006 | −0.005 |
| (0.012) | (0.012) | (0.008) | (0.008) | (0.012) | (0.011) | |
| Wednesday | −0.002 | −0.002 | −0.005 | −0.006 | −0.010 | −0.011 |
| (0.011) | (0.012) | (0.008) | (0.008) | (0.011) | (0.011) | |
| Thursday | −0.018 | −0.018 | −0.014 * | −0.015 * | −0.011 | −0.011 |
| (0.011) | (0.011) | (0.008) | (0.008) | (0.014) | (0.013) | |
| Friday | 0.002 | 0.004 | −0.009 | −0.009 | −0.016 | −0.014 |
| (0.012) | (0.011) | (0.008) | (0.008) | (0.012) | (0.011) | |
| Saturday | 0.020 | 0.022 * | 0.002 | 0.002 | 0.008 | 0.010 |
| (0.012) | (0.012) | (0.008) | (0.008) | (0.012) | (0.012) | |
| Sunday | 0.017 | 0.019 * | 0.014 | 0.014 | 0.025 ** | 0.028 ** |
| (0.011) | (0.011) | (0.010) | (0.010) | (0.012) | (0.012) | |
| Intercept | 0.184 *** | 0.187 *** | 0.061 *** | 0.061 *** | 0.143 *** | 0.144 *** |
| (0.009) | (0.009) | (0.008) | (0.008) | (0.011) | (0.011) | |
| Adj-R | 0.423 | 0.419 | 0.379 | 0.393 | 0.645 | 0.657 |
| F-Stat | 18.36 *** | 18.06 *** | 15.37 *** | 16.26 *** | 40.09 *** | 42.35 *** |
| Obs | 214 | 214 | 214 | 214 | 214 | 214 |
| Model R1 | Model R2 | Model R3 | Model R4 | Model R5 | Model R6 | |
|---|---|---|---|---|---|---|
| growthC | 0.666 *** | 0.772 *** | 0.767 *** | |||
| (0.194) | (0.148) | (0.190) | ||||
| growthD | 0.546 *** | 0.614 *** | 0.643 *** | |||
| (0.129) | (0.092) | (0.122) | ||||
| Mortality | 0.536 ** | 0.641 *** | ||||
| (0.223) | (0.214) | |||||
| priceVolat | 0.041 | 0.010 | ||||
| (0.188) | (0.185) | |||||
| tradVol | 0.882 *** | 0.902 *** | 0.870 *** | 0.904 *** | ||
| (0.078) | (0.077) | (0.106) | (0.107) | |||
| priceVolat (t − 1) | 0.197 | 0.171 | ||||
| (0.147) | (0.138) | |||||
| tradVol (t − 1) | 0.702 *** | 0.734 *** | ||||
| (0.121) | (0.122) | |||||
| RealizedVolat | 0.486 | 0.448 | ||||
| (0.504) | (0.518) | |||||
| Tuesday | −0.045 *** | −0.045 *** | −0.007 | −0.005 | −0.006 | −0.005 |
| (0.012) | (0.012) | (0.011) | (0.011) | (0.011) | (0.010) | |
| Wednesday | −0.035 *** | −0.037 *** | −0.005 | −0.006 | −0.010 | −0.011 |
| (0.012) | (0.012) | (0.011) | (0.011) | (0.011) | (0.010) | |
| Thursday | −0.014 | −0.015 | −0.015 | −0.015 | −0.015 | −0.015 |
| (0.015) | (0.014) | (0.013) | (0.013) | (0.013) | (0.012) | |
| Friday | −0.058 *** | −0.057 *** | −0.012 | −0.009 | −0.011 | −0.009 |
| (0.012) | (0.012) | (0.012) | (0.012) | (0.012) | (0.011) | |
| Saturday | −0.059 *** | −0.059 *** | 0.005 | 0.006 | 0.005 | 0.006 |
| (0.012) | (0.012) | (0.012) | (0.012) | (0.012) | (0.011) | |
| Sunday | 0.002 | 0.003 * | 0.022 * | 0.025 ** | 0.022 * | 0.025 ** |
| (0.014) | (0.014) | (0.012) | (0.012) | (0.012) | (0.012) | |
| Intercept | 0.185 *** | 0.186 *** | 0.149 *** | 0.150 *** | 0.124 *** | 0.119 *** |
| (0.010) | (0.010) | (0.012) | (0.011) | (0.014) | (0.014) | |
| Adj-R | 0.517 | 0.527 | 0.585 | 0.599 | 0.592 | 0.611 |
| F-Stat | 26.23 *** | 27.23 *** | 34.40 *** | 36.36 *** | 31.89 *** | 34.47 *** |
| Obs | 213 | 213 | 214 | 214 | 214 | 214 |
Disclaimer/Publisher’s Note: The statements, opinions and data contained in all publications are solely those of the individual author(s) and contributor(s) and not of MDPI and/or the editor(s). MDPI and/or the editor(s) disclaim responsibility for any injury to people or property resulting from any ideas, methods, instructions or products referred to in the content. |
© 2026 by the authors. Licensee MDPI, Basel, Switzerland. This article is an open access article distributed under the terms and conditions of the Creative Commons Attribution (CC BY) license.
Share and Cite
Mavropoulos, T.; Ersan, O.; Demir, E. Informed Trading Through the COVID-19 Pandemic: Evidence from the Bitcoin Market. J. Risk Financ. Manag. 2026, 19, 59. https://doi.org/10.3390/jrfm19010059
Mavropoulos T, Ersan O, Demir E. Informed Trading Through the COVID-19 Pandemic: Evidence from the Bitcoin Market. Journal of Risk and Financial Management. 2026; 19(1):59. https://doi.org/10.3390/jrfm19010059
Chicago/Turabian StyleMavropoulos, Timotheos, Oguz Ersan, and Ender Demir. 2026. "Informed Trading Through the COVID-19 Pandemic: Evidence from the Bitcoin Market" Journal of Risk and Financial Management 19, no. 1: 59. https://doi.org/10.3390/jrfm19010059
APA StyleMavropoulos, T., Ersan, O., & Demir, E. (2026). Informed Trading Through the COVID-19 Pandemic: Evidence from the Bitcoin Market. Journal of Risk and Financial Management, 19(1), 59. https://doi.org/10.3390/jrfm19010059