Article

Predicting Environmental Social and Governance Scores: Applying Machine Learning Models to French Companies

1
Higher Institute of Management, GEF2A-Lab, University of Tunis, Tunis 2000, Tunisia
2
Higher Institute of Management, University of Tunis, Tunis 2000, Tunisia
*
Author to whom correspondence should be addressed.
J. Risk Financial Manag. 2025, 18(8), 413; https://doi.org/10.3390/jrfm18080413
Submission received: 26 June 2025 / Revised: 19 July 2025 / Accepted: 22 July 2025 / Published: 26 July 2025

Abstract

The main objective of this study is to analyse the relevance of financial performance as an accurate predictor of ESG scores for French companies from 2010 to 2022. To this end, Machine Learning techniques such as linear regression, polynomial regression, Random Forest, and Support Vector Regression (SVR) were employed to provide more accurate and reliable assessments, thus informing the ESG rating attribution process. The results obtained highlight the excellent performance of the Random Forest method in predicting ESG scores from company financial variables. In addition, the approach identified specific financial variables (operating income, market capitalisation, enterprise value, etc.) that act as powerful predictors of companies’ ESG scores. This modelling approach offers a robust tool for predicting companies’ ESG scores from financial data, which can be valuable for investors and decision-makers wishing to assess and understand the impact of financial variables on corporate sustainability. Also, this allows sustainability investors to diversify their portfolios by including companies that are not currently rated by ESG rating agencies, that do not produce sustainability reports, as well as newly listed companies. It also gives companies the opportunity to identify areas where improvements are needed to enhance their ESG performance. Finally, it facilitates access to ESG ratings for interested external stakeholders. Our study focuses on using advances in artificial intelligence, exploring machine learning techniques to develop a reliable predictive model of ESG scores, which is proving to be an original and promising area of research.

1. Introduction

Over the past decade, ESG investing has grown considerably in response to increasing sustainability concerns and changing investor preferences. This development presents major challenges, but it also offers many opportunities, both for companies and for investors. In particular, financial markets are now placing significant emphasis on these criteria when evaluating companies.
In the early 2000s, the European Union undertook to develop a European framework for CSR, offering tools for assessing standards and facilitating the integration of CSR into companies. In France, the NRE1 law of 2001 obliges listed companies to take into account the social and environmental consequences of their activities, giving rise to a multitude of organisations, standards, and laws providing a framework for the application of CSR in companies.
France has attracted a great interest as a subject of study for several reasons. Firstly, it is one of the world’s largest economies. In addition, France is characterised by the dominant role of the state in regulating relations between firms and society, as highlighted by Charkham (1995). This influence can be seen in the body of legislation governing CSR. As early as 1977, France was one of the pioneers in the field of corporate social communications, imposing the obligation to publish annual reports. In 2001, legislation also included social and environmental criteria in the annual reports of listed companies.
The economic, social, and environmental responsibilities of companies are already an integral part of French legislation, making France an example of implicit recognition of CSR. However, it is interesting to note that academic research has recently begun to pay greater attention to the practices developed by French companies in this area.
In recent years, interest in Corporate Social Responsibility (CSR), sustainability and Environmental, Social, and Governance (ESG) aspects has grown significantly worldwide (Alipour & Bastani, 2023; Ben Flah et al., 2024). ESG ratings have become key indicators for assessing companies’ commitment to sustainability (Zheng et al., 2021). However, the integration of ESG criteria requires sufficient access to reliable information on how companies deal with these issues, and despite efforts to encourage the disclosure of ESG-related information, divergences persist in the ratings assigned to companies. In response to the complexity of measuring CSR, several ESG rating agencies have been created. The most important ESG rating scores include the Thomson Reuters ESG Score, the Bloomberg ESG Disclosure Score, the Vigeo-Eiris ESG Score, and the Morgan Stanley Capital International (MSCI) ESG Score. These scores are valuable tools to help investors make informed sustainable investment decisions.
Doyle (2018) highlights the fact that ESG ratings by different agencies can vary significantly so that a company can be given widely divergent ratings by different agencies due to differences in methodology, assessment strategies, and subjective interpretations of unstructured information.
So, critical debates have emerged regarding the validity and consistency of these ratings, calling into question their reliability despite their increasing usefulness. The work of Chatterji et al. (2015) revealed significant disagreement among ESG rating stakeholders, mainly due to the lack of common theorising and shared measurement standards. In addition, concerns have emerged about the transparency of ESG calculation methodologies, as these calculations can be influenced by company reporting and disclosure of associated information (C. Li et al., 2021), and also uncertainty about the credibility of information sources, lack of transparency, as well as conflicts of interest (Berg et al., 2022). This can potentially lead to information asymmetries in ESG ratings, resulting in biases and disparities in the ratings assigned to the same company by different rating agencies.
This paper attempts to contribute to the resolution of the divergence problem outlined above by detecting the financial variables that are predictive of the ESG scores of French companies listed in the (Cotation Assistée en Continu)2 CAC All-Tradable index over the period from 2010 to 2022.
Moreover, this work proposes an approach based on the use of Machine Learning (ML) models and statistical approaches to assess the effectiveness of corporate financial performance as an accurate predictor of ESG scores. This approach aims to remedy the degree of subjectivity inherent in the rating methods of the various agencies.
The rest of the paper is structured as follows: Section 2 reviews relevant literature on the determinants of ESG ratings and the relationship between ESG and firms’ financial performance. Section 3 describes the methodological approach and statistics analysis. Section 4 sets out the empirical results and the discussion. Finally, Section 5 concludes.

2. Theoretical Framework

2.1. Determinants of ESG Scores

Giannarakis (2014) provides an in-depth analysis of the factors influencing the disclosure of ESG scores. Among the most relevant explanatory variables are the size of the company, its profitability, its level of debt, the characteristics of the board of directors such as its size, the presence of women on the board, and the average age of its members, as well as the visibility and media exposure of the company.
Focusing on corporate governance, the research conducted by Birindelli et al. (2018) reveals that the ESG score of banks is positively correlated with several factors, including the presence of women on the board, the size of the board, the implementation of a CSR committee, as well as the size of the bank.
In the same line of thought, Drempetic et al. (2019) examines the relationship between company size and ESG sustainability and performance. The results revealed a significant positive correlation, suggesting that larger companies often have more resources to provide ESG data and achieve higher scores. However, the authors also point out that biases may emerge in ESG ratings, favouring smaller companies.
In a detailed analysis, Baldini et al. (2018) examine the influence of temporal, national, and organisational variables in an international sample covering several industries. The results of this study highlight that structural factors specific to each country have a significant influence on companies’ ESG disclosure. These results suggest that political, labour, and cultural systems play an important role.
Moreover, Ng (2016) investigates the motivations behind sustainability disclosure in emerging economies. This research, based on the analysis of a sample comprising 251 banks from 45 emerging countries for the period 2005 to 2014, seeks to explain ESG sustainability based on concrete factors, such as banks’ fundamental characteristics, country ESG performance, macroeconomic variables, and institutional quality. The findings show that elements such as liquidity, seniority, and market power have a positive influence on banks’ willingness to disclose their ESG policies and practices.
Furthermore, the importance of CSR raises an important question about the relationship between the social and ethical behaviour of companies and their financial performance. CSR seeks to reconcile profitability and ethics (Mozes et al., 2011). Therefore, according to signal theory (Spence, 1974), implementing CSR activities can improve companies’ external reputation, send a positive signal to the market, attract more investors and partnerships (Cui et al., 2018), and attract quality talent to companies.
In addition, stakeholder theory offers a strong foundation for understanding how ESG practices contribute to a company’s financial success (Dimitropoulos et al., 2020). Hoepner et al. (2023) also find empirical evidence that engagement with ESG issues reduces downside risk. In addition, Ilhan et al. (2019) show that companies with lower ESG profiles, including high carbon emissions, have higher extreme risk.
Therefore, investing in ESG can offer many benefits to companies, such as reducing business risks (Sassen et al., 2016), lowering capital costs (Breuer et al., 2018), and improving their financial performance (Ben Flah et al., 2024) and company value (Y. Li et al., 2018).
In recent decades, the scientific community has become increasingly interested in the relationship between CSR and corporate financial performance. However, despite these efforts, the results of this work are inconclusive and even contradictory.
S. Chen et al. (2023) find a positive effect of ESG practices on company performance. They explain these results by the fundamental role of ESG practices in improving corporate reputation and establishing a good relationship with stakeholders. In addition, according to this study, the positive impact of the ESG initiative on company performance is more evident in large companies in developing countries. This is explained by the fact that large companies are better equipped to respond to ESG criteria thanks to their greater resources.
Several studies have used multivariate approaches to examine the relationship between companies’ sustainability performance and their financial performance. These studies have used statistical methods to predict companies’ financial performance based on their SD performance. For example, Weber et al. (2008) use ESG criteria to predict accounting indicators such as EBITDA margin, return on assets, and return on equity, as well as financial market indicators such as total returns. The results show that this statistical approach is useful for showing that ESG performance can explain companies’ financial performance in terms of EBITDA margin, ROA and ROE.
Agoraki et al. (2023) show that European companies with a lower ESG reputation risk are less financially constrained and perform better. Similarly, empirical results of Chouaibi et al. (2022) indicate a positive impact of ESG practices, measured using ESG scores, on Tobin’s Q. Ben Flah et al. (2024) investigate the effect of corporate social responsibility on the financial performance of companies listed on the Tunis Stock Exchange. The results highlight that CSR has a positive and significant impact on firm performance.
However, recent studies assert that the relationship between ESG practices and the financial situation of companies is not linear. For example, Agarwala et al. (2024) find a U-shaped relationship between the composite ESG score and market performance. According to these authors, funds devoted to ESG practices have a negative impact on a firm’s financial performance during the first few years of implementation of these strategies. The positive effects of ESG practices began to manifest themselves in the financial performance of companies once they had passed this period. Other research finds a negative relationship between CSR and financial performance. For example, Liao et al. (2018) find that the effect of CSR on firms’ financial performance is negative in the first six years after adopting CSR practices. The authors suggest that a longer period is needed to observe the positive impact of CSR on financial performance.
For their part, Han et al. (2016) seek to determine whether there is a correlation between CSR and their profit by testing the ESG performance score on the financial performance. Despite their efforts, the results of the study revealed no statistically significant evidence or relationship between CSR and financial performance.
Overall, theoretical and empirical evidence provides strong support for the existence of a significant effect of ESG scores on financial performance. This impact suggests that investors could benefit from valuable information derived from non-financial data.

2.2. Critical Analysis of the Reliability of ESG Scores

Today, investors are faced with the need to better understand the risks and opportunities associated with sustainability in order to make informed investment decisions. In this context, an assessment of sustainability is essential to guide investors’ choices and facilitate comparisons between different investment options. Moreover, the number of institutions incorporating ESG considerations into their decision-making processes has increased significantly, from 734 in 2010 to 3826 in March 2020 (Yuan et al., 2022).
It is therefore imperative to have a systematic way of measuring and evaluating the implementation of ESG by asset managers (Kim & Yoon, 2023). However, barriers remain, such as the low availability of consistent, comparable and reliable data, as well as the cost of data and access to the resources needed to conduct analysis, making it difficult to properly measure and manage exposure to environmental, social, and governance risks.
Due to these findings on the diversity of ESG ratings and the divergences between previous and recent studies, the demand for reliable and accurate ESG scores is increasing significantly. Furthermore, ESG ratings and their reliability have given rise to in-depth discussions, notably through the work of Berg et al. (2022) who highlighted the confusion they cause. First of all, it is questioned whether ESG performance is indeed correctly reflected in the prices of corporate stocks and bonds. Furthermore, the divergence of ratings may discourage companies from committing to improvements in their ESG performance. Finally, the disparity in ratings may present a challenge for empirical research in this area.
In addition, the problem of the reliability of ESG ratings is exacerbated by the lack of information on ESG risks and opportunities outside the company’s operational perimeter, as highlighted by the World Business Council for Sustainable Development (WBCSD) in 2019.
Due to disparities in methodologies and the unreliability of data, rating agencies can display great variability when ranking the same company. In fact, a company’s ESG scores vary considerably from one agency to another, with ratings that have little correlation (Berg et al., 2022). This variability can lead to numerous problems related to market uncertainty. According to Antoncic (2020), comparing the ratings of a company by different assessors reveals significant differences.
Consequently, measurement disagreement, which corresponds to the situation where rating agencies use different indicators to measure the same characteristic, seems to be the main cause of these discrepancies (Florian et al., 2020). It is therefore understandable that rating agencies are criticised.

2.3. Analysis of ESG Scores Using Machine Learning

Investing in ESG-focused portfolios has become an increasingly common practice in the financial world. However, quantitative methodologies to improve and standardise ESG ratings and create efficient portfolios are still underdeveloped (Sokolov et al., 2021). To avoid potentially harmful consequences for financial organisations, it is crucial to adopt new technologies to analyse ESG data more accurately and efficiently (J. Chen et al., 2021).
Machine Learning (ML) methods have demonstrated their ability to reveal complex patterns and hidden relationships that are sometimes difficult or impossible to detect using traditional linear analysis methods.
Licari et al. (2021) used a classical linear regression approach to attempt to predict the ESG scores of over 19,000 companies located in 96 countries/regions over the period from 2004 to 2020. However, they found that the predictive results of linear regression were unsatisfactory, with an R2 of only 31.13%. This limitation stems largely from the complexity of the factors inherent in the ESG rating process. Therefore, using traditional statistical approaches to make predictions in such a complex environment presents major challenges.
In addition, Guo (2020) analysed the impact of ESG scores on stock volatility using a dataset of 50,000 ESG news items. They took an innovative approach by employing a transformer-based language model, as well as sentiment analysis, to extract and convert these ESG news articles into numerical data. Using metrics such as RMSE (Root Mean Square Error) and MAE (Mean Absolute Error), the results revealed the predictive power of ESG news on equity volatility.
Yu et al. (2022) explored the relationship between ESG scores and stock returns using ML algorithms on RANKING CSR rating agency data. The results showed that non-ESG equities and ESG equities have similar risk performance over a normal period.
Furthermore, ESG data have been applied to predict companies’ stock market performance (Hu et al., 2018), as well as to predict financial metrics such as return on equity (ROE) (Lucia et al., 2020).
García et al. (2020) conducted an analysis of the relationship between companies’ financial performance and their CSR performance. They applied approximate set theory, a powerful mathematical method suitable for extracting information from uncertain, ambiguous and imperfect contexts. The results of their study reveal that financial data have a predictive capacity with regard to ESG aspects.
D’Amato et al. (2021a) developed an ML-based method to assess the impact of company structural data on ESG scores. The results showed that balance sheet items, analysed using the Random Forest algorithm, were a significant predictor of the ESG score, thus capturing non-linear patterns of the predictors, in contrast to the classical GLM-based regression approach.
Another study by D’Amato et al. (2021b) confirmed that financial statement items adequately explain the ESG score. This research highlights the importance of using advanced ML techniques to better understand the impact of structural variables on ESG scores.
Raza et al. (2022) explored various supervised ML approaches, such as K-nearest Neighbours (KNNs), polynomial regression, Random Forest (RF), artificial neural networks, and support vector machines (SVMs), to predict ESG scores of non-financial companies in the UK, US, and Germany. Their results suggest that SVM and RF are appropriate choices for predicting ESG scores, although their relevance may vary according to context.

3. Materials and Methods

3.1. Sample and Data

The empirical study examines a sample of French companies listed on the CAC All-Tradable index over the period of 2010–2022. The sample includes both large listed companies and small and medium-sized enterprises (SMEs). The choice of French companies was motivated by the fact that France was the first country to introduce mandatory extra-financial reporting for large listed companies back in 2001 with the Law on New Economic Regulations (NRE).
Companies whose ESG scores were not available were excluded from our initial analysis. The final sample of our study is made up of 204 companies. The companies studied belong to eleven distinct sectors: Manufacturing, Consumer Discretionary, Financials, Healthcare, Technology, Consumer Staples, Real Estate, Basic Materials, Utilities, Energy, Telecommunications.
To build our sample, we used the Refinitiv Data-Stream database (Thomson Reuters). This database is widely recognised for its reliability and is frequently used by investors and academics.

3.2. Variables Definitions

3.2.1. Dependent Variable

ESG score: sourced from Thomson Reuters Refinitiv ESG and varies from 0 to 100. Over the period 2010 to 2022, the average ESG score of the companies included in our database is 62.10.

3.2.2. Independent Variables

The independent variables contain both financial performance variables, which are assessed using accounting indicators and market measures obtained from Refinitiv’s Datastream database (Table 1), and environmental variables, which express sector membership as well as the three ESG pillars, Environment Pillar Score, Social Pillar Score, and Governance Pillar Score.
The investigations were carried out using the Python programming language (Python 3.10) in the Jupyter notebook environment.

3.3. Data Processing

Data processing was carried out in two phases: Data cleaning and treatment of missing values and encoding of categorical variables. In addition, companies with no information on ESG scores were excluded.

3.3.1. Standardisation

For standardisation, we used RobustScaler, a method that derives its robustness to outliers from the interquartile range. Specifically, this approach excludes the median from the data and adjusts the values in a range between the first quartile and the third quartile, also known as the interquartile range. It allows the median and interquartile range to be stored for later use, which is particularly beneficial in the presence of outliers.
The formula underlying this method is as follows:
x i Q 1 ( x ) Q 3 ( x ) Q 1 ( x )

3.3.2. Handling Missing Values

KNN (K-Nearest Neighbour) imputation was developed to identify the k-Nearest Neighbours of a missing data item in a dataset. It searches for all complete instances in the dataset and selects the k most relevant instances for a specific missing data item.
The KNN Imputer uses the k-Nearest Neighbour method to replace missing values in datasets. It replaces these missing values with the average of the k-Nearest Neighbours, where the parameter “K_neighbours” specifies the number of neighbours to be considered. By default, it uses a Euclidean distance metric to determine the proximity of neighbours when imputing missing values.
This Euclidean distance is used to quantify the separation between two cases and is calculated by taking the square root of the sum:
E u c l i d e a n i h = p = 1 p ( x p i x p h ) 2
Euclideanih: Euclidean distance between points i and h.
P: number of dimensions.

3.3.3. Encoding Categorical Variables

One-hot encoding aims to represent categorical variables. Most ML algorithms cannot deal directly with categorical features and require the data to be converted into a numerical form. One-hot encoding performs this transformation by converting categorical variables into binary vectors consisting of zeros and ones, making them compatible with these algorithms. In our study, we used this technique to encode the “Sector” variable in our database.

3.4. Descriptive Analysis of Variables

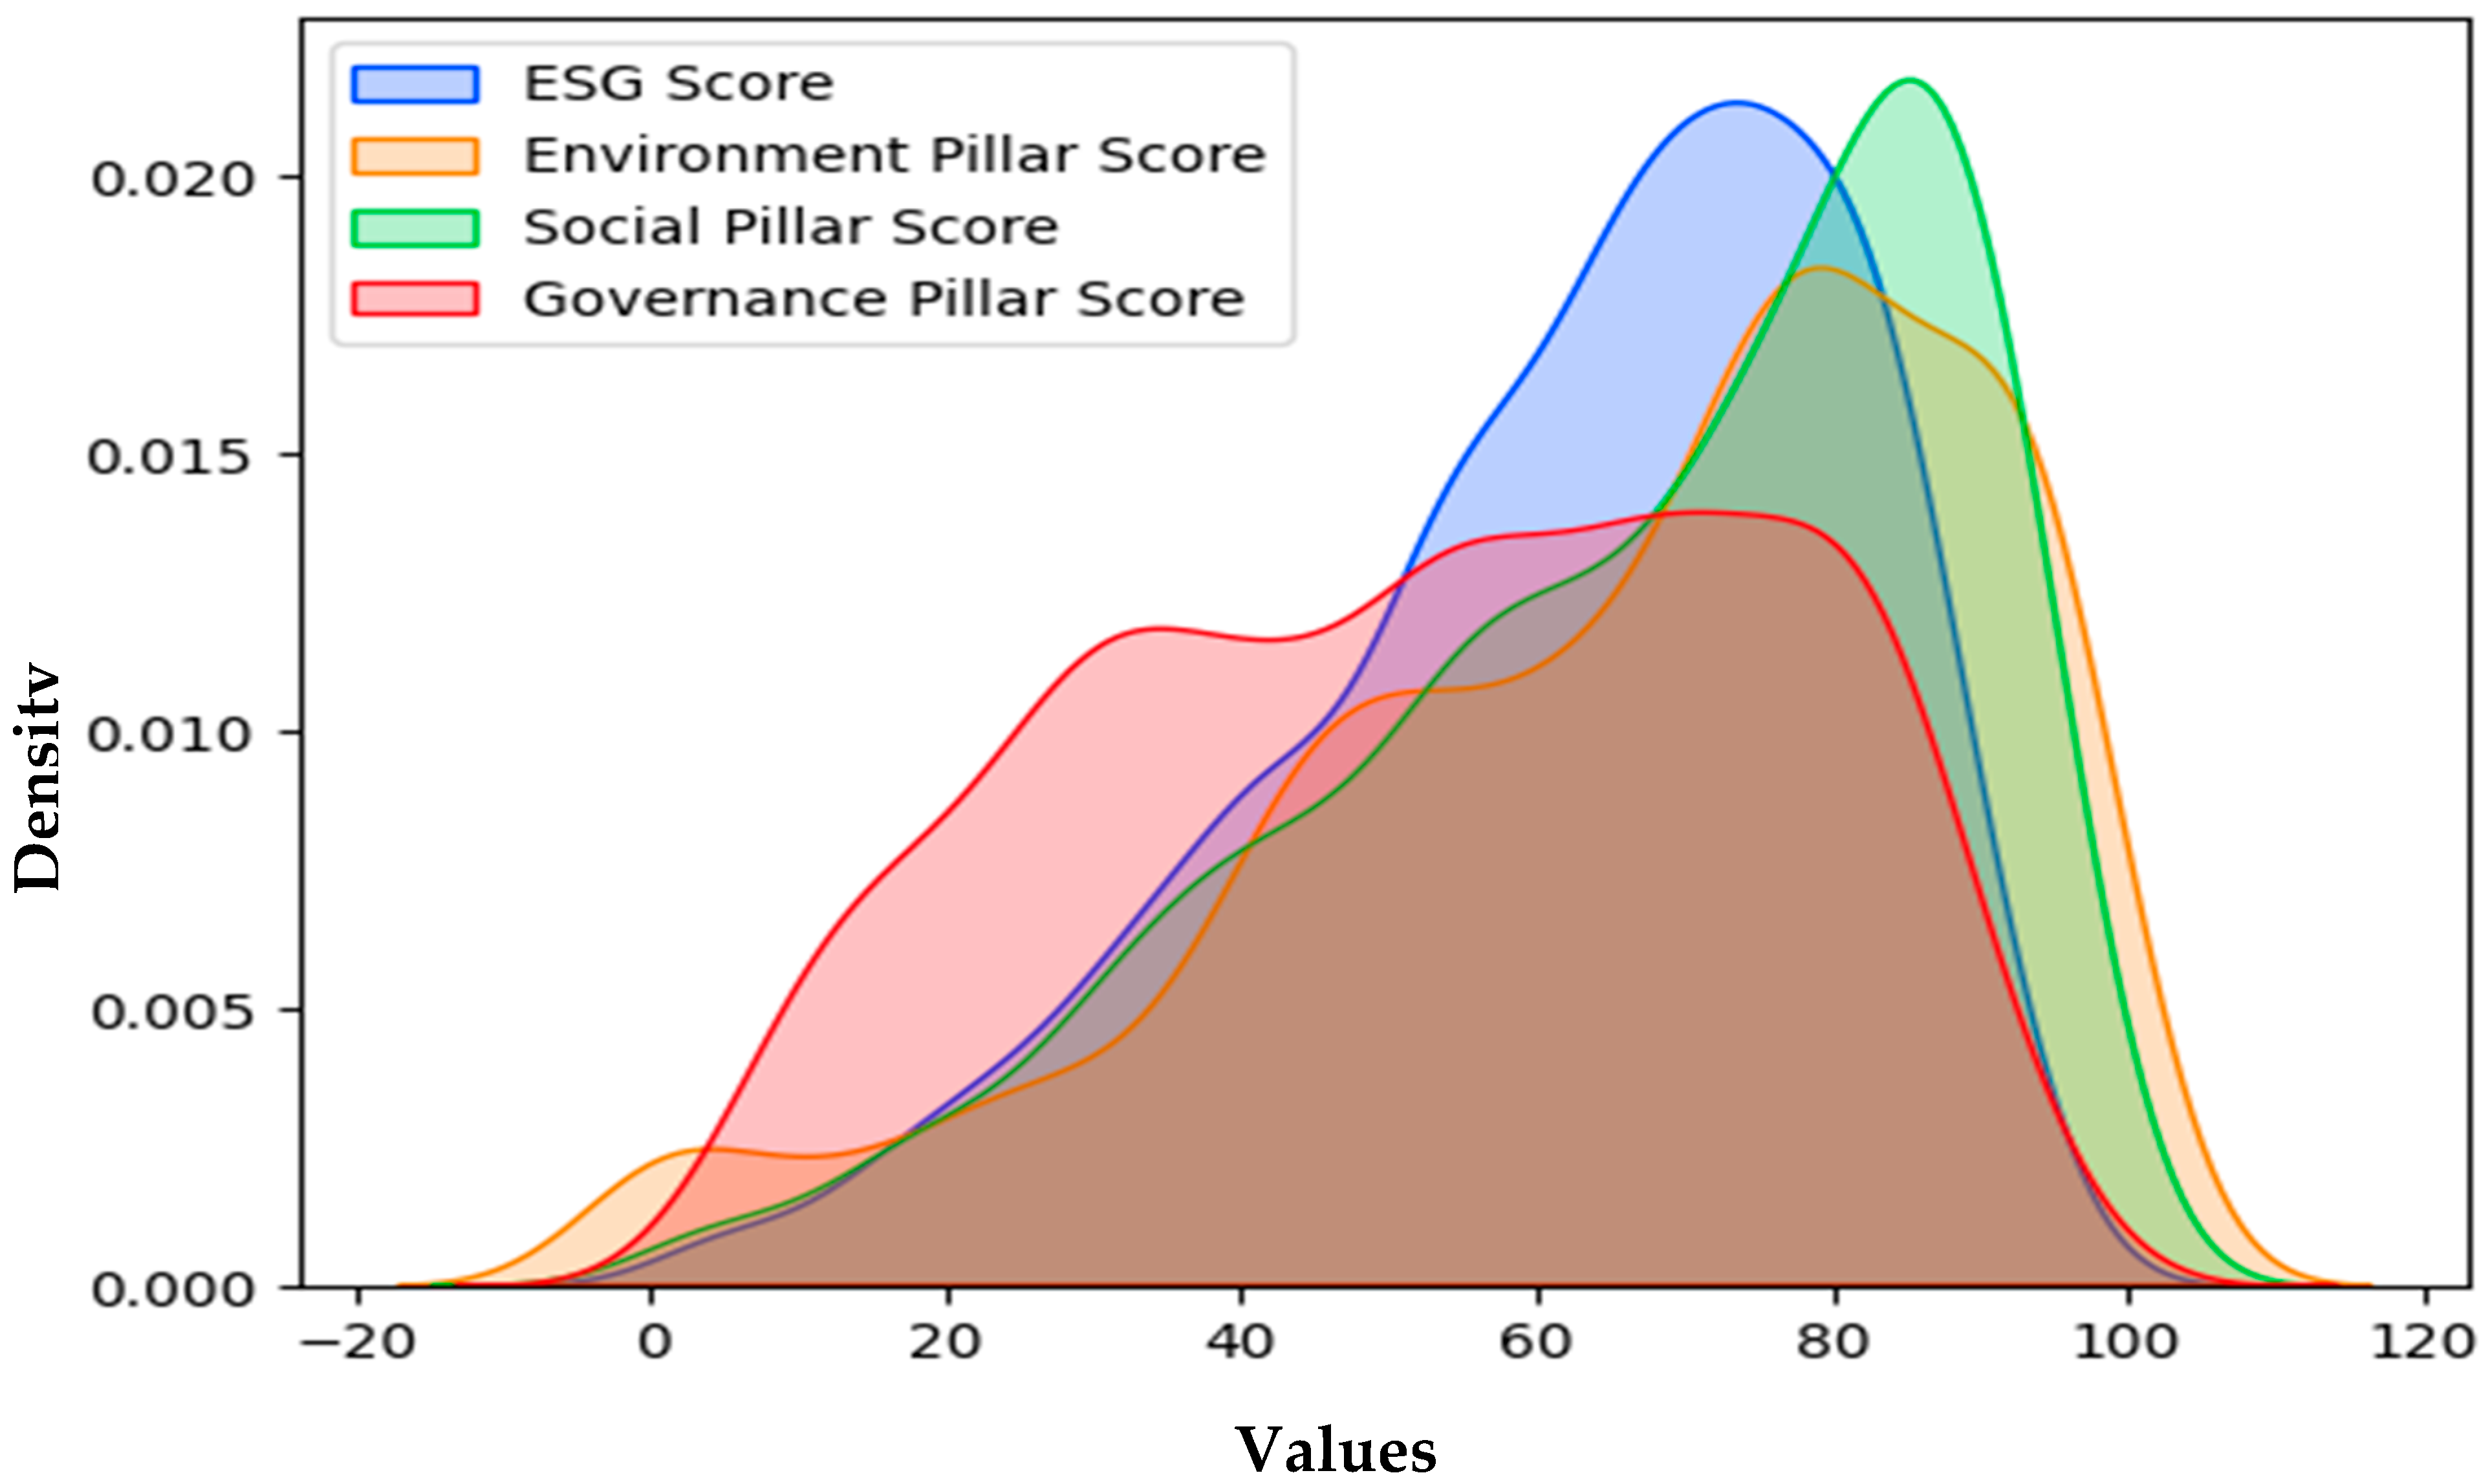
3.4.1. Descriptive Statistics

According to Table 2, the average scores for the environmental, social, and governance dimensions are 65.70, 66.49, and 52.66, respectively. These results indicate that on average, the companies in our sample have relatively equivalent social and environmental performances.
Thus, the average ESG score is 62.11, which reflects a positive trend. This suggests that the companies in our sample show an active commitment to CSR practices.
Furthermore, our results show that two of the sectors analysed stand out clearly in terms of ESG scores. The Real Estate sector has the highest ESG scores, meaning that it has the best ESG performance. This high performance may reflect a stronger commitment to sustainable, ethical, and responsible governance practices within the sector. The health care sector, on the other hand, has the lowest ESG scores of the sectors studied3.

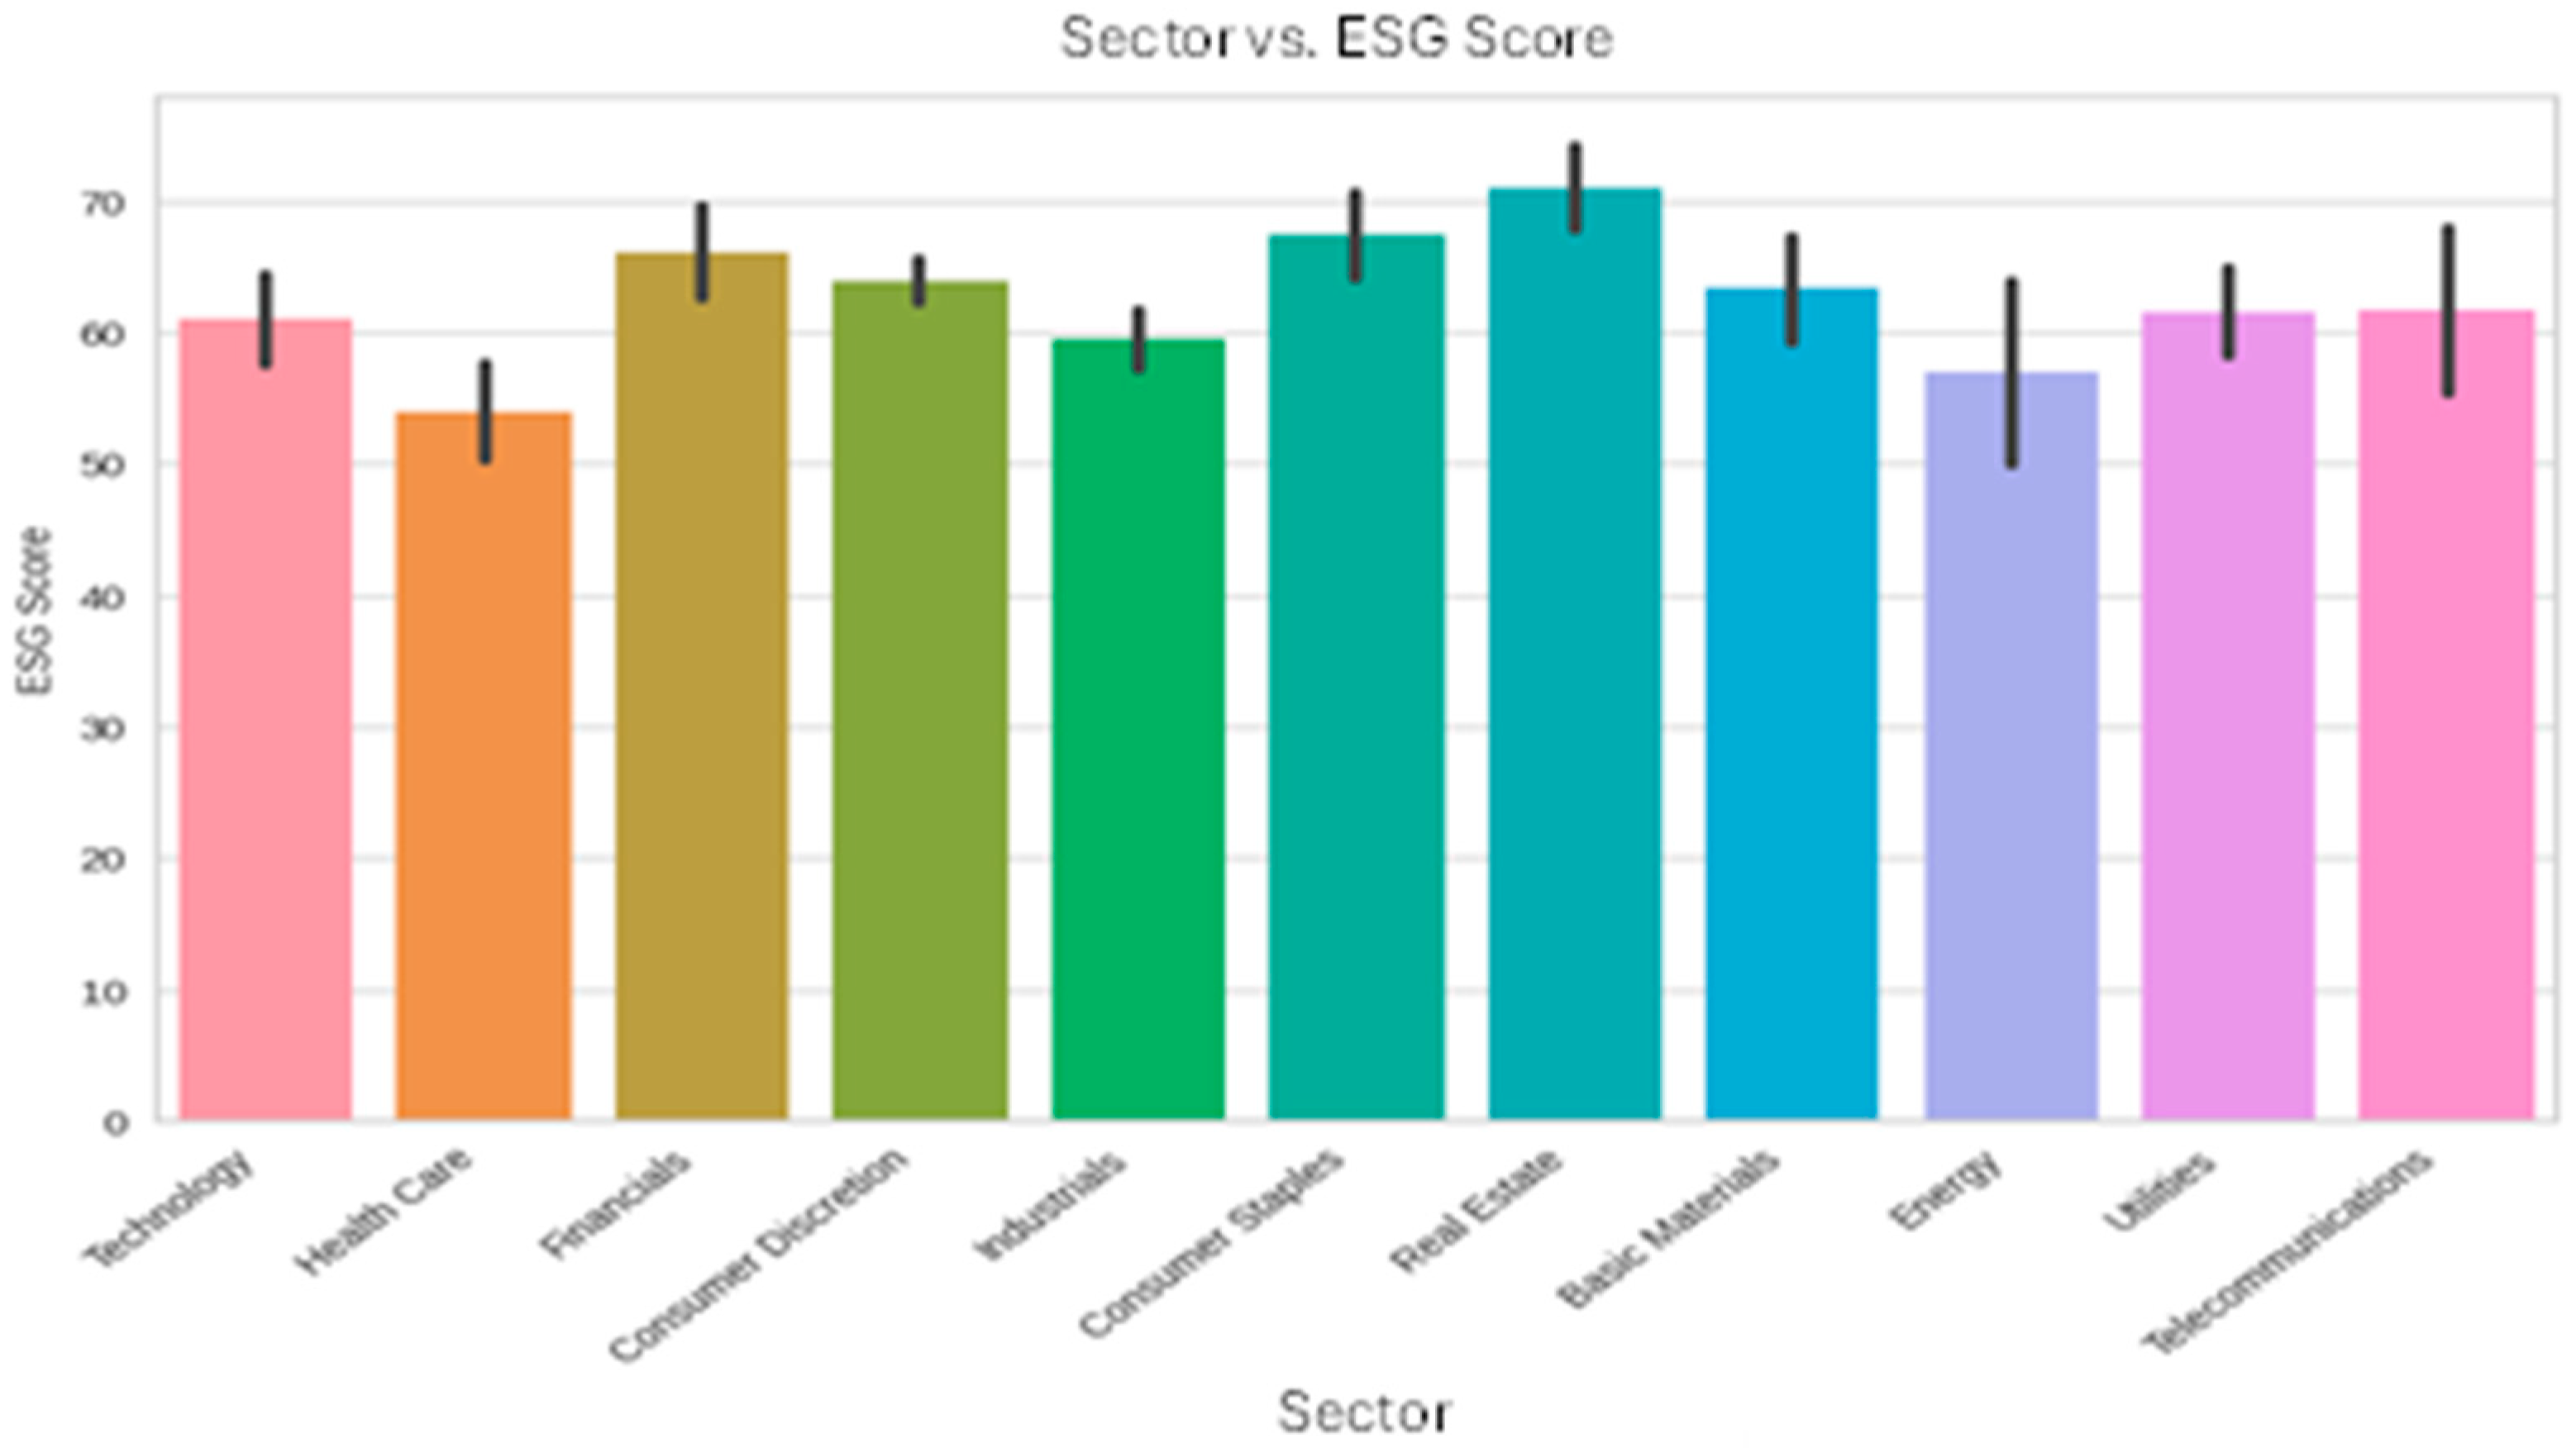
3.4.2. Analysis of ESG Scores Across Sectors

Figure 1 shows that two of the sectors analysed stand out clearly in terms of ESG scores. The Real Estate sector has the highest ESG scores, meaning that it has the best ESG performance. This high performance may reflect a stronger commitment to sustainable, ethical, and responsible governance practices within the sector. The Health Care sector, on the other hand, has the lowest ESG scores of the sectors studied.

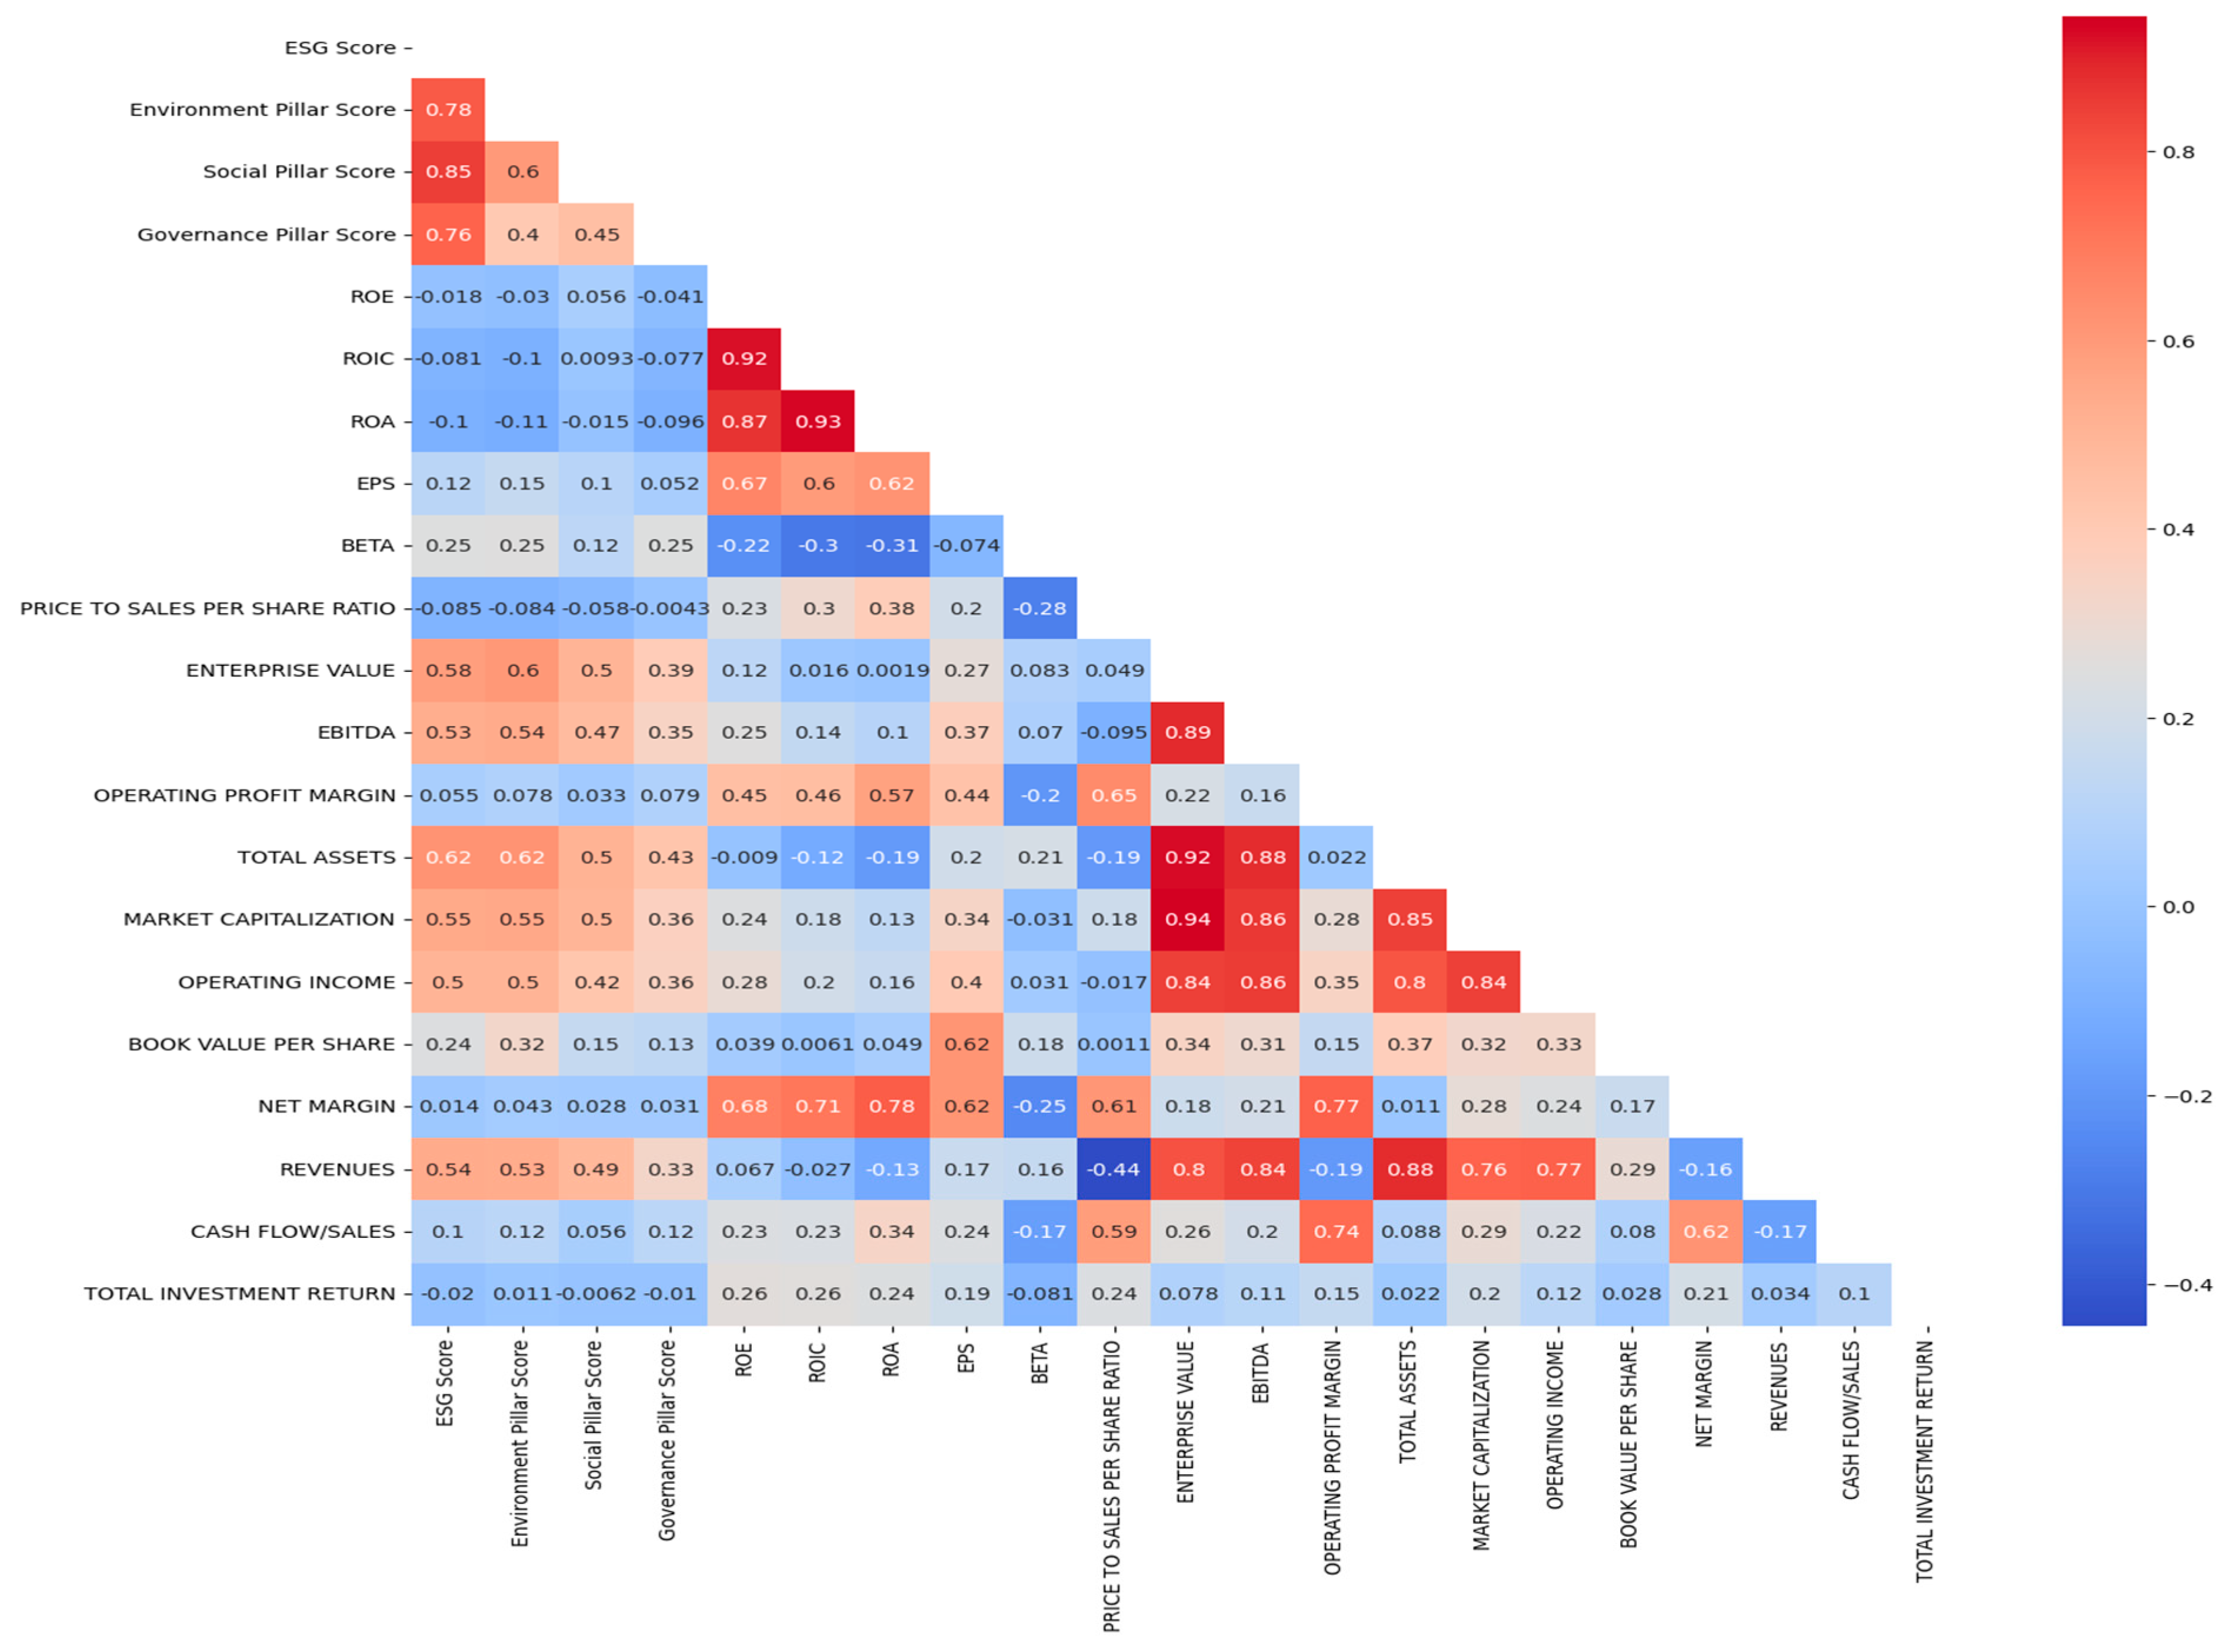
3.4.3. Correlation Analysis

To carry out an analysis of the correlations between the variables studied, we used both Pearson’s correlation to examine linear relationships and Spearman’s correlation to study non-linear relationships.
In Figure 2, positive correlations are shown in blue-green, while negative correlations are shown in brown. The intensity of the colour is proportional to the strength of the correlation. Pearson correlation analysis allows us to identify the variables that are highly correlated with the ESG score, as well as with its E, S, and G components. These variables may prove valuable for our analysis, including revenue, operating profit, market capitalisation, total assets, EBITDA, enterprise value, and BETA. Following our analysis, we can conclude that the majority of the independent variables do not present a significant problem of multicollinearity.
For the Spearman correlation (Figure 3), our analysis reveals significant positive correlations between the independent variables and the ESG scores. For example, we observe significant correlations, particularly in relation to the Pearson correlation, with variables such as sales (0.54), EBITDA (0.53), enterprise value (0.58), total assets (0.62), and market capitalisation (0.55). It is important to note that these correlations, although positive, are non-linear in nature.
So, correlation analysis can be used to detect relationships between a set of variables, while the use of advanced techniques such as ML can capture non-linear patterns and hidden correlations. This allows us to gain a deeper understanding of the complex relationships between variables and ESG scores.

4. Empirical Results and Discussion

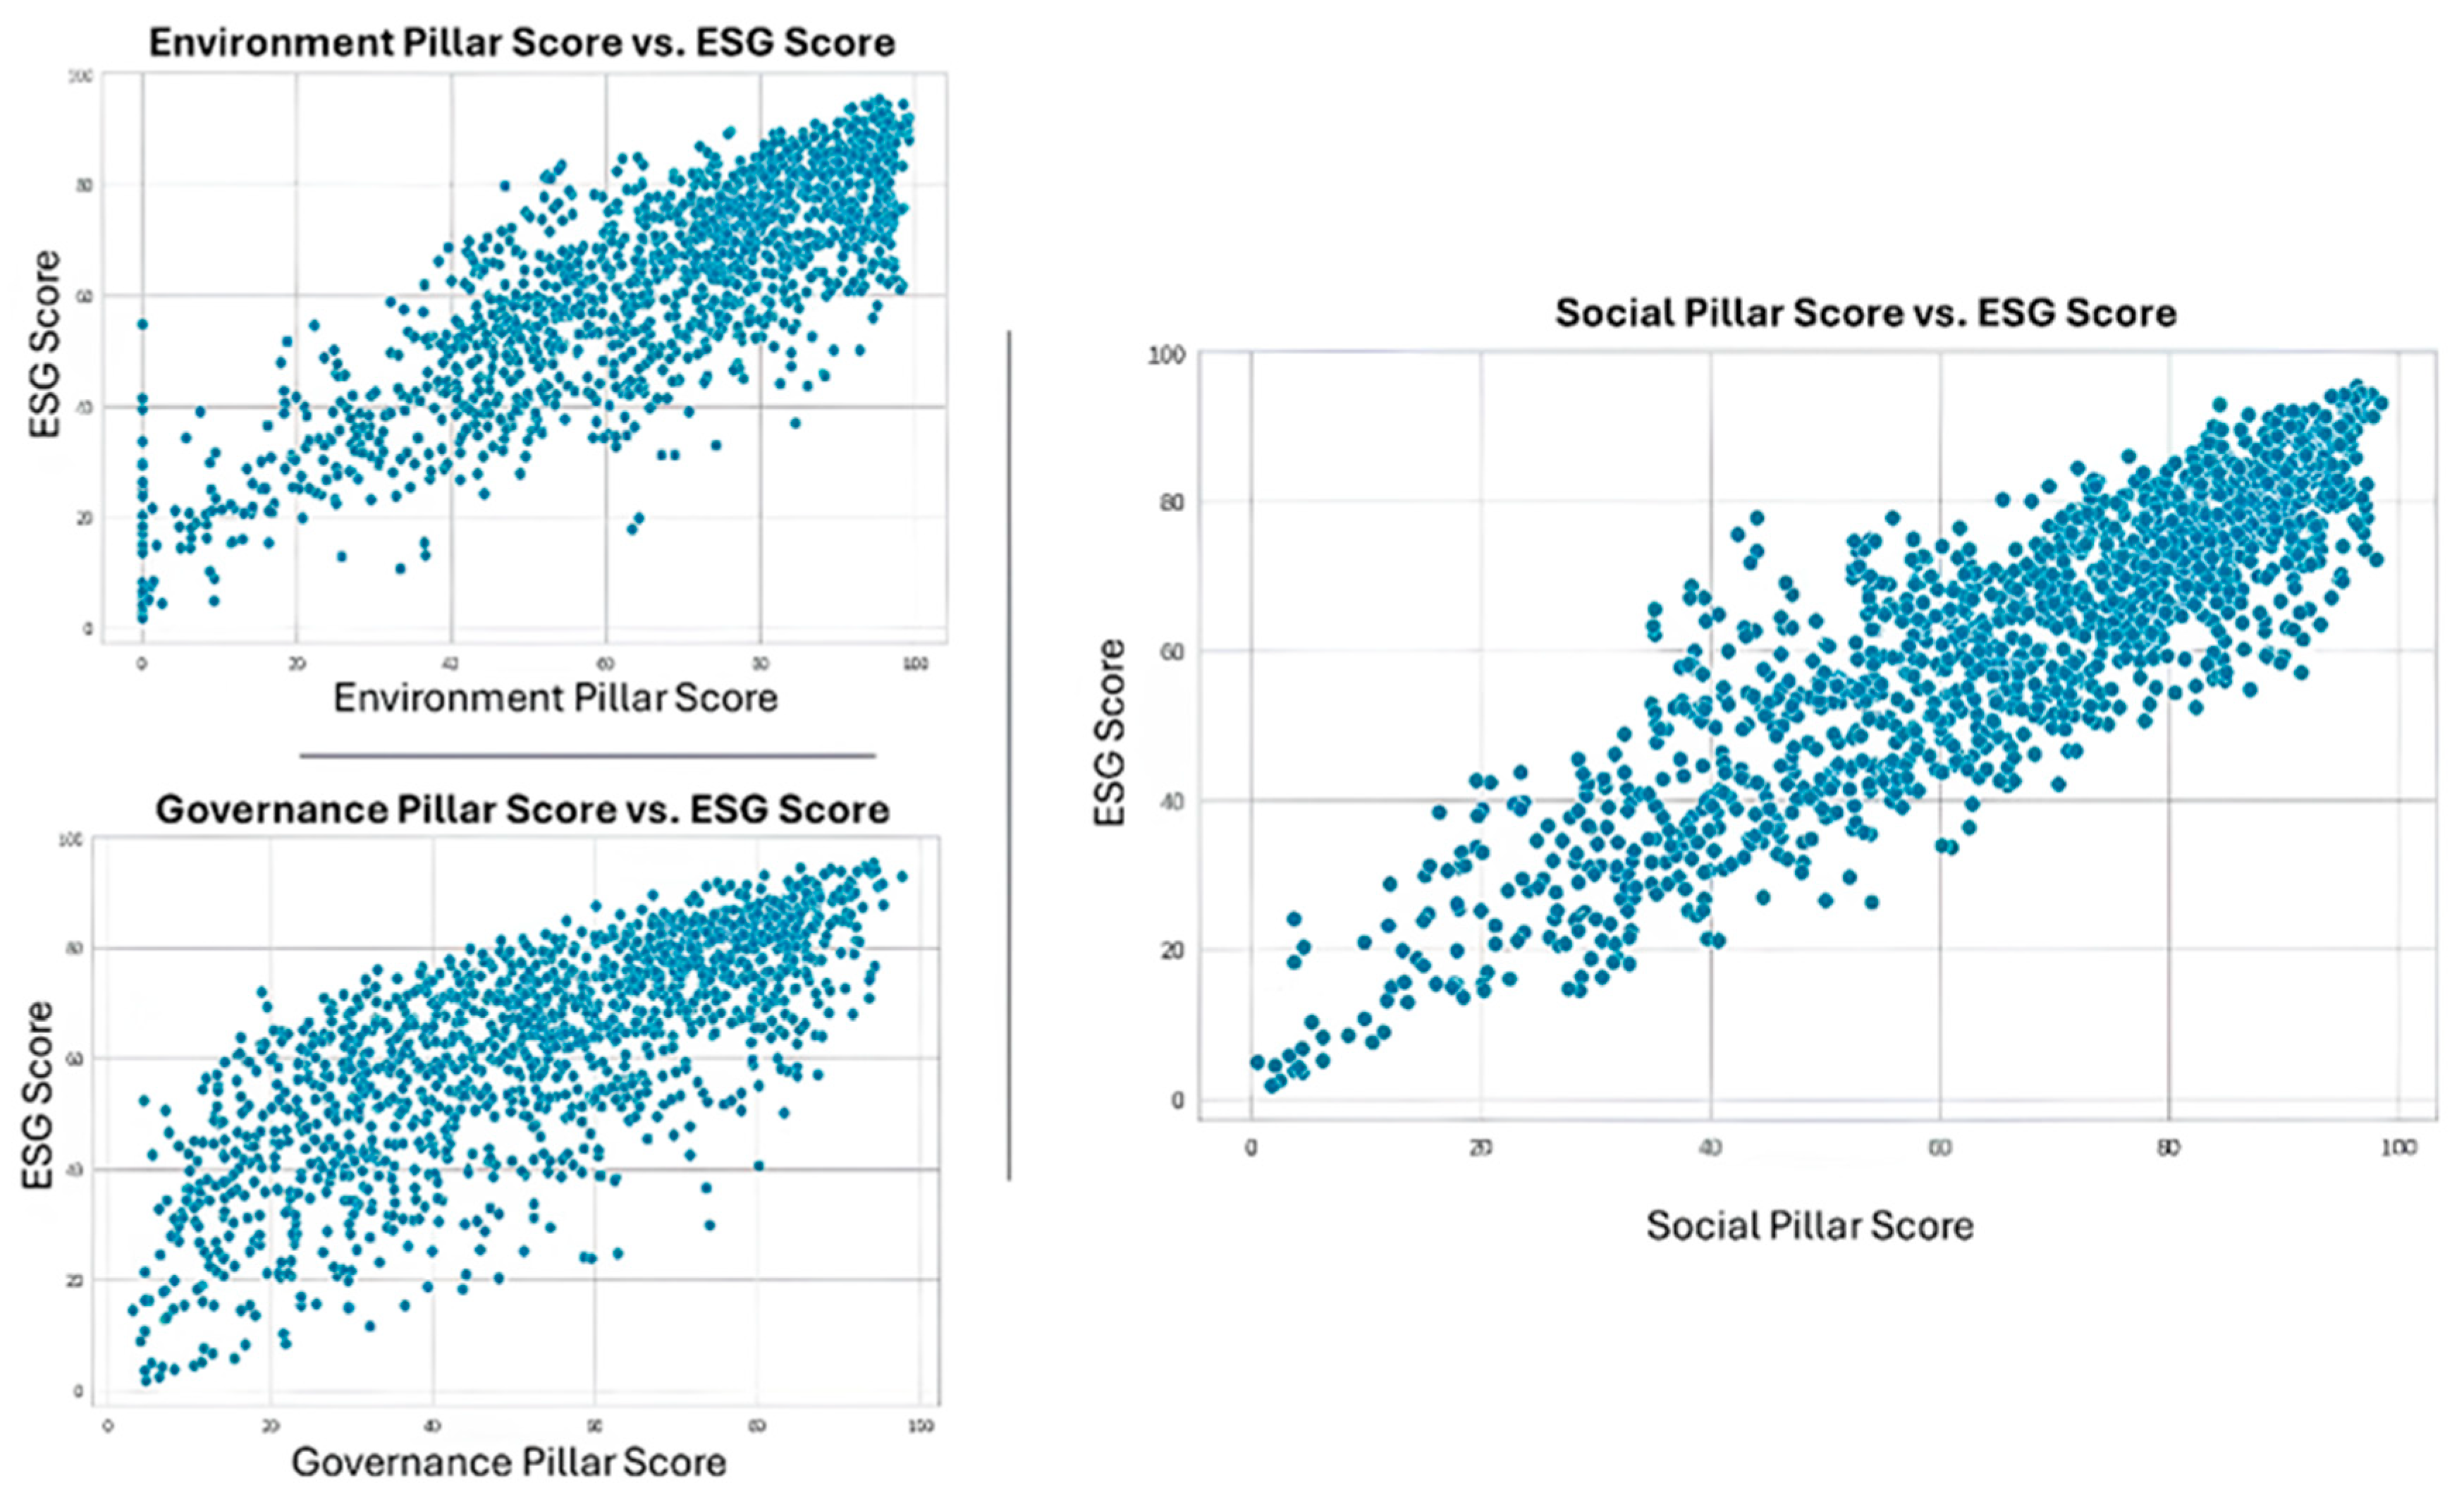
4.1. The Importance of Each Pillar in Determining the ESG Score

In the first phase of our modelling, we undertake a linear regression analysis to assess the individual impact of each environmental, social, and governance component on the overall ESG score. The objective of this approach is to deepen our understanding of the relationship between the overall ESG score and its constituent elements while providing explanatory insight into the overall composition of the ESG score.
Figure 4 shows the scatter plot of each of the variables E, S, and G against the dependent variable ESG score. Overall, the points appear to follow an upward trend, where as the values of E, S and G increase, the value of the ESG variable also increases. This observation suggests a positive linear relationship between these variables. Furthermore, the points are clustered closely around this trend, indicating a stronger correlation between these variables.
In addition, Table 3 below summarises the linear regression performance evaluation. A MSE (Mean Squared Error) of 4.25 means that, on average, the model’s predictions have a squared error of 4.25 units squared. An R2 of 0.98 indicates that the regression model explains 98% of the total variance in the data. Finally, RMSE (Root Mean Squared Error) of 2.060 represents the average of the prediction errors in units of the ESG score.
According to Table 4, ESG Score = 0.27 × Environment Pillar Score + 0.40 × Social Pillar Score + 0.33 × Governance Pillar Score + ε.
We find that the coefficients of the model reveal the positive impact of each variable on the prediction of the target variable. It is notable that the social pillar has a greater influence on the ESG score.
Figure 5 illustrates the density curves for the ESG score and its E, S, and G components. It can be seen from this figure that the density curve for the ESG score is centred around 62.107, displaying a relatively narrow and sharp distribution compared to the other curves. This suggests a significant concentration of observations around the mean ESG score, indicating a degree of consistency in the evaluations.
Thus, the density curve for the S component shows a marked similarity to the curve for the overall ESG score. This similarity suggests that S-component values exert a substantial influence on the overall ESG score, which is consistent with the regression results mentioned above. S-component values therefore appear to play a central role in determining the overall score.
Moreover, the shape of the E-component curve is slightly lower than that of the S component but has a similar overall shape. This suggests that although the E component contributes positively to the overall ESG score, its impact may be slightly less than that of the S component.
On the other hand, the density curve for the G score shows a distinct pattern compared with the other components and the overall score curve. Centred around a lower value than the other components, this curve is also wider, suggesting greater variability in governance assessments within the entities evaluated. This indicates that governance may show greater differences in performance compared with the E and S components.
Furthermore, the density curves reveal significant diversity in the ESG scores and their components. Comparative analysis of these densities sheds more light on the construction of the overall ESG score and the trends specific to each dimension.
Continuing our work, we introduce the second phase of our modelling, which involves the use of ML algorithms. The objective of this stage is to respond to our initial problem by seeking to analyse the influence and impact of financial variables on the ESG scores of the French companies in our database.

4.2. Modelling ESG Scores

The first step in using Machine Learning models is to select the variables that make the best contribution to the creation of predictive models using feature selection techniques.

4.2.1. Variable Selection

We discuss the process of variable selection, which aims to determine the best set of characteristics for creating effective predictive models to better understand and anticipate the phenomena under study. The presence of redundant variables can not only limit the model’s ability to generalise but also have a negative impact on its overall accuracy.
To understand how the different independent variables affect the target variable, it is imperative to determine the importance of each variable. In our study, we used two approaches for this selection. Firstly, correlation analysis, both linear and non-linear, in conjunction with the significance test of relationships at the 5% threshold, enabled us to identify the variables significantly correlated with ESG scores. These included EPS, BETA, enterprise value, EBITDA, total assets, market capitalisation, operating profit, sales, and total return on investments. In parallel, we used the Lasso method (Tibshirani, 1996) for variable selection. This approach led us to identify a set of variables considered to be the most relevant in explaining ESG scores. These variables include BETA, EBITDA, market capitalisation, operating income, P/B ratio, sales, and cash flow.

4.2.2. Comparative Analysis of Model Performance

We used several supervised regression learning algorithms that have been widely employed in previous work. This approach involves using datasets to train the algorithms to accurately predict desired outcomes.
We split the dataset into a training set and a test set using the 80–20% split rule.
In Table 5, we present the results of the RMSE, MAE, and R2 metrics used to evaluate the performance of the ML models we employed to predict ESG scores, namely linear regression, polynomial regression, Random Forest (RF), and SVR. The results indicate that the RF model offers the best performance for predicting the ESG scores of companies compared with the other models and manages to reproduce the Refinitiv scores with the greatest accuracy.
From Table 5, it can be seen the RF model performs considerably better as an ensemble model, capable of capturing non-linear and complex relationships. It was able to explain around 71.60% of the variance in the data. In addition, the RMSE of 9.96 is lower, indicating smaller errors.
This table shows that linear regression, SVR, and polynomial regression performs worse than RF with an R2 of 23.92%, 16.83%, and 13.24%, respectively.
Finally, these indicators suggest that RF explains a large proportion of the variance in the data and makes more accurate predictions with lower mean errors. This remarkable performance is mainly due to the algorithm’s great flexibility and advanced adaptation capability. This ability to adjust effectively to the particularities of the data is clearly reflected in its performance metrics, making it an optimal choice for the study in question.

4.3. Prediction of the ESG Score Using the Random Forest (RF) Algorithm: Robustness Test

In most Machine Learning projects, we train several models on the data and select the one with the best performance. However, optimising hyperparameters plays a crucial role, because once these appropriate values are defined, they can considerably improve the model’s performance.

4.3.1. Optimisation of Model Hyperparameters

To determine the optimal hyperparameters for our RF model, we used GridSearchCV, a method designed to automatically find the most appropriate values for these hyperparameters, avoiding the need to set them manually. This step is of crucial importance, as it is impossible to predict which values will be optimal.
We also applied scikit-learn’s SelectKBest in Python. This feature selection method uses statistical measures to assess the relationship between features and the target variable and then selects the top K features based on their scores, which is particularly useful for large amounts of data. In our case, we selected the top six. This approach reduces the dimensionality of the model, which can improve performance, reduce overfitting, and speed up computation time.
The results in Figure 6, sorted in descending order, highlight the most significant variables identified by the RF model. These variables include net sales, EBITDA, operating profit, market capitalisation, enterprise value, and BETA. These characteristics appear to have a significant influence on the prediction of the target variable.

4.3.2. Performance Evaluation of the RF Model

Table 6 presented below provides the MSE, RMSE, MAE, and R2 values for the ESG score predictions generated by the RF algorithm for both the training set and the test set4.
The MSE with a value of 28.94 indicates that the model errors are on average less dispersed and the model predictions are closer to the actual values. This significant reduction in error is a sign of considerable improvement in the model’s performance. Although slightly higher than for the training set (27.49), it remains relatively low. Also, the RMSE at 5.37 is lower, which is preferable, and shows a significant reduction in error, demonstrating an improvement in the accuracy of the model’s predictions.
In addition, the MAE at 4.19 shows a significant reduction in error compared with previous results before model optimisation. This suggests that the model’s predictions are considerably more accurate. Although slightly higher than the MAE on the training set (3.90), it remains within a reasonable range.
Furthermore, an R2 of 91.75% indicates a remarkable fit of the model to the data. This value, approaching one, indicates that the model explains a large proportion of the variance in the data, marking a significant improvement on previous results (71.60%). This finding also confirms that the model effectively generalises its performance beyond the training set (92.75%).
Overall, these results indicate a significant improvement in the model’s performance. The model has its prediction errors considerably reduced, explains a significant proportion of the variance in the data, and provides more accurate predictions. These measures clearly indicate a better fit between the model and the data.

4.4. Discussion and Interpretation of Modelling Results

In this study, the RF algorithm identified REVENUE as the most influential predictor variable. Turnover plays a crucial role in determining ESG commitment, representing an essential dimension of companies’ overall performance. High sales figures often indicate a company’s solid financial position and can be seen as an indicator of its ability to implement ESG practices. This financial strength is particularly important in the ESG context, where implementing sustainable and responsible practices requires significant investment.
In this context, we test the relationship between sales and ESG score. In order to analyse the relationship between these two variables in detail, we present the values of these variables in a scatter plot (Figure 7).
The points on the graph represent observed values, while the red line corresponds to a method called LOESS (Local Estimation and Smoothing Scatterplot), a form of weighted local regression. This smoothed line is used to fit a curve that follows the general trend of the data points. The aim is to reduce variations, irregularities, or noise in the data set, creating a smoother or more regular version of the original data. This makes it easier to visualise the relationship between sales figures and the ESG score.
The ESG score shows a positive relationship with company turnover (the curve is upwards). This suggests that companies have made significant progress in managing their ESG practices, which has contributed to an improvement in ESG scores. In addition, these companies also appear to be more inclined to disclose more information, which may strengthen their brand image and reputation.
The analysis also reveals a significant and logical correlation between a company’s sales growth and its growing concern for its reputation. It is worth noting that the financial and ESG performance of companies is transforming the dynamics of investment choices in global markets. Furthermore, it has been observed that companies with the highest profit margins also have the highest ESG scores.
In addition, this work revealed significant findings regarding the relationship between ESG scores and a set of other accounting and market-related financial variables. Our model clearly demonstrated a positive and significant relationship between ESG score and EBITDA, operating income, market capitalisation, enterprise value, and BETA. Indeed, these indicators play a central role in the accurate prediction of ESG scores, highlighting their significant influence.
These findings are supported by the empirical results of Drempetic et al. (2019) and Giannarakis (2014) who identified a significant positive correlation between ESG scores and company size, which can be measured by indicators such as turnover or market capitalisation. They emphasised that company size, along with profitability, are among the most relevant explanatory variables. This work confirmed that large companies tend to allocate more resources to improving their ESG scores.
The second important variable for explaining the ESG score, EBITDA, is justified by the study of Weber et al. (2008), who pointed out that ESG performance can have a significant impact on the financial performance of companies, measured in particular by the EBITDA margin. This highlights the relevance of EBITDA as an indicator of financial performance, and consequently its ability to contribute to the prediction of ESG scores.
Furthermore, our model establishes a positive relationship between the ESG score, market capitalisation, and the firm’s beta coefficient, in line with the results of the study by García et al. (2020). This observation suggests that large companies, due to their vast resources, are better positioned to disclose detailed information on their socially responsible initiatives. However, these two market-related variables appear to have the lowest predictive power for ESG scores.
Finally, our results confirm the idea that the size and financial strength of companies can exert a significant positive influence on their ESG ratings, in line with trends observed in previous research. Consequently, this finding reinforces the idea that financial performance is a crucial factor for accurate prediction of ESG scores, confirming the conclusions drawn from the literature review.
Our model reached its peak through careful optimisation, involving the fine-tuning of hyperparameters and the inclusion of the most influential financial variables.
The results of our study highlight the superior predictive performance of the RF algorithm, outperforming linear regression, polynomial regression, and SVR. The RF algorithm demonstrates a notable ability to explain a significant proportion of the variance in ESG scores, highlighting its ability to capture non-linear patterns within predictors.
These findings are consistent with the literature, notably the work of Licari et al. (2021), who used a classical linear regression approach and found unsatisfactory predictive results, with an R2 of only 31.13%. Also, work by Raza et al. (2022), who examined polynomial regression, RF, artificial neural networks, and SVM, highlights RF as suitable choices for predicting ESG scores. Similarly, research by D’Amato et al. (2021a) confirms that RF is the most suitable model for addressing ESG score and financial performance issues. Notably, it should be noted that although polynomial regression has been explored, it has not demonstrated comparable efficacy. This highlights the imperative need for more sophisticated approaches to ESG score prediction.
These results further strengthen the validity of our approach and open up promising prospects for better understanding the mechanisms underlying the complex relationships between financial performance and ESG practices within companies.
Furthermore, it is notable that one finding emerges from our study, namely that companies’ sector of activity does not appear to exert a significant influence on ESG scores. This highlights the fact that, regardless of the sector in which they operate, companies have the capacity to improve their ESG scores by adopting socially responsible practices.

5. Conclusions

The main objective of our study was to develop an efficient prediction model for ESG scores from financial data using Machine Learning methods. To achieve this objective, we explored several regression models, including linear regression, polynomial regression, SVR, and RF, assessing their ability to explain the variance in the data and provide accurate predictions.
Basing on French companies listed in the CAC All-Tradable index, operating in various sectors between 2010 and 2022, our findings highlight the adequate predictive capacity of the financial variables used to accurately assess the relative ESG score of companies.
To achieve our results, we demonstrated the superiority of the Random Forest, RF, model, a supervised ML technique recognised for its superior performance, notably due to its great adaptability to the particularities of the data. After carefully optimising the hyperparameters of this model, the results obtained reinforced our conclusions by demonstrating that the financial variables we examined are valuable tools for predicting ESG scores.
Our paper contributes on several aspects. The use of a modelling approach such as the RF algorithm compared with other methods has enabled us to achieve remarkable results. This model enabled us to recreate Refinitiv’s ESG ratings with an accuracy assessed using measures such as RMSE, MAE and R2, demonstrating its superiority over other methods such as linear regression, polynomial regression, and SVR.
Moreover, this study provides insights and many implications. In fact, predicting ESG scores from financial data has several advantages. Firstly, it simplifies efforts by automating the process, thereby speeding up the availability of ESG ratings. In addition, this approach broadens the scope of ESG ratings by including a greater number of companies that may not be assessed by existing ESG rating agencies. This allows sustainability investors to diversify their portfolios by including companies that are not currently rated by these agencies, that do not produce sustainability reports, as well as new listed companies, thereby contributing to the overall objective of promoting sustainability in the investment sector. Finally, this approach facilitates access to ESG ratings for interested external stakeholders.
This research paves the way for more widespread use of financial information in assessing the sustainability of companies, which can prove invaluable to investors seeking to make informed investment decisions. In addition, it offers companies the opportunity to identify areas where improvements are needed to strengthen their ESG performance.
This paper is a valuable contribution to ESG research, offering a data-driven approach to improve rating reliability. It is recommended for researchers and practitioners interested in sustainable finance and ML applications. Future studies could expand the scope to other regions and incorporate additional ESG-specific metrics.
The conclusions we draw have significant implications for companies, investors, and financial market players, as they help them to assess the sustainability and long-term potential of companies, guiding them towards more informed investment decisions. In addition, these findings can also help companies to identify their ESG strengths and weaknesses, encouraging them to enhance their sustainability and competitiveness while better meeting the expectations of investors and customers.
ESG score modelling is a valuable tool that enhances foresight in the face of future risks and guides the decisions of investors and companies. ESG score prediction also plays a crucial role in promoting growth and sustainable development while strengthening stakeholder confidence. Finally, modelling ESG scores is a key to building a solid, resilient, and socially responsible financial future.
As part of future research perspectives, it is recommended that geographical and institutional specificities be taken into account. This approach can deepen our understanding of geographical and regulatory differences and their implications for companies’ ESG scores.

Author Contributions

Conceptualization, S.B. and S.S.; methodology, S.B. and S.S.; software, S.S.; validation, A.L. and S.B.; formal analysis, S.S.; investigation, S.B., A.L. and S.S.; resources, S.B., A.L. and S.S.; data curation, S.S.; writing—original draft preparation, S.S. and A.L.; writing—review and editing, A.L. and S.B.; visualization, S.B. and A.L.; supervision, A.L.; project administration, S.B. and S.S.; funding acquisition, S.B. and A.L. All authors have read and agreed to the published version of the manuscript.

Funding

This research received no external funding and the APC was funded by authors.

Institutional Review Board Statement

Not applicable.

Informed Consent Statement

Not applicable.

Data Availability Statement

Data is unavailable due to privacy or ethical restrictions.

Conflicts of Interest

The authors declare no conflict of interest.

Notes

1
Nouvelle Régulation Économique means New Economic Regulation.
2
CAC stands for Continuous Assisted Quotation.
3
Results are available on request.
4
These values and the Python code and results are available on request.

References

  1. Agarwala, N., Jana, S., & Sahu, T. N. (2024). ESG disclosures and corporate performance: A non-linear and disaggregated approach. Journal of Cleaner Production, 437, 140517. [Google Scholar] [CrossRef]
  2. Agoraki, M. E. K., Giaka, M., Konstantios, D., & Patsika, V. (2023). Firms’ sustainability, financial performance, and regulatory dynamics: Evidence from European firms. Journal of International Money and Finance, 131, 102785. [Google Scholar] [CrossRef]
  3. Alipour, P., & Bastani, A. F. (2023). Value-at-risk-based portfolio insurance: Performance evaluation and benchmarking against CPPI in a markov-modulated regime-switching market. arXiv, arXiv:2305.12539. [Google Scholar] [CrossRef]
  4. Antoncic, M. (2020). Uncovering hidden signals for sustainable investing using big data: Artificial intelligence, machine learning and natural language processing. Journal of Risk Management in Financial Institutions, 13(2), 106–113. [Google Scholar] [CrossRef]
  5. Baldini, M. M., Maso, L. L. D., Liberatore, G., Mazzi, F., & Terzani, S. (2018). Role of country- and firm-level determinants in environmental, social, and governance disclosure. Journal of Business Ethics, 150(1), 79–98. [Google Scholar] [CrossRef]
  6. Ben Flah, I., Lajmi, A., & Hlioui, Z. (2024). How does innovation moderate the CSR impact on financial performance? An exploratory study and an empirical validation in the Tunisian context. Journal of Financial Reporting and Accounting. ahead-of-print. [Google Scholar] [CrossRef]
  7. Berg, F., Kölbel, J. F., & Rigobón, R. (2022). Aggregate confusion: The divergence of ESG ratings. Review of Finance, 26(6), 1315–1344. [Google Scholar] [CrossRef]
  8. Birindelli, G., Dell’Atti, S., Iannuzzi, A. P., & Savioli, M. (2018). Composition and activity of the board of directors: Impact on ESG performance in the banking system. Sustainability, 10, 4699. [Google Scholar] [CrossRef]
  9. Breuer, W., Müller, T., Rosenbach, D. J., & Salzmann, A. J. (2018). Corporate social Responsibility, investor protection, and Cost of Equity: A cross-country comparison. Journal of Banking and Finance, 96, 34–55. [Google Scholar] [CrossRef]
  10. Charkham, J. (1995). Keeping Good Company: A Study of Corporate Governance in Five Countries (389p). Oxford University Press. [Google Scholar]
  11. Chatterji, A., Durand, R., Levine, D. I., & Touboul, S. (2015). Do ratings of firms converge? Implications for managers, investors and strategy researchers. Strategic Management Journal, 37(8), 1597–1614. [Google Scholar] [CrossRef]
  12. Chen, J., Qian, W., & Huang, J. (2021). Motorcycle ban and traffic safety: Evidence from a quasi-experiment at Zhejiang, China. Journal of Advanced Transportation, 2021, 7552180. [Google Scholar] [CrossRef]
  13. Chen, S., Song, Y., & Gao, P. (2023). Environmental, social, and governance (ESG) performance and financial outcomes: Analyzing the impact of ESG on financial performance. Journal of Environmental Management, 345, 118829. [Google Scholar] [CrossRef]
  14. Chouaibi, S., Chouaibi, J., & Rossi, M. (2022). ESG and corporate financial performance: The mediating role of green innovation: UK common law versus Germany civil law. EuroMed Journal of Business, 17(1), 46–71. [Google Scholar] [CrossRef]
  15. Cui, Y., Geobey, S., Weber, O., & Lin, H. C. (2018). The impact of green lending on credit risk in China. Sustainability, 10(6), 2008. [Google Scholar] [CrossRef]
  16. D’Amato, V., D’Ecclesia, R. L., & Levantesi, S. (2021a). Fundamental ratios as predictors of ESG scores: A machine learning approach. Decisions in Economics and Finance, 44(2), 1087–1110. [Google Scholar] [CrossRef]
  17. D’Amato, V., D’Ecclesia, R. L., & Levantesi, S. (2021b). ESG score prediction through random forest algorithm. Computational Management Science, 19(2), 347–373. [Google Scholar] [CrossRef]
  18. Dimitropoulos, P., Koronios, K., Thrassou, A., & Vrontis, D. (2020). Cash holdings, corporate performance and viability of Greek SMEs: Implications for stakeholder relationship management. EuroMed Journal of Business, 15(3), 333–348. [Google Scholar] [CrossRef]
  19. Doyle, T. M. (2018). Ratings that don’t rate: The subjective world of ESG ratings agencies. ACCF. [Google Scholar]
  20. Drempetic, S., Klein, C., & Zwergel, B. (2019). The influence of firm size on the ESG Score: Corporate Sustainability Ratings under review. Journal of Business Ethics, 167(2), 333–360. [Google Scholar] [CrossRef]
  21. Florian, B., Kölbel, J., & Rigobon, R. (2020). Aggregate confusion: The divergence of ESG ratings. Social Science Research Network, 26(6), 1315–1344. [Google Scholar] [CrossRef]
  22. García, F., González-Bueno, J., Guijarro, F., & Javier, O. (2020). Forecasting the environmental, social, and governance rating of firms by using corporate financial performance variables: A rough set approach. Sustainability, 12(8), 3324. [Google Scholar] [CrossRef]
  23. Giannarakis, G. (2014). The determinants influencing the extent of CSR disclosure. International Journal of Law and Management, 56(5), 393–416. [Google Scholar] [CrossRef]
  24. Guo, T. (2020). ESG RISK: A deep learning framework from ESG news to stock volatility prediction. arXiv, arXiv:2005.02527. [Google Scholar] [CrossRef]
  25. Han, J. J., Kim, H. J., & Yu, J. (2016). Empirical study on relationship between corporate social responsibility and financial performance in Korea. Asian Journal of Sustainability and Social Responsibility, 1, 61–76. [Google Scholar] [CrossRef]
  26. Hoepner, A. G. F., Oikonomou, I., Sautner, Z., Starks, L., & Zhou, X. (2023). ESG shareholder engagement and downside risk. Review of Finance, 28(2), 483–510. [Google Scholar] [CrossRef]
  27. Hu, K. H., Lin, S. J., Liu, J. Y., Chen, F. H., & Chen, S. H. (2018). The Influences of CSR’s Multi-Dimensional Characteristics on Firm Value Determination by a Fusion Approach. Sustainability, 10(11), 3872. [Google Scholar] [CrossRef]
  28. Ilhan, E., Krueger, P., Sautner, Z., & Starks, L. T. (2019). Institutional investors’ views and preferences on climate risk disclosure. Social Science Research Network. [Google Scholar] [CrossRef]
  29. Kim, S., & Yoon, A. (2023). Analyzing active fund managers’ commitment to ESG: Evidence from the United Nations principles for responsible investment. Management Science, 69(2), 741–758. [Google Scholar] [CrossRef]
  30. Li, C., Zhang, L., Huang, J., Xiao, H., & Zhou, Z. (2021). Social responsibility portfolio optimization incorporating ESG criteria. Journal of Management Science and Engineering, 6(1), 75–85. [Google Scholar] [CrossRef]
  31. Li, Y., Gong, M., Zhang, X. Y., & Koh, L. (2018). The impact of environmental, social, and governance disclosure on firm value: The role of CEO power. The British Accounting Review, 50(1), 60–75. [Google Scholar] [CrossRef]
  32. Liao, P. C., Shih, Y. N., Wu, C. L., Zhang, X. L., & Wang, Y. (2018). Does corporate social performance pay back quickly? A longitudinal content analysis on international contractors. Journal of Cleaner Production, 170, 1328–1337. [Google Scholar] [CrossRef]
  33. Licari, J., Loiseau-Aslanidi, O., Piscaglia, S., & Solis Gonzalez, B. (2021). ESG score predictor: Applying a quantitative approach for expanding company coverage. Moody’s anal. Available online: https://www.moodysanalytics.com/-/media/article/2021/esg-score-predictor.pdf (accessed on 25 June 2025).
  34. Lucia, C., Pazienza, P., & Bartlett, M. (2020). Does good ESG lead to better financial performances by firms? Machine learning and logistic regression models of public enterprises in Europe. Sustainability, 12(13), 5317. [Google Scholar] [CrossRef]
  35. Mozes, M., Josman, Z., & Yaniv, E. (2011). Corporate social responsibility organizational identification and motivation. Social Responsability Journal, 7, 310–325. [Google Scholar] [CrossRef]
  36. Ng, A. (2016). The tangibility of the intangibles: What drives banks’ sustainability disclosure in the emerging economies? (p. 120) GEG. [Google Scholar]
  37. Raza, H., Khan, M. A., Mazliham, M. S., Alam, M. M., Aman, N., & Abbas, K. (2022). Applying artificial intelligence techniques for predicting the environment, social, and governance (ESG) pillar score based on balance sheet and income statement data: A case of non-financial companies of USA, UK, and Germany. Frontiers in Environmental Science, 10, 975487. [Google Scholar] [CrossRef]
  38. Sassen, R., Hinze, A., & Hardeck, I. (2016). Impact of ESG factors on firm risk in Europe. Journal of Business Economics, 86(8), 867–904. [Google Scholar] [CrossRef]
  39. Sokolov, A., Mostovoy, J., Ding, J. B., & Seco, L. (2021). Building machine learning systems for automated ESG scoring. Journal of Impact and ESG Investing, 1(3), 39–50. [Google Scholar] [CrossRef]
  40. Spence, M. (1974). Competitive and optimal responses to signals: An analysis of efficiency and distribution. Journal of Economic Theory, 7(3), 296–332. [Google Scholar] [CrossRef]
  41. Tibshirani, T. (1996). Regression shrinkage and selection via the lasso. Journal of the Royal Statistical Society Series B, 58(1), 267–288. [Google Scholar] [CrossRef]
  42. Weber, O., Koellner, T., Habegger, D., Steffensen, H., & Ohnemus, P. (2008). The relation between the GRI indicators and the financial performance of firms. Progress in Industrial Ecology, An International Journal, 5(3), 236. [Google Scholar] [CrossRef]
  43. Yu, G., Liu, Y., Cheng, W., & Lee, C. (2022, January 14–16). Data analysis of ESG stocks in the Chinese stock market based on machine learning. 2022 2nd International Conference on Consumer Electronics and Computer Engineering (ICCECE), Guangzhou, China. [Google Scholar] [CrossRef]
  44. Yuan, X., Li, Z., Xu, J., & Shang, L. (2022). ESG disclosure and corporate financial irregularities—Evidence from Chinese listed firms. Journal of Cleaner Production, 332, 129992. [Google Scholar] [CrossRef]
  45. Zheng, W., Yin, L., Chen, X., Ma, Z., Liu, S., & Yang, B. (2021). Knowledge base graph embedding module design for visual question answering model. Pattern Recognition, 120, 108153. [Google Scholar] [CrossRef]
Figure 1. Average ESG by sector. Authors’ own work.
Jrfm 18 00413 g001
Figure 2. Correlation correlogram (Pearson). Authors’ own work.
Jrfm 18 00413 g002
Figure 3. Correlation correlogram (Spearman). Authors’ own work.
Jrfm 18 00413 g003
Figure 4. Scatter diagram of variables E, S, and G in relation to ESG score. Authors’ own work.
Jrfm 18 00413 g004
Figure 5. Density of variables E, S, G, and ESG. Authors’ own work.
Jrfm 18 00413 g005
Figure 6. Variables selected by the RF algorithm. Authors’ own work.
Jrfm 18 00413 g006
Figure 7. Scatter plot: ESG score vs. sales. Authors’ own work.
Jrfm 18 00413 g007
Table 1. Independent variables.
Accounting IndicatorsMarket Indicators
Return on Equity (ROE)
Return on Capital Employed (ROIC)
Return on Assets (ROA)
Earnings per share (EPS)
Operating profit margin
Sales (REVENUES)
Total Assets
Cash-Flow/Sales
Enterprise Value
EBITDA (Earnings Before Interest, Tax, Depreciation, and Amortisation)
Operating Income
Net Margin
Total Investment Return
BETA (systematic risk factor)
Market Capitalisation
Price to sales per share ratio
Book value per share
Common Indicators
Activity Sector
Environment Pillar Score
Social Pillar Score
Governance Pillar Score
Source: Table by authors.
Table 2. Descriptive statistics.
VariablesObservationsMeanStd. DevMinMax
ESG Score141262.10719.3921.8495.47
Environment Pillar Score141265.69924.403099.16
Social Pillar Score141266.49421.9720.4598.47
Governance Pillar Score141252.66123.3193.0497.73
ROE14122.13215.057−548.99747.057
ROIC14126.45417.438−131.94358.42
ROA14123.5549.464−108.0370.2
EPS14123.18622.018−60.234768.921
BETA14121.1060.535−0.233.1
PRICE TO SALES PER SHARE RATIO14123.05918.221−17.29549.32
ENTERPRISE VALUE14120.7622.102−0.40718.203
EBITDA14120.7771.968−3.57315.438
OPERATING PROFIT MARGIN1412−0.5669.43−163.9715.737
TOTAL ASSETS14122.62910.497−0.30388.066
MARKET CAPITALISATION14120.6681.798−0.38524.939
OPERATING INCOME14120.8042.125−4.91218.627
BOOK VALUE PER SHARE14120.2983.435−43.66874.131
NET MARGIN1412−0.77913.49−233.10539.09
REVENUES14120.7021.529−0.2619.797
CASH FLOW/SALES1412−0.4697.919−139.58412.099
TOTAL INVESTMENT RETURN141210.58735.618−90.16332.91
Source: Table by authors.
Table 3. Evaluation of linear regression performance.
Linear Regression
R20.988
RMSE2.060
MAE1.526
MSE4.250
Source: Table by authors.
Table 4. Linear regression results.
CoefStd ErrTp > |t|[0.0250.975]
Const0.03290.2770.1190.905−0.5100.576
Environment Pillar Score0.27240.00558.2350.0000.2630.282
Social Pillar Score0.40170.00575.8480.0000.3910.412
Governance Pillar Score0.33070.00482.2680.0000.3230.339
Source: Table by authors.
Table 5. Evaluation of the performance of the Machine Learning models used to predict ESG scores.
Linear RegressionRandom Forest (RF)SVRPolynomial Regression (Degree 2)
RMSE16.349.9617.2817.7
MAE13.667.8113.9614.43
R223.92%71.60%16.83%13.24%
Source: Table by authors.
Table 6. Evaluation measures after optimisation of the hyperparameters of the RF model.
Training SampleTest Sample
MSE27.4928.94
RMSE5.245.37
MAE3.904.19
R292.75%91.75%
Source: Table by authors.
Disclaimer/Publisher’s Note: The statements, opinions and data contained in all publications are solely those of the individual author(s) and contributor(s) and not of MDPI and/or the editor(s). MDPI and/or the editor(s) disclaim responsibility for any injury to people or property resulting from any ideas, methods, instructions or products referred to in the content.

