Abstract
The aim of this paper is to empirically investigate the development of the ESG score and, in particular, the respective pillar scores, as well as the data availability based on region, firm size, and business sector within the insurance industry. We also analyze the interrelationships of the ESG score and data availability, focusing on descriptive statistics and correlation analysis. For this purpose, we use data from the London Stock Exchange Group (LSEG), over a period of 13 years (2010–2022). Our results show that region, firm size, and the different core businesses of insurers lead to different developments in ESG scores and data availability. Differences can also be found in the general level of the scores. However, there is no clear pattern in the evolution of ESG scores and data availability. Furthermore, we find significant and strong interrelationships within the ESG score and its data availability. In summary, the findings of this study provide a foundation for improving the interpretation and application of ESG metrics.
1. Introduction
ESG (environmental, social, and governance) data are a very relevant topic at present. Eccles et al. (2011) pointed out that between November 2010 and April 2011, Bloomberg database users very frequently accessed an ESG data point (i.e., “hits”). In total, they found 2.395.230 ESG score hits, indicating great interest already at this time. While the interest in ESG data was already high in 2011, it is even more relevant today, as the issue is strongly reflected in asset allocation. Due to a continuous increase in sustainable investments, 37.9% of total assets under management were sustainable investments by the end of 2022 (see GSIA, 2023), whereby 94% of the investors use ESG rating products at least once a month (see Brock et al., 2023). Hence, ESG data play an important role in investment strategies (see e.g., Amel-Zadeh & Serafeim, 2018).
As this is the case, it is important to strengthen the knowledge of the overall development across the years as well as the understanding of the interaction of the individual pillar scores with each other or with the overall ESG score. On one hand these insights can be used by companies to present themselves more positively in ESG scorings and, thus, make themselves more attractive to investors. On the other hand, investors can use these insights to better understand and use the ESG scores for their own purposes. As investors differentiate within ESG data based on relevance (see Assaf et al., 2024), it is also important for them to understand how the individual ESG components work together. Due to the specifics of insurance companies (e.g., intangible products based on trust, often long contract durations in life insurance, strong regulatory requirements on corporate governance) it is difficult to apply general statements to the insurance industry, which is also reflected in the weighting scheme of the ESG score by the London Stock Exchange Group (LSEG), former REFINITIV (see LSEG, 2024). For these reasons, we aim to shed light on this topic and supplement the current state of the literature with the perspective of the insurance industry which, to the best of our knowledge, has not been accomplished so far. The main contribution of this paper is the empirical investigation of the development of ESG scores and its pillar scores, as well as an analysis of data availability across regions, firm sizes, and business sectors within the insurance industry. Therefore, we provide empirical evidence and practical insights that challenge the status quo of ESG scoring practices. Specifically, the paper seeks to increase transparency and knowledge about ESG evaluation frameworks, particularly in the insurance sector.
In this context, we would also like to take a closer look at data availability and its interaction within the ESG score. Furthermore, when evaluating the impact on data availability, the work of Ioannou and Serafeim (2019b) serves as a pertinent point of reference. In their analysis, they focus on the implications of mandatory reporting at an earlier stage in the process. Utilizing sophisticated econometric methodologies, it has been determined that disclosure regulations exert a favorable influence on the disclosure process, thereby enhancing data availability and even leading to an augmentation in firm valuations. In analyzing data availability, the focus has been on its impact on ESG scores, which has already been conducted across industries in general (see Drempetic et al., 2020; Dobrick et al., 2023), and specifically for the insurance sector (see Brasch & Eckert, 2025), by employing structural equation modeling. An analysis of the evolution of data availability and interdependencies within the data availability of the ESG score or underlying layers has not yet been conducted. Looking at the ESG score and its respective pillar scores for European (cross-industry) companies, Qureshi et al. (2020) show that the environmental and social pillars are more relevant for European companies than the governance pillar, as there is little variation due to the highly regulated European market. In addition, Crespi and Migliavacca (2020) show in their analysis of global financial firms that the respective pillar scores follow independent patterns.
Fostering ESG activities can lead to a competitive advantage for the companies (see Ioannou & Serafeim, 2019a). In order to build an appropriate strategy, it is helpful to understand the interrelationship of the ESG score and the respective pillars. Having a detailed look at the ESG scores by analyzing the respective pillars, Boffo and Patalano (2020) and their world-wide data sample show virtually no deviations of the pillar scores from each other; however, this balance is not maintained when looking at individual regions. Baldini et al. (2018) analyze global ESG disclosure levels1 and show that governance scores highest, followed by social and environmental. Regional differences emerge, as environmental and social dominate in Europe, while in the United States of America (USA), governance is strongest (see e.g., Boffo & Patalano, 2020; Matos et al., 2020; Qureshi et al., 2020). In the banking sector, there is no clear regional pattern (see e.g., Crespi & Migliavacca, 2020; El Khoury et al., 2023; Lupu et al., 2022). In the insurance industry, Brogi et al. (2022) find low ESG awareness across all pillars in 107 U.S. insurers (2010–2018), with governance scoring highest. Most studies on ESG data availability focus on overall scores rather than pillar-level analysis (see e.g., Drempetic et al., 2020; Dobrick et al., 2023; Brasch & Eckert, 2025).
The relationship between ESG pillars and the overall ESG score is a rarely described topic in the academic literature. In terms of disclosure quality, Baldini et al. (2018) reveal a very strong correlation between the environmental as well as the social pillar to the overall ESG disclosure. Governance has the lowest connection, but still a moderate correlation to the overall ESG disclosure. There are also differences in the correlations of the pillars with each other. While environmental and social are highly correlated to each other, their respective connection to governance is not as strong. Looking more closely at the pillar scores, the categories that make up the pillar scores are roughly independent within the pillar, as well as of the other key issues of the remaining pillars (see Giese et al., 2021). When analyzing the relationship between pillar scores and the ESG score, the focus is primarily on the governance pillar, particularly board composition (see, e.g., Aabo & Giorici, 2022; Eccles et al., 2020; Fernandez-Gago et al., 2016). Similar analyses have not yet been performed with respect to the data availability of ESG scores.
According to the findings of Friede et al. (2015) as well as Amel-Zadeh and Serafeim (2018), a company’s focus on the respective ESG pillars may be affected differently by the type of business, operating environment, and/or management composition. Therefore, it is useful to analyze the evolution of pillar and category scores over time in addition to the overall ESG score. In order to deepen the existing understanding of ESG scores, it is also useful to analyze the already established relationship between data availability and ESG score over time (see e.g., Drempetic et al., 2020; Dobrick et al., 2023; Brasch & Eckert, 2025) and to examine interdependencies within the ESG score and the respective data availability. Furthermore, the specifics of the respective industry do have an impact (see e.g., Baldini et al., 2018; Qureshi et al., 2020), making it necessary to analyze the insurance industry with their specific characteristics and, furthermore, to analyze the different core business segments of the insurance industry.
To achieve our main contribution, we obtain the relevant data from the LSEG provider and analyze a 13-year period (from 2010 to 2022) for 80 insurance companies, located in China, Europe, Japan, and the USA. For the analysis of the data availability, we deconstruct the ESG by analyzing the availability of 133 relevant data points, using a binary coding approach to calculate availability ratios for the ESG and its pillar scores. To check our hypotheses, firms are categorized by region, size, and core business using descriptive statistics. Additionally, correlation analysis is applied to examine relationships within the ESG score.
As a limitation of our work, it is important to mention that, that even though the LSEG ESG score is widely used and very transparent in its methodology (see LSEG, 2024) there are still problem with the handling of missing values, consistency over time, and methodology transparency (see e.g., Berg et al., 2021).Furthermore, it is important to mention, that we only focus on one ESG score. As the ESG scores vary considerably (see Berg et al., 2022), further research in this area should focus on other ESG score providers to check for the robustness of our results.
2. Hypotheses Development
In a previous study Brasch and Eckert (2024) found a significant relationship between ESG and corporate financial performance (CFP) for the recent past in the insurance industry using panel data analyses, while there is a general positive relationship between ESG and CFP (see e.g., Friede et al., 2015; Whelan et al., 2021). However, the relationship between the respective ESG pillars and CFP is variable (see e.g., Friede et al., 2015; Qureshi et al., 2020). It is, therefore, useful to also analyze the pillar and category levels (as well as data availability) and to consider the evolution over time.
For a better understanding, it is important for both investors and policymakers seeking to promote sustainable practices globally to know about regional differences in ESG scores and data availability. The regulatory environment plays a critical role in shaping the quality and transparency of ESG data, as companies in regions with stricter reporting standards tend to have more comprehensive and reliable ESG scores (see e.g., Doyle, 2018; Uddin et al., 2023). Furthermore, cultural and institutional differences, as well as economic development and market maturity across regions, can lead to significant variations in ESG data availability, with companies in more developed or sustainability-focused regions being more likely to disclose detailed ESG metrics (see e.g., Mayer & Ducsai, 2023; Barros et al., 2024). This assertion is further substantiated by the institutional theory, which posits that formal (e.g., regulations) and informal (e.g., cultural norms) factors exert influence on corporate entities (see e.g., Campbell, 2007). In addition, Brasch and Eckert (2025) reveal a relationship between the location of headquarters and the availability of ESG data for insurance companies. Our first null hypothesis, based on these considerations, is as follows:
Null Hypothesis 1 (H1):
There is no significant relationship between region and the development of insurance companies’
- (a)
- ESG scores.
- (b)
- ESG data availability.
Rejecting this hypothesis means that there is a significant relationship between region and the development of an insurance company’s ESG scores or/and ESG data availability.
The literature review of Martiny et al. (2024) shows that the connection between firm size and the ESG scores is a frequently viewed topic. On top of that, the availability of data also plays a decisive role, as demonstrated in general by Drempetic et al. (2020) and specifically for the insurance industry by Brasch and Eckert (2025). One common explanation for this is that larger companies have superior resources for sustainability performance measurement in contrast to their smaller counterparts (see e.g., Doyle, 2018; Drempetic et al., 2020; Liang & Renneboog, 2020). The signaling theory posits that the utilization of substantial resources can be interpreted as a favorable indication within the context of the capital market, particularly in instances where targeted environmental, social, and governance (ESG) disclosure is employed (see e.g., Dhaliwal et al., 2011; Hawn & Ioannou, 2016). Another frequent reason is the higher visibility and public pressure on larger companies, leading to more (published) CSR activities (see e.g., Udayasankar, 2008; Hörisch et al., 2015; Baldini et al., 2018). This can be linked to the stakeholder theory, as stakeholder expectations can have influence on the ESG strategies (see e.g., Rodrigue et al., 2013). However, the question of how company size affects the development of scores or the availability of data for insurance companies remains unanswered. Therefore, we state our second null hypothesis, as follows:
Null Hypothesis 2 (H2):
There is no significant relationship between firm size and the development of insurance companies’
- (a)
- ESG scores.
- (b)
- ESG data availability.
Rejecting this hypothesis means that there is a significant relationship between firm size and the development of an insurance company’s ESG scores or/and ESG data availability.
The insurance industry is unique in its business model and the specific regulatory requirements and varies from other business branches. Even within the insurance sector, there are different subsectors that can diverge greatly depending on the basic model (e.g., long-term risks in health insurance or short-term risks in property insurance). Doyle (2018) states that the industry-specific weighting within the ESG score may not fit all companies in that industry, and Brasch and Eckert (2025) found indicators of differences between the different operational core businesses of insurance companies in terms of data availability. As again indicated by the institutional theory, the presence of varied regulatory frameworks within the insurance sector could be a contributing factor to the observed differences in ESG activities. It is, therefore, useful to further explore the development of ESG scores and their data availability within the different core businesses of insurance companies. Hence, we state our third null hypothesis as follows:
Null Hypothesis 3 (H3):
There is no significant relationship between (operating) core business and the development of insurance companies’
- (a)
- ESG scores.
- (b)
- ESG data availability.
Rejecting this hypothesis means that there is a significant relationship between (operating) core business and the development of an insurance company’s ESG scores or/and ESG data availability.
Looking at the relationship between data availability and ESG scores, Drempetic et al. (2020) show that data availability has a positive impact on ESG scores. With respect to the insurance industry, Brasch and Eckert (2025) also confirm this positive influence. However, the question of whether better data availability alone leads to better results, or whether there is actually a change in corporate behavior (towards more sustainability), remains unanswered. Therefore, a counter-sample to the results of Brasch and Eckert (2025) is conducted, considering the criteria examined in H1–H3. The purpose is to examine whether the relationship between data availability and ESG scores is also reflected in the development over time. This leads to our fourth null hypothesis:
Null Hypothesis 4 (H4):
There is no significant relationship between the development of insurance companies’ ESG scores and their respective ESG data availability regarding
- (a)
- region.
- (b)
- firm size.
- (c)
- (operating) core business.
Rejecting this hypothesis means that there is a significant relationship between the development of insurance companies’ ESG scores and their respective ESG data availability regarding region or/and firm size or/and the (operating) core business.
Eccles et al. (2020) as well as Kim and Porter (2022) state that the board has a significant role in the ESG activities of companies. Hence, it makes sense that the board, which is mainly reflected in the management category of the government pillar, influences ESG scorings in general. Furthermore, Giese et al. (2021) identify that the government pillar has the largest impact on stock prices. Therefore, it can also be argued that the pillar and category scores within the ESG score have different relationships with each other or affect the overlying score(s) in different ways. The results of Brasch and Eckert (2025) already point in this direction, as they found a significant direct influence of resources for providing data on data2 availability as well as on the ESG score of insurance companies. As a result, it can be assumed that there are other relationships within the ESG scores. Finally, our fifth null hypothesis as follows:
Null Hypothesis 5 (H5):
With respect to insurance companies, there are no significant interrelationships within the
- (a)
- ESG score.
- (b)
- the data availability of the ESG scores.
Rejecting this hypothesis means that there are significant interrelationships within an insurance company’s ESG score or/and ESG data availability.
3. Data and Research Methodology
In order to test our hypotheses, we use data from the LSEG database, which is widely used in the academic literature according to the literature review of Martiny et al. (2024). We use the same sample of insurance companies as in the work of Brasch and Eckert (2025). The sample focuses on companies whose main business is providing insurance products located in China, Europe, Japan, and the USA, which is also a perfect fit for our research questions. To avoid bias, the sample was adjusted for companies that were too small or had an ESG score of 0 or invalid data, as in Brasch and Eckert (2025). The final sample consists of 80 insurance companies and 867 firm years for the period from 2010 to 20223.
Like the studies of Ehlers et al. (2024), as well as Brasch and Eckert (2025), we focus on deconstructing the ESG score. The LSEG provides all the data points to its ESG database, which enables the calculation of data availability. For our analysis, we focus only on the data availability of ESG score relevant data points, which are 133 out of more than 870 data points in the LSEG’s ESG database. Data points that were missing or contained errors were assigned a value of 0, while those with any valid entry, irrespective of content, were given a value of 1. To determine the data availability rate for each category score, the sum of the assigned values was divided by the total number of data points within that category, which is in line with Brasch and Eckert (2025). This method was also applied to calculate the availability ratios for the pillar scores and the overall ESG score.
The data for testing the hypotheses on region, firm size, and (operating) core business are also drawn from the LSEG database. In terms of regions, we create four categories, namely China and Japan, European countries in the European Union (EU), European countries outside the European Union, and the United States of America. Regarding size, we create three categories, namely small, medium, and large. The first quartile of our sample forms the small category, the second and third quartiles form the medium category, and the fourth quartile forms the large category. With respect to the (operating) core business we refer to the GICS Sub-Industry Name and use four categories (“Life & Health Insurance”, “Multi-line Insurance”, “Property & Casualty Insurance”, and “Reinsurance”), provided by the database. Three companies with the classification “NULL” were manually sorted by us. According to the previous literature with similar analysis objectives (see e.g., Boffo & Patalano, 2020; Lee et al., 2020; Lupu et al., 2022), we use descriptive statistics to test our hypotheses H1–H4. We thereby focus on the graphical comparison between the analyzed data groups over time. Regarding H5, we conduct correlation analysis using the Pearson correlation coefficient for the ESG score, the pillar scores, and the category scores, as well as for their respective data availability, according to the similar analysis of Giese et al. (2021).
4. Results
The results are described in this section and are shown in Figure 1, Figure 2, Figure 3, Figure 4, Figure 5 and Figure 6 as well as Table 1. For more detailed results, the graphs on the development of the respective categories are presented in the Appendix A (see Figure A1, Figure A2, Figure A3, Figure A4, Figure A5, Figure A6, Figure A7, Figure A8, Figure A9, Figure A10, Figure A11, Figure A12, Figure A13, Figure A14, Figure A15, Figure A16, Figure A17 and Figure A18). Figure 1 shows how the ESG score, and the corresponding pillar scores are developed according to the different regional clusters. Figure 1a shows an uptrend for the ESG score across all regions, albeit from different starting points. However, the strength of this upward trend varies, with the insurers located in the EU gaining 20 points over time, while China/Japan’s average ESG score increases by only 10 points. Looking at the environmental score in Figure 1b, there are clear differences between the regions in terms of starting points and development. Although China/Japan and the USA start from a very low base, they reach a similar level to European insurers, albeit from a much higher base, leaving the USA at the bottom of the list by the end of our analyzed period. By contrast, European insurers not domiciled in the EU saw the smallest increase, although it should be noted that they started 2010 from a very strong base. The social score in Figure 1c shows similar trends to the environmental score, although not quite as strong. Again, the European insurers outperform the remaining insurers. It is worth noting that in all regions the human rights category shows a particularly positive development compared to the other categories of the social pillar, although it should be mentioned that the 2010 baseline values are also significantly lower than for the other categories. The picture that emerges for the governance score in Figure 1d is a little different compared to the other two pillar scores. While the general trend is slightly positive, the regions follow different patterns. The development of China/Japan has a negative tendency, while the other regions show a general upward trend. A look at the category scores shows that this is also reflected in the categories of management and shareholders, but not in CSR strategy, where all regions show a significant increase over the years. It is also worth noting that European insurers from non-EU countries come off best in the management category, while they are by far the worst in the shareholders category. In summary, there is a significant relationship between the region in which the insurer is headquartered and ESG scores, as there are significant differences in both the scores achieved and the nature of the development. Based on the analyses of Figure 1a–d described above, we can reject Hypothesis H1a.
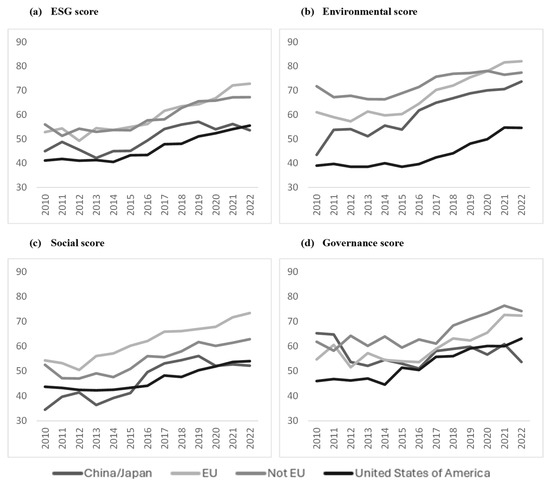
Figure 1.
Development by region of the arithmetic mean—ESG score and pillar scores.
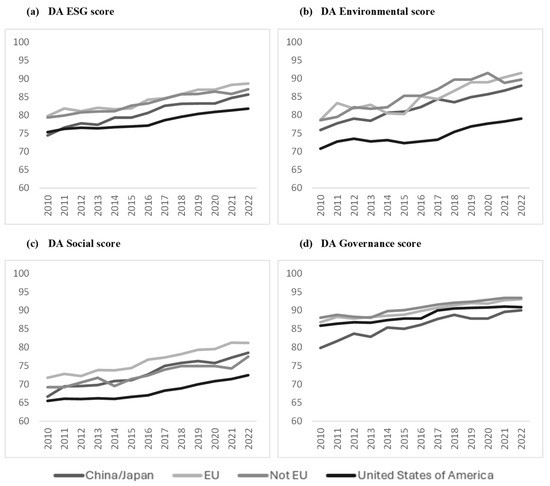
Figure 2.
Development by region of the arithmetic mean in percent—data availability of ESG score and pillar scores.
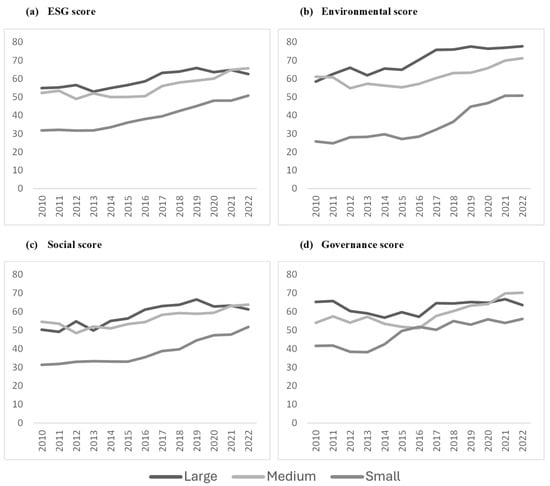
Figure 3.
Development by firm size of the arithmetic mean—ESG score and pillar scores.
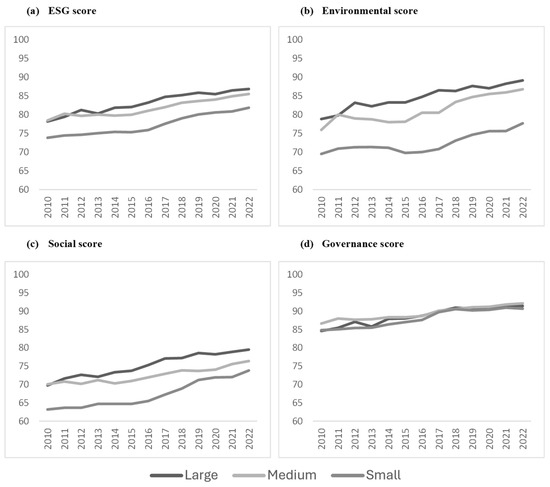
Figure 4.
Development by firm size of the arithmetic mean in percent– data availability (DA) of ESG score and pillar scores.
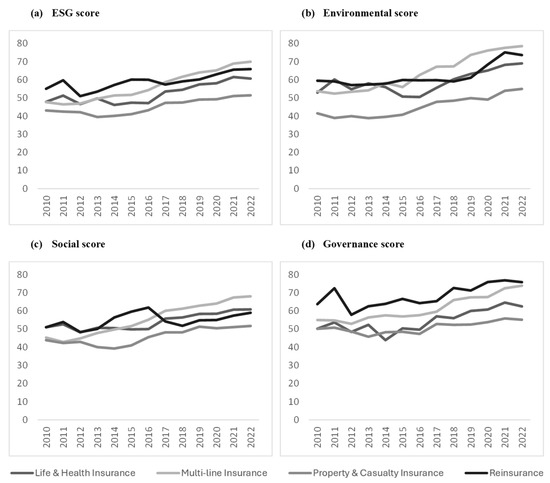
Figure 5.
Development by (operating) core business of the arithmetic mean—ESG score and pillar scores.
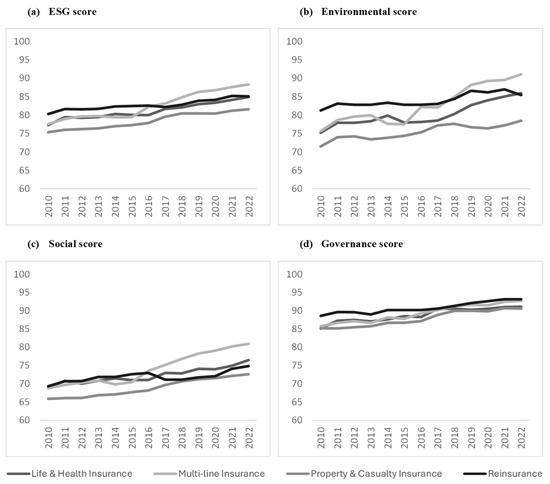
Figure 6.
Development by (operating) core business of the arithmetic mean in percent—data availability (DA) of ESG score and pillar scores.

Table 1.
Correlation matrix ESG score and data availability using the Pearson correlation coefficient.
Figure 2 shows the evolution of data availability for the ESG score and pillar scores by region. In terms of ESG score data availability, we see an almost uniform positive increase across the regions, with different starting points (see Figure 2a). While European insurers show an almost identical trend, insurers from China/Japan start from the lowest value and overtake the USA with the largest increase in data availability (approx. 11 percentage points). In terms of data availability for the environmental scores in Figure 2b, there is also a general upward trend across all regions. While the European insurers as well as China/Japan are close together and show a similar trend, the USA is far behind. The data availability of the social score is the lowest of all three pillar scores (see Figure 2c). Again, data availability is lowest in the USA, while EU-based insurers are at the top. However, the data availability of the governance score is the best of all the pillar scores (see Figure 2d). This time, the insurers of China/Japan have the lowest data availability. This is due to lower scores in the management and shareholders categories. Nevertheless, by the end of the period, they ranked first among EU insurers in the CSR strategy category. This is reflected in the data availability of the governance score, as China/Japan move closer to the other regions but remains in last place, while European insurers maintain their lead. Similar to the ESG scores already considered, data availability can be related with region due to differences in development and levels of availability. Based on the analyses of Figure 2a–d described above, we can reject Hypothesis H1b.
Figure 3 sheds light on the development of the ESG scores divided into different clusters of company sizes. In general, it is immediately apparent that the differences between company sizes are more pronounced than the differences between regions. Looking at Figure 3a, we can see a general upward trend in ESG scores over time for all company sizes. While the large and medium-sized insurers are very close to each other, the smaller insurers have much lower values, although the increase over time is the highest at 19 points. The environmental score shows a similar picture, but the differences between the pillar scores are even larger (see Figure 3b). We see an almost identical picture to the ESG score when we look at the social score in Figure 3c with the large and medium-sized insurers in top position. Looking at the category scores, the human rights scores are significantly lower than the other categories, which are all at a similar level. The governance score (see Figure 3d) shows the closest alignment between the different company sizes. It is remarkable that the large insurance companies do not show an upward trend over time and end up with a neutral development. The analysis of the category scores also shows that there is little difference between company sizes in the shareholders category. However, for the category CSR strategy the differences are much greater, with larger companies scoring higher. Taking into account the above points, there is a clear relationship between the scores and their development as well as the size of the insurance companies. Based on the analyses of Figure 3a–d described above, we reject Hypothesis H2a.
Following the analysis by company size, Figure 4 illustrates the evolution of data availability for the ESG score and the respective pillar scores. Looking at the development of data availability for the ESG score in Figure 4a, we see that the graphs for large and medium-sized insurers are almost identical, with the large insurers having a slight advantage. The evolution of small insurers is also very similar but starts from a slightly lower level. In general, there is a modest positive trend over time for all company sizes. Looking at the environmental score, a similar picture emerges, although the differences between the size clusters are larger. The trend is almost identical for all sizes (see Figure 4b). The general order of data availability for the social score (see Figure 4c) is the same, with the best values for the large insurers and the lowest values for the small insurers. However, a different trend can be seen over time. While large and medium-sized insurers have the same starting point, over time, the large insurers outperform the medium-sized insurers and even the small insurers catch up. The differences between the size clusters are most pronounced in the workforce category. In the other categories, data availability and its evolution are on a very similar level. Looking at data availability within the Governance score in Figure 4d, there are few differences between the sizes of companies, as they are at an almost identical level. This is by far the highest level of the pillar scores, but all still show a slight, steady increase in data availability. This very good situation is also reflected in the category scores. Only the CSR strategy category shows clear differences. Although there is a positive trend in general across all company sizes, the large companies provide the most data, while the small companies have the worst data provision. The above points show that there is sometimes a relationship between company size and data availability and its evolution. However, there are also cases in which the values are almost identical, and no difference can be seen. Based on the analyses of Figure 4a–d described above, we cannot fully reject Hypothesis H2b.
In Figure 5, the insurers are grouped into different clusters based on their (operating) core businesses. The figure shows the evolution of the ESG scores and the corresponding pillar scores. Focusing on the ESG score in Figure 5a, property and casualty insurers start and stay at the bottom, having made the least gains over time. The multi-line insurers start together with the life and health insurers in a shared second place. By showing the greatest growth over time, multi-line insurers achieve the best scores at the end of the period, relegating reinsurers, which started with the best scores, to second place. However, all the different operating core business types have an uptrend over time. A similar picture emerges for the environmental score (see Figure 5b). Again, property and casualty insurers are in last place, with the lowest growth over time, lagging even further behind the other core businesses. Multi-line insurers, which have been the fastest growing over the long term, have once again ousted reinsurers from the top spot.
In Figure 5c, which shows the values and trends of the social score, the graphs are closer together. Once again, however, the property and casualty insurers are not able to leave the last place. This time the reinsurers, which had the best rating at the beginning of the period, are even overtaken by the multi-line insurers and the life and health insurers, ending up in third place. A look at the category scores shows a very diverse picture with different core business types leading the way. For the governance score in Figure 5d, the order at the beginning is also the order at the end of our analysis. All business types have a positive trend, and the property and casualty insurers again end up in last place. The multi-line insurers have once again shown the greatest increase over time, but this time they cannot displace the reinsurers from first place. The difference between the varying trends in the governance score is mainly explained by the score in the CSR strategy category, as this is where the largest differences in the trends prevail. In summary, there are clear differences in terms of the level as well as in terms of the development between the different types of core business of the insurance companies. Based on the analyses of Figure 5a–d) described above, we reject Hypothesis H3a.
Figure 6 displays the data availability of the ESG scores in the insurance industry grouped into different clusters based on their (operating) core businesses. The data availability of the ESG score in Figure 6a shows a similar picture to the ESG scores in Figure 5a, only a little more congested. Also, in terms of data availability, property and casualty insurers again rank lowest. Reinsurers again take the first place in the beginning, but have the lowest evolution over time, and lose the top spot to multi-line insurers, which have the best evolution over time. The rankings and trends in data availability for the Environmental score in Figure 6b are like those in Figure 6a. The gaps between the different types of business are only slightly larger, and reinsurers are even overtaken by life and health insurers, ending up in third place. The social score (see Figure 6c) once again shows the familiar picture of property and casualty insurers at the bottom in terms of data availability. Life and health insurers and reinsurers follow a very similar path over time and end up in the middle of the pack with very comparable values. The multi-line insurers start off in third place but are able to differentiate themselves more strongly from the other business segments from the middle of the period and end up in first place with a larger gap. Focusing on the data availability of the governance score in Figure 6d, we again see that property and casualty insurers are at the bottom of the ranking, while reinsurers remain at the top throughout the period. Nevertheless, the general level of data availability is very high and the gap between the different core businesses is very small. While the data availability in the management and shareholders categories is very similar to the governance score, the differences in the CSR strategy category are much larger. However, this category does not have a significant impact on the data availability in the governance score due to the small number of data points. In summary, there is a relationship between the level and evolution of ESG data availability and the various operating core businesses of insurers. Based on the analyses of Figure 6a–d described above, we can reject Hypothesis H3b.
Comparing the graphs in Figure 1 and Figure 2, we see that the gaps between regions in terms of data availability are visibly smaller than those observed for the ESG score and its pillars. In general, the increase in data availability over time is less pronounced than for the ESG scores, with starting levels consistently higher. A closer look at the ESG scores shows that the region with the largest increase in ESG scores, the EU, also has the largest increase in data availability. The relatively smaller increases in ESG scores for other regions do not necessarily correspond to comparable changes in data availability, as the regions are all operating at a relatively similar level, albeit from different starting points. This is also reflected in the environmental score, where the two regions with the largest increase in the environmental score also show the greatest improvement in data availability, although the relative increase in data availability is significantly smaller. In an interesting twist, the environmental score of European insurers outside the EU increases less than their data availability. There is also no clear pattern in the development of the social score. While the evolution of data availability among European insurers is relatively similar, the evolution of the social score varies significantly. Insurers within the EU are leading the way, while insurers outside the EU are lagging behind. When analyzing the governance score, it is important to bear in mind that the starting level is very high, which may limit the potential for improvement over time. However, there is a paradoxical situation in the China/Japan region, where there is the largest increase in data availability and a negative trend in the governance score. In contrast, European insurers show a less pronounced increase in data availability over time but achieve the largest improvement in the governance score of almost 20 points. Data availability and ESG scores generally exhibit an upward trend. However, no clear or consistent pattern in their joint development can be identified. In fact, there were even instances of divergent trends in their overall trajectories. Based on the analyses of Figure 1 and Figure 2 described above, we cannot reject Hypothesis H4a.
Referring to Figure 3 and Figure 4, the disparities in data availability across different company sizes are noticeably smaller compared to the differences observed in ESG scores and their individual pillars. Again, the increase in data availability over time is less pronounced compared to the growth in ESG scores, because the initial level of data availability remains consistently higher. If we look at the ESG score itself, we see that the trend declines as company size increases, while the trend in data availability remains almost constant across all company sizes. When examining the environmental score, smaller insurers exhibit the most significant increase over time, followed by large insurers, whereas medium-sized insurers demonstrate the smallest improvement. Regarding data availability, differences across company sizes are minimal. However, looking into the category scores, large insurers show slightly better progress than medium and small insurers. Focusing on the social score, smaller insurers are at the forefront of both its development and the data availability. However, the conditions for this development differ once again, with even greater disparities observed in data availability this time. Looking at the evolution of data availability in the governance score, we observe an almost uniform overall trend. However, this trend varies significantly for the governance score by company size, ranging from a neutral to slightly negative trajectory for larger insurers to a significant increase over time for midsize and smaller insurers. Similar to H4a, the data availability and ESG scores generally exhibit an upward trend, but it is not possible to identify a clear or consistent pattern in their joint development. Based on the analyses of Figure 3 and Figure 4 described above, we cannot reject Hypothesis H4b.
Focusing on Figure 5 and Figure 6, we see that the differences in data availability between the different core business areas are smaller than the observed differences in the ESG score as well as their individual Pillar scores, as already observed for region and company size. As with the other two clusters mentioned before, the data availability shows a less pronounced increase in comparison to the ESG scores. Focusing on the ESG score, we see differences in starting points and evolution, while the level and development of data availability across the core business types are very close together. However, the overall trend of ESG scores and data availability is similar across the different core operating businesses, with multi-line insurers moving to the top over time, and property and casualty insurers remaining at the bottom. For the environmental score, the picture is very similar to that just described for the values of the ESG score and its data availability, except that the gaps are more pronounced. Focusing on the social score we again see that the multi-line insurers are in the lead due to the best development over time, which is also true for data availability. The similar trend between score and data availability continues as reinsurers lose their top position and even fall behind life and health insurers. However, property and casualty insurers remain at the bottom in both cases. In addition to the different starting points, there are some parallels between social score and data availability. Looking at the governance score, it is striking that the data availability values are very close to each other, while the governance score shows a much larger discrepancy. Nevertheless, in both cases, the rankings of the operating core businesses are identical, although the development curve for data availability is much flatter over time. In contrast to H4a and H4b, we can clearly see common trends here, although they are not equally evident in all pillar scores. Based on the analyses of Figure 5 and Figure 6 described above, we cannot fully reject H4c.
In the following, we highlight the correlation matrix in Table 1, which shows the Pearson correlation coefficient for the ESG score, the pillar scores, and the category scores, as well as their respective data availability. Looking at the correlation between the pillar scores and the ESG score, we see that there is generally a very strong correlation. The highest correlation is between the social score and the ESG score (0.8790), while the lowest correlation between the governance score and the ESG score is still very strong, with a coefficient of 0.7809. The correlation of data availability shows a similarly significant picture, although the differences are even more pronounced. Once again, the correlation between the social score and the ESG score is the strongest, with a coefficient of 0.9023, while the correlation between the governance score and the ESG score is lower, but still strong (0.6938). Analyzing the interrelationship between the pillar scores, we see that the governance score is moderately correlated with both the environmental (0.4403) and social (0.4171) scores. Furthermore, there is a strong correlation between environmental and social scores, with a coefficient of 0.7645. The correlations between the pillar scores are almost identical in terms of data availability.
Focusing on the correlations between the pillar scores and the category scores, we see that the category scores that make up the environmental score have the strongest correlation to the environmental score. However, the workforce (0.7173) and CSR strategy (0.7754) categories have a similarly strong correlation with this pillar score. Nevertheless, there is only a moderate or weak correlation with the other categories, while there is almost no correlation with the shareholders (0.0941) category. However, when looking at the correlation with respect to the data availability, there are some substantial changes in the correlation coefficients. While resource use (0.9483) and emissions (0.9407) have a very strong correlation, the category of innovation (0.3505) has only a moderate correlation with its corresponding pillar score. Apart from product responsibility, where the correlation falls to very weak with a coefficient of 0.1673, the remaining category scores are similarly correlated with the environmental score.
Looking at the social score, the corresponding category scores are highly correlated. However, in some cases, there is a stronger correlation between the social score and the category scores of the other pillars, such as emissions (0.7517) or CSR strategy (0.7096). Only the management (0.2550) and shareholders (0.1371) categories have a weak correlation with the social score. By looking at the correlation with respect to data availability, we again see some substantial changes. Two of the four categories that make up the social score drop from a strong correlation to a moderate (product responsibility with a coefficient of 0.4122) or weak (human rights with a coefficient of 0.2609) correlation. With the exception of innovation, which drops from a strong to a weak correlation (0.2624), the remaining category scores have similar correlation coefficients with the social score.
There is a surprise when looking at the correlations between the governance score and the corresponding category scores. There is only a very strong correlation with management (0.9327), while shareholders (0.3452) and CSR strategy (0.4754) have only a moderate correlation. Furthermore, the correlations of the other categories with the governance score are only moderate at best. With respect to data availability, the coefficients change slightly again. As the strong correlations become a little weaker and the weaker correlations become a little stronger, the category scores of the governance score move closer together. Despite slight changes, the remaining categories all maintain moderate to weak correlation levels.
When we analyze the correlations between the ESG score and the categories, there are strong correlations in most cases. The three strongest correlations are between CSR strategy (0.7582), emissions (0.7434), workforce (0.7410), and the ESG score. The bottom three correlations are between shareholders (0.2621), community (0.4833), product responsibility (0.6191), and the ESG score. When we switch to data availability, we see some significant changes and generally less strong correlations. The top three correlations with the ESG score are now resource use (0.8768), workforce (0.8586), and emissions (0.8159). The bottom three, all with weak correlations to the ESG score this time, are shareholders (0.2207), management (0.2286), and product responsibility (0.2481). Considering the results in Table 1, most of them show moderate to strong correlations both within the ESG score and in terms of data availability, although they do not follow the same patterns. Based on the analyses of Table 1 described above, we can reject H5a as well as H5b. Overall, Table 2 provides a summary of the results of all our hypothesis tests.
Table 2.
Overview of the results of the hypothesis tests.
5. Discussion
Bissoondoyal-Bheenick et al. (2023) found that larger companies tend to invest more in ESG activities to better meet stakeholder demands. This leads to greater resources to provide ESG data, which, in turn, has a direct positive impact on ESG scores and data availability (see Brasch & Eckert, 2025). Our results confirm that larger insurers have better ESG scores and better data availability, although smaller insurers have seen better development over the last few years and are moving closer to the larger insurance companies. Our findings, therefore, confirm the connection between firm size and the ESG score as well as with its data availability (see e.g., Drempetic et al., 2020; Dobrick et al., 2023; Brasch & Eckert, 2025).
Our results show significant differences in ESG scores and their data availability across the regions analyzed. This is consistent with findings by Liang and Renneboog (2017), who noted that institutional frameworks and stakeholder orientation differ substantially across regions and directly influence ESG performance. In particular, systems that prioritize stakeholder interests, such as those observed in continental Europe, tend to promote higher levels of ESG engagement compared to market-oriented regimes, like those in the USA. Our results regarding ESG scores are in line with Doyle (2018), as European insurers are clearly in the lead. However, differences in data availability are less pronounced, as general sustainability reporting, and, therefore, data availability, is high in the countries we studied (see Threlfall et al., 2020). Our findings are similar to the latest OECD (2024) report, where Europe, China, and Japan lead the way in disclosing information in the financial sector, while the USA lags behind. These regional differences may be due to differences in regulation, as the regulatory framework affects ESG scores (see, e.g., Doyle, 2018). It should also be noted that insurers located in the USA are, on average, the smallest in our sample. Thus, as mentioned in the previous paragraph, firm size may also play a role here, overriding geographic effects. However, it will be interesting to see how the picture changes in the future, as the CSRD4 will affect around 50,000 companies (mainly in the EU), including thousands headquartered outside the EU (see McCalla-Leacy & Gnändiger, 2024). Future regulatory convergence may, thus, reduce the currently observable geographic disparities, a development supported by the global standardization efforts discussed in Kotsantonis and Serafeim (2019).
The findings on the overall level and development of ESG scores across different core business models are somewhat surprising. Property and casualty insurers are lagging behind the other operating core business segments even though this line of business has the seemingly most direct connection to sustainability, especially in the environmental pillar. This is reflected in the fact that environmental changes (e.g., increase in heavy rainfall, flooding, or fires) are increasingly having an impact on insured risks, thus increasing the frequency and severity of losses. However, it is precisely in the environmental pillar that the property and casualty insurers have the weakest performance. This may seem counterintuitive at first, but recent research by Krueger et al. (2020) suggests that industries directly exposed to environmental risks do not necessarily perform better in ESG ratings. Structural complexity, fragmented reporting standards, and short-term financial pressures often impede effective ESG integration. This may also apply to the subsectors in the insurance industry. Again, it should be noted that the insurers in this operating core business segment are the smallest insurers on average compared to the other core business types of the industry. Given that size affects ESG scores, it is possible that the effects of size may overlay the effects of different core businesses, which could be an explanation for the relatively poor performance of property and casualty insurers. Similar effects were also identified by La Torre et al. (2020).
Our results show that there is no or only a partial relationship between the evolution of ESG scores and the evolution of data availability. Thus, the results of Brasch and Eckert (2025) cannot be confirmed. Here, it is important to note that the data availability trends are not fully reliable due to the Boolean indicators5. Changes in data availability over time are only partially shown, as it is not possible to distinguish whether an indicator is missing, or if the topic is not covered by the company. However, when we look at the fundamental levels, we can identify relationships between ESG scores and the respective data availability, similar to the findings of Brasch and Eckert (2025).
Furthermore, our findings are consistent with the results of Baldini et al. (2018), as we can confirm a strong correlation between the environmental as well as the social pillar and the overall ESG score, while governance has the lowest correlation to the overall ESG score. In addition, we are consistent with their findings, i.e., that the environmental and social pillar are highly correlated to each other, while their respective connection to the governance pillar is not as strong. Furthermore, we can confirm that the board plays a significant role in the ESG activities of a company (see, e.g., Eccles et al., 2020; Kim & Porter, 2022), as we find a strong correlation between the management pillar score and the ESG score. The management score is a good approximation for the role of the boards, as it is composed of 35 relevant individual indicators, mainly related to the board and its activities (see LSEG, 2024).
Looking at the categories that make up the pillar scores and their corresponding correlations, we have different results than Giese et al. (2021), who analyzed the MSCI ESG score. While they found that the categories that make up the pillar scores are roughly independent within the pillar as well as with respect to the other pillar scores, we find moderate and even strong correlations between the different categories. This suggests a less modular and more integrated ESG structure within the insurance industry, possibly reflecting the increasing interdependencies of ESG-related risks and stakeholder expectations, as discussed by Serafeim (2020). As there are correlations within the ESG score in the insurance industry, as well as in the availability of data, the overall ESG score is not as meaningful as it might suggest, following the criticism of Doyle (2018).
6. Conclusions
The objective of this paper was to empirically examine the development of the ESG score and the respective pillar scores, as well as the data availability by region, company size, and business sector within the insurance industry. Furthermore, we analyzed the interrelationships of the ESG score and data availability. For this purpose, we analyzed insurance companies from China, Europe, Japan, and the USA, using the ESG data from LSEG, over a period of 13 years (2010–2022). We calculated descriptive statistics and conducted correlation analysis.
Our findings reveal a relationship between the development of the ESG score, the pillar scores, and the respective data availability and the factors of region, firm size, and (operating) core business within the insurance industry. These results underscore the non-uniform nature of ESG reporting and scoring across different segments of the insurance industry. However, no clear relationship regarding the development of the ESG scores and the data availability could be identified, although there appears to be a relationship at the general level. Furthermore, we identified strong interrelationships between ESG scores, pillar scores, category scores, and their respective data availability, suggesting structural dependencies within the scoring framework itself. This is another limiting factor for the meaningfulness of ESG scores (in the insurance sector).
These findings carry several important implications for both practitioners and policymakers. First, insurers, investors, and ESG analysts should interpret ESG scores with caution, as the observed interdependencies and varying data quality across regions and firm types can obscure the true sustainability performance of firms. Overreliance on ESG scores without accounting for data coverage and structural biases may lead to misleading conclusions or suboptimal investment decisions. Second, regulatory bodies and standard-setters should prioritize harmonizing ESG disclosure requirements across jurisdictions, particularly within the insurance industry. The regional disparities and inconsistencies in data availability highlight the need for a globally coordinated ESG reporting framework that ensures comparability and transparency. Lastly, our findings suggest that policy initiatives aimed at enhancing ESG transparency should focus not only on mandating disclosure, but also on improving the consistency, granularity, and methodological clarity of ESG metrics. This is crucial to strengthen the credibility and utility of ESG scores as tools for risk assessment, investment evaluation, and regulatory oversight in the insurance sector.
In summary, our results offer a foundational perspective for improving the interpretation and application of ESG metrics in practice and call for thoughtful regulatory action to address the systemic limitations identified in current ESG scoring practices.
Author Contributions
Conceptualization, T.B. and C.E.; methodology, T.B. and C.E.; software, T.B. and C.E.; validation, T.B. and C.E.; formal analysis, T.B. and C.E.; investigation, T.B. and C.E.; resources, T.B. and C.E.; data curation, T.B. and C.E.; writing—original draft preparation, T.B. and C.E.; writing—review and editing, T.B. and C.E.; visualization, T.B. and C.E.; supervision, T.B. and C.E.; project administration, T.B. and C.E.; funding acquisition, T.B. and C.E. All authors have read and agreed to the published version of the manuscript.
Funding
This research received no external funding.
Institutional Review Board Statement
Not applicable.
Informed Consent Statement
Not applicable.
Data Availability Statement
The data that support the findings of this study are available from the LSEG database, but restrictions apply to the availability of these data, which were used under license for the current study and so are not publicly available. The data are, however, available from the authors upon reasonable request and with the permission of LSEG.
Conflicts of Interest
The authors declare no conflicts of interest.
Appendix A

Figure A1.
Development by region of the arithmetic mean—category scores of the environmental score.

Figure A2.
Development by region of the arithmetic mean—category scores of the social score.

Figure A3.
Development by region of the arithmetic mean—category scores of the governance score.

Figure A4.
Development by region of the arithmetic mean—data availability of the category scores of the environmental score.

Figure A5.
Development by region of the arithmetic mean—data availability of the category scores of the social score.

Figure A6.
Development by region of the arithmetic mean—data availability of the category scores of the governance score.

Figure A7.
Development by firm size of the arithmetic mean—category scores of the environmental score.

Figure A8.
Development by firm size of the arithmetic mean—category scores of the social score.

Figure A9.
Development by firm size of the arithmetic mean—category scores of the governance score.

Figure A10.
Development by firm size of the arithmetic mean—data availability of the category scores of the environmental score.

Figure A11.
Development by firm size of the arithmetic mean—data availability of the category scores of the social score.

Figure A12.
Development by firm size of the arithmetic mean—data availability of the category scores of the governance score.

Figure A13.
Development by (operating) core business of the arithmetic mean—category scores of the environmental score.

Figure A14.
Development by (operating) core business of the arithmetic mean—category scores of the social score.

Figure A15.
Development by (operating) core business of the arithmetic mean—category scores of the governance score.

Figure A16.
Development by (operating) core business of the arithmetic mean—data availability of the category scores of the environmental score.

Figure A17.
Development by (operating) core business of the arithmetic mean—data availability of the category scores of the social score.

Figure A18.
Development by (operating) core business of the arithmetic mean—data availability of the category scores of the governance score.
Notes
| 1 | The ESG disclosure level can be seen as an approximation of the ESG data availability. |
| 2 | The metrics used to present resources for providing data are part of the “CSR strategy” category score. |
| 3 | This is because the ESG database has a significant time lag before it fully reflects a fiscal year. Furthermore, our results become more robust, as the ESG data can change due to updates (see Berg et al., 2021; LSEG, 2024). |
| 4 | Corporate Sustainability Reporting Directive (EU) 2022/2464, which will be effective for the fiscal year 2024 and will gradually expand its scope of application. |
| 5 | For Boolean indicators, there are theoretically no missing values due to the logic of the LSEG (see LSEG, 2024). |
References
- Aabo, T., & Giorici, I. C. (2022). Do female CEOs matter for ESG scores? Global Finance Journal, 56, 1–9. [Google Scholar] [CrossRef]
- Amel-Zadeh, A., & Serafeim, G. (2018). Why and how investors use ESG information: Evidence from a global survey. Financial Analysts Journal, 74(3), 87–103. [Google Scholar] [CrossRef]
- Assaf, C., Monne, J., Harriet, L., & Meunier, L. (2024). ESG investing: Does one score fit all investors’ preferences? Journal of Cleaner Production, 433, 1–10. [Google Scholar] [CrossRef]
- Baldini, M., Dal Maso, L., Liberatore, G., Mazzi, F., & Terzani, S. (2018). Role of country-and firm-level determinants in environmental, social, and governance disclosure. Journal of Business Ethics, 150(1), 79–98. [Google Scholar] [CrossRef]
- Barros, V., Matos, P. V., Sarmento, J. M., & Vieira, P. R. (2024). ESG performance and firms’ business and geographical diversification: An empirical approach. Journal of Business Research, 172, 1–13. [Google Scholar] [CrossRef]
- Berg, F., Fabisik, K., & Sautner, Z. (2021). Is history repeating itself? The (un)predictable past of ESG ratings. In European corporate governance institute—Finance working paper 708/2020 (pp. 1–59). European Corporate Governance Institute. [Google Scholar]
- Berg, F., Kölbel, J. F., & Rigobon, R. (2022). Aggregate confusion: The divergence of ESG ratings. Review of Finance, 26(6), 1315–1344. [Google Scholar] [CrossRef]
- Bissoondoyal-Bheenick, E., Brooks, R., & Do, H. X. (2023). ESG and firm performance: The role of size and media channels. Economic Modelling, 121, 1–19. [Google Scholar] [CrossRef]
- Boffo, R., & Patalano, R. (2020). ESG investing: Practices, progress and challenges. Available online: https://www.oecd.org/finance/ESG-Investing-Practices-Progress-Challenges.pdf (accessed on 6 March 2023).
- Brasch, T., & Eckert, C. (2024). Determinants and Value of Corporate Social Responsibility Management: Empirical evidence from the insurance industry. Risk Management and Insurance Review, 27(3), 313–329. [Google Scholar] [CrossRef]
- Brasch, T., & Eckert, C. (2025). Deconstructing ESG scores: An analysis of LSEG and the insurance industry. In Working paper Coburg university (pp. 1–24). Coburg University. [Google Scholar]
- Brock, E. K., Nelson, J., & Brackley, A. (2023). Rate the raters 2023—ESG ratings at a crossroads. Available online: https://www.erm.com/globalassets/sustainability.com/thinking/pdfs/2023/rate-the-raters-report-april-2023.pdf (accessed on 27 March 2023).
- Brogi, M., Cappiello, A., Lagasio, V., & Santoboni, F. (2022). Determinants of insurance companies’ environmental, social and governance awareness. Corporate Social Responsibility and Environmental Management, 29(5), 1357–1369. [Google Scholar] [CrossRef]
- Campbell, J. L. (2007). Why would corporations behave in socially responsible ways? An institutional theory of corporate social responsibility. The Academy of Management Review, 32(3), 946–967. [Google Scholar] [CrossRef]
- Crespi, F., & Migliavacca, M. (2020). The determinants of ESG rating in the financial industry: The same old story or a different tale? Sustainability, 12(16), 6398. [Google Scholar] [CrossRef]
- Dhaliwal, D. S., Zhen Li, O., Tsang, A., & Yang, Y. G. (2011). Voluntary nonfinancial disclosure and the cost of equity capital: The initiation of corporate social responsibility reporting. The Accounting Review, 86(1), 59–100. [Google Scholar] [CrossRef]
- Dobrick, J., Klein, C., & Zwergel, B. (2023). Size bias in refinitiv ESG data. Finance Research Letters, 55, 1–8. [Google Scholar] [CrossRef]
- Doyle, T. M. (2018). Ratings that don’t rate: The subjective world of ESG ratings agencies. American Council for Capital Formation, 1–17. [Google Scholar]
- Drempetic, S., Klein, C., & Zwergel, B. (2020). The influence of firm size on the ESG score: Corporate sustainability ratings under review. Journal of Business Ethics, 167, 333–360. [Google Scholar] [CrossRef]
- Eccles, R. G., Johnstone-Louis, M., Mayer, C., & Stroehle, J. C. (2020). The board’s role in sustainability. Harvard Business Review, 48–51. [Google Scholar]
- Eccles, R. G., Serafeim, G., & Krzus, M. P. (2011). Market interest in nonfinancial information. Journal of Applied Corporate Finance, 23(4), 113–127. [Google Scholar] [CrossRef]
- Ehlers, T., Elsenhuber, U., Jegarasasingam, A., & Jondeau, E. (2024). Deconstructing ESG scores: Investing at the category score level. Journal of Asset Management, 25, 222–244. [Google Scholar] [CrossRef]
- El Khoury, R., Nasrallah, N., & Alareeni, B. (2023). ESG and financial performance of banks in the MENAT region: Concavity–convexity patterns. Journal of Sustainable Finance & Investment, 13(1), 406–430. [Google Scholar]
- Fernandez-Gago, R., Cabeza-Garcia, L., & Nieto, M. (2016). Corporate social responsibility, board of directors, and firm performance: An analysis of their relationships. Review of Managerial Science, 10(1), 85–104. [Google Scholar] [CrossRef]
- Friede, G., Busch, T., & Bassen, A. (2015). ESG and financial performance: Aggregated evidence from more than 2000 empirical studies. Journal of Sustainable Finance & Investment, 5(4), 210–233. [Google Scholar] [CrossRef]
- Giese, G., Nagy, Z., & Lee, L. (2021). Deconstructing ESG ratings performance: Risk and return for E, S, and G by time horizon, sector, and weighting. The Journal of Portfolio Management, 47(3), 94–111. [Google Scholar] [CrossRef]
- GSIA. (2023). Global sustainable investment review 2022. Available online: https://www.gsi-alliance.org/wp-content/uploads/2023/12/GSIA-Report-2022.pdf (accessed on 7 March 2025).
- Hawn, O., & Ioannou, I. (2016). Mind the Gap: The interplay between external and internal actions in the case if corporate social responsibility. Strategic Management Journal, 37(13), 2569–2588. [Google Scholar] [CrossRef]
- Hörisch, J., Johnson, M. P., & Schaltegger, S. (2015). Implementation of sustainability management and company size: A knowledge-based view. Business Strategy and the Environment, 24(8), 765–779. [Google Scholar] [CrossRef]
- Ioannou, I., & Serafeim, G. (2019a). Corporate sustainability: A strategy? Harvard business school accounting & management unit working paper no. 19-065. Available online: https://ssrn.com/abstract=3312191 (accessed on 14 March 2023).
- Ioannou, I., & Serafeim, G. (2019b). The consequences of mandatory corporate sustainability reporting. In The Oxford handbook of corporate social responsibility: Psychological and organizational (pp. 452–489). Oxford University Press. [Google Scholar]
- Kim, S. K., & Porter, M. (2022). As Asian Companies Add Female Directors, Human Capital Could Benefit. In M. T. Eastman (Ed.), ESG and climate trends to watch for 2023 (pp. 1–70). MSCI ESG Research LLC. [Google Scholar]
- Kotsantonis, S., & Serafeim, G. (2019). Four things no one will tell you about ESG data. Journal of Applied Corporate Finance, 31(2), 50–58. [Google Scholar] [CrossRef]
- Krueger, P., Sautner, Z., & Starks, L. T. (2020). The importance of climate risks for institutional investors. Review of Financial Studies, 33(3), 1067–1111. [Google Scholar] [CrossRef]
- La Torre, M., Mango, F., Cafaro, A., & Leo, S. (2020). Does the ESG index affect stock return? Evidence from the Eurostoxx50. Sustainability, 12(16), 6387. [Google Scholar] [CrossRef]
- Lee, L.-E., Giese, G., & Nagy, Z. (2020). Combining E, S, and G scores: An exploration of alternative weighting schemes. The Journal of Impact & ESG Investing, 1(1), 1–10. [Google Scholar]
- Liang, H., & Renneboog, L. (2017). On the foundations of corporate social responsibility. Journal of Finance, 72(2), 853–910. [Google Scholar] [CrossRef]
- Liang, H., & Renneboog, L. (2020). Corporate Social Responsibility and Sustainable Finance: A Review of the Literature. In European corporate governance institute—Finance working paper No. 701/2020 (pp. 1–37). European Corporate Governance Institute. [Google Scholar]
- LSEG. (2024). Environmental, social and governance scores from LSEG. Available online: https://www.lseg.com/content/dam/data-analytics/en_us/documents/methodology/lseg-esg-scores-methodology.pdf (accessed on 27 March 2025).
- Lupu, I., Hurduzeu, G., & Lupu, R. (2022). How is the ESG reflected in european financial stability? Sustainability, 14(16), 10287. [Google Scholar] [CrossRef]
- Martiny, A., Taglialatela, J., Testa, F., & Iraldo, F. (2024). Determinants of environmental social and governance (ESG) performance: A systematic literature review. Journal of Cleaner Production, 456, 1–25. [Google Scholar] [CrossRef]
- Matos, P. D., Barros, V., & Sarmento, J. M. (2020). Does ESG Affect the Stability of Dividend Policies in Europe? Sustainability, 12(21), 8804. [Google Scholar] [CrossRef]
- Mayer, R., & Ducsai, A. R. (2023). ESG: Credibility Behind the Scores—The Reliability and Transparency of ESG Ratings. Prosperitas, 10(2), 1–14. [Google Scholar] [CrossRef]
- McCalla-Leacy, J., & Gnändiger, J.-H. (2024). The move to mandatory reporting. Survey of sustainability reporting 2024. Available online: https://kpmg.com/content/dam/kpmgsites/xx/pdf/2024/11/the-move-to-mandatory-reporting-web-copy.pdf.coredownload.inline.pdf (accessed on 2 June 2025).
- OECD. (2024). Global corporate sustainability report 2024. Available online: https://www.oecd.org/content/dam/oecd/en/publications/reports/2024/03/global-corporate-sustainability-report-2024_d8e1e8b4/8416b635-en.pdf (accessed on 2 June 2025).
- Qureshi, M. A., Kirkerud, S., Theresa, K., & Ahsan, T. (2020). The Impact of sustainability (environmental, social, and governance) disclosure and board diversity on firm value: The moderating role of industry sensitivity. Business Strategy and the Environment, 29(3), 1199–1214. [Google Scholar] [CrossRef]
- Rodrigue, M., Magnan, M., & Cho, C. H. (2013). Is environmental governance substantive or symbolic? An empirical investigation. Journal of Business Ethics, 114(1), 107–129. [Google Scholar] [CrossRef]
- Serafeim, G. (2020). Social-impact efforts that create real value. Harvard Business Review. Available online: https://hbr.org/2020/09/social-impact-efforts-that-create-real-value (accessed on 23 June 2025).
- Threlfall, R., King, A., Shulman, J., & Bartels, W. (2020). The time has come: The KPMG survey of sustainability reporting 2020. Available online: https://assets.kpmg.com/content/dam/kpmg/xx/pdf/2020/11/the-time-has-come.pdf (accessed on 13 March 2024).
- Udayasankar, K. (2008). Corporate social responsibility and firm size. Journal of Business Ethics, 83, 167–175. [Google Scholar] [CrossRef]
- Uddin, Z., Wu, E., Lee, M., & Mammadov, E. (2023). Regulation drives more corporate climate disclosures, but mind the fine print. In M. Eastman, B. Kaplan, L. Houston, S. K. Kim, & J. Ponder (Eds.), Sustainability and climate trends to watch for 2024 (pp. 1–38). MSCI ESG Research LLC. [Google Scholar]
- Whelan, T., Atz, U., Van Holt, T., & Clark, C. (2021). ESG and financial performance: Uncovering the relationship by aggregating evidence from 1,000 plus studies published between 2015–2020. Available online: https://www.stern.nyu.edu/sites/default/files/assets/documents/NYU-RAM_ESG-Paper_2021%20Rev_0.pdf (accessed on 27 March 2023).
Disclaimer/Publisher’s Note: The statements, opinions and data contained in all publications are solely those of the individual author(s) and contributor(s) and not of MDPI and/or the editor(s). MDPI and/or the editor(s) disclaim responsibility for any injury to people or property resulting from any ideas, methods, instructions or products referred to in the content. |
© 2025 by the authors. Licensee MDPI, Basel, Switzerland. This article is an open access article distributed under the terms and conditions of the Creative Commons Attribution (CC BY) license (https://creativecommons.org/licenses/by/4.0/).