1. Introduction
The topic of corporate social responsibility (CSR) has been of interest since long ago because it aims to elucidate whether a socially accountable company (to its employees, its stakeholders, and the public) is, consequently, more profitable or if being a good corporate citizen harms the bottom line. The new generations of investors are even more aware because there is now more accessibility to company-specific ratings on CSR levels. Many of these increasingly influential ratings are elaborated along the three dimensions originally coined by the United Nations’ Global Compact Initiative (
United Nations, 2004): Environmental, Social and Governance (ESG).
However,
Harper Ho (
2024) argues that the advancement of ESG-related regulation, both domestically and internationally, has ignited intense public debate in the United States and triggered a growing anti-ESG backlash. This criticism has influenced the Securities and Exchange Commission to adopt a cautious stance toward mandating corporate disclosure of ESG practices. As a result, the U.S. lags behind its international counterparts in the implementation of ESG-related investment regulations (
Nchako & Benjamin, 2025). Against this background, the purpose of this study is to explore the relationship between ESG ratings and U.S. stock market returns, as well as their volatility.
While this relationship has been previously explored in the literature, the findings have been inconclusive. Some studies have reported a positive relationship between CSR and stock returns (
Shirasu & Kawakita, 2021); others have found a negative one (
Feng et al., 2022), and some have no relationship at all (
Billio et al., 2021). The absence of definitive findings in previous research also holds true for the connection between CSR and the volatility of stock returns. The literature has reported positive, negative, and neutral relationships between these variables (
Valls-Martínez et al., 2022;
Villarreal-Samaniego et al., 2022;
Zanatto et al., 2023). Thus, the debate on the question “Does it pay to be good?” remains open.
The key contribution of this research is the finding that the change in ESG rating (ΔESG), or “ESG Momentum”, plays a critical role in explaining the impact of ESG activity on stock returns. Moreover, when combined with ESG ratings, modeling returns with ESG Momentum yields interesting results.
Nagy et al. (
2016) introduced the concept of ESG Momentum, defining it as the year-over-year change in a firm’s ESG rating. Their research showed that portfolios concentrating on companies with recent ESG rating improvements consistently outperformed the MSCI World Index, emphasizing the market’s favorable reaction to enhanced ESG practices. Subsequent studies also suggest that rating upgrades and downgrades provide valuable information and significantly influence stock returns (e.g.,
Shanaev & Ghimire, 2022;
Sverner et al., 2023). These results may be explained from the standpoint of behavioral finance as a consequence of herding behavior, the tendency of market participants to initially underreact to changes in ESG scores, or the market’s interpretation of such changes within a broader positive narrative (e.g.,
Gavrilakis & Floros, 2023;
Sverner et al., 2023).
The relationship between stock returns and ESG Momentum could also be explained from the perspective of the Adaptive Markets Hypothesis (
Lo, 2004,
2005), where the change in ESG scores, as an adjustment in the investing environment, triggers a process of investor adaptation to new market conditions (e.g.,
Andersson & Mårtensson, 2019;
Halbritter & Dorfleitner, 2015). Finally, the relationship between stock returns and ESG Momentum could be described from the viewpoint of signaling theory, considering that improvements in ESG scores serve as credible indicators of a firm’s commitment to sustainability, reducing information asymmetry (
Boccaletti & Gucciardi, 2025;
Guidolin et al., 2024).
While there is an increasing amount of literature that explores the relationship between ESG scores and firms’ financial performance in general and stock returns in particular, the ESG Momentum investment approach has been considered only to a limited extent (e.g.,
Chan et al., 2022;
Chen & Yang, 2020;
Guidolin et al., 2024;
Sverner et al., 2023). A similar argument applies to the relationship between ESG scores and stock returns’ volatility, which this research found to have a statistical significance. While that relationship has received some attention in previous research (e.g.,
De Vincentiis, 2024;
Kaiser & Welters, 2019;
Karkowska & Urjasz, 2025), the evidence reported is still inconclusive, and this study’s findings contribute to a better understanding of the role of ESG on risk.
One of our research hypotheses is that ESG scores have a negative relationship with expected returns because lower risk levels imply lower rates of return. Another hypothesis is that changes in ESG scores are positively related to unexpected returns, based on the notion that rising risk results in negative asset price adjustments (i.e., capital losses), whereas decreasing risk leads to capital gains. Our econometric results indicate that there is a negative relationship between ESG scores and stock returns and between ESG Momentum and volatility. Moreover, we find evidence of a positive association between ESG Momentum and returns as well as between ESG scores and volatility.
The remaining sections of the paper are organized as follows:
Section 2 reviews the pertinent literature;
Section 3 describes the data and research methodology;
Section 4 presents the empirical findings;
Section 5 discusses the results; and
Section 6 concludes the paper.
2. Literature Review
There is an increasing number of studies on the relationship between ESG ratings and corporate financial performance, specifically stock returns. Furthermore, research on ESG Momentum has also grown as this concept has attracted increasing attention from both researchers and practitioners. While the literature review in this study remains concise, it highlights the most relevant and recent studies on ESG ratings and ESG Momentum, providing a clear foundation for the present analysis.
The literature offers arguments supporting the positive, neutral, and negative effects of ESG characteristics on a firm’s stock returns, which are often used as a proxy for financial performance. Empirical studies attempting to disentangle these effects yield mixed and inconclusive results. The main argument to explain the evidence of a negative relationship between stock returns and ESG activity is that spending money on ESG projects reduces a firm’s earnings (
Jyoti & Khanna, 2021). In contrast, those reports that find a positive relationship claim that ESG activity eventually increases profits via innovation, client loyalty, employee productivity, enhanced governance, regulatory compliance, and better relationships with all the stakeholders (e.g.,
Carnini et al., 2022;
Xie et al., 2017). Finally, the null relationship between ESG scores and financial performance has been attributed to the divergence in ESG assessments provided by different rating agencies (
Billio et al., 2021).
2.1. Foundations of the ESG–Financial Performance Relationship
Waddock and Graves (
1997) made a first attempt at answering the question “Does it pay to be good?” by trying to identify whether there is a causal relationship between Corporate Social Performance (CSP) and corporate financial performance (CFP) and the direction of that causality. Their results are inconclusive, as they find evidence of a bidirectional relationship between these two variables. They emphasize that further research is necessary to determine whether a clear starting point exists for the virtuous cycles they observe. When a firm performs well financially, slack resources can be invested in CSR activities; hence, the company is able to “do good by doing well”. Alternatively, investing in CSR initiatives may reduce the risk of potential contingencies or help manage some stakeholders’ expectations before they become problematic, allowing a firm to “do well by doing good”. These ideas form the basis of the “good management theory”, as described by
Waddock and Graves (
1997, p. 304). Later research regarding these notions uses either stakeholder theory (
Freeman & Dmytriyev, 2017) or innovation arguments (
Ratajczak & Szutowski, 2016).
Agency theory, brought to prominence by the seminal paper of
Jensen and Meckling (
1976), also supports better firm performance by aligning management and shareholders’ objectives through the Corporate Governance dimension of ESG (
Carnini et al., 2022). However, the opposite relationship is also plausible since externalities may translate into a competitive disadvantage, as suggested by
Friedman (
1970). Also, CSR initiatives imply additional costs that may surpass their benefits (
Mohamed Buallay et al., 2023).
Several studies have shown a negative relationship between ESG scores and firms’ risk
1. Assuming that ESG or CSR projects are risk mitigation, hedging, or insurance activities, their additional costs might have a negative impact on firm performance beyond a conceptual optimum level of philanthropic involvement from the economics of insurance (
Godfrey, 2005;
Huang et al., 2017). However, CSR involves increased costs for companies, and, as a result, shareholders experience diminished returns (
Mohamed Buallay et al., 2023;
Valls-Martínez et al., 2022).
Izzo (
2014) claims that if a connection between CSR and value exists, it might result from a series of benefits that outweigh the structural costs required to carry out a specific CSR policy. In this context, (
Perrini et al., 2011) mapped CSR efforts to drivers of performance and noticed that the outcomes could be grouped into revenue-related (growth opportunities, brand equity, competitive positioning) and cost-related (labor, capital, operational efficiency, risk management) categories. Disentangling specific dimensions of the link between CSP and CFP could offer insights into the variability in results.
The relationship between ESG scores and return volatility (i.e., systematic risk) also deserves careful analysis. If a moderating influence of ESG scores on return volatility exists, as described by
Zhou and Zhou (
2021), it carries important policy implications for governments and offers valuable insights that should be integrated into the decision-making processes of portfolio managers. Several studies on the relationship between ESG scores and returns volatility have found contradictory evidence, which warrants additional research efforts on this issue.
2.2. ESG Scores and Stock Returns
Research on the relationship between ESG scores and stock returns reveals that the evidence is mixed. For example, the panel data study conducted by
Ye et al. (
2022), which examined listed companies across EU member states, found that firms with higher levels of ESG disclosure in their annual reports tended to achieve superior stock returns. Likewise,
Dimson et al. (
2015) conclude that successful ESG efforts are followed by positive abnormal stock returns for U.S. public companies. Similar findings were reported by
Yadav et al. (
2025) for the Indian stock market during the COVID-19 pandemic. In their study on the relationship between CSR and long-term stock performance in Japan,
Shirasu and Kawakita (
2021) report that there is a positive association between CSR actions and long-term stock returns. However, these authors also conclude that, in the short term, investing in CSR does not produce a favorable stock performance. Another study on the relationship between stock market returns, firm risk, and ESG transparency in the Chinese energy sector found a positive association between ESG disclosure and stock returns (
Naseer et al., 2024).
In contrast, other studies have reported a negative relationship between stock returns and ESG ratings. For example,
Feng et al. (
2022) assert that, in the long run, ESG exerts a negative impact on the stock returns of most of the Chinese-listed companies they examined. Furthermore, the results reported by
Villarreal-Samaniego et al. (
2022) imply that sustainable initiatives undertaken during the COVID-19 pandemic led to reduced stock returns for automotive companies; however, larger firms in the industry experienced improved returns associated with higher ESG scores during the pandemic period. According to
Cunha et al. (
2020), who studied a sample of Dow Jones Sustainability Indices (DJSIs) and contrasted their performance with their corresponding market benchmarks for a period of five years (2013–2018), the indices’ performance was not homogeneous, although in some regions the indices obtained “superior risk-adjusted returns”.
Some researchers also report no significant relationship between ESG and stock returns. For instance,
Billio et al. (
2021) found no significant difference in stock price behavior between ESG investments and their non-ESG counterparts. Similarly,
Kaur and Singh (
2021) found no relationship between stock returns and CSR in the case of the Indian steel industry companies and conjecture that this outcome suggests that more active involvement in CSR may lead to higher returns, but only in the long run.
Dinh (
2023) examined the role of ESG factors in returns and risks across short- and medium-term investment horizons, concluding that most short-term ESG portfolios exhibit similar returns following ESG scoring.
2.3. ESG Momentum and Stock Returns
An analysis of ESG momentum quantiles by
Giese et al. (
2019) revealed that firms in the highest ESG momentum quintile significantly outperformed those in the lowest. The authors concluded that improvements in ESG characteristics have increasingly been reflected in higher valuations over time, suggesting that ESG momentum may serve as a valuable financial indicator. In the context of high tracking error global strategies,
Nagy et al. (
2016) examined two ESG approaches: a Tilt strategy using current ESG scores and a Momentum strategy based on score changes. Both outperformed the MSCI World Index, driven mainly by ESG-related stock-specific factors, especially in the Momentum strategy and some systematic influences like a mid-cap bias. The Tilt strategy favored low-volatility stocks, while the Momentum strategy focused on those with positive price trends.
The results of the study performed by
Consolandi et al. (
2022), based on a large sample of Russell 3000 companies, show that while ESG Momentum has a consistent effect on equity performance, the market rewards those companies operating in industries with a high level of concentration of ESG materiality, as defined by the Sustainability Accounting Standards Board (SASB). The authors conclude that the equity premium of publicly traded firms is more effectively explained by the degree of concentration in material ESG issues than by changes in ESG scores. Additionally, a study of the Taiwanese stock market revealed that investors tend to systematically overreact to corporate ESG disclosures, a behavioral bias that contributes to the formation of momentum effects in stock returns (
Chen & Yang, 2020). The authors found that the ESG Momentum strategy yields higher profits in Taiwan but not in Japan. They also observed that investors respond optimistically to positive news about high-ESG companies and pessimistically to negative news about low-ESG companies.
By constructing an ESG Momentum factor using the methodology outlined by
Fama and French (
1993) and using monthly data from June 2014 to June 2021,
Sverner et al. (
2023) tested the hypothesis that variations in ESG scores significantly influence stock returns. Their results showed excess returns for a portfolio long on stocks with the highest ESG upgrades and short on those with the largest downgrades, suggesting ESG improvements boost stock prices. However, these findings lose statistical significance when using the generalized method of moments (GMM).
Research using the calendar-time portfolio methodology to examine the impact of ESG rating changes on the stock returns of U.S. firms from 2016 to 2021 found that, while ESG rating upgrades led to positive but inconsistently significant abnormal monthly returns, downgrades resulted in significantly negative risk-adjusted monthly returns (
Shanaev & Ghimire, 2022).
2.4. ESG Through the Lens of Market Efficiency, Behavioral Biases, and Market Adaptiveness
2.4.1. ESG and the Efficient Market Hypothesis
The literature has explored the relationship between ESG and corporate financial performance from the standpoints of the Efficient Market Hypothesis (EMH), behavioral finance, and the Adaptive Markets Hypothesis (AMH). Unlike traditional investment, ESG investment should reflect a company’s efforts regarding corporate social responsibility concerns, often reflected in non-financial information, into the investment decision-making process. Nevertheless, it remains uncertain whether the information from each environmental, social, and governance stakeholder is efficiently reflected in a company’s stock prices.
Nakajima (
2021) claims that, in the distant future, ESG information that affects corporate value may be properly reflected in stock prices.
Al Amosh (
2024) examined how exchange rate volatility affects ESG performance by applying the generalized method of moments. The author concludes that, from the perspective of the Efficient Market Hypothesis, ESG outcomes are influenced by exchange rate volatility, which introduces additional risks and uncertainties that the market reflects in corporate valuations and performance metrics. Similarly, a study by
Naeem et al. (
2022) explored the comparative asymmetric efficiency of dirty and clean energy markets before and during the COVID-19 crisis and found superior efficiency in clean energy markets compared to conventional ones.
2.4.2. ESG and Behavioral Finance
Several studies have examined the complex relationship between investor behavior and ESG performance (e.g.,
Chen & Yang, 2020;
Gupta & Goswami, 2024). In an empirical analysis of European firms,
Gavrilakis and Floros (
2023) considered the relationship between several factors, including ESG scores and stock performance. Their results show a significant negative ESG–return correlation only in Italy. Additionally, the study found evidence that ESG considerations motivate herding behavior in Greece and France, with similar ESG-driven herding observed during the COVID-19 period in Greece, Italy, and Portugal. In a related study,
Gavrilakis and Floros (
2024) found that European ESG leaders’ portfolios favor large-cap, value stocks with strong profitability and avoid aggressive investments, an outcome they interpret as evidence of herding behavior. Similarly, in a study of the dynamics of ESG performance and the role of herding behavior among European banks,
Wang (
2023) found that institutions with lower return on equity and leverage tend to engage in herding behavior aimed at enhancing ESG performance, particularly by prioritizing sustainability objectives and strengthening ties with local communities.
Gupta and Goswami (
2024) investigated how behavioral biases, including herding behavior, overconfidence, and responses to ESG-related news, affect socially responsible investment (SRI) decisions within the Indian market. The authors found that peer advice, popular stocks, and responses to extreme ESG events drive greater SRI engagement, with women showing a stronger preference for these investments compared to men. Furthermore,
Lu et al. (
2024) conclude that although ESG investors generally obtain comparatively lower returns than others, sophisticated investors, who are not influenced by common investment biases, can help moderate these lower returns.
2.4.3. ESG and the Adaptive Markets Hypothesis
The Adaptive Markets Hypothesis builds on concepts from bounded rationality, evolutionary biology, evolutionary psychology, behavioral ecology, and complex systems theory (
Lim & Brooks, 2006). Within this framework, the AMH perspective offers an alternative framework to EMH and behavioral finance in examining the relationship between ESG scores and risk-adjusted returns.
Andersson and Mårtensson (
2019) examined the performance of ESG portfolio investing by comparing the best-effort and best-in-class approaches. The authors reported statistically significant alphas at the 10% level for two best-in-class governance portfolios. These results are consistent with earlier findings reported by
Halbritter and Dorfleitner (
2015). However, while earlier studies documented positive and significant risk-adjusted returns for best-in-class ESG portfolios, more recent research has struggled to replicate these results.
Andersson and Mårtensson (
2019) argue that investors must undergo a process described by the AMH to accurately price time-varying levels of ESG performance. In addition,
Naeem et al. (
2023) concluded that the pandemic reduced market efficiency in ESG investments globally, except in Europe, which maintained its efficiency throughout the crisis, a finding consistent with the AMH.
2.5. ESG Scores and Volatility of Returns
Regarding the relationship between ESG scores and stock return volatility, the literature is relatively abundant but presents mixed findings. However, most studies suggest that better ESG performance tends to reduce the riskiness of stock returns. For example,
Nguyen and Nguyen (
2015) investigated the relationship between CSR individual firm indicators and a firm’s riskiness and concluded that there seems to be a weak negative relationship between CSR and risk. This evidence implies that corporate social responsibility efforts can act as a buffer against the adverse effects of negative environmental circumstances. A remarkable note in their empirical findings is that CSR strengths in the areas of diversity and employee relations are linked to an elevated level of risk borne by shareholders. According to the authors, that relationship highlights the underlying conflict between different groups of stakeholders in the firm.
A study conducted by
Zanatto et al. (
2023) assessed the impact of both positive and negative ESG news on the volatility of the Portuguese stock market across different phases of the business cycle. The results indicated that ESG news serves to reduce stock return volatility during periods of economic stability. However, evidence from periods of slower economic growth indicates that neither positive nor negative ESG news significantly influenced return volatility. The empirical exploration of asymmetric volatility in ESG investments was introduced by
Sabbaghi (
2022), who examined the differential impact of positive and negative news on the risk profile of stocks issued by ESG-oriented firms. The author reports evidence that the impact of bad news on volatility is larger than the impact of good news. Interestingly, the findings reveal that the resulting increases in volatility are less pronounced for small-cap firms compared to their medium- and large-cap counterparts. Similarly,
Naseer et al. (
2024) found a negative relationship between firm risk and ESG disclosure, implying that companies with greater ESG transparency tend to face lower risk exposure.
The study conducted by
Valls-Martínez et al. (
2022) reported that U.S. companies that exhibit higher CSR ratings usually have beta coefficients below the market index beta and lower volatility than the market average. However, that relationship was not validated for European markets.
Adascalitei (
2015) concluded that companies that lack transparency about their social corporate performance exhibit greater stock price volatility compared to socially responsible companies. An analysis of a sample of U.S. banks revealed a significant positive association between CSR and stock price volatility (
Tasnia et al., 2021). The authors suggest that this finding implies shareholders tend to limit their exposure to CSR-oriented stocks, likely due to the additional costs associated with implementing CSR practices.
The study performed by
Gao et al. (
2022) empirically assessed the impact of ESG ratings on stock price crash risk and found that companies with higher ESG ratings are less susceptible to stock price crashes. The authors tested the robustness of their results by replacing variables, employing various statistical methods, controlling for extraordinary events, and using instrumental variables, with the findings remaining largely consistent. Interestingly, they also found that the effect of ESG is more pronounced in cities where there is less focus on environmental protection.
Zhou and Zhou (
2021) used ESG ratings to empirically test their impact on firms’ stock prices during the stock market turbulent period originated by the COVID-19 pandemic. They found that firms with strong ESG ratings demonstrated greater stability during the pandemic, with lower stock price volatility compared to others. Despite the extraordinary market turbulence caused by the health crisis, the price volatility of firms with high ESG ratings remained relatively low. Based on their results, these authors propose “relevant policy recommendations” for different interested parties.
Shakil (
2022) studied the influence of ESG stock price volatility for firms in the textiles and apparel industry and explored the moderating role of firm size on that relationship. The findings reported suggest that there is a significant negative influence of ESG on stock price volatility and that firm size does not have a significant moderating effect on that relationship.
The results reported by
Aldieri et al. (
2023) indicate that market performance in terms of risk is not distinctly influenced by high or low ESG ratings among the first twenty-five firms listed in the S&P 500 index. In contrast, the study by
Dinh (
2023) on the impact of ESG factors on risk and return across short- and medium-term investment horizons concluded that, after ESG scoring, most short-term ESG portfolios showed reduced risk levels compared to their pre-scoring state. Furthermore, the analysis found that, in the short term, a greater number of ESG portfolios exhibited risk profiles distinct from those of non-ESG portfolios compared to the medium term.
In summary, empirical studies have reported positive, negative, and neutral relationships between ESG activities and stock returns. The literature draws on various theories to explain these mixed findings, including the Efficient Market Hypothesis, behavioral finance, the Adaptive Markets Hypothesis, and stakeholder theory. Importantly for our study, evidence suggests that improvements in ESG performance or in ESG Momentum may be more predictive of positive stock returns than static ESG scores alone.
3. Research Hypothesis and Methods
From the literature review, the research hypothesis of this paper is that ESG and ESG Momentum (ΔESG) have an impact on stock returns and volatility. Following
Nagy et al. (
2016), ESG Momentum is defined as the year-over-year change in a firm’s ESG rating. Specifically, the research hypotheses of the study are the following:
H1: ESG scores and stock returns are negatively related.
H2: ESG scores and stock return volatility are negatively related.
H3: ΔESG and stock returns are positively related.
H4: ΔESG and stock return volatility are negatively related.
The study employs quarterly data and includes a sample of 3856 stocks listed on U.S. exchanges, along with their corresponding ESG ratings. The sample period begins in December 2002, aligning with the start of LSEG Asset4’s data coverage, and extends over 20 years through December 2022. The sampling strategy involved using all available data to enhance the comprehensiveness of the analysis. Moreover, since Asset4’s coverage has gradually expanded over time, and firms receiving an initial ESG rating may have an incentive to improve it, we deemed it appropriate to incorporate the full historical dataset. Specifically, we considered that the broader the historical scope, the greater the number of ESG rating changes that could be included as observations. The data were gathered from LSEG’s Eikon platform
2. To mitigate survivorship bias, the study includes all active, publicly traded stocks with a primary listing in the United States (Exchange Country Code “US”). Additionally, the sample was restricted to companies with a minimum market capitalization of USD 250 million, thereby excluding low-capitalization firms.
We employ a multi-factor model with panel data to analyze the impact of ESG on a firm’s financial performance. As described in
Table 1, our model includes the ESG score as the variable of interest, along with several explanatory variables of stock returns that have been identified by seminal papers in the literature (
Carhart, 1997;
Fama & French, 1993,
2015). The innovation proposed in this research is the inclusion of ESG Momentum (Δ
ESG) as an additional explanatory variable. Our multi-factor model is represented in Equations (1) and (2) below:
The literature asserts that increased brand equity, client loyalty, employee productivity, better supply chain relationships, and other “good management” practices, which positively influence ESG scores, also end up improving the company’s financial performance and stock returns (
Ayuso et al., 2014;
Berman et al., 1999;
Xie et al., 2017). However, we propose that this positive impact on stock returns happens only the moment a company is either included in an ESG index or undergoes an improvement in its ESG score. That is, we put forward that a crucial determinant of the impact of ESG practices on stock returns is ESG Momentum (Δ
ESG) instead of the ESG score itself. Furthermore, we consider that the discrepancies found in the literature regarding whether the impact of ESG on stock returns is positive or negative can be attributed to the choice of ESG levels rather than the change in ESG scores as the independent variable of interest.
Maintaining or increasing ESG ratings requires additional cash outlays that might not be otherwise incurred, and these disbursements tend to lessen stock returns. At the same time, cash outlays on ESG actions help mitigate a variety of risks, and therefore, the lower risk argument is another explanation of the relationship between higher ESG levels and lower stock returns.
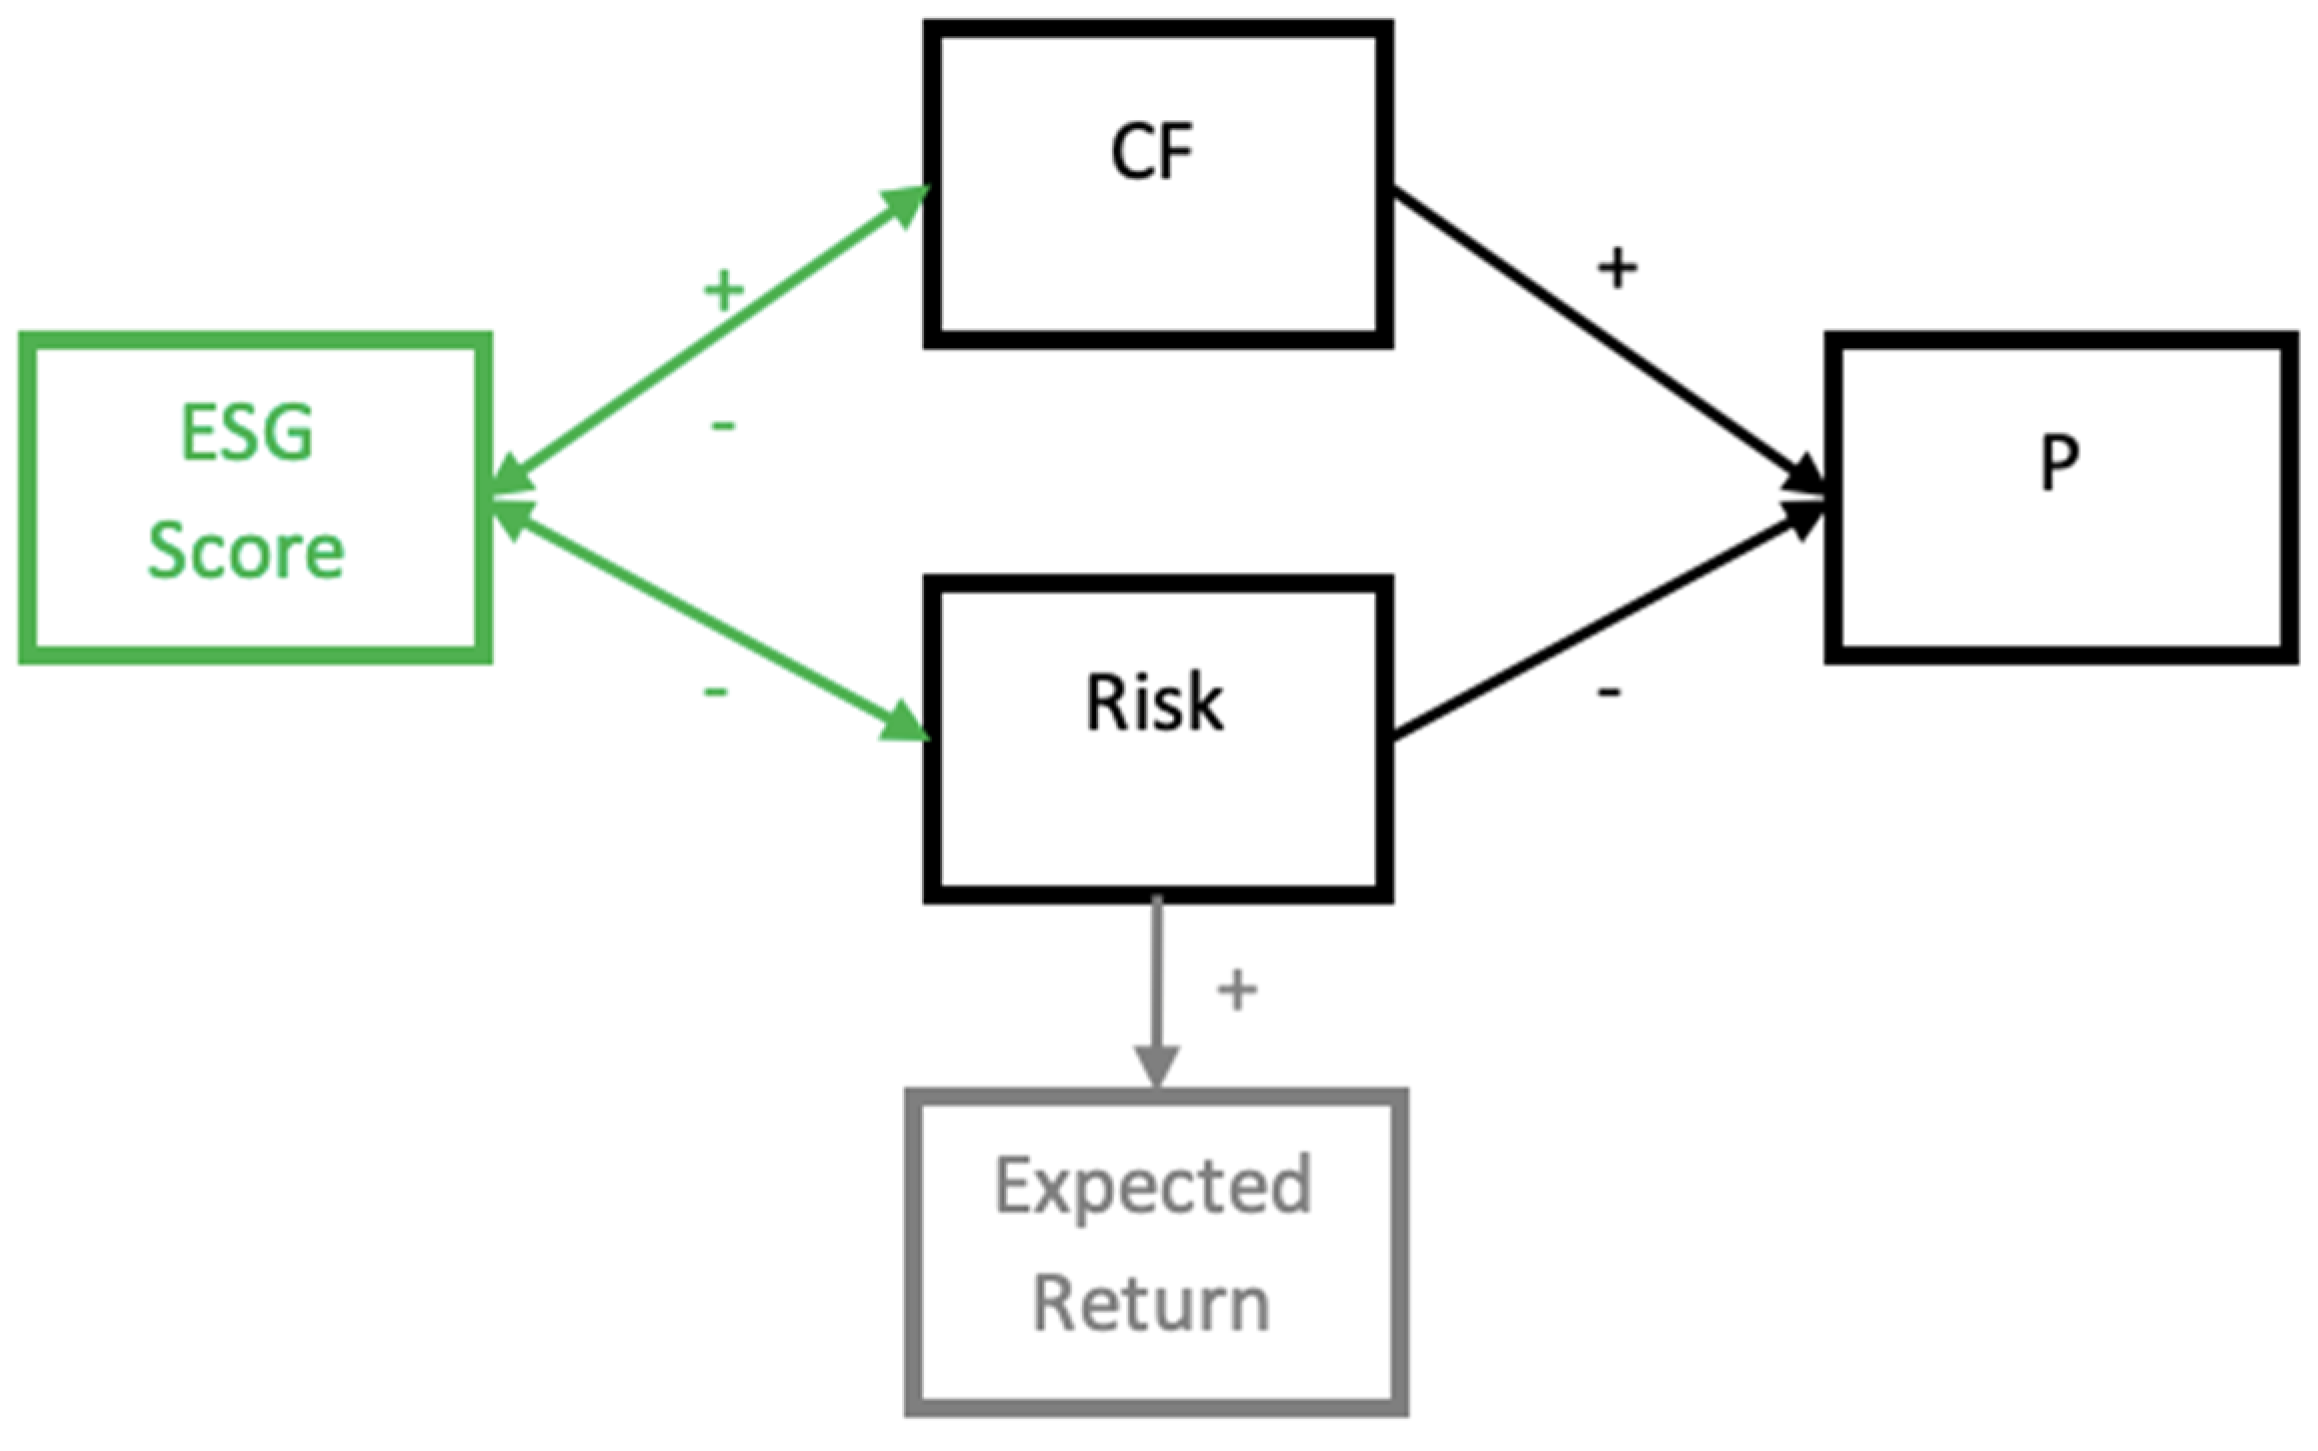
Figure 1 relates to the debate on whether ESG is an expense that decreases cash flows or an investment that increases them. According to the Efficient Market Hypothesis (EMH) (
Fama, 1970), any impact from past information is already reflected in the price of the stock, so there is no direct link from ESG scores to expected return through cash flows. Instead, ESG scores influence expected return through the risk channel. As
Figure 1 suggests, ESG scores reflect a portion of a firm’s risk level, with a higher ESG score signaling lower risk and, therefore, lower required returns.
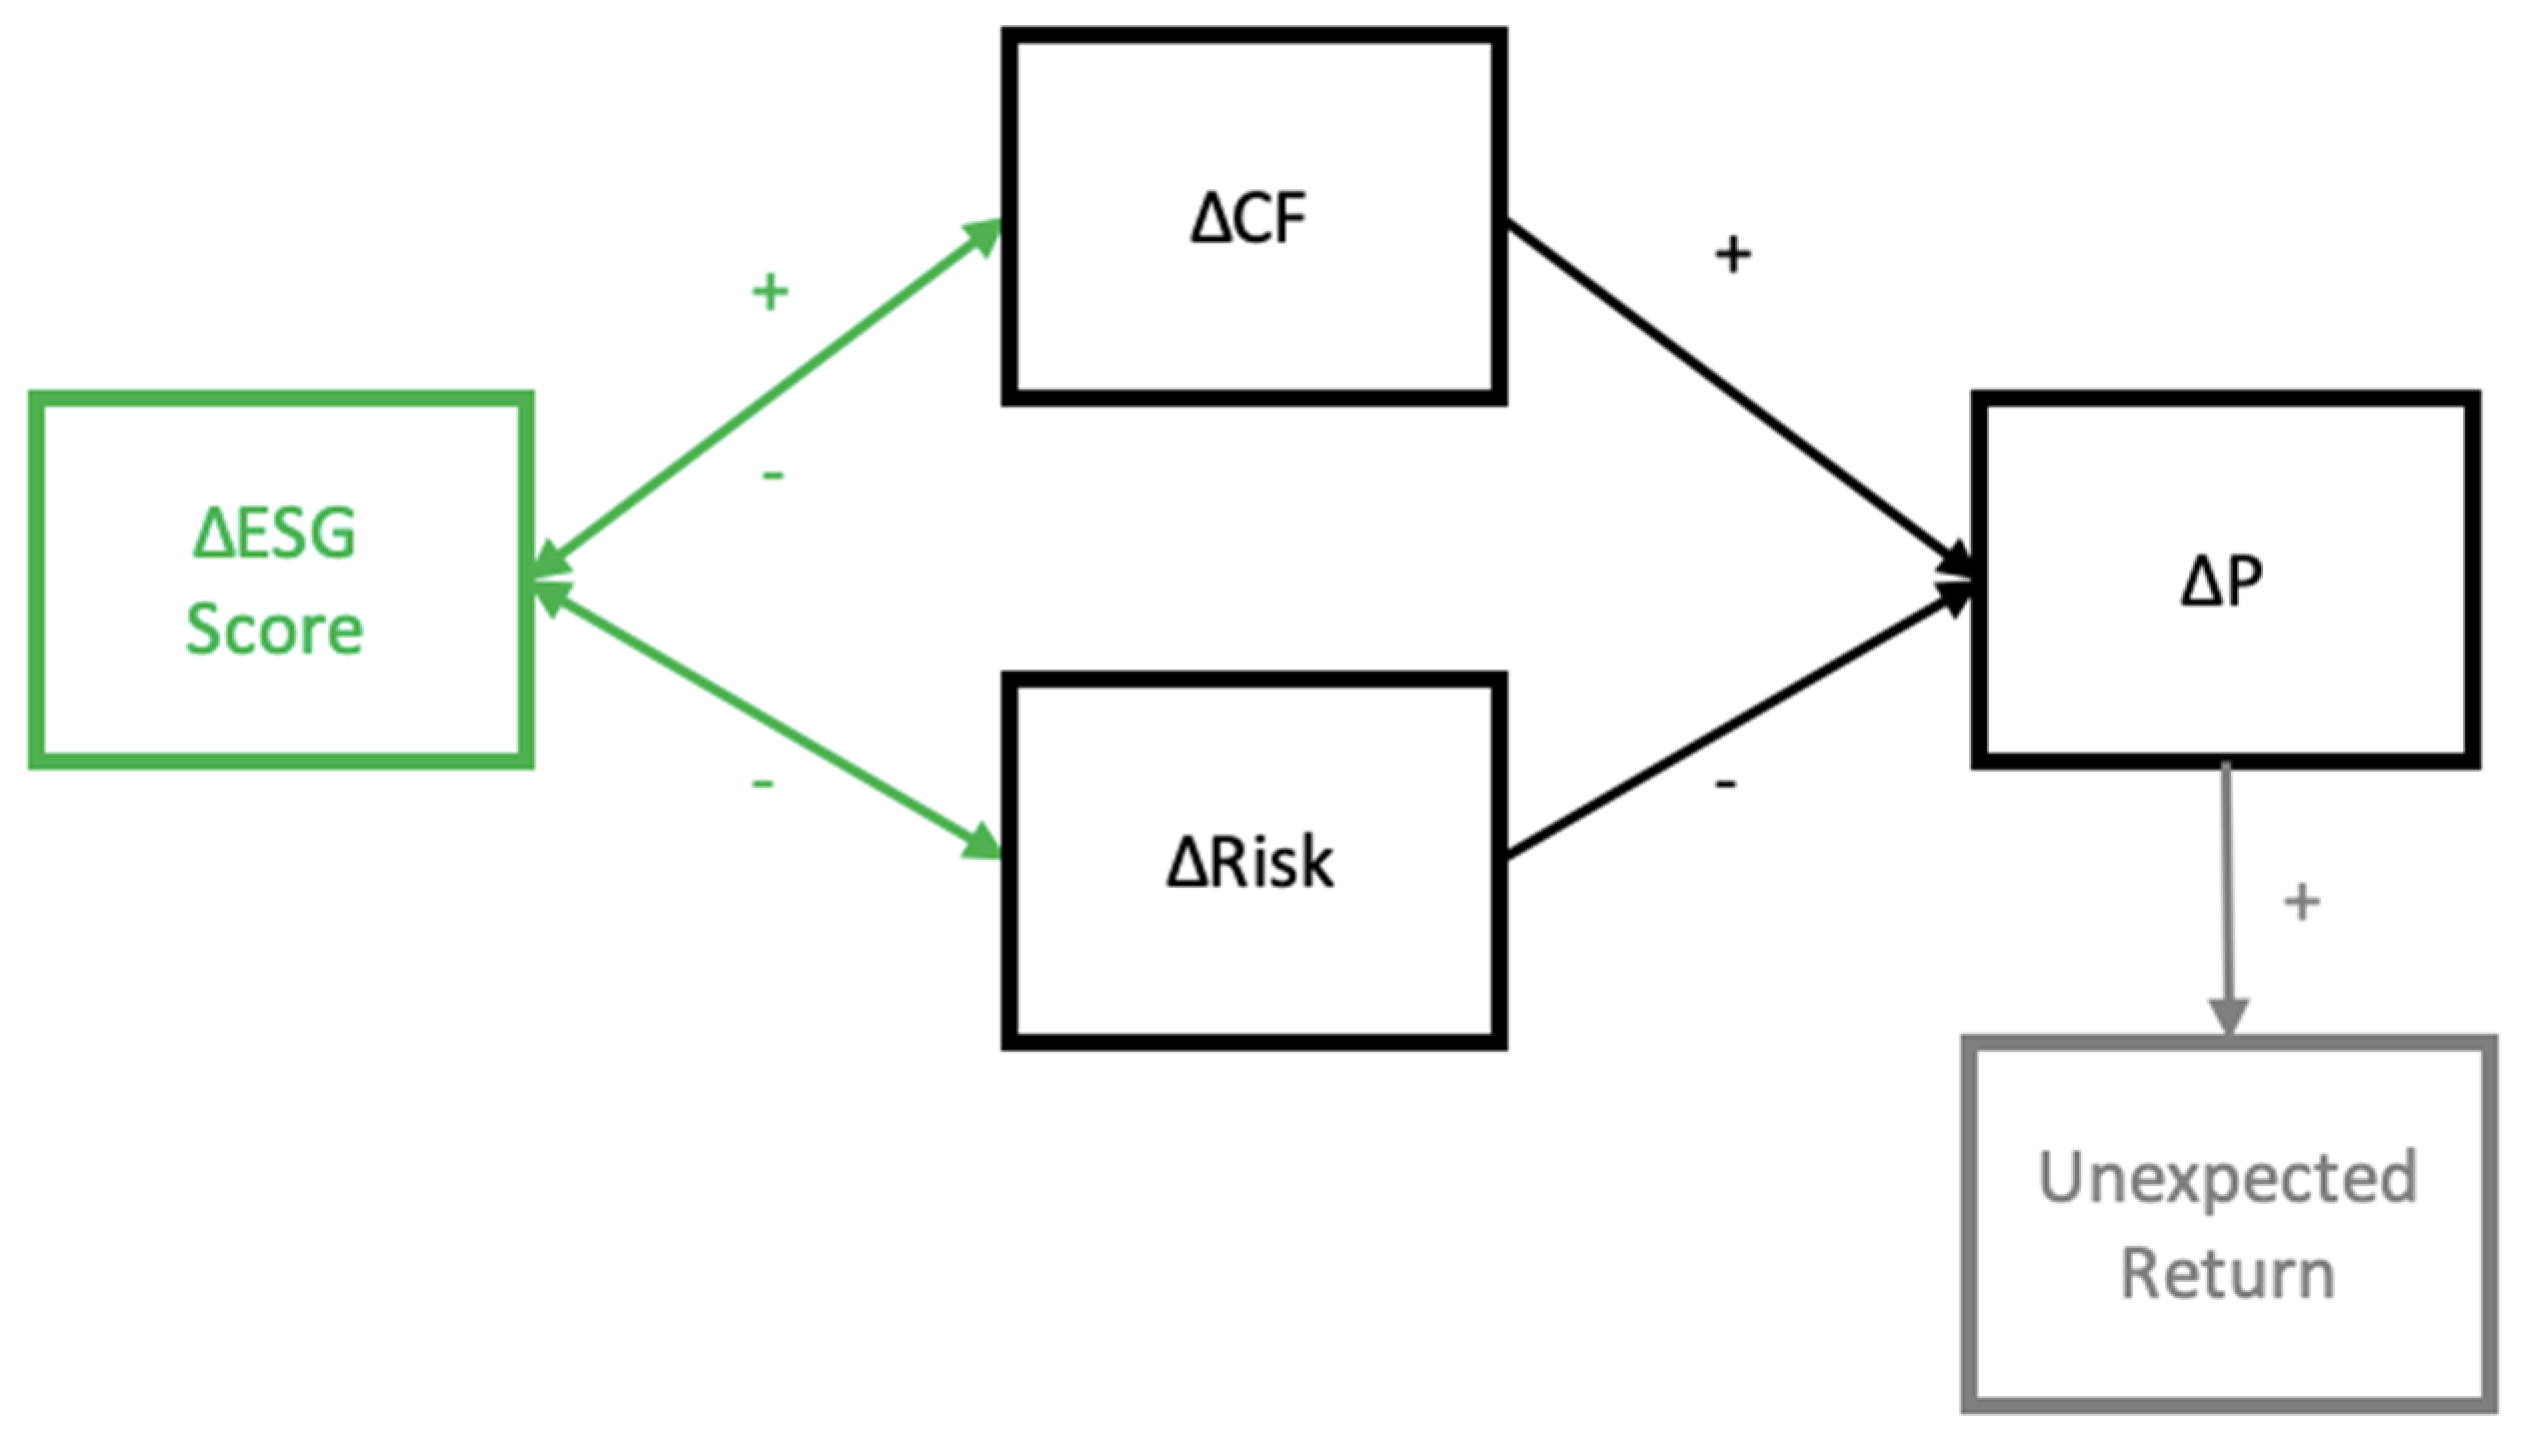
Alternatively, if the ESG score of a firm fluctuates, this variation is swiftly reflected in a shift in its stock’s market price, as shown in
Figure 2. The relationships depicted in
Figure 1 and
Figure 2 are akin to the returns of a bond in relation to its credit rating. Better credit ratings imply lower credit spreads, as less risky bonds are generally associated with lower required returns. Consequently, a superior credit rating can increase a bond’s price by signaling an improvement in its credit quality.
All financial data used in this study was provided by Refinitiv, including ESG scores, which are an enhancement of the former Asset4 ESG ratings. Asset4, founded in 2003, is now part of the London Stock Exchange Group following its integration into Refinitiv after the acquisition of Thomson Reuters’ financial and risk business. The overall structure of the ESG rating methodology has remained virtually the same over the years. One of the major additions to the traditional Environmental, Social, and Governance pillars was a pillar of Controversies (
Refinitiv, 2022). Even though the methodology has been rebranded, it is still common to refer to it as Asset4, given its long-standing reputation as one of the top providers of such ratings given its metrics and broad coverage
3 (
Refinitiv, 2023). Asset4’s scores range from a minimum score of 0 to a maximum of 100 and can be transformed into letter ratings from D− to A+ based on percentile ranges of equal size.
The sample of this study consists of 3856 stocks listed in U.S. exchanges. We use 20 years of quarterly data from December 2002 to December 2022. That period comprises 81 quarters, but both
Table 2 and
Table 3 below show snapshots as of December of every other year for space and readability reasons.
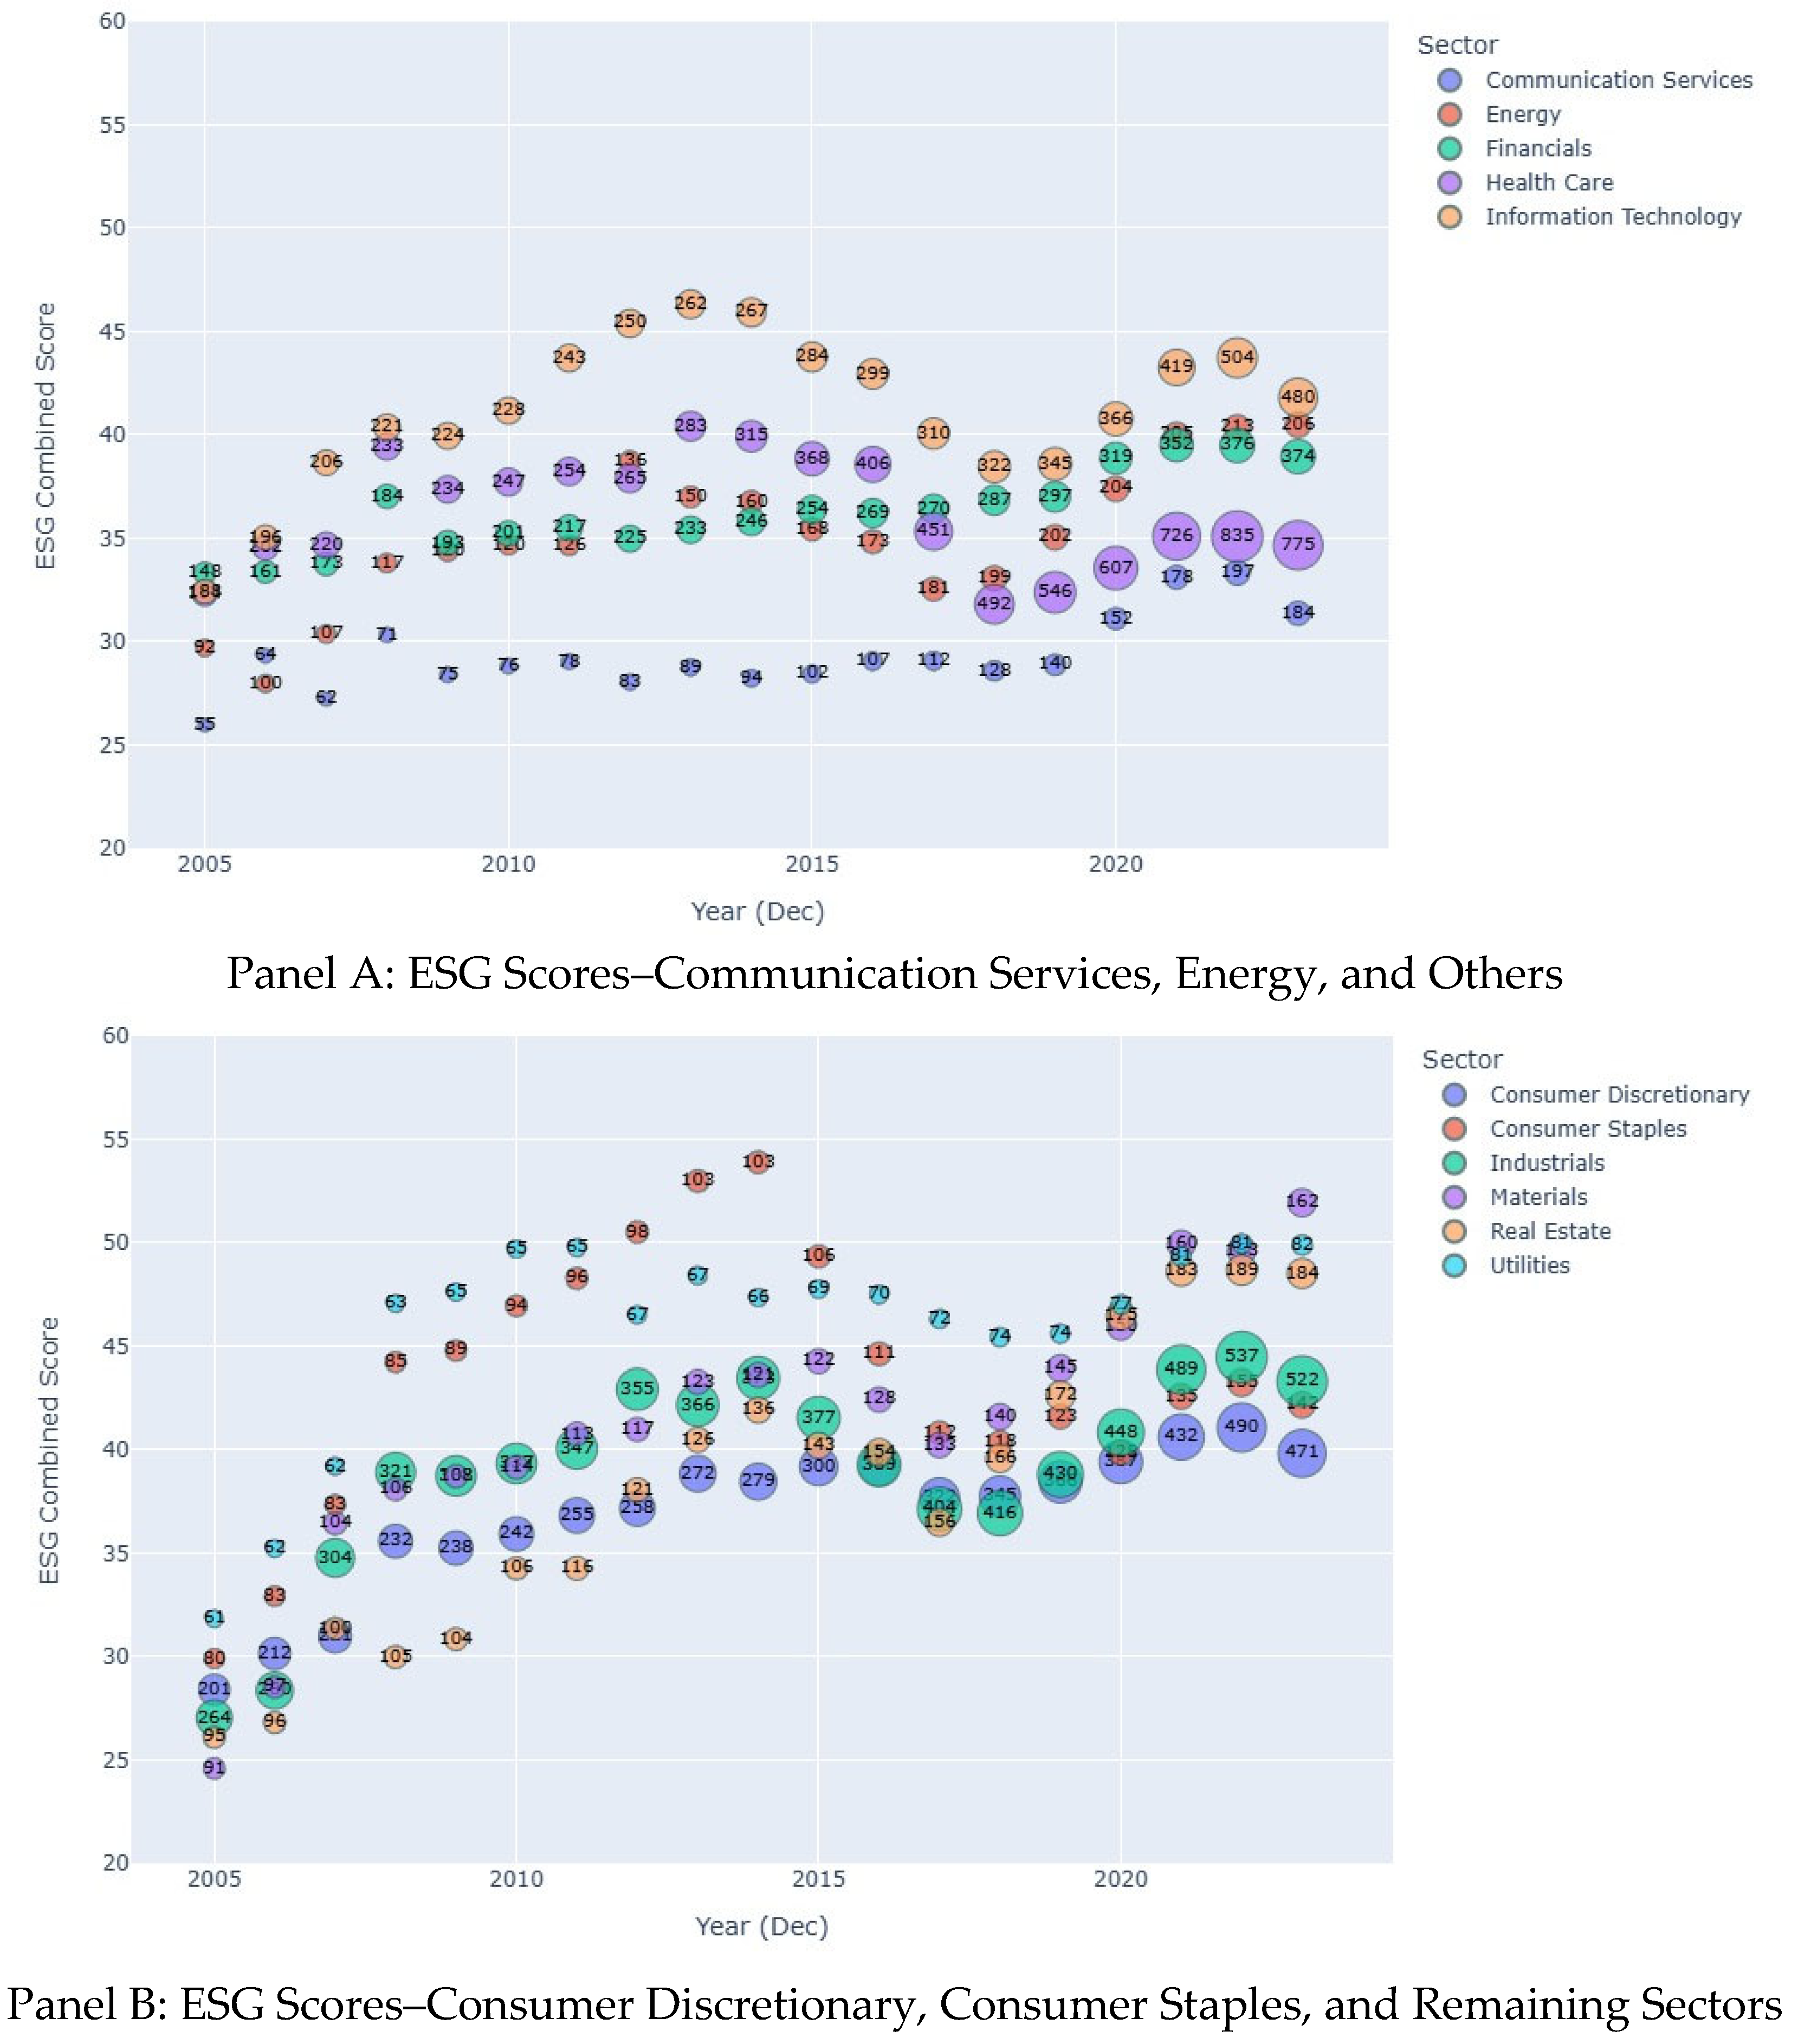
Panels A and B of
Figure 3 illustrate the evolution of ESG scores over time for the eleven sectors included in this study. The division of sectors across the two panels was guided by the criterion of minimizing visual overlap, thereby enhancing the clarity and interpretability of our results. The graphs also display the number of firms represented in each sector. During the initial years of the sample period, the Consumer Staples sector exhibited high and increasing ESG scores; however, its performance declined from 2016 onward. The Industrials sector maintained high ESG scores with relatively minor fluctuations throughout the sample period, while the Real Estate sector showed a consistent upward trend in ESG scores.
We tested the multi-factor model with the three commonly used panel regression alternatives: pooled ordinary (PO), fixed effects (FE), and random effects (RE). The PO version of the model was estimated as a departure point, while the FE and RE versions were tested as potentially improved alternatives, evaluated with the
Hausman (
1978) test.
The PO model assumes constant coefficients across time and individuals and is the simplest of the three testing methods. However, this model potentially results in biased estimates since it ignores individual heterogeneity. The RE model allows differences in the relation across sections and accounts for individual heterogeneity. Moreover, the parameters of the model, such as intercepts, are assumed to be random variables. For this method, cross-sectional effects are important in terms of variance only. However, while explanatory variables and unobserved individual-specific effects may be correlated, the RE model assumes that they are not. As opposed to the RE model, the FE method assumes that cross-sectional effects are structurally related to the explanatory variables. This model addresses the issue of omitted variable bias due to unobserved heterogeneity by capturing time-invariant individual-specific effects. Furthermore, although the generalized method of moments (GMM) and dynamic panel models can address lagged effects and endogeneity (
Ullah et al., 2018), the relatively large time dimension of our panel (i.e., 81 quarterly observations) allows the PO, RE, and FE models to remain both consistent and efficient. Therefore, employing more sophisticated models becomes less critical in this context. Nevertheless, the FE has several shortcomings, including the difficulty in identifying the effects of time-invariant covariates, imprecise standard errors, biased coefficient estimates, and a heightened risk of inaccurate causal inferences, among others (
Hill et al., 2020).
Model Specifications and Endogeneity Issues
Each of the three models may be represented by Equation (3):
where
yi,t is the dependent variable,
Xi,t are the independent variables,
β are the coefficients to be estimated,
αi is the constant, and
ui,t is the idiosyncratic error. PO is simply an ordinary least squares (OLS) regression performed on panel data. Nevertheless, this model does not control for the possible correlation (
ρ) of errors over time (
t) for any given entity (
i) (i.e., a company’s stock in this study). In other words, PO assumes that
ρ(
Xi,t,
αi) = 0. However, this approach does not account for the potential autocorrelation of errors over time (
t) within each cross-sectional unit (
i), namely, individual companies’ stock prices. Both FE and RE assume that
ρ(
Xi,t,
αi) ≠ 0, but they address this issue using different approaches. The RE model assumes that the individual effect of unobserved variables varies randomly over time. Hence, the RE model estimates this serial correlation with model parameter
λ and subtracts
λ* mean from each equation term. A serial correlation of
λ = 0 corresponds to the PO model, whereas a serial correlation of
λ = 1 corresponds to the assumption underlying the FE model.
In contrast, the FE model addresses potential endogeneity arising from time-invariant unobserved factors (e.g., αi) that may be correlated with the regressors. By removing the within-entity mean, it controls for these fixed effects, thereby mitigating omitted variable bias without requiring separate estimation of αi. Nevertheless, if the error terms exhibit autocorrelation over time, standard errors may be biased. To account for this temporal dependence, this study employs standard errors that are robust to autocorrelation.
4. Results
Both the RE and PO models allow for the estimation of time-invariant regressors; however, these models are inconsistent if FE is the correct model. The White and Breusch-Pagan tests performed on the residuals of the PO models for returns and volatility confirm the presence of heteroskedasticity. In both cases, the null hypothesis of homoskedasticity is rejected at the 1% significance level. The Durbin–Watson and Ljung–Box tests on the residuals of the PO models show significantly positive autocorrelation
4.
The Variance Inflation Factors of the exogenous variables show no multicollinearity since the maximum VIF is 2.9, and the rest of the variables have a VIF between 1 and 2. Moreover, as
Table 4 shows, none of the correlation values exceeds an absolute value of 0.44. This is appreciably below the threshold of 0.80, a level that is usually considered an indicator of potential multicollinearity issues (
Bouraoui & Phisuthtiwatcharavong, 2015). The correlation between ESG and ΔESG is 0.02.
Table 5 shows the results of the three Panel models used to explain the stock returns. We see that most variables are significant in the three approaches, including our variables of interest.
Although the three models produced consistent results, diagnostic tests on the PO model indicate a preference for either the FE or RE models. However, the
Hausman (
1978) test rejected its null hypothesis, which asserts that the RE model is the appropriate specification for the panel data being analyzed. Thus, the FE specification provides the best fit for our data. Moreover, despite its limitations, the benefits of the FE method in addressing unobserved heterogeneity, in comparison to other regression models (
Hill et al., 2020), render this approach well-suited for our analysis.
Moreover,
Barros et al. (
2020) assert that combining lags of the original regressors as instrumental variables, together with appropriate modeling of fixed effects, can address not only the issue of dynamic endogeneity but also problems arising from omitted variables, measurement errors, and simultaneity between dependent and independent variables. Accordingly, we incorporated lags of the explanatory variables in our models and observed that the signs of the ESG and ESG Momentum coefficients remained consistent, and their magnitudes were largely unchanged
5.
Table 6 shows the results of the three panel models used to explain the stock returns volatility. Unexpectedly, however, the sign of the ESG variable was positive in all three panel models. Finally, like the panel models for stock returns presented earlier, in the corresponding volatility models, the Hausman test also suggests that the FE model is the best alternative.
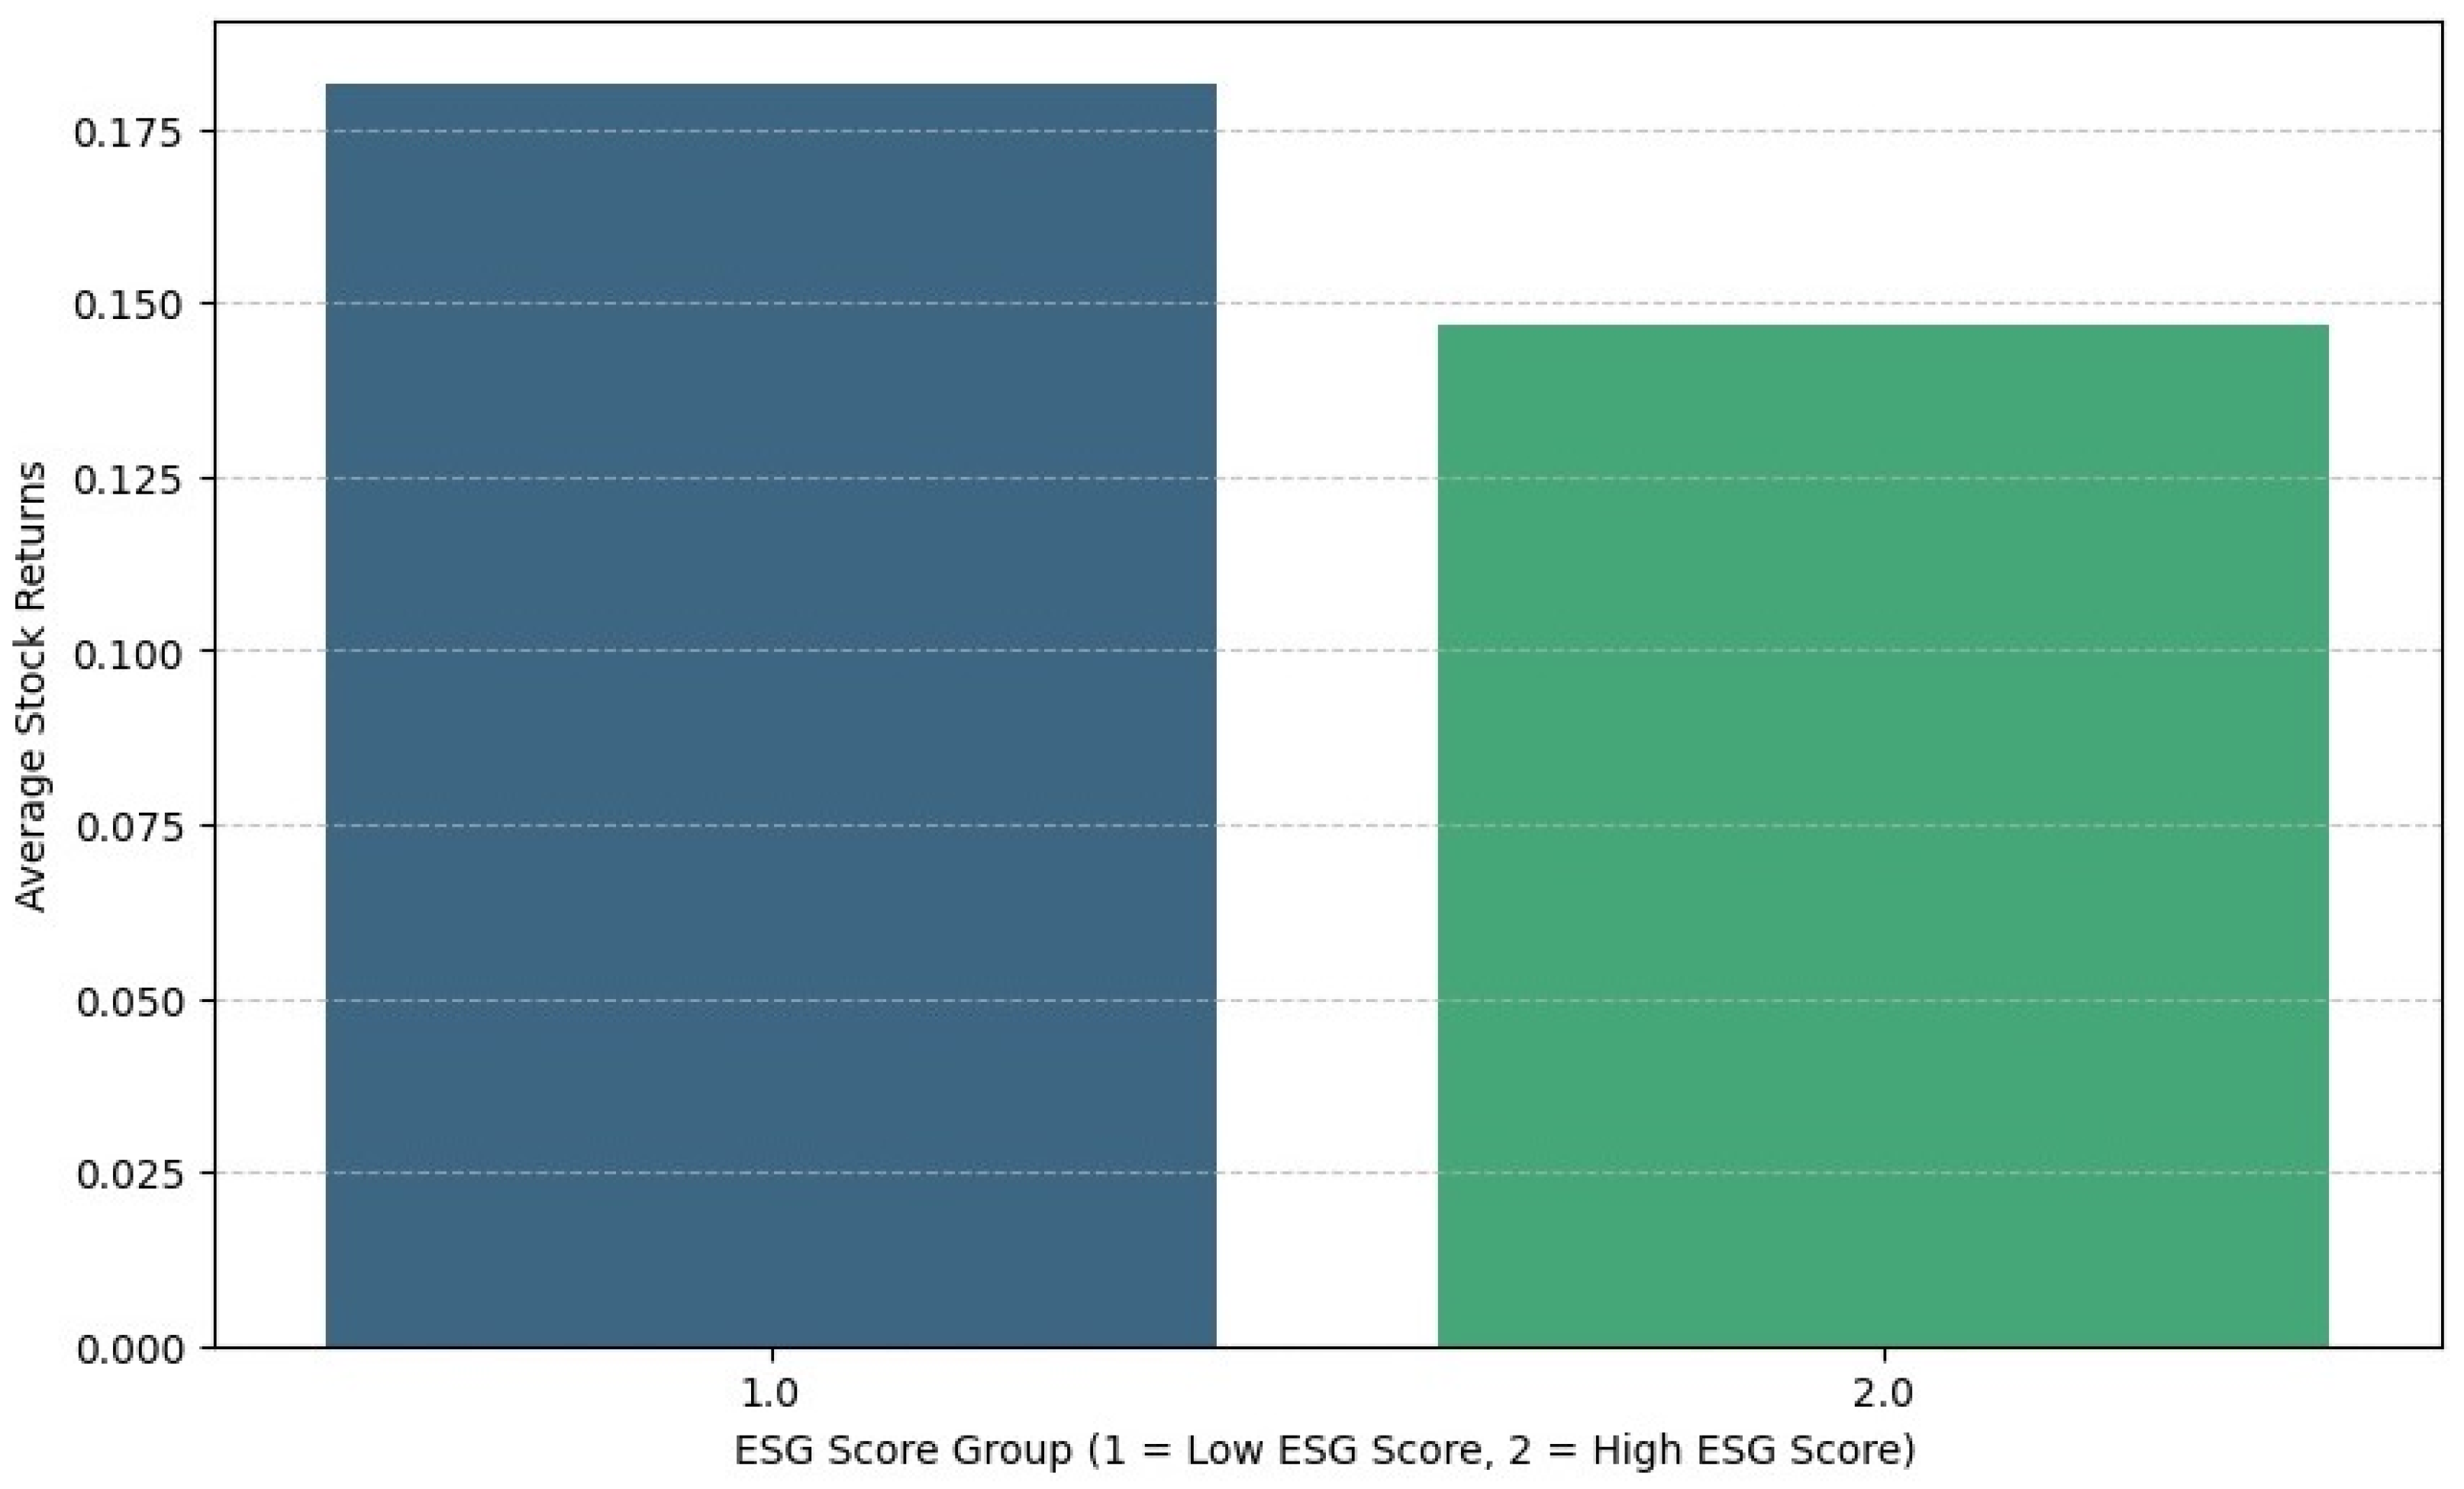
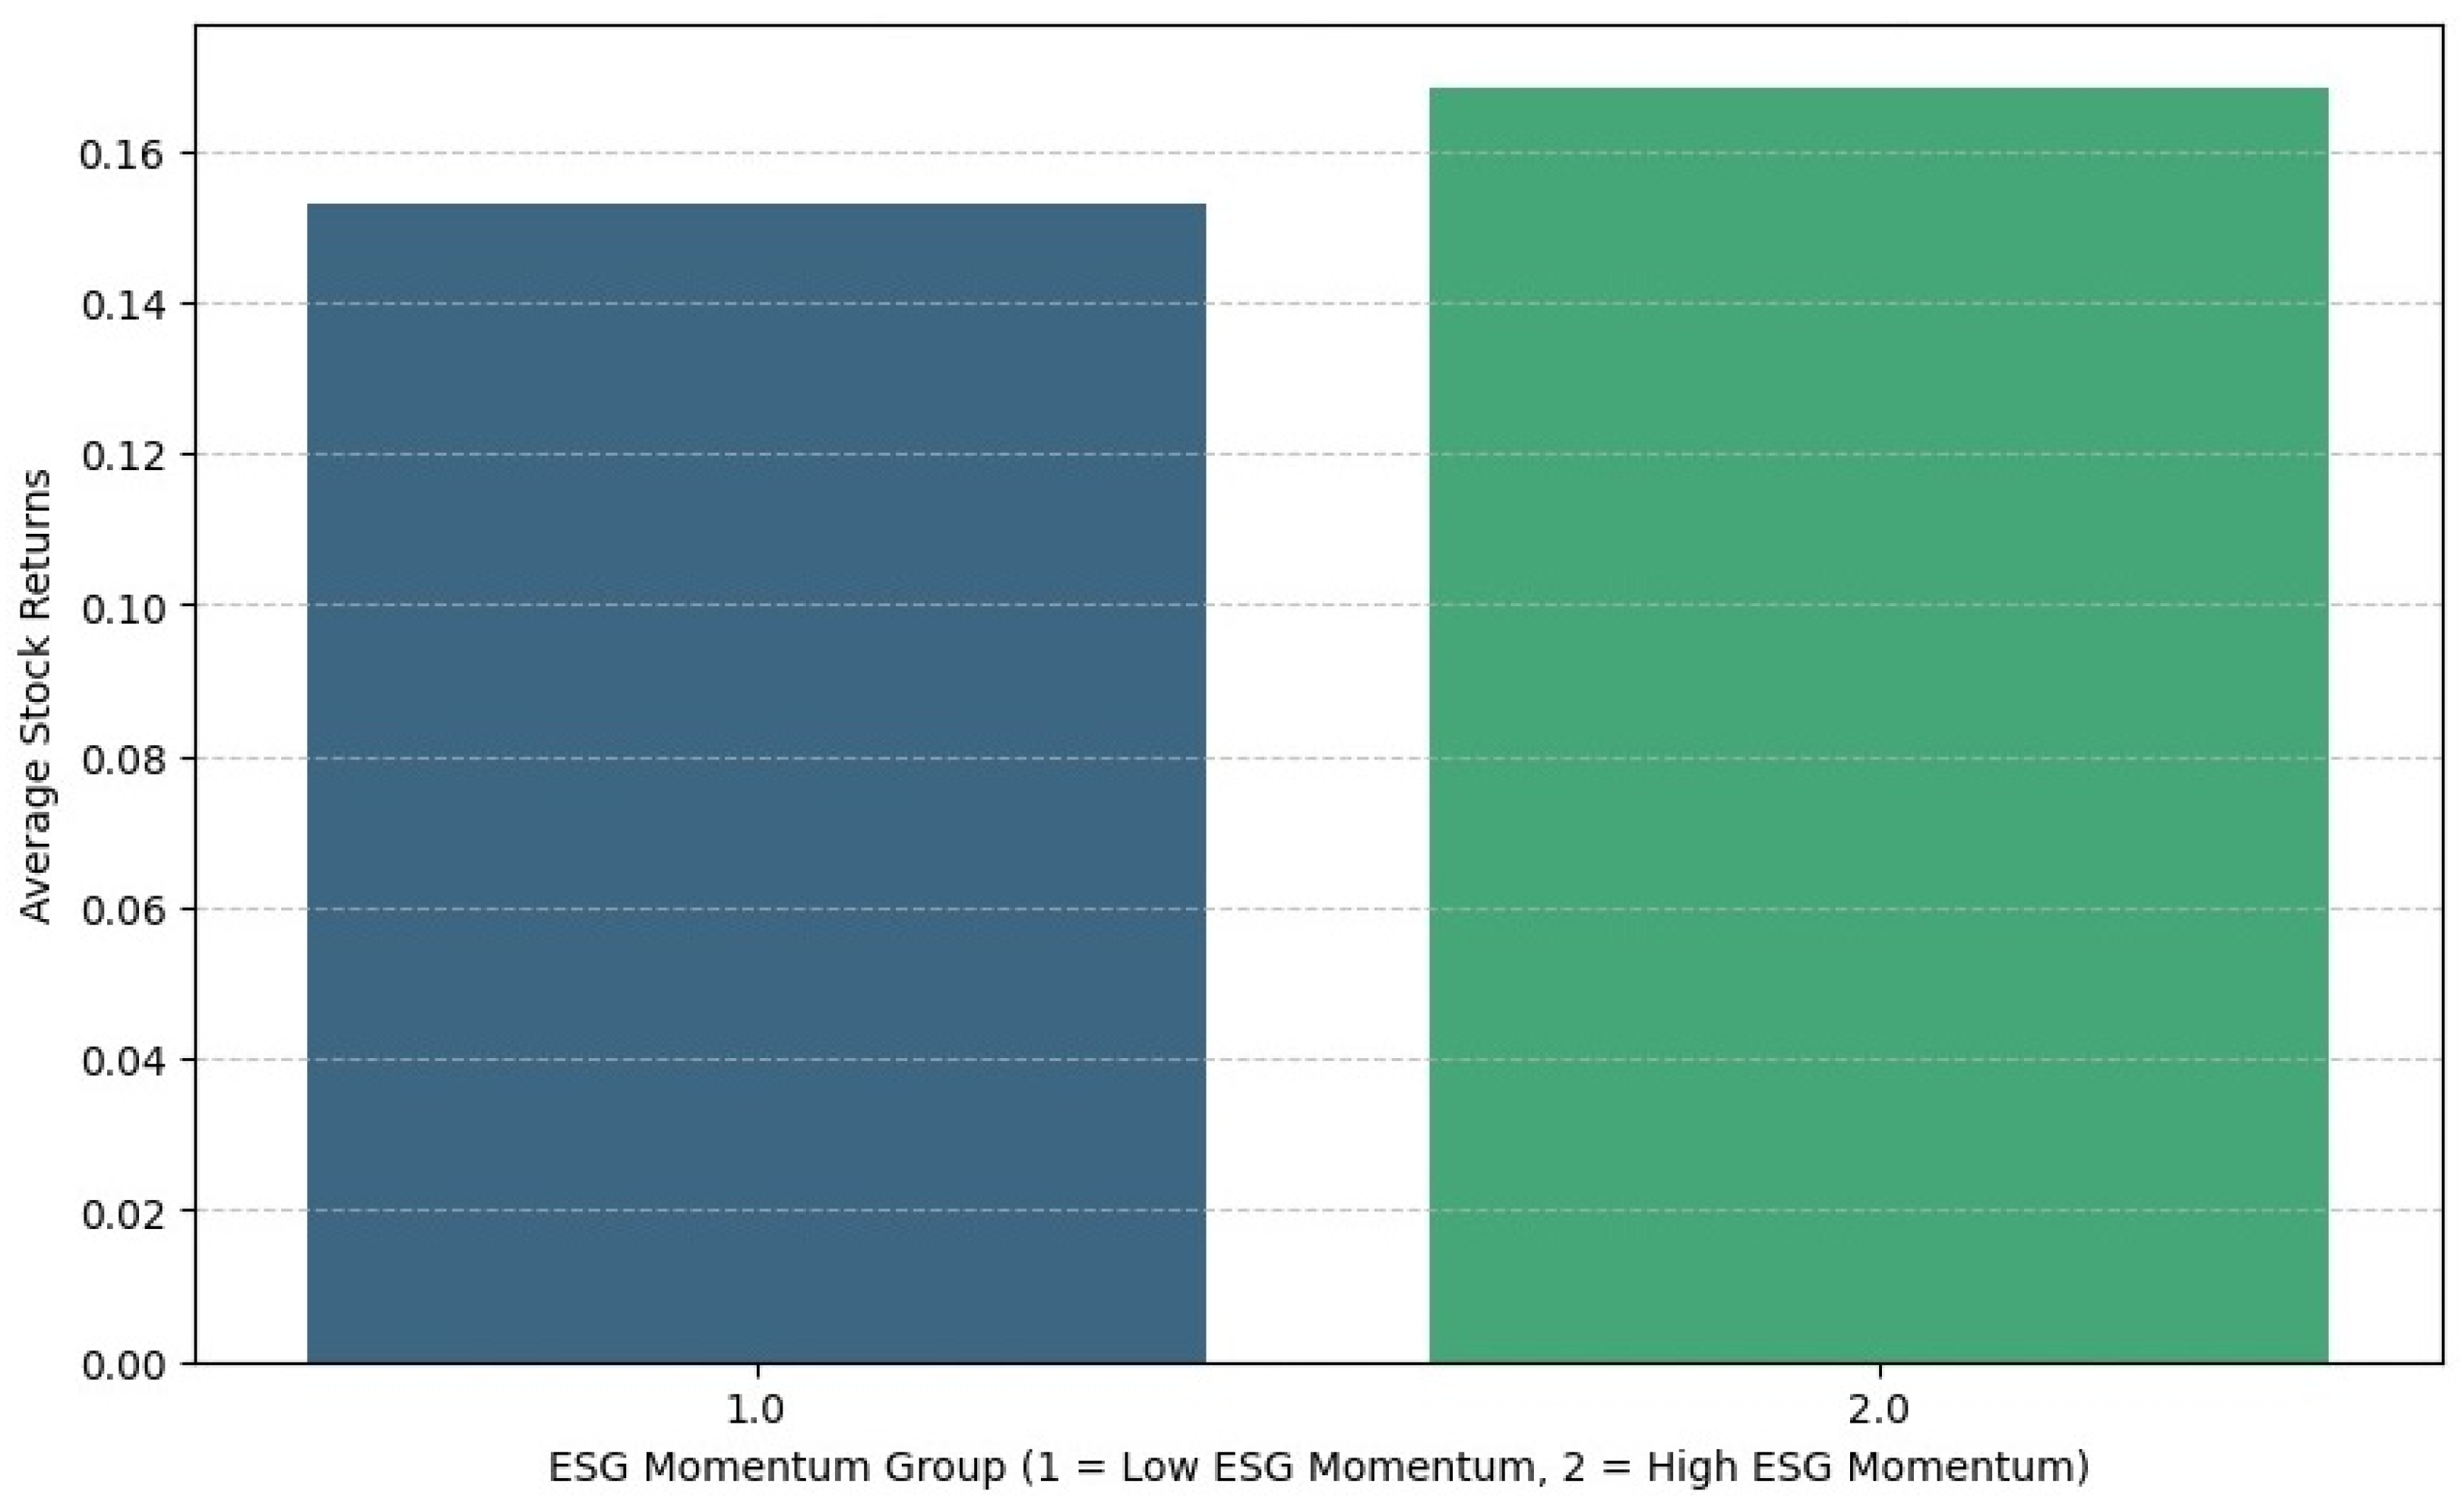
Figure 4 and
Figure 5 provide a graphical summary of our results. Specifically,
Figure 4 classifies stock returns based on ESG scores, categorizing firms into two groups: those with below-average ESG scores and those with above-average scores.
Figure 5 applies a similar categorization based on ESG Momentum. The patterns observed in these figures are consistent with the findings from our econometric models. Firms with lower ESG scores tend to exhibit higher average stock returns, and conversely, those with higher ESG scores show lower returns. In contrast, companies with lower ESG Momentum display lower stock returns, while those with higher ESG Momentum demonstrate higher returns.
5. Discussion
The emphasis of this study is to explore the relationship between stock returns and volatility in the context of ESG ratings. Previous studies have reported mixed results, which we attribute to the predominant use of ESG scores as the main explanatory variable rather than focusing on ESG Momentum (ΔESG), defined as the year-over-year change in a company’s ESG score.
Our findings indicate that higher ESG scores are associated with lower stock returns, consistent with prior research (e.g.,
Feng et al., 2022;
Villarreal-Samaniego et al., 2022). We expected ESG investments to yield lower returns due to the offsetting effect of reduced risk since ESG investing can be viewed as a form of insurance. Beyond this “insurance-type” effect, another plausible explanation involves reverse causality: financially successful firms can afford to invest more in ESG initiatives, while underperforming firms may abandon ESG strategies due to the costs associated with CSR efforts, which could damage their corporate social responsibility reputation. In other words, lower stock returns may lead to diminished ESG ratings and vice versa. Furthermore, the negative relationship between stock returns and ESG scores could be explained by omitted variables in our model, such as media attention and market sentiment.
Our results unexpectedly show that ESG is positively related to return volatility, as previously reported by
Nguyen and Nguyen (
2015) and
Tasnia et al. (
2021). Regarding this finding, we conclude that while ESG activities reduce a wide variety of risks, this is not unambiguously reflected in asset volatility. One possible explanation for this outcome is that ESG ratings place increased emphasis on transparency. Accordingly, companies subject to heightened scrutiny through more stringent disclosure requirements may experience greater volatility, particularly when investors’ expectations for transparency or accountability are not met. In essence, companies with high ESG ratings may be more vulnerable to event-driven volatility due to intensified investor scrutiny.
The literature highlights a lack of convergence in ESG measurement concepts among rating providers (e.g.,
Billio et al., 2021;
Dorfleitner et al., 2015). This weak, or even non-existent, convergence can introduce an additional source of return volatility among ESG-rated firms. Also, as ESG becomes an increasingly important constituent in investment decision-making and is interpreted differently by investors, it adds another layer of complexity to the process, especially when the information is incomplete or outdated, thus becoming an additional source of risk. These and possibly other explanations for the positive ESG–return volatility relationship constitute a potential avenue for further study.
The semi-strong form of the EMH proposes that the arrival of new information is quickly reflected in asset prices, which is consistent with our findings that ΔESG is positively related to stock returns. Specifically, stock returns tend to rise following improvements in ESG ratings and decline in response to rating downgrades. While these findings could also be interpreted from the standpoint of behavioral biases or a market adaptation process to ESG score variations, we argue that the direct relationship between stock returns and ΔESG is primarily driven by signaling theory. That is, changes in ESG scores serve as credible signals that reduce information asymmetry, prompt price adjustments, and influence investor expectations of future performance.
Regarding the negative relationship between ESG Momentum and stock returns volatility, we argue that an increase in ESG ratings sends a positive signal to investors about the firm’s improved risk profile. This signal can be likened to the additional protective benefits of an expanded insurance policy, as higher ESG scores imply reduced CSR-related risks. Conversely, a decline in ESG ratings may indicate increased risk, resulting in higher volatility. To summarize, ESG Momentum is positively related to stock returns and negatively related to risk, which implies that investors benefit from positive changes in companies’ ESG ratings.
The EMH assumes that market participants react immediately to the arrival of new information and that the observed change fully reflects its economic significance. That is, information such as a change in ESG scores gets “priced in” and impacts stock returns accordingly. In contrast, from a behavioral finance standpoint, the positive relationship between stock returns and ESG momentum could be attributed to investor overreactions driven by biases and heuristics. Nevertheless, evidence suggests the existence of a middle ground between these two extremes. Specifically, the literature indicates that markets adapt only gradually to new information, including sustainability-related data (
Schoenmaker & Schramade, 2023). Therefore, from the perspective of the AMH, the relationship between stock returns and changes in ESG scores may reflect a process of investor learning and adaptation. This process gives rise to evolving return patterns over time and is influenced, among other factors, by the number and behavior of market participants.
From a signaling theory viewpoint, however, an improvement in a firm’s ESG score can serve as a convincing signal of enhanced corporate quality and reduced non-financial risk, similar to how a bond rating upgrade signals improved creditworthiness. In this context, investors may interpret upward revisions in ESG scores as signals of enhanced CSR practices, leading to a repricing of the firm’s stock reflected in immediate positive returns. This signaling mechanism reduces information asymmetry and facilitates more informed investment decisions.
In any case, announcing changes in ESG ratings becomes a key determinant of stock returns as it provides new information on a firm’s ongoing operational developments. Therefore, the inclusion of ESG momentum as an explanatory variable in the econometric modeling of stock returns embodies a relevant element that recognizes the economic relevance of ESG exposure at the firm level.
6. Conclusions
The results of this study suggest that although firms with high ESG scores are often associated with more sustainable and ethical business practices, they tend to exhibit lower long-term stock returns and higher volatility relative to companies with lower ESG ratings. However, when a company’s ESG rating improves, it typically prompts a positive short-term reaction in the stock market, increasing its stock returns and reducing volatility as investors interpret such improvements as positive signals of the company’s prospects. Therefore, both institutional and individual investors may benefit from implementing strategies that allocate resources to firms actively improving their ESG performance. From a corporate perspective, companies also have a strong incentive to publicly signal ongoing improvements in ESG-related areas. Moreover, the findings of this study underscore the growing importance of ESG rating agencies’ assessments in guiding investment decisions and highlight the need for these evaluations to be issued in a timely manner.
The availability of ESG ratings published by Refinitiv was crucial to obtain the results reported in this research. However, the current ESG methodology is a “work in progress”, subject to continuous adjustments and refinements in response to the complexity of the data generation process. While ongoing improvements in rating methodologies enhance data reliability, they may also introduce inconsistencies over time in how companies’ ESG efforts are measured. Moreover, a company’s ESG ratings are not strictly comparable to those of others unless all the companies being compared belong to the same industry due to the specific mix of environmental and operational issues that vary across economic activities (
Schoenmaker & Schramade, 2023). Lastly, the construction of ESG indices is inherently subjective, as each rating agency determines the relative weighting assigned to the Environmental, Social, and Governance pillars in the overall score. While the quality of ESG ratings improves only gradually, the available data should not be disregarded as a valuable input for achieving a better understanding of the relationship of interest. However, the study’s reliance on current ESG methodologies and data remains one of its key limitations.
The issue of the relationship between ESG ratings and ESG Momentum with stock returns and volatility remains open for further exploration. For instance, more research is warranted regarding each of the ESG pillars, along with the “controversies” element and their influence on returns and volatility. In addition, studies adopting alternative methodologies, such as dynamic panel models or the generalized method of moments, would be valuable extensions of the present analysis. Further research is also necessary to understand the connectedness between returns and volatility with ESG scores and momentum across different industrial sectors and during crisis episodes, such as the Great Recession and the COVID-19 pandemic. It is also important to investigate other facets of ESG, including sector-specific practices, the effects of regional regulatory frameworks, and the role of standards such as IFRS S1 and S2 or other sustainability-related guidelines. Moreover, incorporating a broader perspective to assess whether the relationship between ESG and financial performance is exclusive to the U.S. context or reflects wider international trends represents another promising path for future research.


