1. Introduction
The topic of environmental, social, and governance (ESG) has garnered considerable attention in the finance industry over recent years. Often seen as a proxy for environmental impact and exposure to climate-related risks, a company’s carbon intensity (a measure of greenhouse gas [GHG] emissions produced per unit of revenue generated by the company) has emerged as a crucial factor in investment decisions concerning ESG. Companies with low carbon intensities increasingly appeal to environmentally conscious individual investors who prioritize sustainability and ethical practices. The low-carbon companies also attract institutional investors, such as pension funds and ESG-focused asset managers, who are mandated to invest in environmentally responsible businesses. The rising interest of fund managers in low-carbon companies reflects the importance of sustainability within the financial industry. As investors progressively integrate ESG considerations into their investment strategies, the carbon intensity is expected to remain a key metric for assessing a company’s long-term viability and alignment with global climate goals.
Another common motivation for investors to prefer companies with strong ESG performance and low carbon emissions is the belief that they carry lower financial risk and experience fewer stock price fluctuations, particularly in times of crisis (
Broadstock et al., 2021). Some investors believe that businesses with low carbon emissions are generally better positioned to adapt to stricter environmental regulations and shifting consumer preferences toward sustainable practices. In contrast, high-carbon firms may face higher costs during the transition to environmentally friendly operations, leading to uncertainty and heightened short-term volatility in stock prices. Some investors consider low-carbon stocks to offer greater stability, making them particularly suitable for portfolios that aim for consistent growth. This perceived stability aligns well with long-term investment strategies and contributes to the attractiveness of low-carbon firms as safer investment choices.
Although there are a number of studies that explore the comparison between low-carbon and high-carbon stocks, most of the previous empirical research focused on the link between carbon intensity and stock return. Investigations into the connection between carbon intensity and stock volatility are sparse and lack conclusive evidence, making it uncertain whether companies with smaller carbon intensities offer more stability and are less vulnerable to external factors like oil price fluctuations and global market changes (
Malik & Umar, 2024).
Bolton and Kacperczyk (
2021) suggested that companies with high carbon emissions are associated with increased idiosyncratic risk. Nonetheless, investors still choose to put their money into high-carbon stocks, because this idiosyncratic risk is factored into a carbon premium, and the stock performance of high-carbon companies tends to outperform that of low-carbon firms. In contrast, a study by
Andersson et al. (
2016) found that the annualized volatility of five clean energy indexes was greater than that of the S&P 500 and NASDAQ 100 from January 2007 to November 2014, which means that the investment risk of low-carbon stocks is higher than the market average.
Theoretically, a company’s carbon intensity is inherently linked to the nature of its business operations. Different industries naturally generate varying levels of emissions depending on their energy consumption and resource utilization. For example, companies in the financial sector, such as banks and insurance companies, will typically have lower carbon intensities. Their business models are service-oriented and primarily rely on office-based operations, requiring significantly less energy and resources than industrial sectors. For businesses in energy-intensive industries such as electricity generation and heavy manufacturing, they often rely heavily on fossil fuels that generate a considerable amount of GHG emissions. However, electricity companies have a stable customer base and consistent revenue, which leads to lower stock price volatility. However, this assumption requires further validation, and more in-depth research is required to validate this hypothesis.
Another popular research area in our subject is to explore whether the stock performance of low-carbon companies responds differently to that of high-carbon companies to external variables. For instance, it would be worthwhile to analyze whether stocks with lower carbon intensities are less sensitive to changes in oil prices compared with those with higher carbon intensities. Insights from this research will guide investment decisions and enhance the understanding of ESG factors in finance.
Hammoudeh and Li (
2005) found that a company’s reliance on oil largely influences the strength of the relationship between oil prices and stock returns. They argue that during disruptions in fossil fuel supply (supply shocks), companies with lower carbon intensities are less impacted than those with higher intensities, as the former have a reduced dependence on fossil fuels.
Our study examines the firm-level carbon intensity of the 83 Hang Seng Index (HSI) constituent stocks in Hong Kong. We construct two distinct indexes from these companies, one comprising the 20 stocks with the highest carbon intensity and another 20 with the lowest. Using data from 31 December 2009 to 30 April 2025, we analyze the connectedness of the annualized daily volatility of these carbon equity indexes and four external factors: oil prices, U.S. dollar–Chinese yuan (USDCNY) exchange rates, Standard & Poor’s (S&P) 500 returns, and 10-year U.S. Treasury rates. Based on the study of their connectedness, we hope to determine whether a stock’s carbon intensity diminishes or increases the influence of these external factors on its volatility.
To conduct this analysis, our study employs the total and directional connectedness measures developed by
Diebold and Yilmaz (
2012,
2014), which are widely recognized for analyzing relationships among variables and dynamics within the stock market. This methodology enables a comprehensive examination of how external factors differentially influence the portfolios that constitute stocks in the top and bottom carbon intensity spectra. The recent literature has effectively applied the approach of connectedness to the research of similar subjects, such as
Awartani et al. (
2016)’s investigation of the spillover effects between crude oil and financial markets, which provided evidence that the transmission from oil to other markets has intensified since the oil price decline in July 2014;
Antonakakis et al. (
2017), who constructed 50 different indexes measuring the dynamic total connectedness using the time-varying parameter vector autoregressive model;
Naeem et al. (
2020), who analyzed the time and frequency connectedness among electricity, carbon, clean energy markets, and the demand and supply shocks of oil prices;
Balli et al. (
2023), who examined the connectedness between oil prices and stock returns in the oil and gas sectors across 22 OECD countries from 1999 to 2020; and
Malik and Umar (
2024), who employed quantile-based connectedness analysis to disentangle various sources of oil price shocks and assess their connections to major global ESG equity indexes during extreme market fluctuations from 2007 to 2022. By leveraging this robust framework, this research aims to provide new insights into the role of carbon intensities in shaping stock volatility and market dynamics, particularly in Hong Kong’s financial market context.
The rest of this paper is organized as follows.
Section 2 presents a summary of the literature review.
Section 3 outlines the data and measurement methods employed.
Section 4 details the methodology.
Section 5 discusses and interprets the empirical results.
Section 6 concludes the study.
2. Literature Review
The concept of carbon intensity has emerged as a critical metric in assessing corporate sustainability, particularly for investors seeking to align their portfolios with ESG principles. Companies with lower carbon intensities often enjoy enhanced reputations and competitive advantages, as they are perceived as more environmentally responsible and forward-thinking. An increasing number of investors are integrating ESG information into their portfolio management strategies (
Serafeim & Yoon, 2023), making carbon emissions a clear investment criterion for ESG advocates and non-constrained institutional investors.
Busch et al. (
2016) emphasized that many institutional investors motivate their engagements in sustainable investing by claiming that companies focused on sustainability are likely to yield higher stock returns. This belief has resulted in developing various best-in-class portfolios and numerous ESG-centered strategies within institutional investment.
Much of the literature has explored the relationship between the carbon emissions and stock price returns of companies; however, research specifically examining the link between carbon emissions and stock price volatility is relatively scarce. When looking at the relationship between carbon intensity and stock return performance, the findings from empirical evidence remain inconclusive.
Cao et al. (
2023) identified a significant negative relationship between carbon emissions and the future performance of large companies in Hong Kong.
Reboredo and Ugolini (
2022) suggested that companies with lower carbon risk scores, which evaluate their vulnerability during the transition to a low-carbon economy, are likely to perform better financially. However,
Bolton and Kacperczyk (
2021) presented conflicting evidence that U.S. companies with higher total carbon dioxide emissions tend to outperform low-carbon companies and generate higher returns, controlling for size, book-to-market, and other return predictors. Their study found that some institutional investors may implement exclusionary screening based on direct emission intensity, which is the ratio of total carbon emissions to sales, particularly in select industries.
Krüger (
2015) explored the notion of “corporate goodness” in the realm of corporate social responsibility, which is defined as social or environmental practices that go beyond the legal or regulatory requirements (
Kitzmueller & Shimshack, 2012). This study revealed that negative events related to “corporate goodness” (e.g., poor environmental practices) can provoke strong negative reactions from investors, which may ultimately affect stock performance.
Chen et al. (
2025) examined the impact of carbon risk on stock returns for A-share listed Chinese companies and found a negative and statistically significant effect, revealing that carbon risk has a heterogeneous impact, with particularly strong negative effects on stock returns. Carbon risk reduces institutional investor shareholdings and analyst attention, especially in the sample of insurance companies. The findings suggest that institutional investors tend to reduce their holdings in high-carbon-risk firms, providing empirical support for Chinese financial regulators to develop differentiated regulatory frameworks to address carbon-related risks in the financial market.
Beyond the relationship between the carbon emissions and stock returns of companies, there has also been extensive research on how this connection relates to financial performance.
Matsumura et al. (
2014) discovered that firms with higher carbon emissions frequently experience negative financial consequences, including a decline in firm value and higher costs of capital. Their study revealed that a firm’s value decreased by USD 212,000 on average for every additional thousand metric tons of carbon emissions. The decrease in valuation is probably due to some investors viewing high-emission firms as riskier, with potential regulatory penalties and reputational damage.
Cao and Zhang (
2025) highlighted that the risks associated with climate change substantially affect the fundamental aspects of corporations.
Lee and Min (
2015) showed that investing in green research and development is positively associated with the financial performance of companies at the company level. Such investment in eco-innovation will help decrease carbon emissions and enhance company performance and stock returns.
Another extensively studied topic related to our subject in empirical research is the effect of oil price fluctuations on the global economy.
Kilian (
2014) demonstrated that oil price variations considerably influence the global economic landscape.
Ha et al. (
2024) found that oil price shocks accounted for 8.7% of the variance in inflation in a study encompassing 55 countries from 2001 to 2022. The study revealed that the impact of these shocks on inflation rates is much more pronounced in developed economies (29 out of 55 countries). Inflation was recorded at 10.8% in developed economies compared with just 3.5% in emerging economies. The heightened inflation driven by rising oil prices can contribute to increased interest rates, curtail consumer spending, and diminish demand for goods and services. These adverse effects can subsequently lead to declines in stock prices and have a negative impact on the overall performance of equity markets.
For the study of the relationship between oil price fluctuations and stock market returns,
Jones and Kaul (
1996) provided empirical evidence indicating that stock prices in the U.S. and Canadian markets experienced negative repercussions from oil price shocks during the postwar era.
Nandha and Faff (
2008) suggested that increasing oil prices detrimentally affect stock returns across various industries (except oil, mining, and gas sectors) based on a comprehensive analysis of 35 global industry indexes from April 1983 to September 2005. Conversely,
Basher and Sadorsky (
2006) presented strong evidence that rising oil prices positively influence excess returns in stock markets across 21 emerging economies. This is also evidenced by their study utilizing the Morgan Stanley Capital International World Index, covering December 1992 to October 2005. Moreover,
Boyer and Filion (
2007) demonstrated a positive correlation between fluctuations in crude oil and natural gas prices and stock market returns in Canada.
Regarding the impact of oil price shocks on stock price volatility,
Boldanov et al. (
2016) observed a time-varying correlation that oscillates around zero between oil prices and stock market volatility.
Khan et al. (
2023) examined the effects of oil price volatility on the stock markets of ten oil-importing countries, revealing that an increase in oil price volatility yields a detrimental effect on stock returns when both oil price volatility and stock returns are at low levels, while a positive impact is noted when these indicators are high.
Joo and Park (
2021) identified that oil price volatility exerts asymmetrical effects on stock returns, varying not only according to the level of stock returns, but also according to the prevailing conditions in the oil market.
To analyze the interplay among carbon emissions, stock volatility, and external factors, the methodologies proposed by
Diebold and Yilmaz (
2012,
2014) regarding connectedness represent a suitable and increasingly prevalent approach within the academic literature.
Li et al. (
2021) provided compelling evidence of a substantial connectedness between oil, commodities, and financial assets, indicating that U.S. markets exhibit greater connectivity to these prices than their Chinese counterparts.
Asadi et al. (
2022) empirically demonstrated that the West Texas Intermediate (WTI) oil price had a significant impact on the Shanghai stock market; conversely, the spillovers from coal and natural gas appeared to have negligible effects on the Chinese stock market.
Mensi et al. (
2023) performed a connectedness analysis between WTI crude oil and ten sectors of the Chinese stock market from 2007 to 2021, unveiling that the consumer discretionary and industrial sectors experienced positive net spillovers, while the utilities and telecommunication services sectors primarily acted as net recipients of return spillovers.
Yang et al. (
2024) examined the exogenous events inducing oil supply shocks, such as the Russia–Ukraine conflict in 2022, which intensified both the connectedness and risk spillover levels within the global financial system and China’s equity market.
Mensi et al. (
2025) presented empirical evidence showing that China continues to be a consistent net recipient of oil shocks, primarily due to its dependence on external demand and heavy reliance on energy imports.
Wang et al. (
2023) developed a connectedness network model to scrutinize the dynamic spillover effects between China’s crude oil futures and various sector stock indexes, suggesting that the overall spillover effect is predominantly a high-frequency phenomenon occurring over a time frame of one to five days. Regarding studies on the connectedness of other factors with stock markets,
Asadi et al. (
2022) empirically demonstrated a significant two-way spillover effect between the Shanghai stock market and the S&P 500, identifying it as the strongest pairwise linkage among the variables examined. Their study also indicates that the Shanghai stock market is significantly impacted by fluctuations in the USD/CNY exchange rate.
Building on the prior literature that explores the connections among financial assets, our approach introduces a novel perspective by focusing on firm-level carbon intensity. Instead of analyzing broad market trends, we aim to calculate the carbon intensity of individual firms and use these data to construct two distinct indexes: one for high-carbon firms and another for low-carbon firms. This approach differs slightly from previous research, which often emphasizes aggregate market-level analyses or sectoral comparisons. Adopting a firm-specific perspective will provide deeper insights into the relationship between carbon intensity and financial dynamics. Our study seeks to bridge a gap in the existing literature by delivering a more granular understanding of how carbon intensity affects financial performance and market behavior. We anticipate that this contribution will enhance the discourse on sustainable finance and inform strategies for effectively managing carbon-related risks in financial markets.
3. Data and Measures
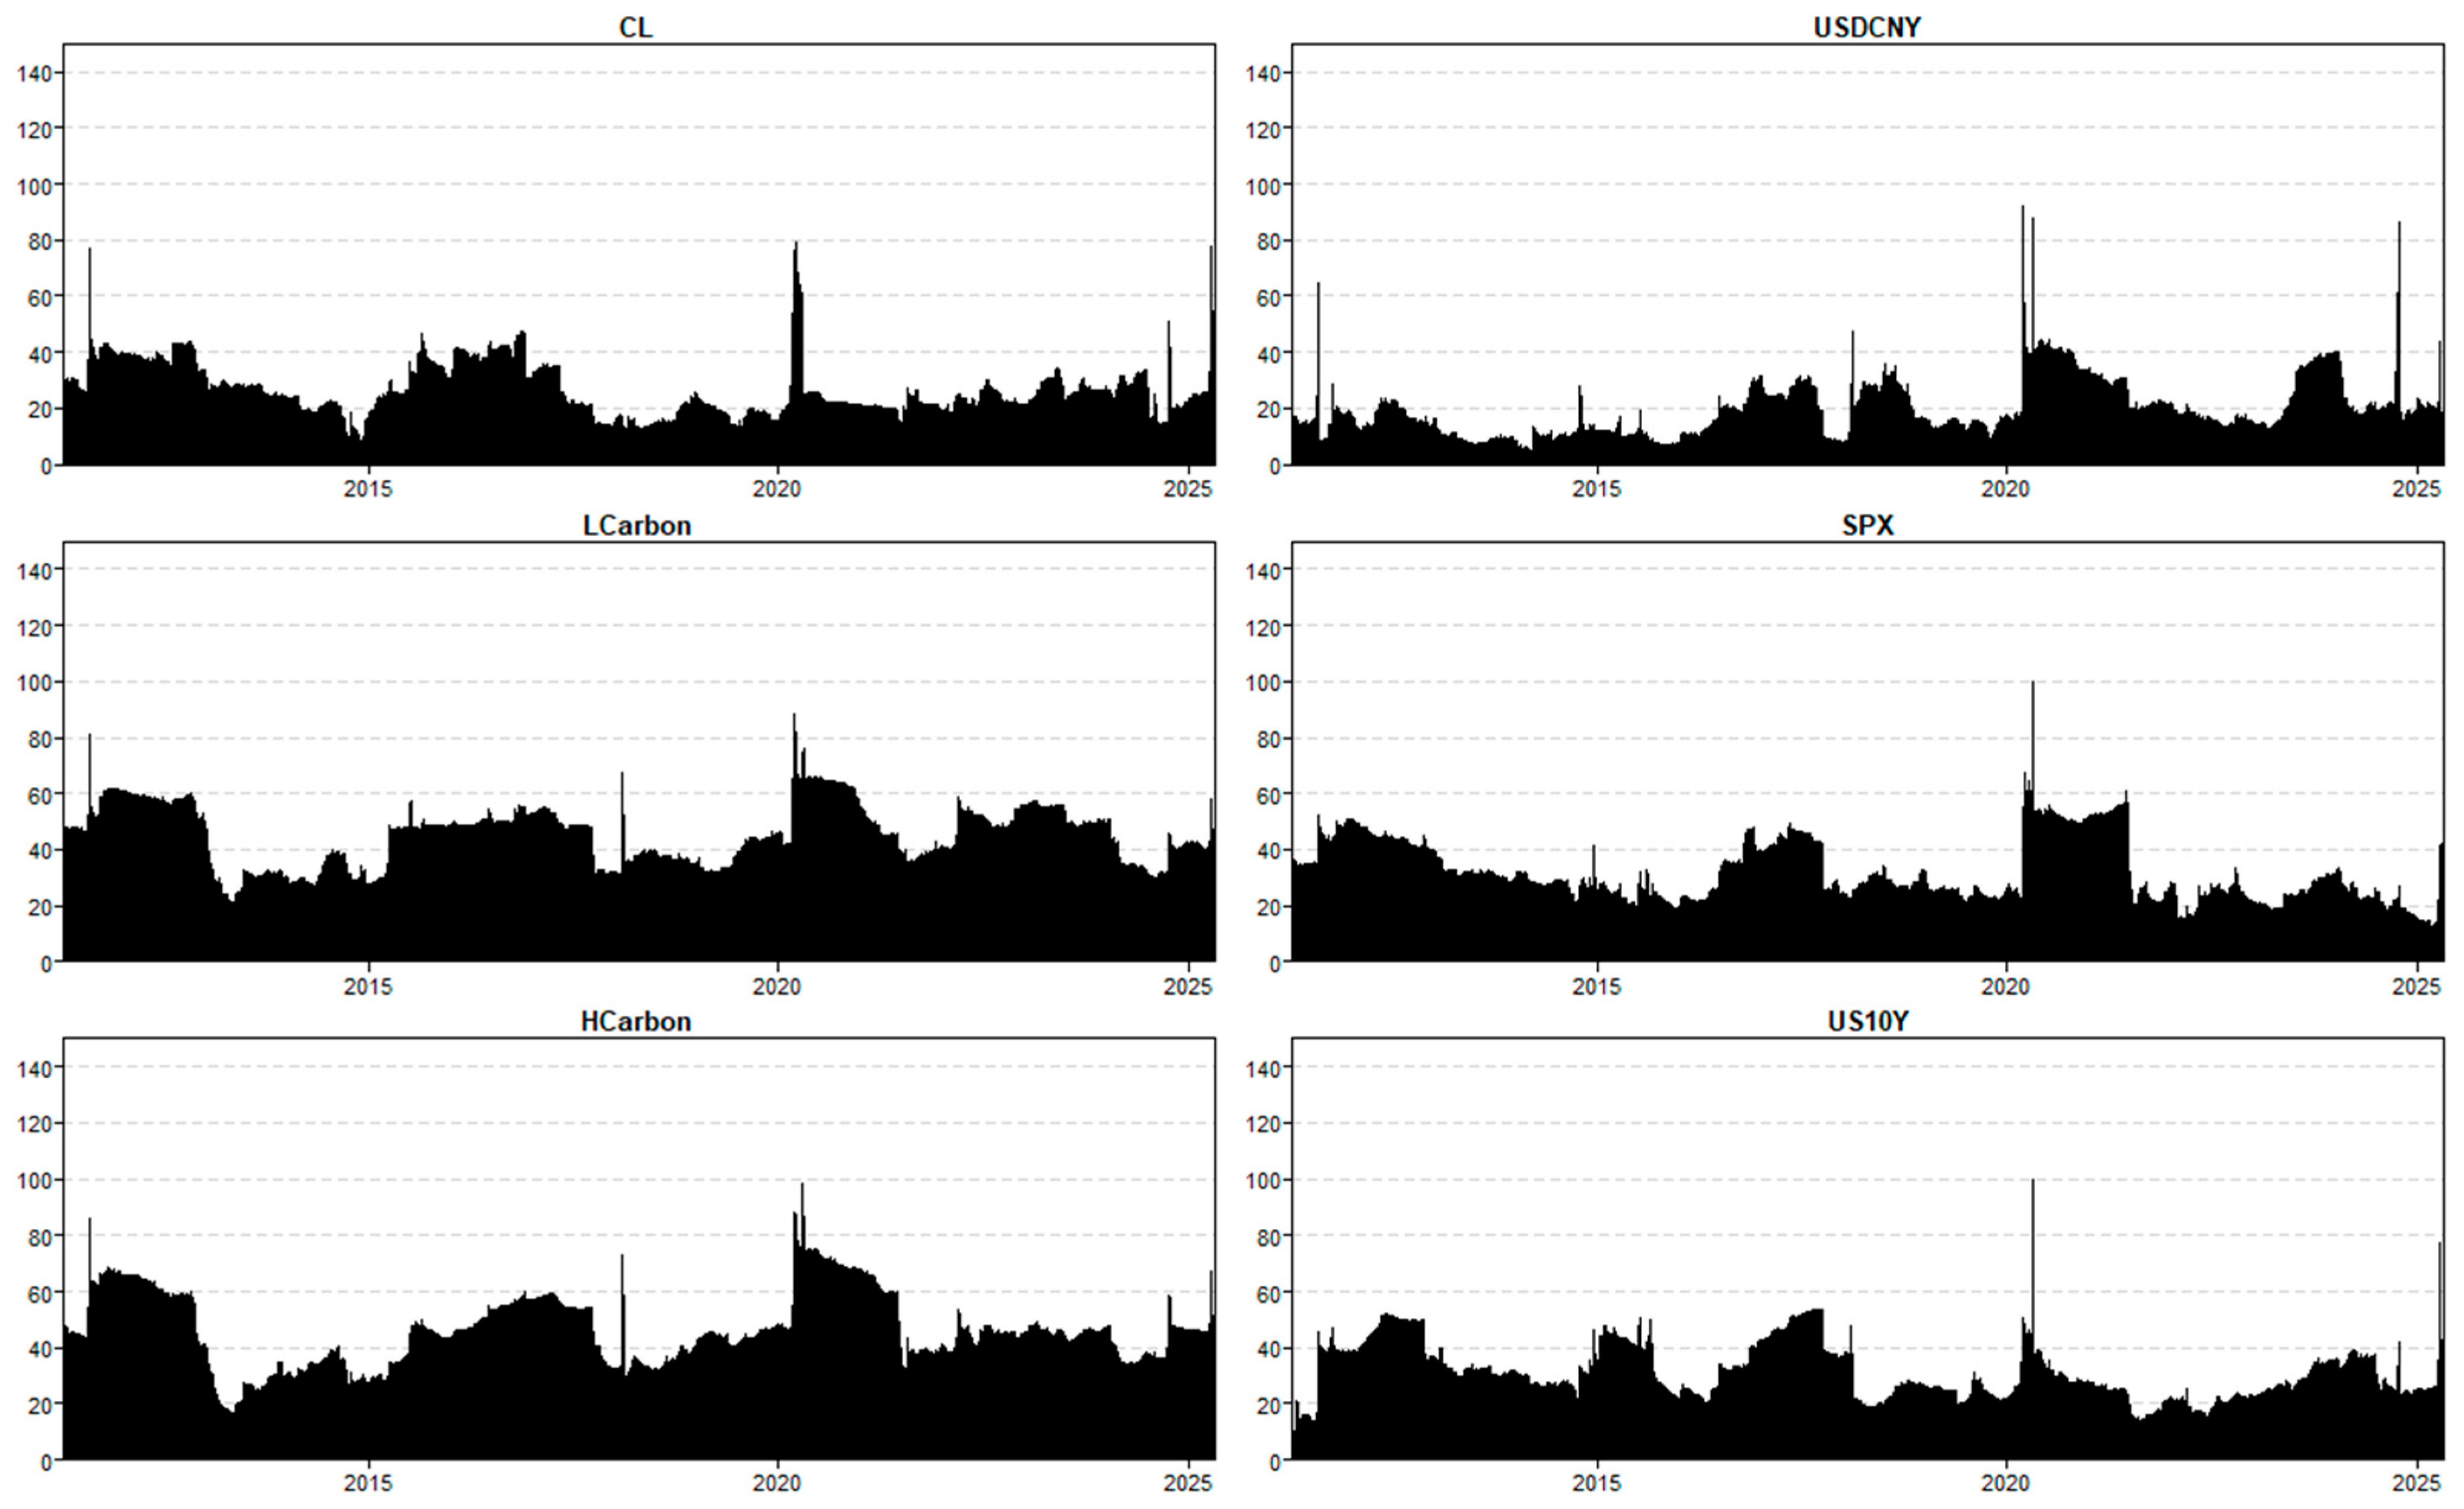
Our study examines the connectedness of the annualized daily volatility of high-carbon- and low-carbon-intensity constituent stocks of the HSI and four external factors, including oil prices, USDCNY exchange rates, S&P 500 returns, and 10-year Treasury rates, over the period from 31 December 2009 to 30 April 2025:
LCarbon: Low-carbon index derived from the 20 HSI constituent stocks with the lowest value of “GHG emissions per USD 1 million revenue”;
HCarbon: High-carbon index derived from the 20 HSI constituent stocks with the highest value of “GHG emissions per USD 1 million revenue”;
CL: Price of the second-nearest maturity WTI crude oil futures contract traded on the New York Mercantile Exchange (NYMEX);
USDCNY: US dollar to Chinese yuan/renminbi exchange rate;
SPX: S&P 500 Index;
US10Y: U.S. 10-year Treasury yield (the choice to use Treasury rates instead of the London Interbank Offered Rate [LIBOR] or Hong Kong Interbank Offered Rate [HIBOR] as the interest rate variable is based on the absence of daily high and daily low data for the LIBOR and HIBOR, which renders them unsuitable for calculating the annualized daily volatility).
The reasoning behind choosing these variables lies in the fact that oil prices significantly influence energy markets, directly impacting carbon-intensive sectors and the shift toward sustainable alternatives. The USDCNY exchange rates are essential for trade competitiveness and input expenses, especially for Chinese companies, which are major contributors to global carbon emissions. S&P 500 returns reflect overall investor sentiments and capital movements, with an increasing focus on sustainability and ESG factors, affecting the performance of low-carbon stocks. The 10-year Treasury rates indicate the borrowing costs and risk-free interest rates, which influence corporate financing and investments in green initiatives. Collectively, these elements offer a thorough understanding of the macroeconomic landscape shaping low-carbon stocks, underscoring the connections between external factors and sustainable financial outcomes.
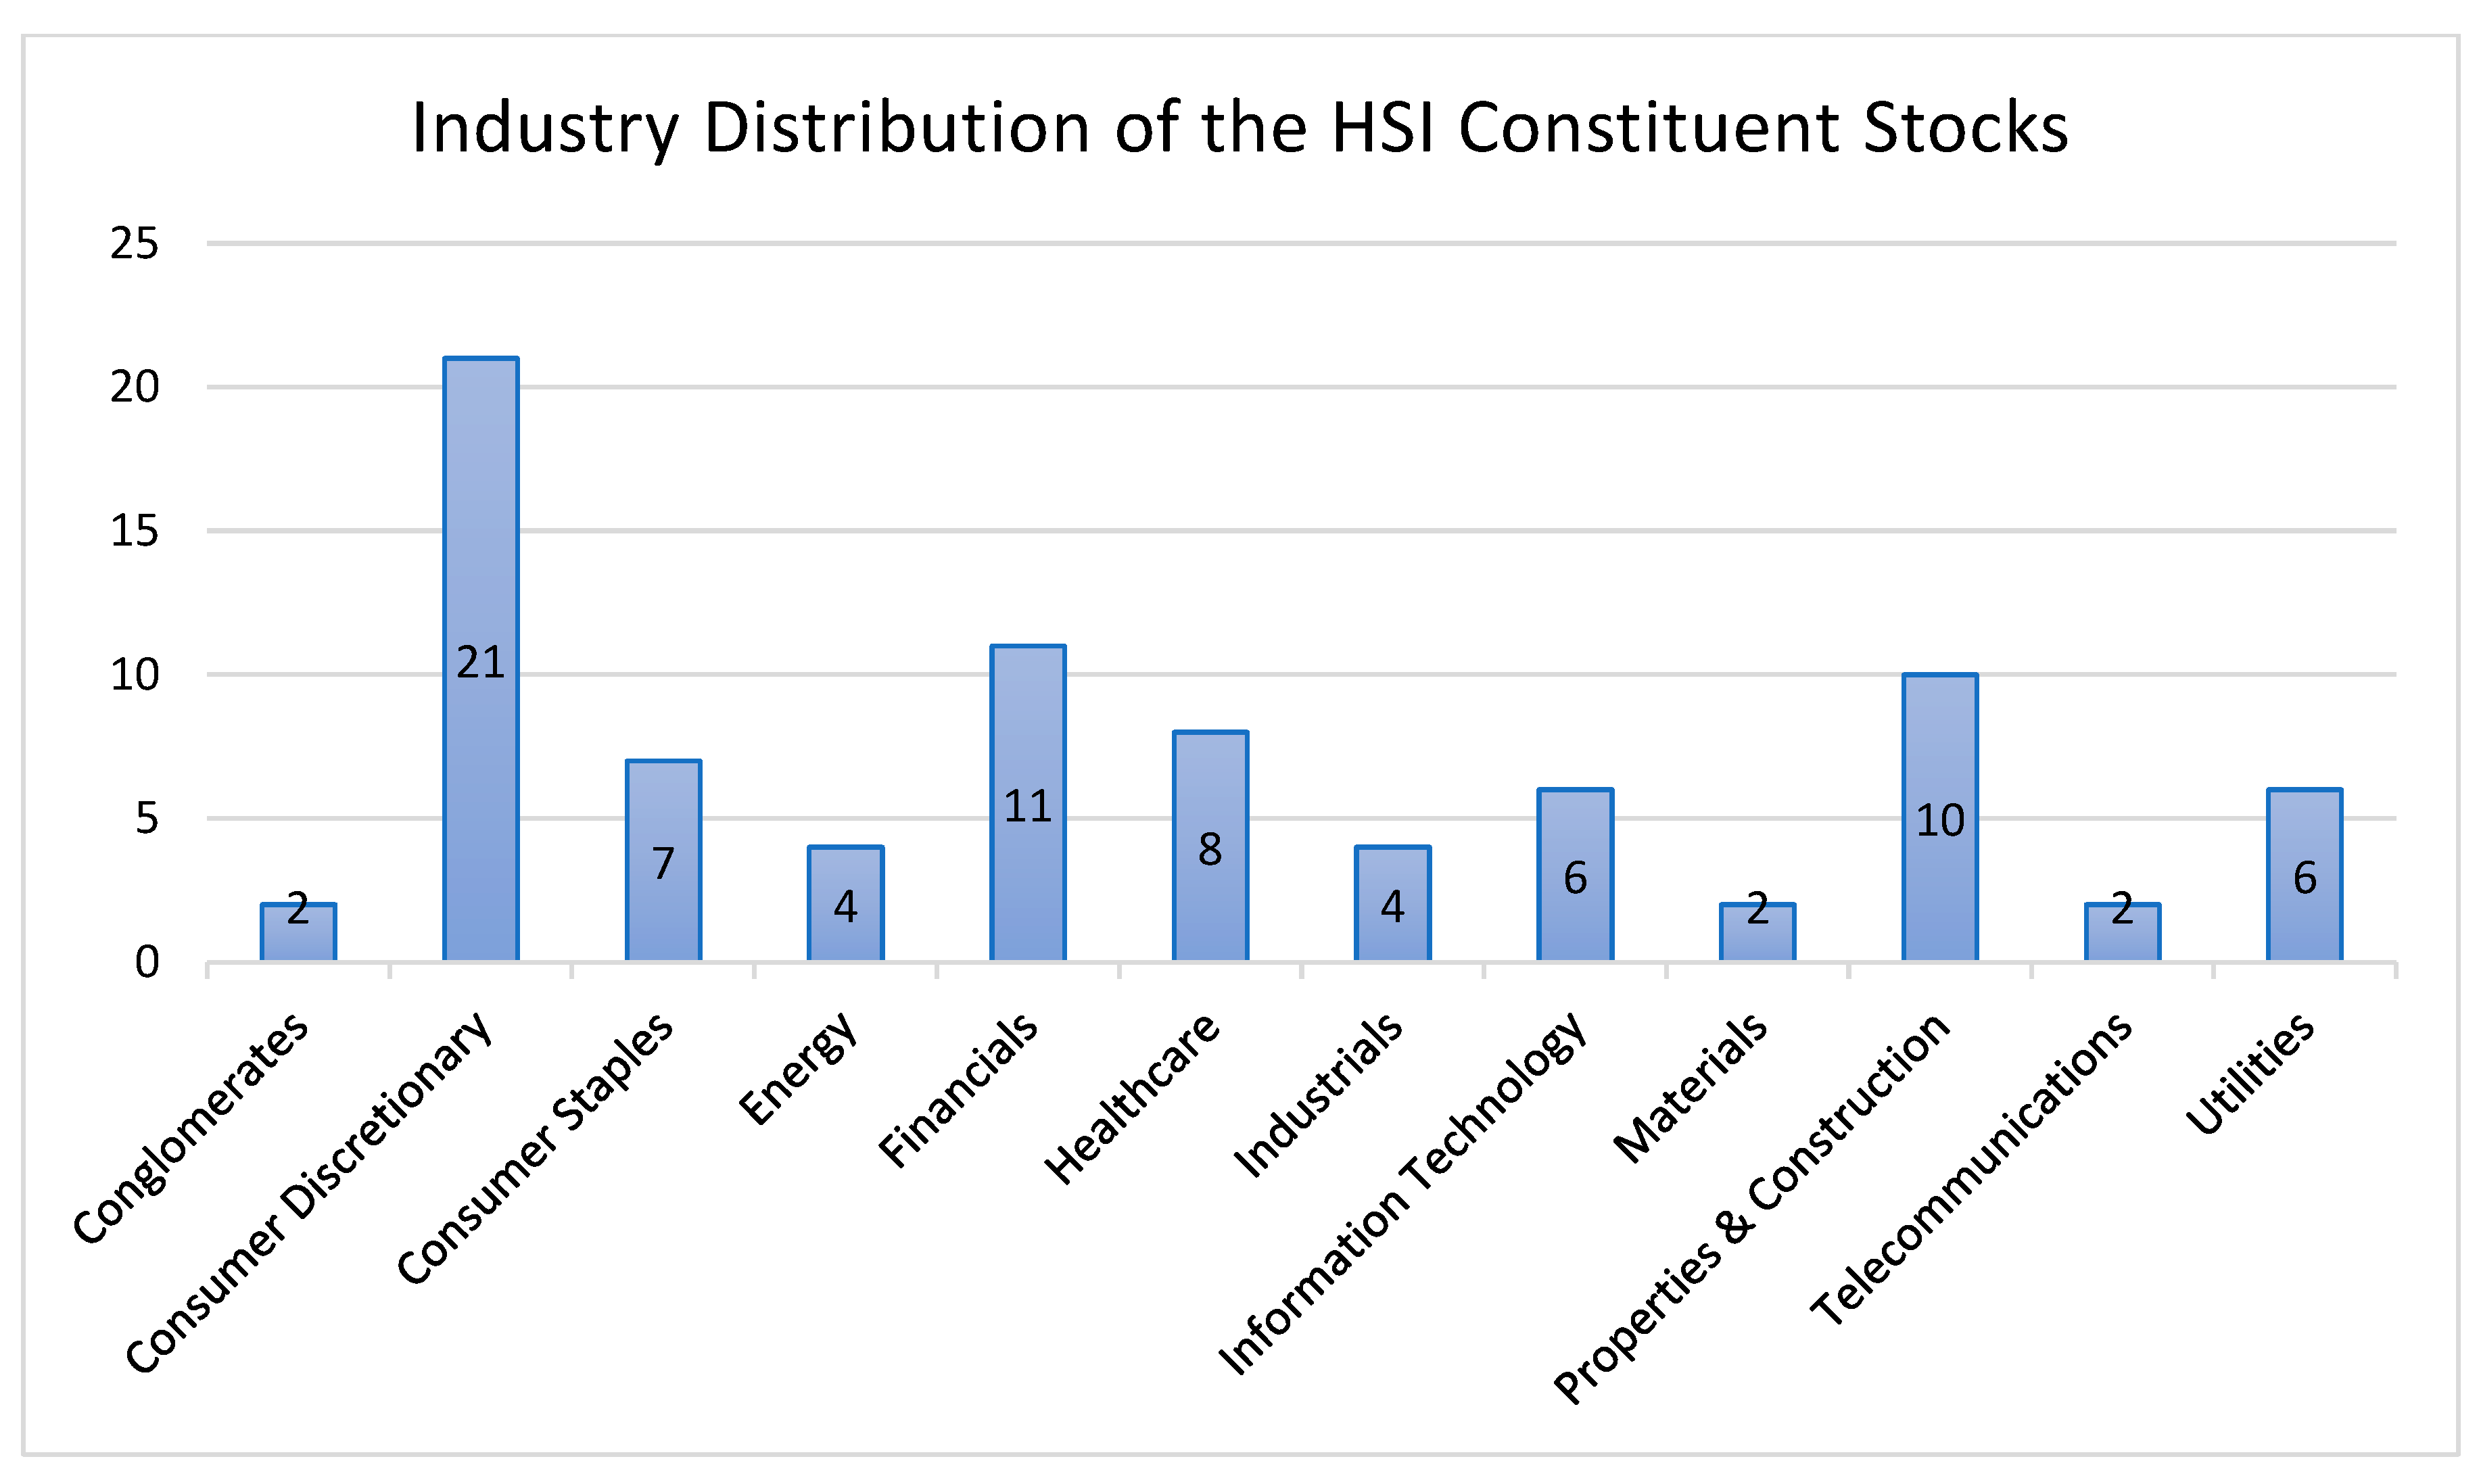
The HSI, established on 24 November 1969, is the most recognized equity benchmark in Hong Kong for tracking the largest and most liquid companies listed on the Hong Kong Stock Exchange (HKEx). As of 30 April 2025, the HSI consists of 83 constituent stocks spanning 12 industries (
Figure 1), offering a broad view of Hong Kong’s equity market. In 2013, HKEx launched the ESG Reporting Guide to encourage listed companies in Hong Kong to share their ESG practices on a voluntary basis, allowing companies to decide whether to disclose their sustainability development efforts. Significant changes have taken place in the amendments of the ESG Guide and Listing Rules, which took effect on 1 July 2020, introducing mandatory disclosure requirements including carbon emissions data for Scope 1 and Scope 2. This shift improved transparency and aligned Hong Kong’s reporting practices with global sustainability standards, reflecting the growing importance of ESG considerations in corporate governance and investment decision-making while ensuring that companies manage climate-related risks and opportunities responsibly.
The first step of our study is to identify the companies in 83 HSI constituent stocks that exhibit high or low carbon intensities. The term “carbon intensity” typically refers to the total GHG emissions produced per unit of revenue generated by a company. Carbon dioxide (CO2) is the most commonly emitted GHG by human activities, primarily due to fossil fuel combustion. Carbon emissions are usually quantified in metric tons of CO2 equivalent (tCO2e). This measurement also takes into consideration other GHGs, such as methane (CH4) and nitrous oxide (N2O), which also significantly contribute to global warming. These gases are converted into tCO2e based on their global warming potential (GWP), enabling the creation of a standardized metric that illustrates the differing impacts of various GHGs on climate change.
Scope 1—Direct emissions from fuel combustion in company-owned sources;
Scope 2—Indirect emissions from purchased electricity, heat, cooling, or steam;
Scope 3—Indirect emissions from the company’s value chain.
The HKEx mandates that listed companies disclose ESG information, which includes total Scope 1 and Scope 2 GHG emissions, in accordance with its sustainability reporting guidelines. Scope 3 disclosure is optional, and many listed companies do not include this information in their sustainability reports. Consequently, we will focus on total Scope 1 and Scope 2 GHG emissions to assess the carbon emission levels of companies among the HSI constituent stocks.
For Scope 2 indirect GHG emissions, the sustainability reports of certain Hong Kong listed companies provide both market-based and location-based figures. From an analytical standpoint, using location-based figures is more appropriate, as they offer a more accurate representation of a company’s environmental impact. Location-based emissions are determined based on the average emissions intensity of the electricity grid in the region where the company operates, reflecting the actual energy mix of the local grid. This approach ensures standardized comparisons across companies in different regions, avoiding discrepancies that may arise from market-based reporting, which can be influenced by renewable energy certificates or green energy contracts. Location-based figures enhance transparency and accountability, providing a clearer understanding of a company’s sustainability performance and true environmental footprint.
Under the listing rules of the HKEx, all listed companies in Hong Kong are required to publish their financial statements within three months after the end of their financial year and issue their annual reports within four months. Most listed companies also release their ESG reports or sustainability reports on the same day as their annual reports, or integrate them into the annual report. A significant number of listed companies have a fiscal year ending in December, meaning that they must publish their annual reports on or before April 30 of the following year. Since our carbon emission data are collected in early May 2025, they include the most current information available, reflecting the annual figures for 2024.
To facilitate fair comparisons among companies of varying sizes, our study normalizes carbon emissions by using Scope 1 and Scope 2 GHG emissions per USD 1 million in revenue. Among the 83 HSI constituent stocks, only 10 companies report in USD, while 18 report in HKD and 55 in CNY. To maintain consistency in our analysis, we converted the HKD and CNY figures into USD using the average exchange rates of 7.20083 for USDCNY and 7.80283 for USDHKD for the period from January to December 2024. This standardization allows for accurate comparisons across all companies.
Our primary source for these figures is the Wind ESG database, which provides GHG emission data for 61 out of the 83 HSI constituent stocks. For the remaining 22 companies, 17 disclose their Scope 1 and Scope 2 GHG emissions in their Hong Kong annual reports. Five companies, including JingDong (9618.HK), BaiDu (9888.HK), New Oriental (9901.HK), Trip.com (9961.HK), and Alibaba (9988.HK), are listed secondarily in Hong Kong and are subject to different regulatory requirements to primary-listed companies, which means that they do not provide GHG emission data in their Hong Kong annual reports. Among these, four companies (JingDong, BaiDu, New Oriental, and Trip.com) disclose GHG emissions data in their U.S. reports. For New Oriental, the most recent report containing GHG emissions data was published in 2020, with no updates since. An examination of its 2020 GHG emissions per USD 1 million in revenue ranked it 36th among the 83 HSI constituent stocks, indicating that it does not fall within the top or bottom 20, and thus does not significantly affect our categorization of constituent stocks into low-carbon and high-carbon indexes.
Table 1 presents the 83 HSI constituent stocks ranked in ascending order of GHG emissions per USD 1 million in revenue.
Table 2 provides the average GHG emissions per USD 1 million in revenue of the HSI constituent stocks categorized by industry. The top 20 stocks in the table are identified as low-carbon intensity companies and constitute the LCarbon index. The bottom 20 stocks are classified as high-carbon-intensity companies for the HCarbon index. The GHG emissions for the 20 companies in the LCarbon index amount to 3.99 metric tons per USD 1 million in revenue, whereas those in the HCarbon index emit 1728.94 metric tons per the same revenue. This stark difference underscores a significant gap in carbon intensities between the two groups. The companies selected for the LCarbon index operate in financial services, property development, consumer discretionary, healthcare, and information technology sectors. These are generally less energy intensive than heavy manufacturing or resource extraction. For example, the financial services sector, including banking and insurance, as well as information technology companies, typically operate in office environments that require significantly less energy than manufacturing or resource extraction industries. The consumer discretionary sector, which encompasses retail products and services, usually has a lower carbon intensity due to its predominantly service-oriented nature. Property development also tends to produce a lower carbon intensity, given its operational characteristics that involve minimal direct electricity or fuel consumption.
In contrast, the companies included in the HCarbon index primarily operate in sectors such as utilities, energy, heavy manufacturing, and resource extraction, which are inherently energy intensive and heavily reliant on fuel or electricity to sustain their operations. For instance, Power Assets (0968.HK), CLP Holdings (0006.HK), and China Resources Power (0836.HK) are major electricity producers with significant reliance on fossil fuels like coal. China Shenhua (1088.HK), one of China’s largest coal mining and energy companies, is heavily involved in coal extraction and combustion for power generation. Similarly, China Hongqiao (1378.HK), a leading aluminum producer, engages in energy-intensive aluminum smelting processes that require substantial electricity. Although SMIC (0981.HK) is categorized within the information technology sector, its core business, semiconductor manufacturing, involves significant electricity consumption, leading to a high carbon intensity.
For the 40 stocks selected for constructing the LCarbon and HCarbon indexes, we retrieved the daily high and low prices for each stock from the Wind database, covering the period from 31 December 2009 to 30 April 2025. The daily variance of data is calculated by following
Parkinson (
1980) and
Diebold and Yilmaz (
2012,
2014):
where
and
are the daily highest and lowest price of market
i on day
t. The daily variance is converted into annualized daily volatility using the following equation:
then, the annualized daily volatilities of individual stocks are aggregated on an equally weighted basis to construct the LCarbon and HCarbon indexes.
Table 3 presents the descriptive statistics of the annualized daily volatility for six asset classes, which reveal significant differences in their volatility profiles. The first point worth noting is that low-carbon stocks tend to exhibit higher volatility on average than high-carbon stocks (34.41% for LCarbon vs. 30.89% for HCarbon). One might reasonably expect that companies with smaller carbon intensities would be more resilient in the face of market shocks and demonstrate lower volatility, owing to their alignment with sustainable practices and reduced exposure to regulatory and environmental risks. The rationale behind this expectation is that low-carbon companies, which often operate in energy-efficient sectors, are less dependent on fossil fuels and energy-intensive processes. Theoretically, this should protect them from risks tied to fluctuating energy prices, stricter environmental regulations, and the ongoing shift toward a low-carbon economy. Moreover, these companies are frequently favored by socially responsible investors, which can provide a stabilizing influence on their stock prices.
However, the actual statistics challenge this assumption due to the inherent characteristics of industries that typically have lower carbon intensities. Many low-carbon firms operate in pharmaceutical research and development, information technology, online consumer goods, and financial services. These are highly dynamic and subject to rapid shifts in innovation cycles, consumer preferences, and competitive pressures. These industries often experience significant uncertainty in their business models, revenue streams, and profitability, leading to increased stock performance volatility. Technology firms and e-commerce companies are especially vulnerable to changes in innovation trends and consumer tastes, leading to significant fluctuations in their stock values. Conversely, high-carbon companies such as utilities and energy producers are inherently energy intensive and belong to sectors that tend to have more stable business models. Their customer bases, revenues, and profits typically fluctuate only slightly yearly, and they often provide consistent dividend payments. This stability contributes to lower volatility in their stock prices. For example, electricity producers like Power Assets (0968.HK), CLP Holdings (0006.HK), and China Resources Power (0836.HK) usually experience predictable demand patterns with a stable number of customers, which shields them from sudden market shocks. Therefore, high-carbon stocks may exhibit lower volatility than their low-carbon counterparts. This finding challenges the conventional belief that low-carbon stocks are inherently less risky and underscores the importance of considering sector-specific dynamics when evaluating stock volatility.
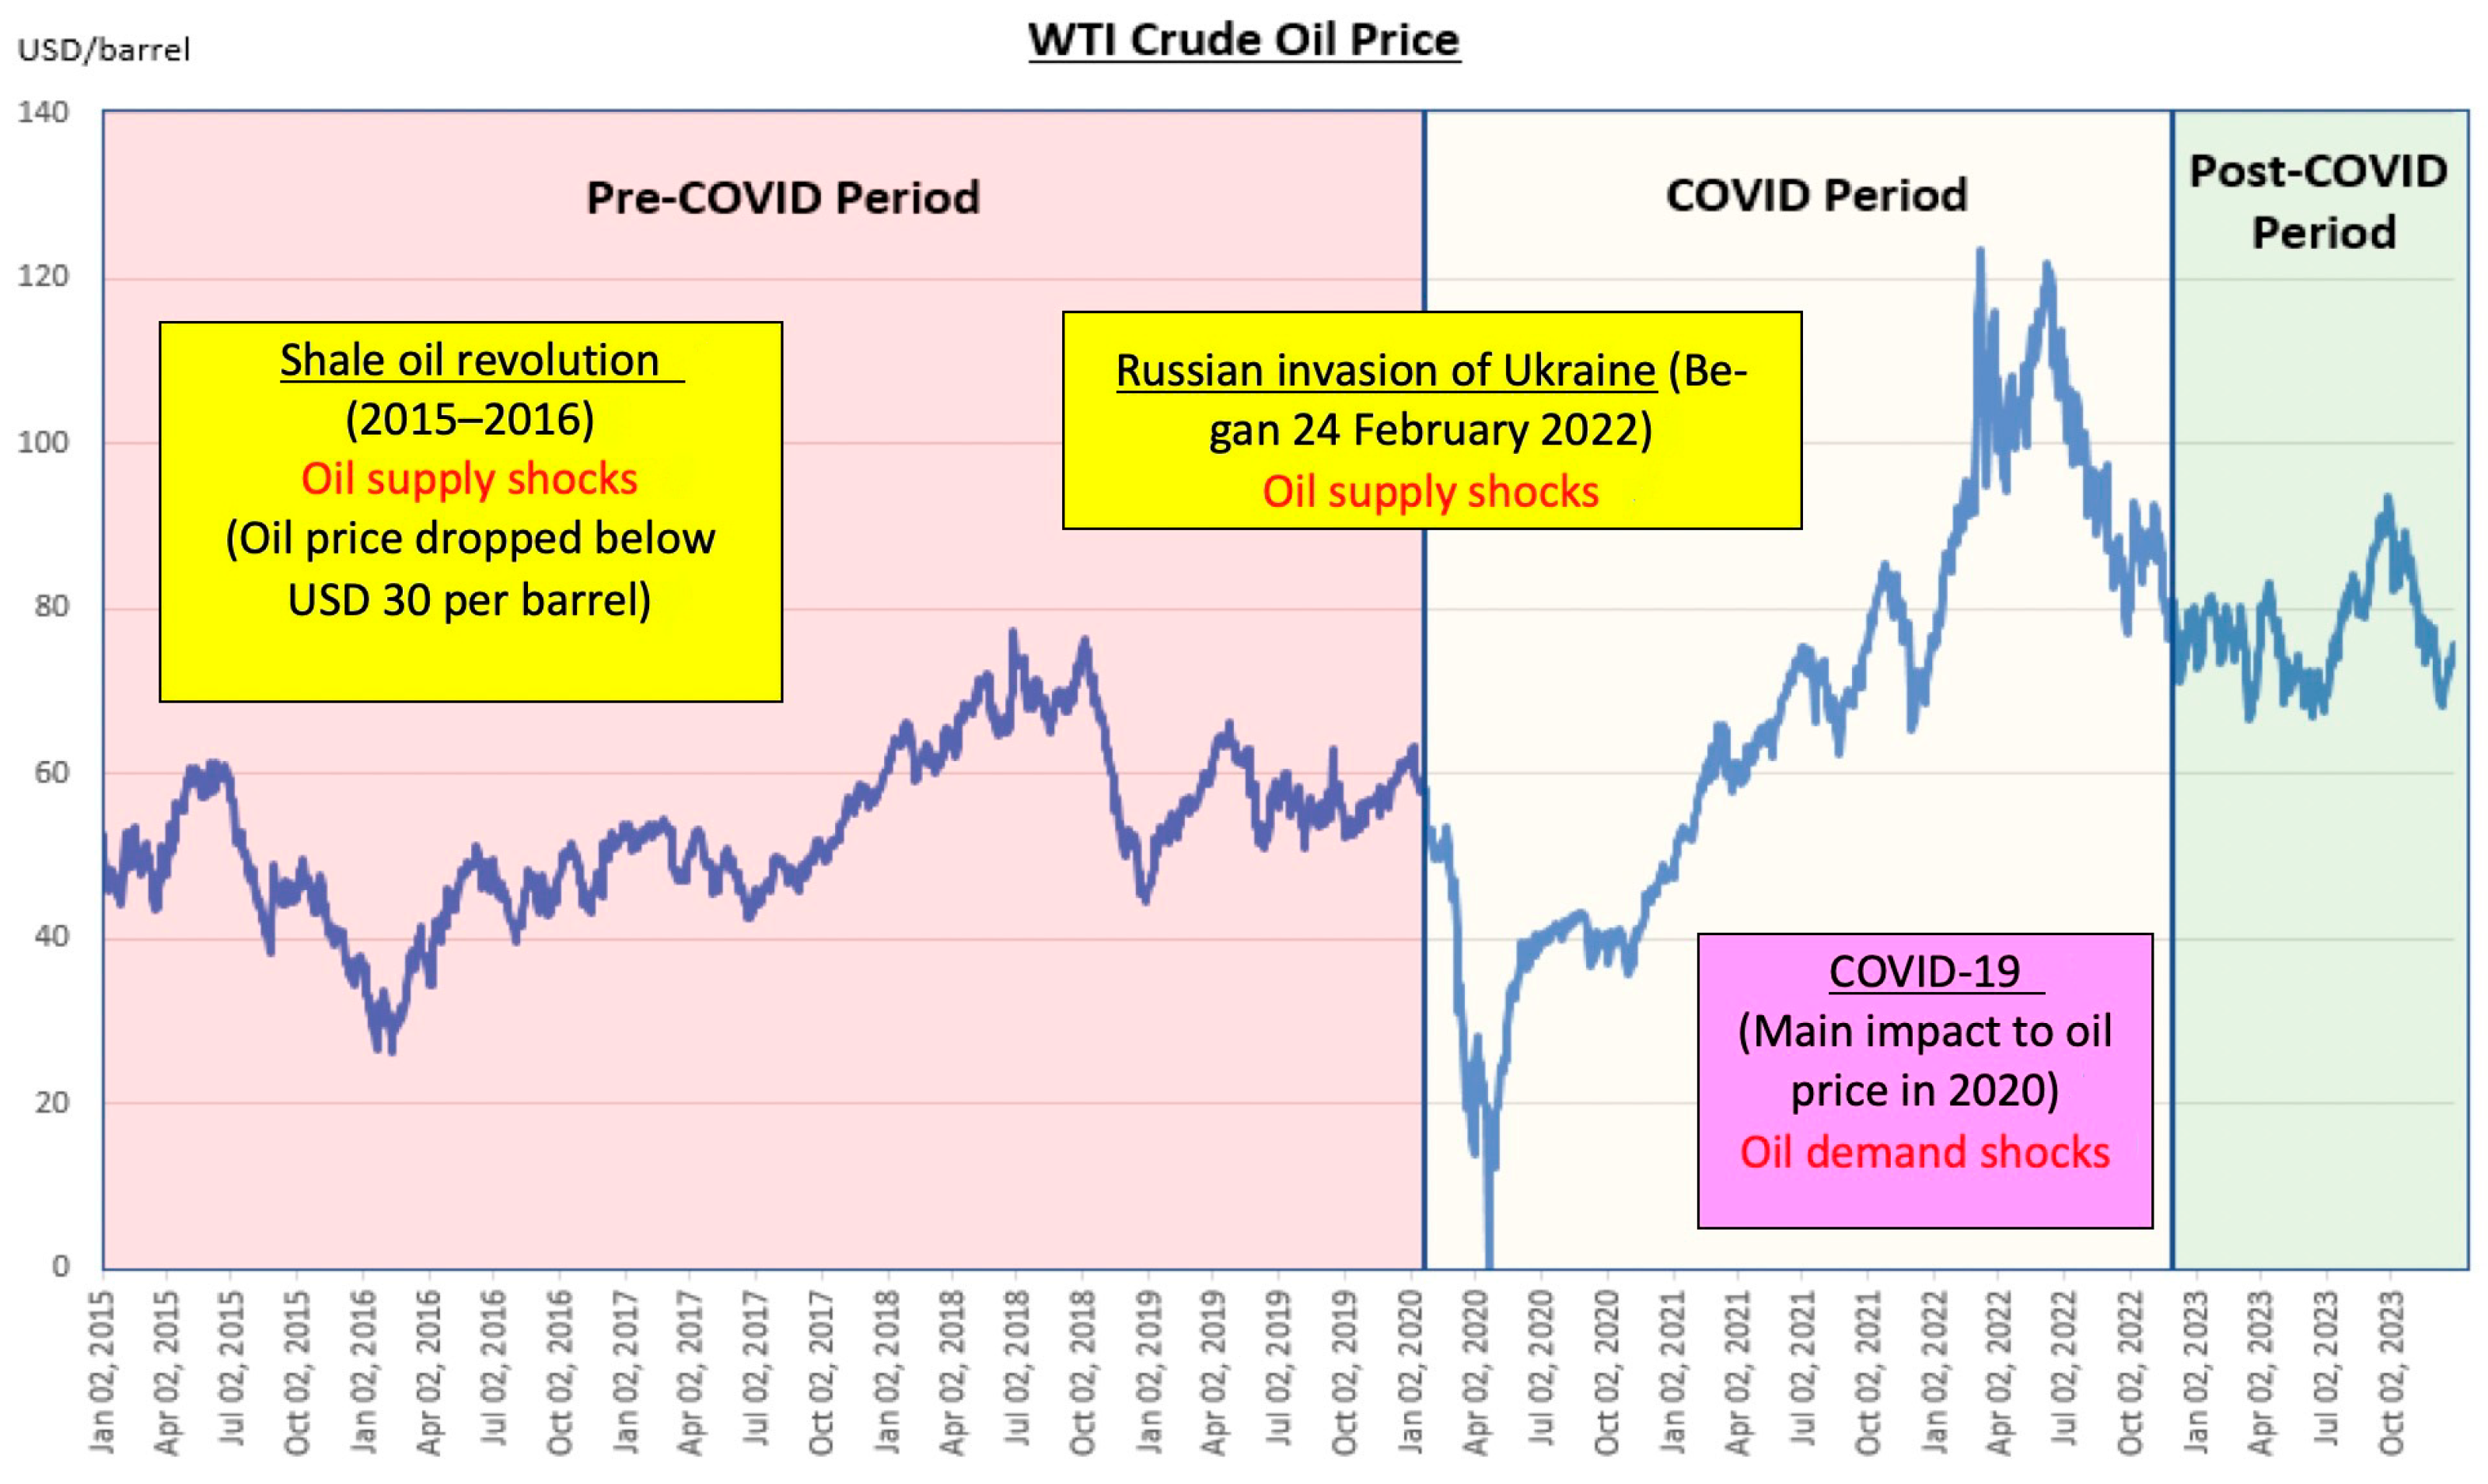
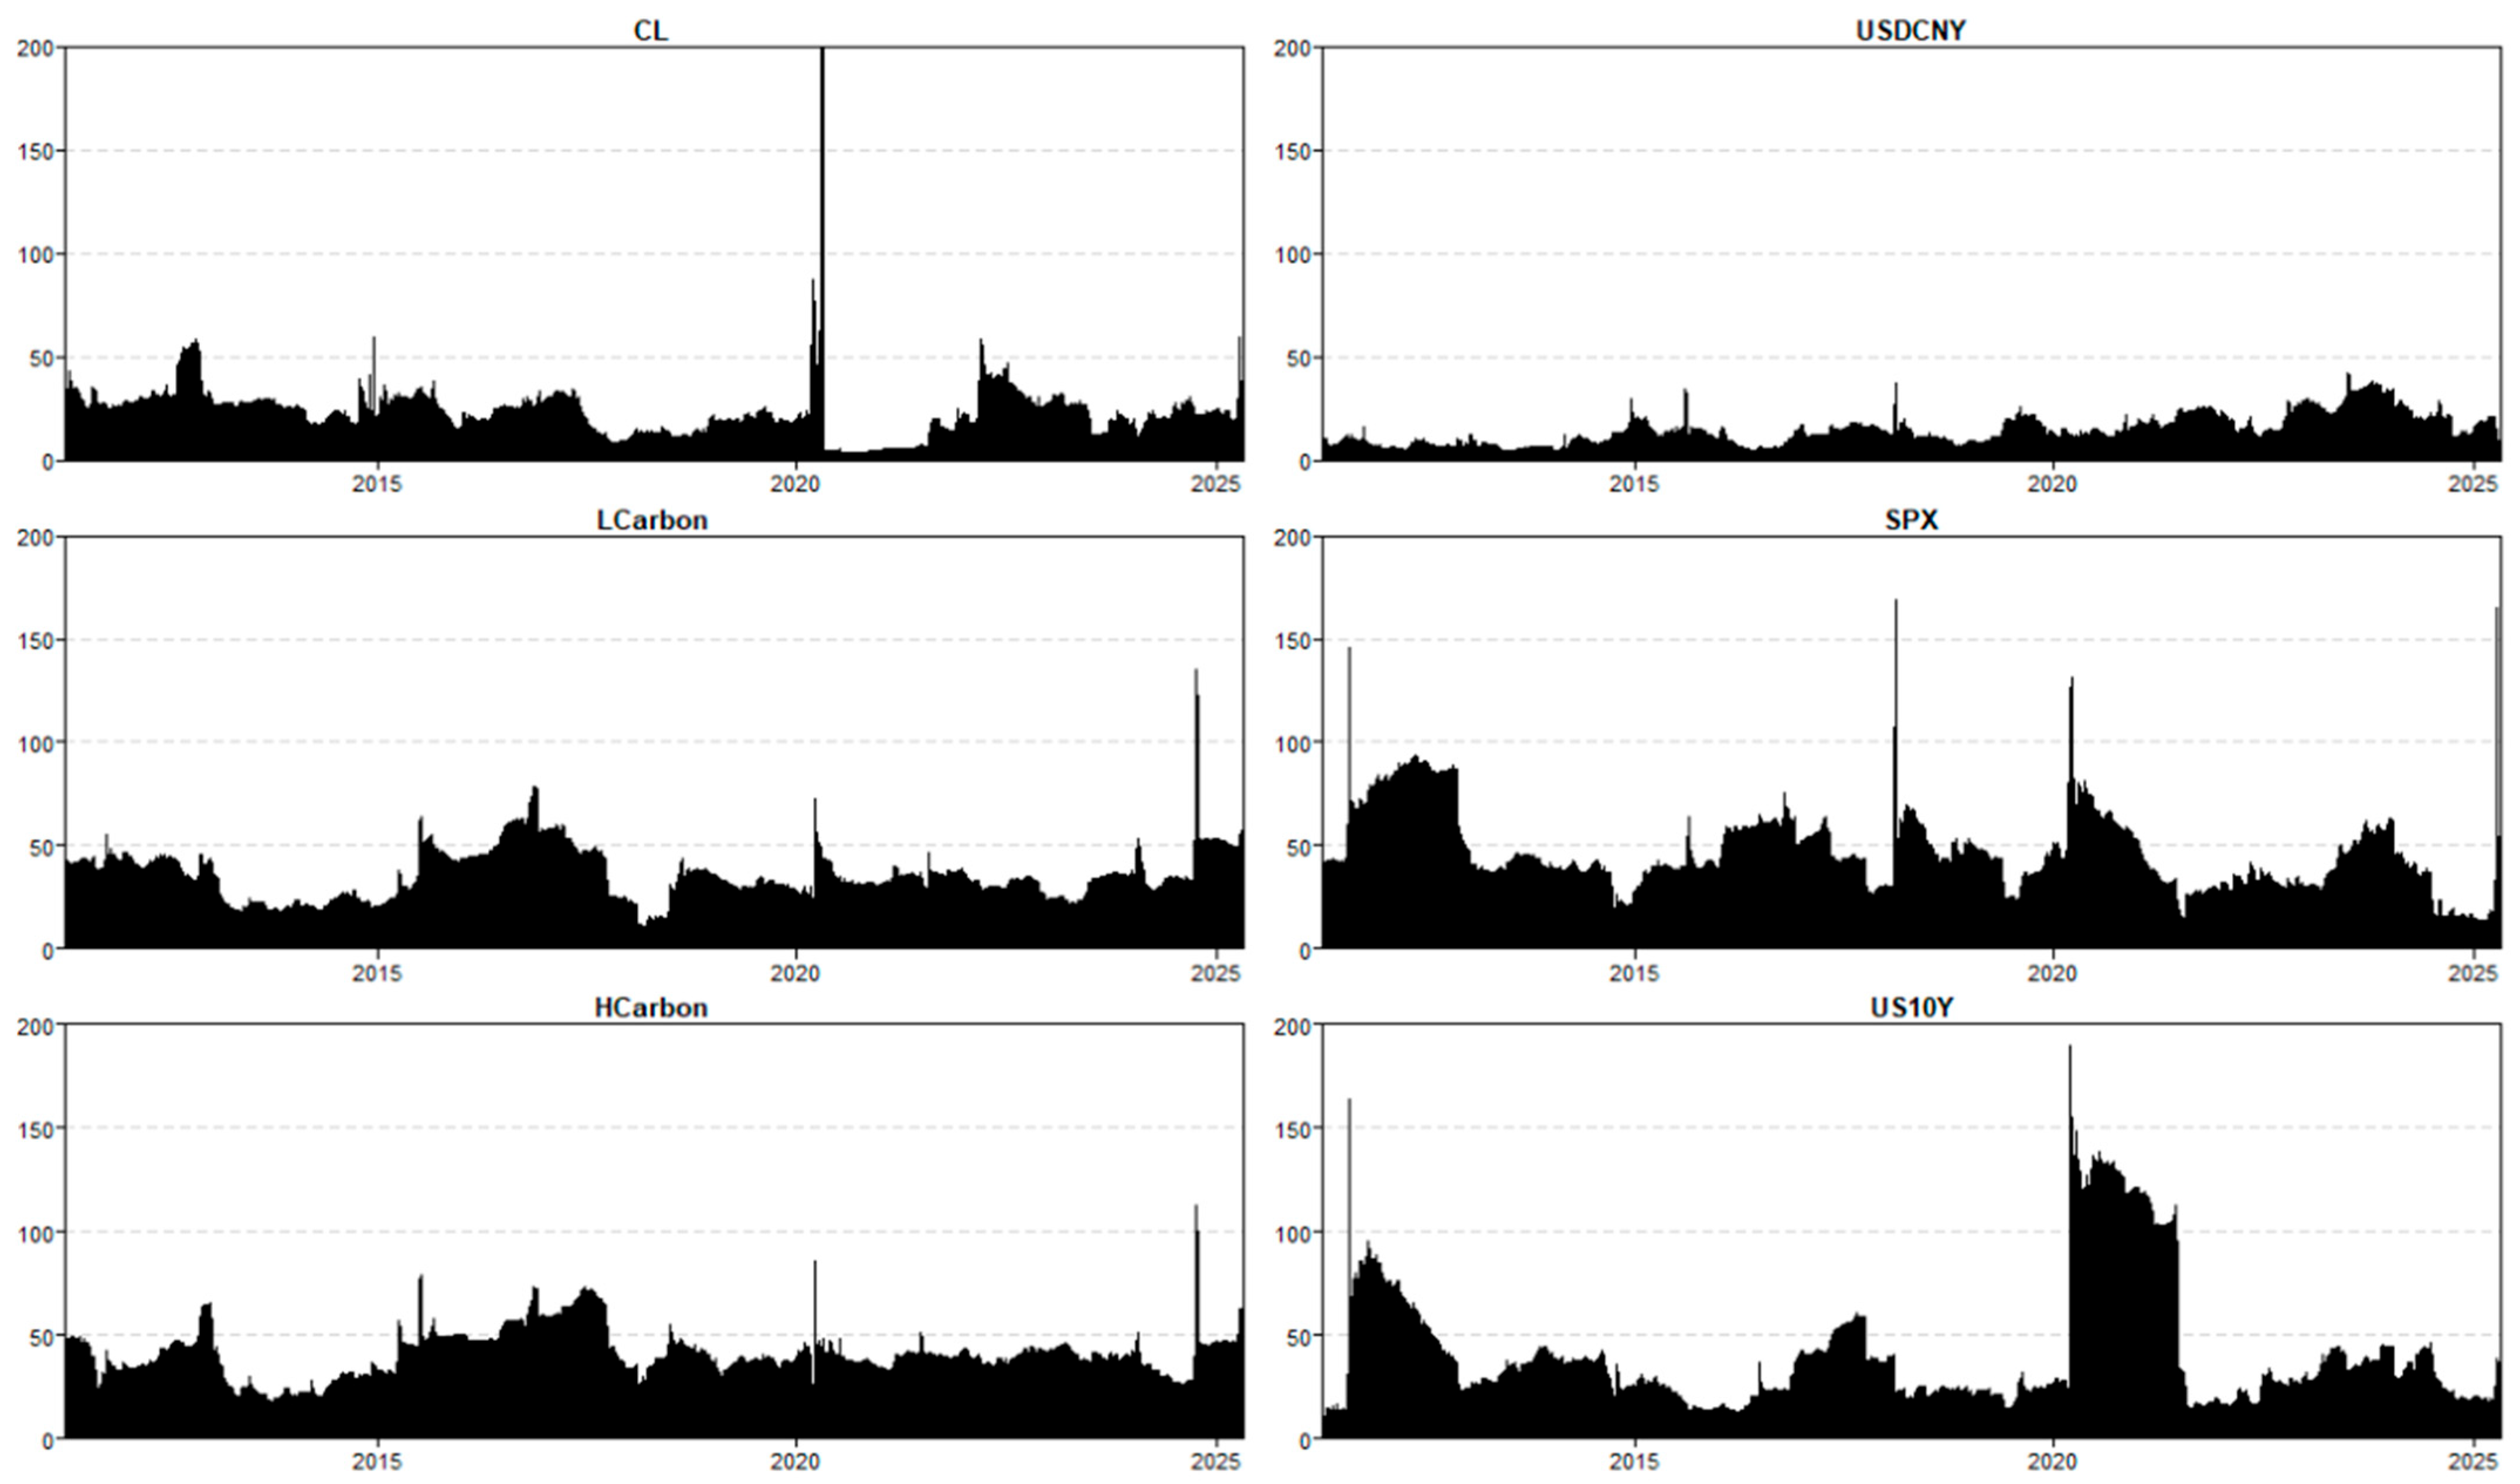
Another significant point is that the oil price (CL) reached an extraordinary maximum volatility of 1429.42, primarily driven by an unprecedented collapse in crude oil futures prices on 20 April 2020. This extraordinary event was precipitated by the global COVID-19 pandemic, which led to widespread lockdowns and a sharp decline in economic activity. The ensuing panic in the market further intensified price fluctuations and volatility, leading to a drastic drop in oil demand (
Figure 2). On that day, traders holding long positions were compelled to sell at any price to avoid taking physical deliveries of oil that they had no means to store. This resulted in a dramatic sell-off, causing the WTI crude oil futures contract to fall into negative territory for the first time in history. The study of extraordinary oil price volatility is crucial for understanding the connectedness of carbon intensity and stock market performance. The extreme volatility reveals the vulnerability of sectors to energy shocks, affecting investor sentiment and stock market behavior. Insights from these fluctuations inform on the impact of energy markets on carbon-intensive firms and their financial sustainability.
After the dramatic collapse of oil prices driven by the COVID-19 pandemic and a global demand shock in 2020, oil markets experienced a remarkable recovery in 2021 and surged to new highs in 2022, fueled by geopolitical tensions stemming from Russia’s invasion of Ukraine. The conflict disrupted global energy markets, as Russia is a major oil and gas exporter. Sanctions on Russian energy exports and fears of supply shortages drove prices upward, with Brent crude surpassing $120 per barrel. This rebound underscored the sensitivity of oil markets to geopolitical events and the critical role of energy in global stability.
5. Empirical Findings
We follow the methodology of
Diebold and Yilmaz (
2012) to build the VARs of order 4 and an H-step ahead forecast horizon of 20 days for the connectedness analysis of LCarbon, HCarbon, CL, USDCNY, SPX, and US10Y. Given the large sample size of 3491 observations in our data, we select a rolling window size of 300 days.
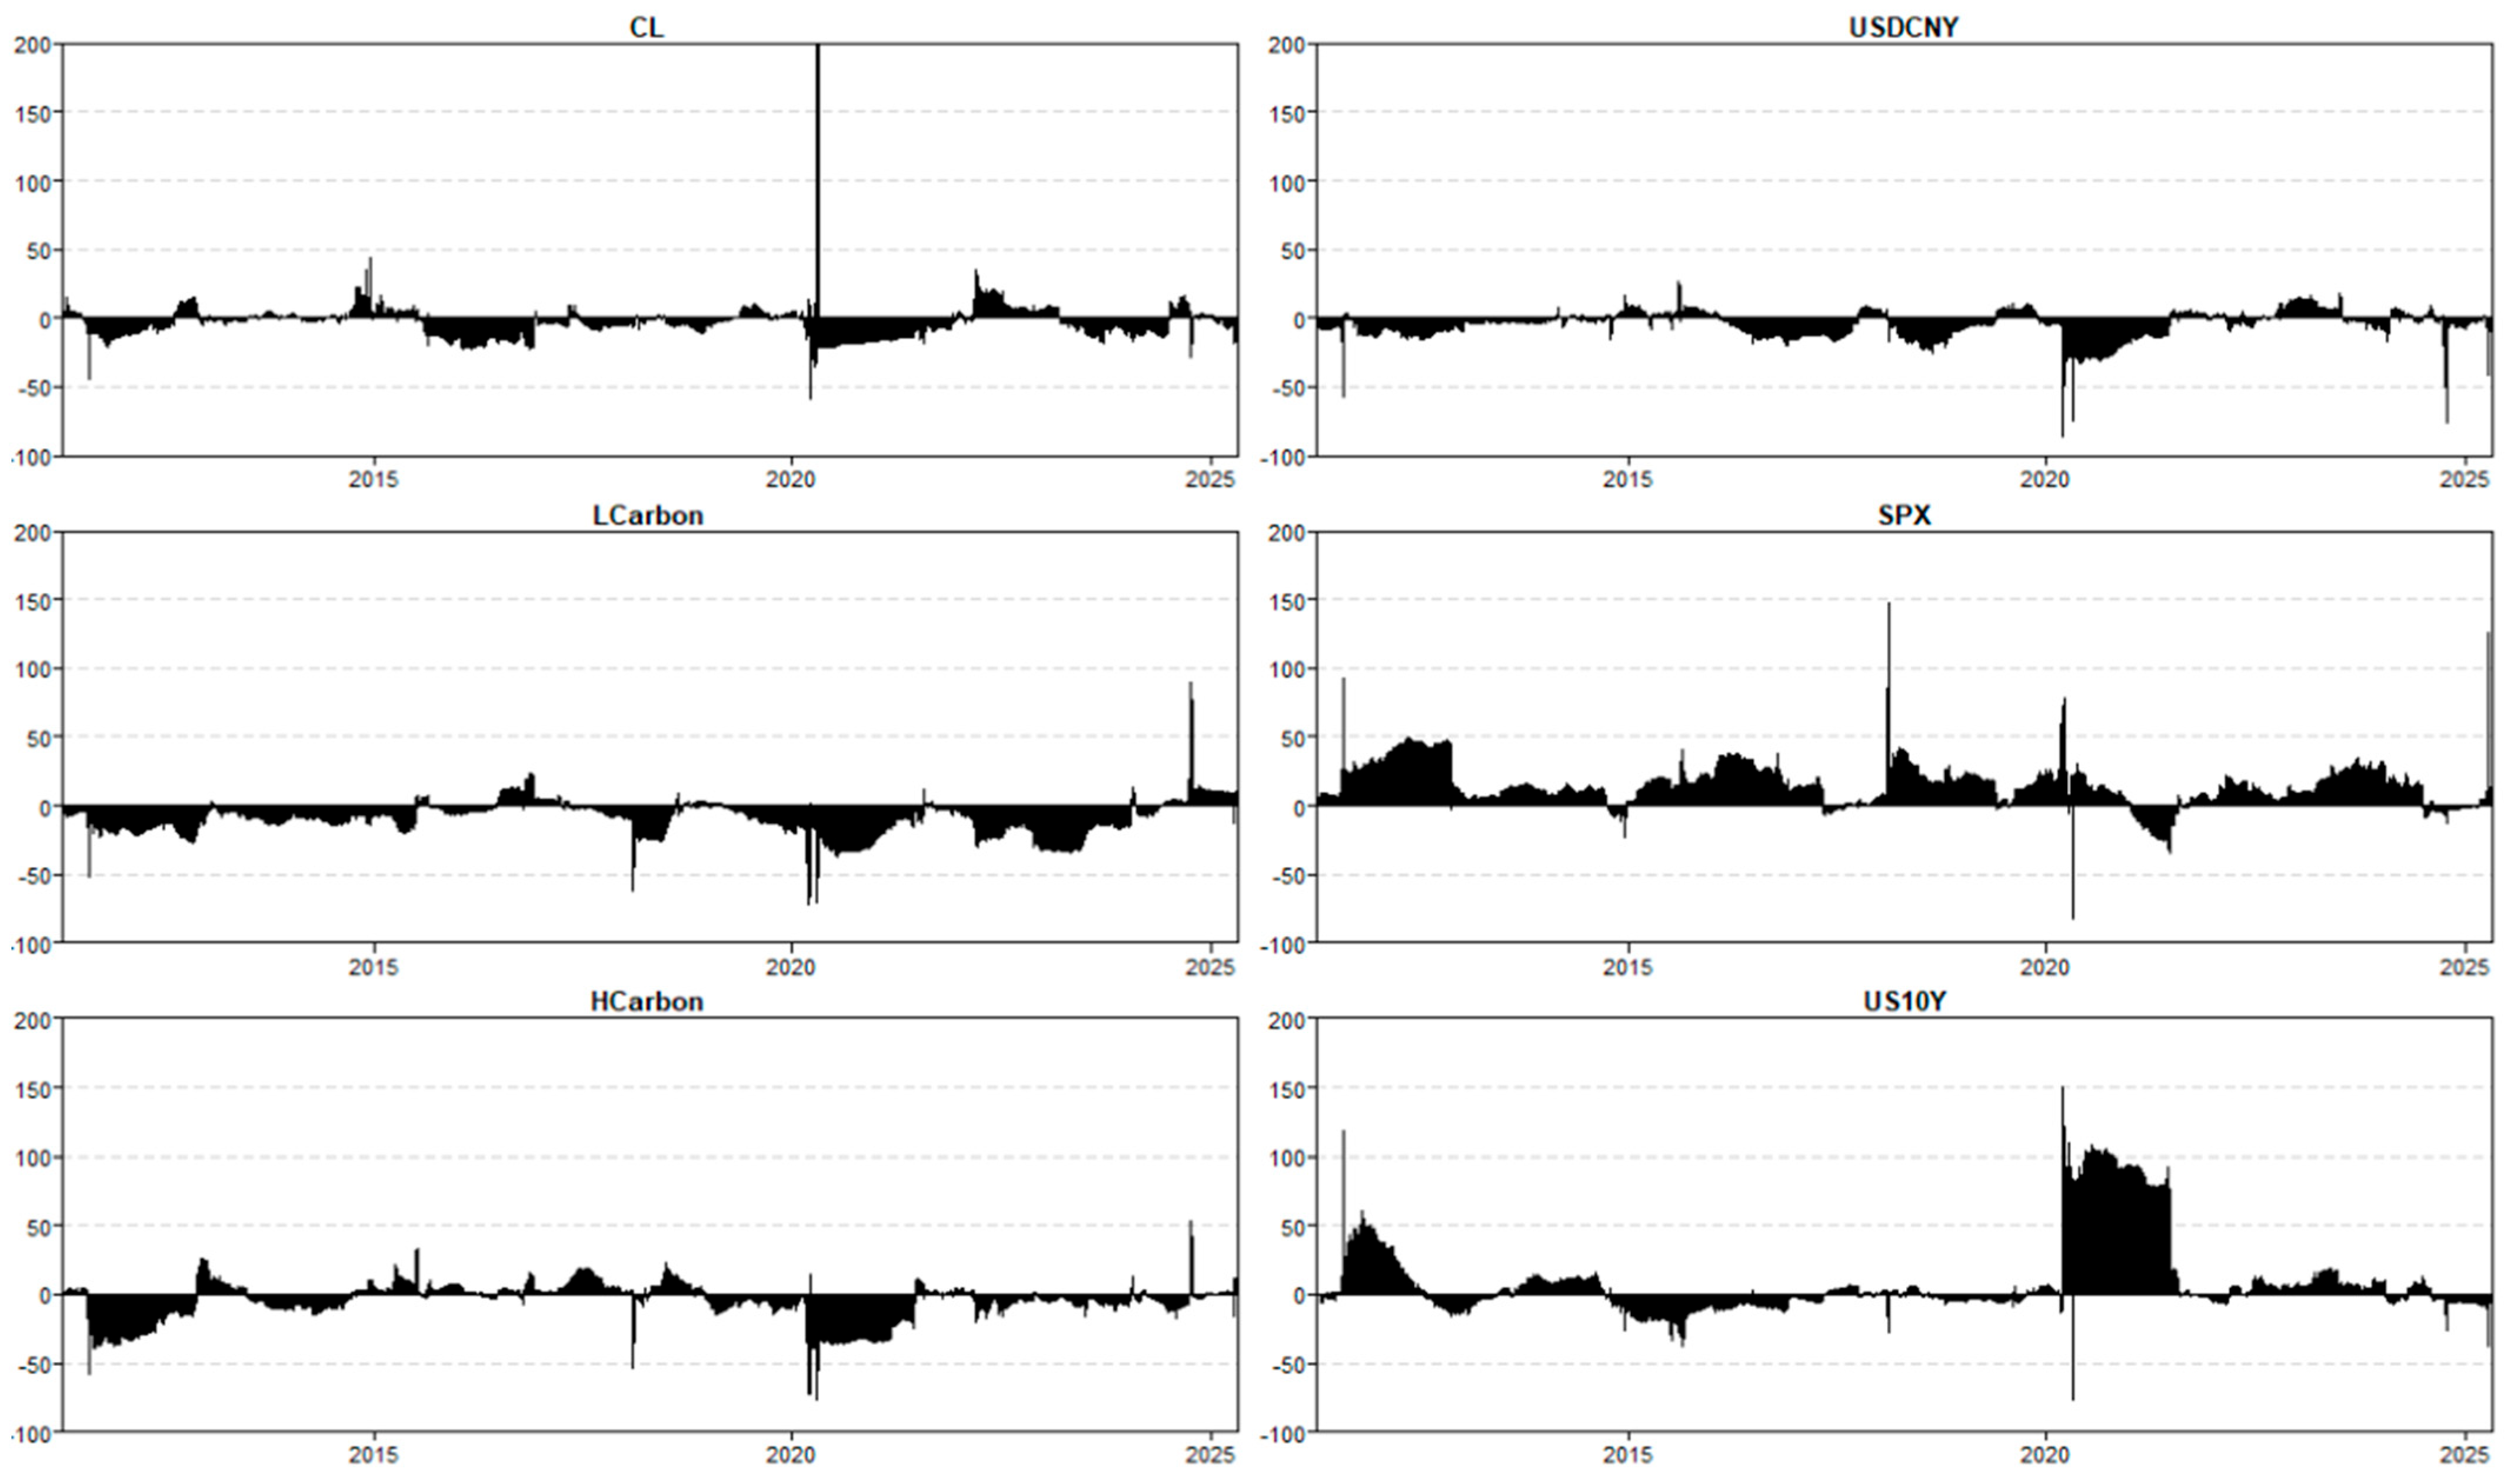
Table 4 reports the connectedness among six variables. The total volatility spillovers of six asset classes, directional volatility spillovers from six asset classes, directional volatility spillovers to six asset classes, and the net volatility spillovers are shown in
Figure 3,
Figure 4,
Figure 5 and
Figure 6. The directional spillover from oil shocks to LCarbon (
) is 4.04%, which is slightly higher than that of HCarbon (
) of 3.83%. This indicates that oil price shocks have a marginally greater influence on the low-carbon index than the high-carbon index. The difference may reflect the varying sensitivities of the two groups of stocks to external energy market fluctuations. While both indexes are impacted by oil shocks, the LCarbon index’s slightly higher spillover suggests that even low-carbon industries are not entirely insulated from global energy market dynamics. For instance, the operation of low-carbon industries frequently depends on supply chains, materials, and technologies that are influenced by oil prices, such as transportation and manufacturing costs. Oil price volatility will also affect investor sentiments, leading to shifts in capital flows between traditional energy sectors and low-carbon industries that in turn affect stock performance. Moreover, oil prices often serve as indicators of broader economic trends that can influence the transition to a low-carbon economy. These factors create a network of interconnections, making low-carbon stocks vulnerable to oil price shocks, despite their commitment to sustainability.
When analyzing the directional spillover from other factors, including the exchange rate (USDCNY), U.S. stock market (SPX), and Treasury yield (US10Y), to LCarbon and HCarbon, an intriguing observation emerges that the spillover from these external factors to LCarbon ( = 2.88%, = 7.69%, = 5.68%) is lower than to HCarbon ( = 2.95%, = 8.35%, = 7.09%). This suggests that stocks in the low-carbon index are less sensitive to broader market movements and exchange rate/interest rate fluctuations compared to those in the high-carbon index. The reduced spillover may reflect the differing characteristics of the industries represented in each index, with high-carbon sectors potentially being more exposed to macroeconomic factors such as equity market volatility and changes in bond yields. For example, industries such as oil and gas, mining, and heavy manufacturing are closely linked to the cost and accessibility of fossil fuels, which are strongly affected by geopolitical events and currency fluctuations. Moreover, these sectors typically require substantial capital investments, making them particularly sensitive to interest rates that affect borrowing costs. Although the low-carbon industries such as finance or properties and construction are also indeed sensitive to equity market fluctuations and interest rates, their exposures are generally more indirect and diversified compared to the direct dependence of high-carbon sectors on energy and commodity-driven economic cycles.
The analysis of net directional volatility spillovers indicates that the most significant spillover originates from the SPX with a magnitude of 14.73% (calculated as 45.93–31.20%). This finding aligns with the widely accepted understanding that fluctuations in the U.S. stock market exert the greatest influence on global assets. The second largest spillover comes from the US10Y, which stands at 8.83% (39.17–30.34%). Given that the yield on U.S. government bonds is perceived as a risk-free rate, it directly impacts borrowing costs and the valuation of equities, commodities, and other financial instruments. Changes in Treasury yields reflect shifts in investor expectations regarding inflation, monetary policy, and economic growth, significantly affecting various markets. For instance, the spillover from US10Y to SPX is measured at 14.16%, which indicates a notable impact. This extensive influence explains why the US10Y generates considerable spillovers to other assets, making it second only to the SPX.
The crude oil price (CL) is identified as a net receiver of shocks with a magnitude of –3.51% (22.35–25.86%). This aligns with the research conducted by
Umar et al. (
2020) on investigating the connectedness of the returns of stock indexes and oil prices, which concludes that oil shocks typically act as net receivers, meaning that they exert a limited influence on other assets and are more affected by external factors. Both the LCarbon and HCarbon indexes are also net receivers with magnitudes of –9.70% (36.39–46.09%) and –5.32% (40.59–45.91%), respectively. This indicates that the low-carbon and high-carbon stock indexes have a comparatively minor impact on other assets in the volatility spillover network, probably because of their specific sector focus and their reliance on overall market conditions.
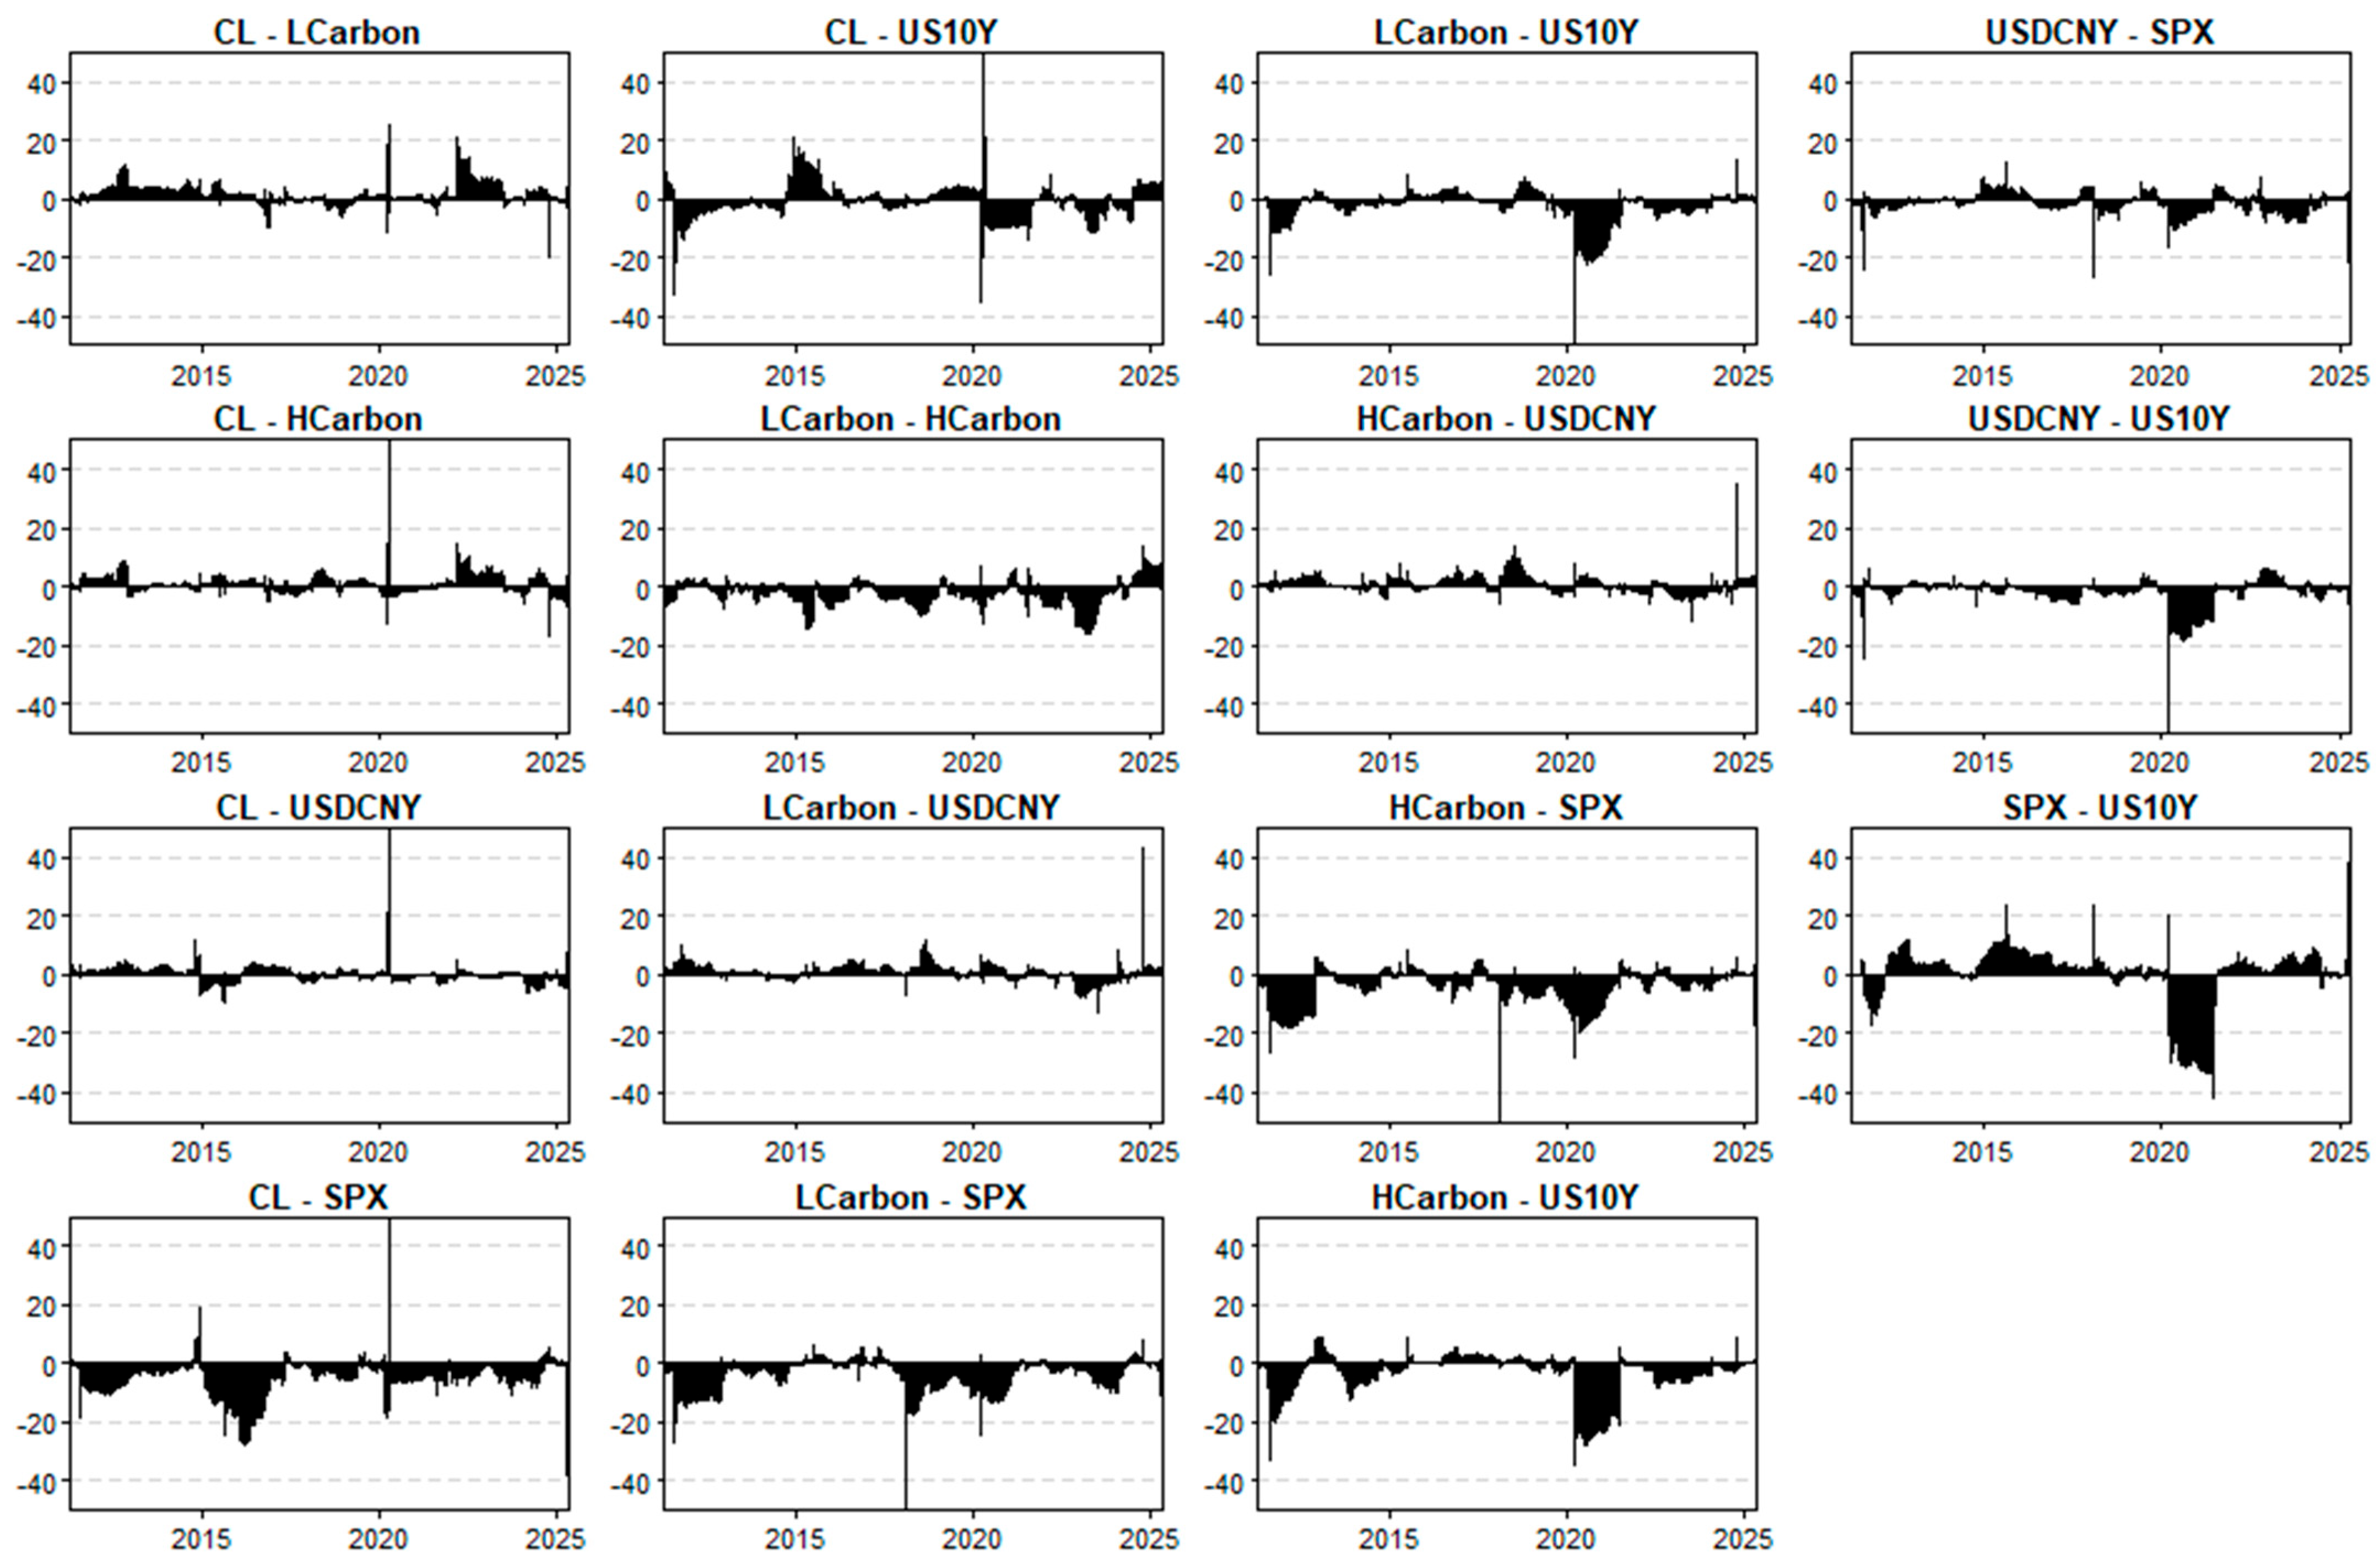
For the pairwise directional connectedness between crude oil (CL) and the LCarbon/HCarbon indexes, as shown in
Table 3 and
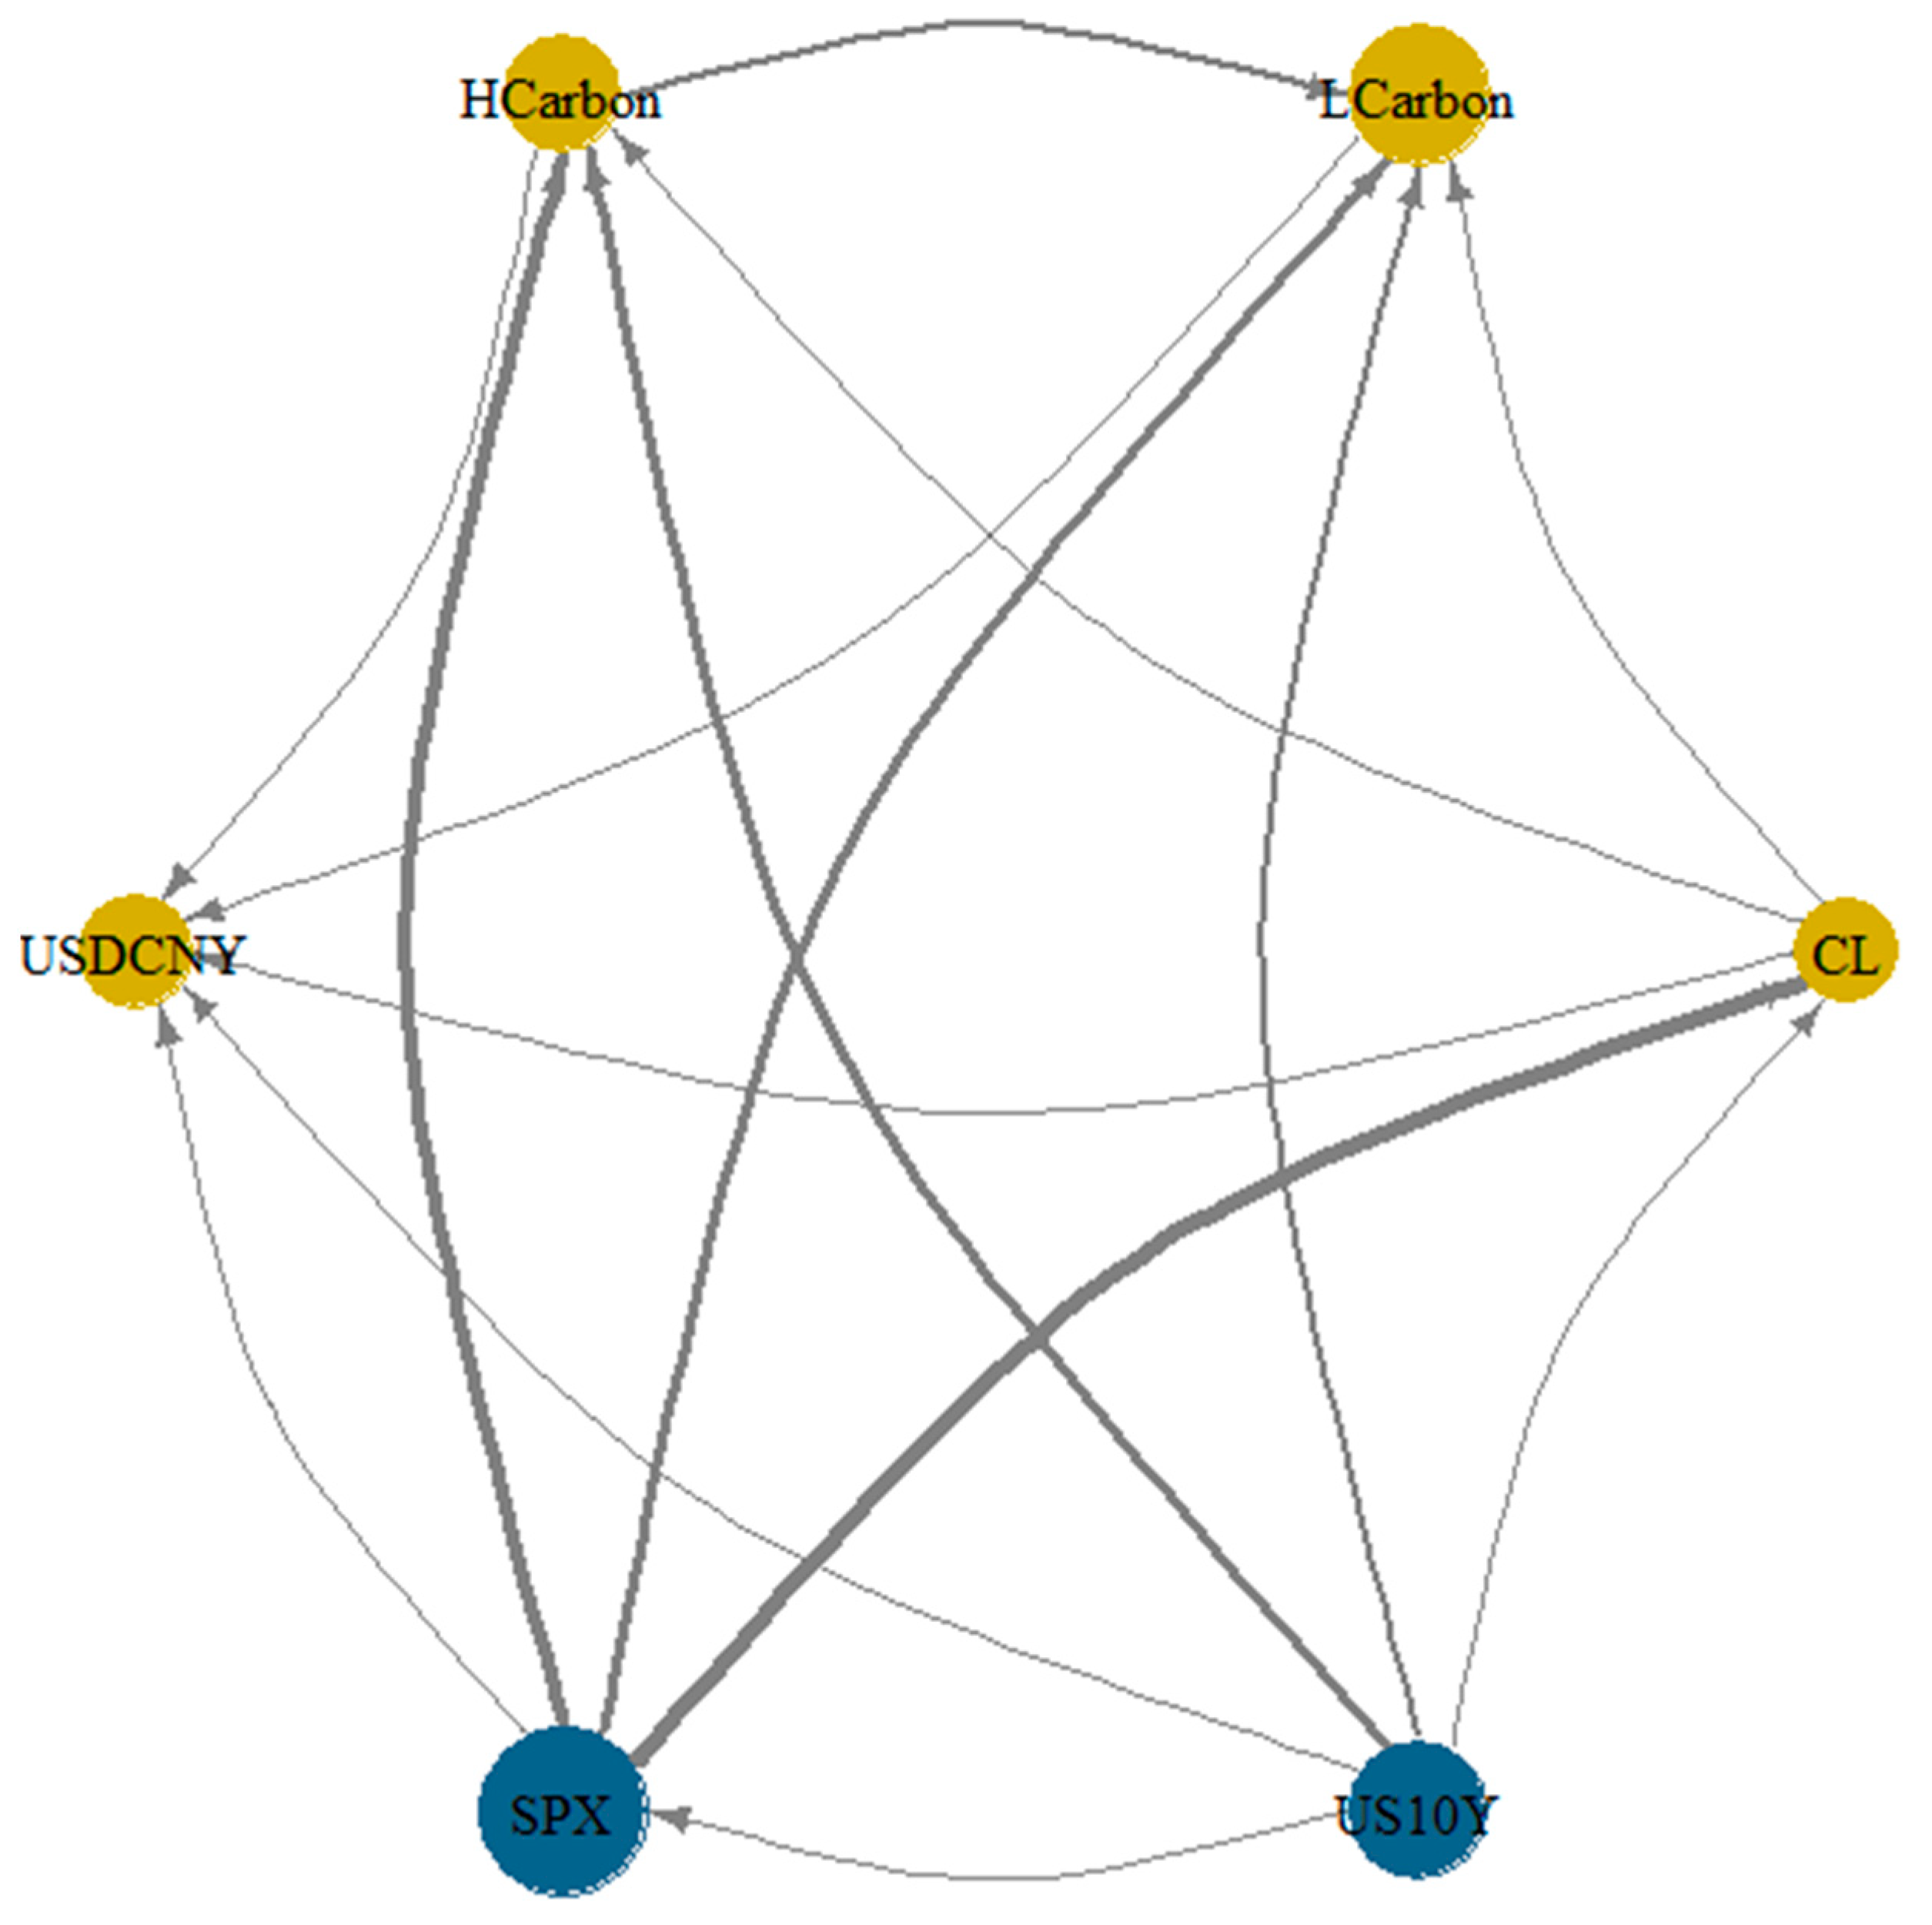
Figure 7, and the net pairwise connectedness network as shown in
Figure 8, the crude oil price is identified as a net receiver of shocks from all variables, but it acts as a net transmitter of volatility to both the LCarbon and HCarbon indexes. The net spillover from CL to LCarbon is
−
), while the net spillover to HCarbon is
−
. This indicates that fluctuations in the crude oil price have an influence on both low-carbon and high-carbon stocks, and vice versa.
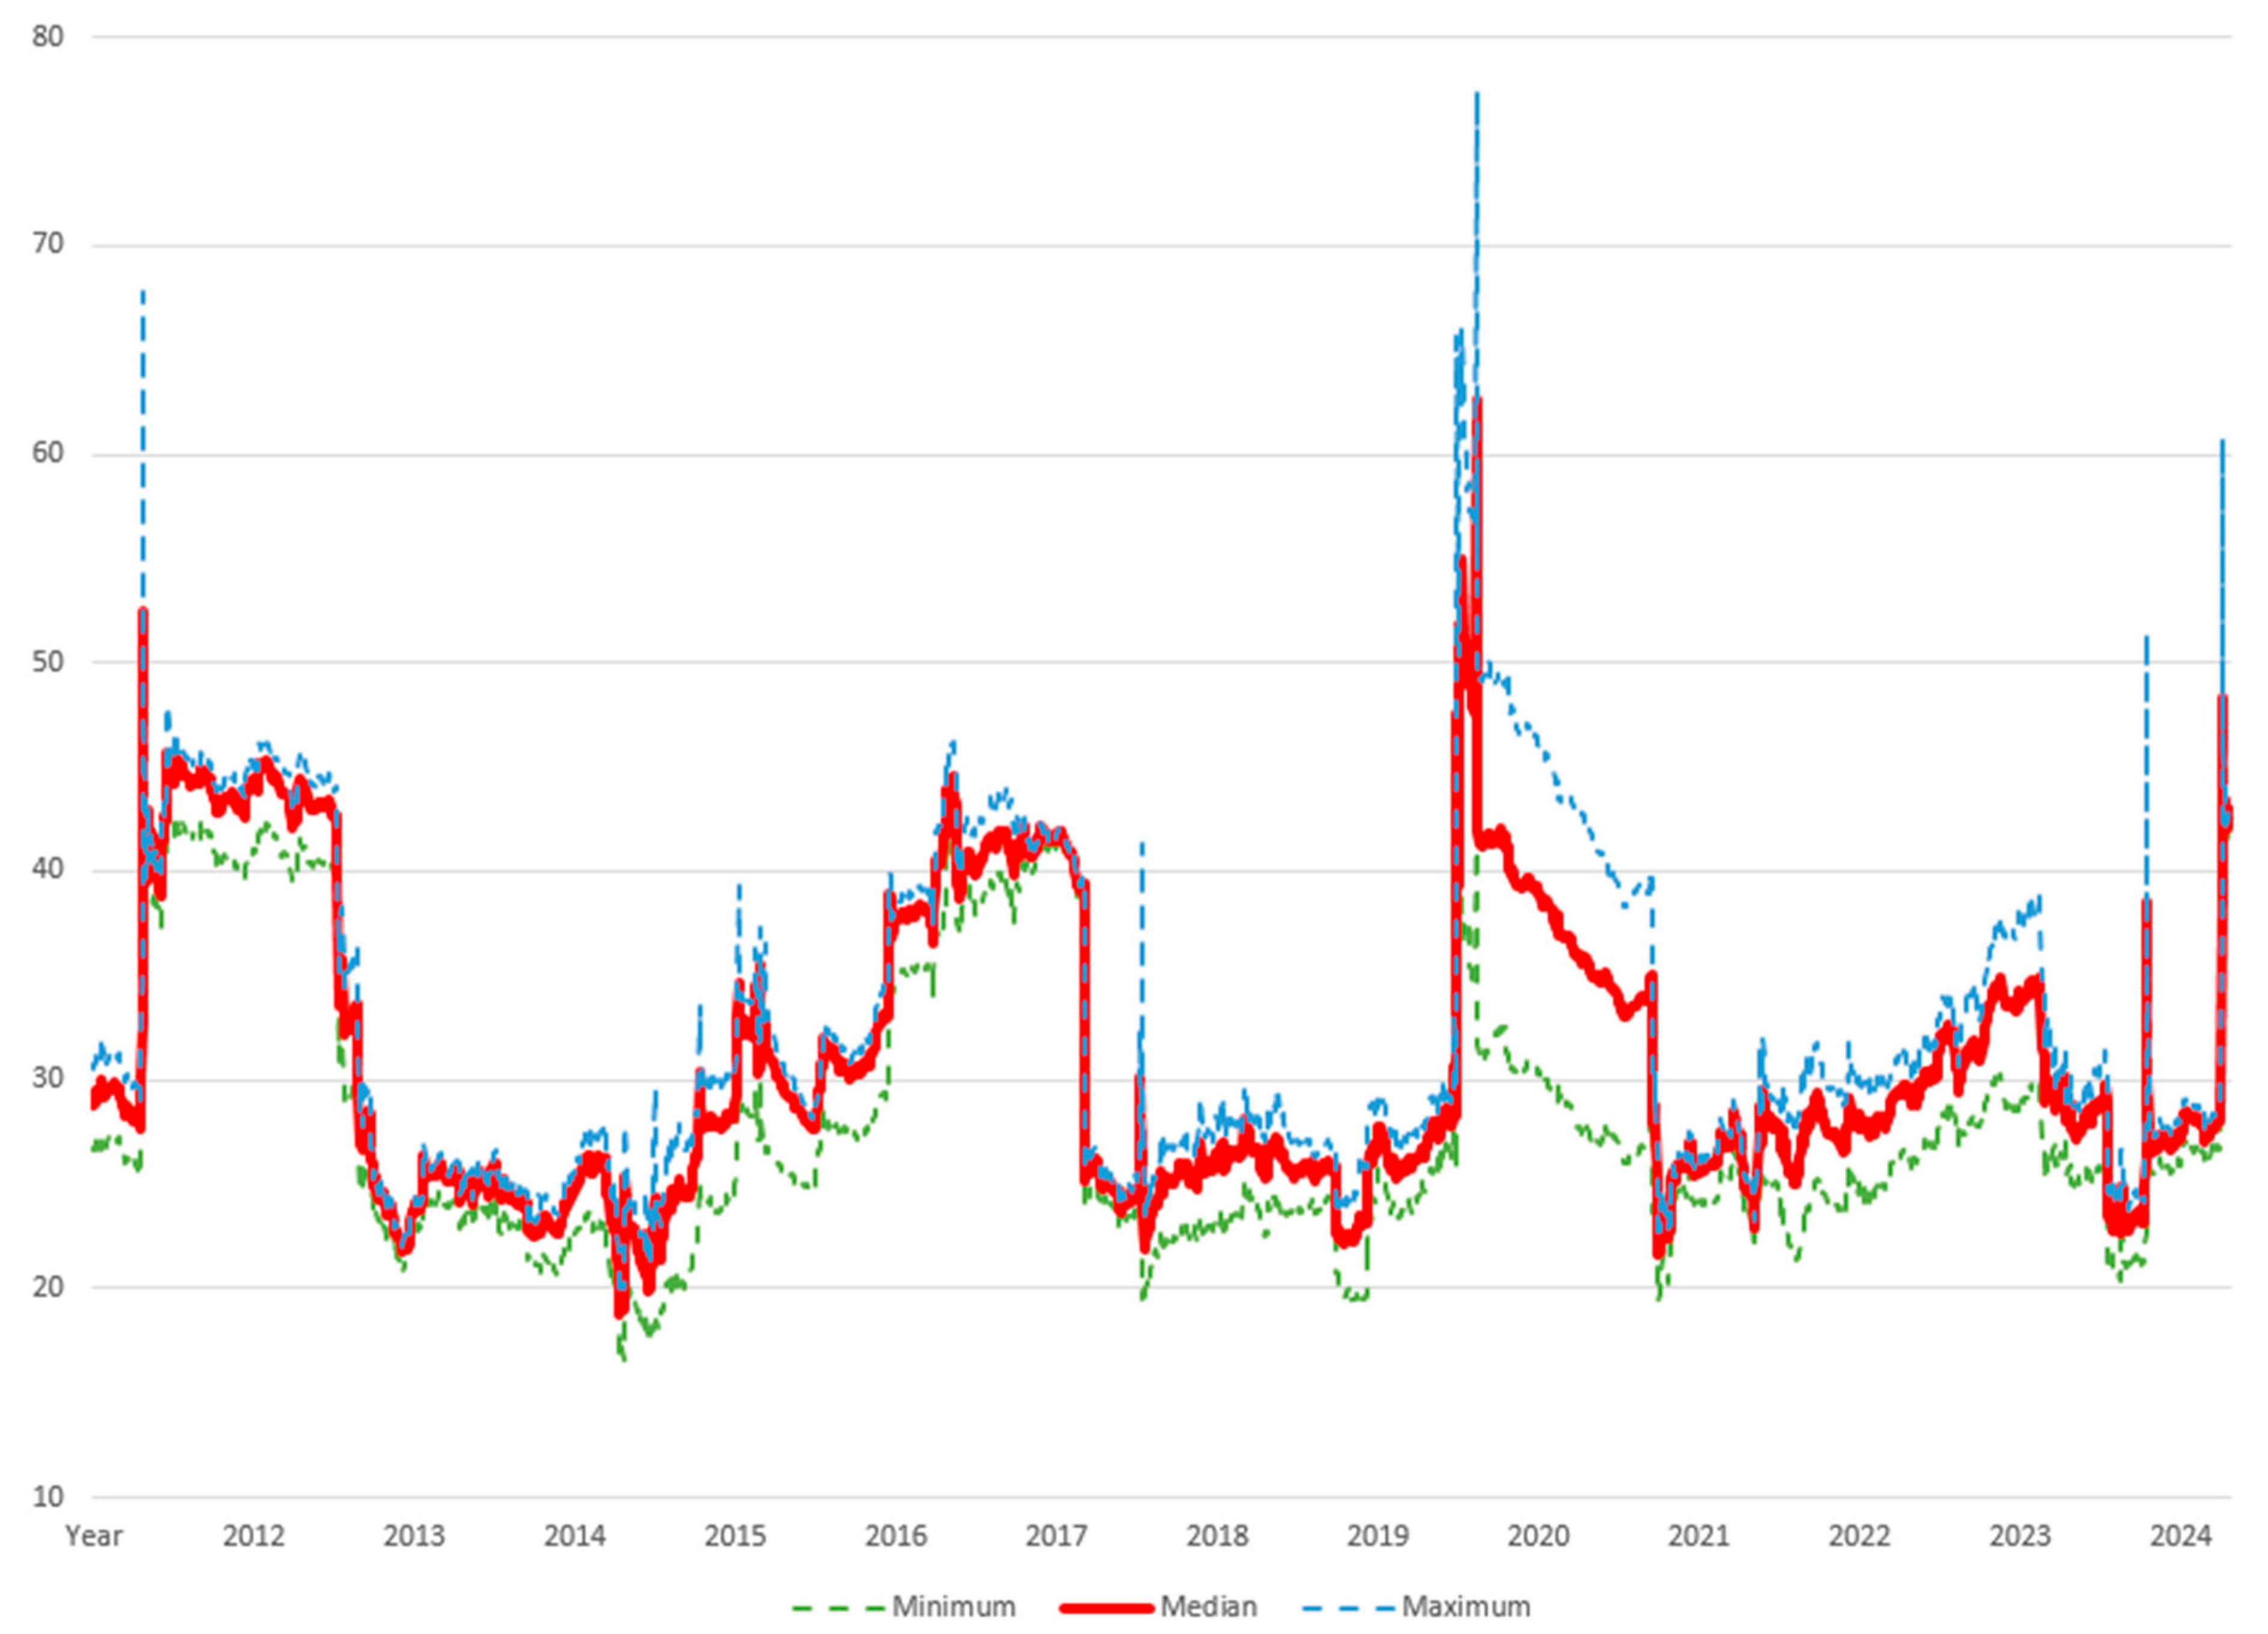
Robustness Test
For the robustness test, we adhere to the methodology of
Diebold and Yilmaz (
2012) to reassess volatility connectedness by considering various forecast horizons. We then plot the minimum, maximum, and median values of the total volatility spillovers. As illustrated in
Figure 9, we calculate the spillover indexes for forecast horizons of 5, 6, 8, 10, 12, 15, and 20 days. The findings confirm the robustness of our results, as the total spillover plot remains unaffected by the choice of forecast horizon.
6. Conclusions
This study employs the methodology established by
Diebold and Yilmaz (
2012,
2014) to assess the connectedness of the annualized daily volatility among the high-carbon index, low-carbon index, and four external factors. The carbon indexes are derived from the largest Hong Kong listed companies with the 20 highest and 20 lowest values of “GHG emissions per USD 1 million in revenue.” The analysis incorporates four external factors, including oil prices, USDCNY exchange rates, S&P 500 returns, and 10-year Treasury rates, covering the period from 31 December 2009 to 30 April 2025. This analysis reveals the directional spillover effects of oil price shocks and other external factors on both the low-carbon and high-carbon indexes.
The findings indicate that oil price shocks have a slightly greater effect on the low-carbon index than the high-carbon index, suggesting that even low-carbon industries are somewhat sensitive to global energy market dynamics. However, when examining the spillover effects of broader factors like exchange rates, U.S. stock markets, and Treasury yields, high-carbon stocks demonstrate greater sensitivity than low-carbon stocks. This discrepancy reflects the varying exposure of these sectors to macroeconomic conditions, with high-carbon industries being more affected by equity market volatility and changes in interest rates.
Among the factors analyzed, the U.S. stock market has the most substantial spillover effect across assets, followed by Treasury yields, which influence borrowing costs and valuations. The crude oil price, along with the low-carbon and high-carbon indexes, is identified as a net receiver of shocks, meaning that it is more responsive to external factors than it affects other assets. Nevertheless, crude oil serves as a net transmitter of volatility to both low-carbon and high-carbon indexes, highlighting its role in influencing stock movements within these sectors. Overall, these findings emphasize the interconnectedness of global markets and the varying sensitivities of industries to external shocks and macroeconomic dynamics.
This paper makes several contributions to the existing literature. First, although most previous empirical studies focus on the relationship between carbon intensity and stock performance, there has been limited research examining the link between the carbon intensities of companies and stock volatility. This study addresses that gap, particularly within the context of Hong Kong’s financial market. Utilizing the connectedness approach, our research illuminates how carbon intensities influence stock volatility and the behavior of the Hong Kong market. Analyzing firm-level compared with index-level carbon intensity is crucial for understanding how company-specific carbon intensity interacts with broader market factors. This investigation into firm-level carbon intensity will deepen our comprehension of the characteristics that differentiate low-carbon stocks from high-carbon stocks.
The findings of this study provide valuable insights for both individual and institutional investors as they strategize on carbon investments within Hong Kong’s largest publicly trading companies. Following the signing of the Paris Climate Agreement by 196 nations in 2015, numerous stakeholders have worked together to enhance environmental sustainability and lower emissions of CO
2 and other GHGs.
Wojewodzki et al. (
2023)’s research shows that most publicly trading firms are advancing toward optimal carbon performance. Institutional investors are vital in motivating these companies to strengthen their carbon-reduction initiatives, as many aim to be viewed as positively influencing climate change (
Cheng et al., 2023).
China is currently the leading contributor to global CO
2 emissions, responsible for approximately 27% of total emissions (
World Bank Group, 2022). This has led to significant environmental challenges like air pollution and soil degradation. In addition to the Chinese government’s efforts to promote low-carbon policies among businesses (
MEE, 2023), attracting more sustainability-focused investors to purchase low-carbon stocks in Hong Kong could be an effective strategy for reducing the carbon intensities of publicly trading companies. We aim for the findings of this study to provide valuable insights for both individual and institutional investors worldwide. This research will assist them in making informed decisions about carbon investments in Hong Kong’s largest listed companies, fostering greater demand for low-emission stocks, and supporting China’s goal of achieving carbon neutrality.


