Article

State Borrowing and Electricity Tariff in an Emerging Economy: Post-COVID-19 Experience

by
Sam Kris Hilton
1,
Vida Aba Essuman
2,
Ebenezer Dzinpa Effisah
3 and
Andaratu Achuliwor Khalid
4,*
1
Department of Economics Studies, University of Cape Coast, Cape Coast PMB, Ghana
2
Economics Department, Ghana Institute of Management and Public Administration (GIMPA), Accra P.O. Box AH 50, Ghana
3
School of Economics, University of Cape Coast, Cape Coast PMB, Ghana
4
Department of Economics and Actuarial Science, University of Professional Studies, Accra P.O. Box LG 149, Ghana
*
Author to whom correspondence should be addressed.
J. Risk Financial Manag. 2025, 18(4), 184; https://doi.org/10.3390/jrfm18040184
Submission received: 28 February 2025 / Revised: 24 March 2025 / Accepted: 26 March 2025 / Published: 1 April 2025
(This article belongs to the Section Economics and Finance)

Abstract

:
As the debt stock level of Ghana continues to rise, partly due to the negative impact of COVID-19, a number of new taxes have been introduced in the 2021 budget statement alongside an upward adjustment of electricity tariff. State borrowing may significantly influence electricity tariff, as power generation and distribution are primarily undertaken by state-owned companies whose borrowing constitutes a substantial portion of the country’s overall debt. Hence, this paper assesses the impact of state debt on electricity tariff in Ghana post COVID-19. The autoregressive distributed lag (ARDL) model and error correction model (ECM) are employed to test for the Granger causality between state debt and electricity tariff. Other variables such as inflation rates, exchange rates, and net energy imports that have the propensity to influence electricity tariff are also examined. The results reveal that state debt has both short-term and long-term impacts on electricity tariff. Additionally, inflation rates, exchange rates, and net energy imports only have long-term impacts on electricity tariff. Meanwhile, exchange rates have short-term effects on state debt. The findings imply that effective debt management policies should be implemented by the government to reduce borrowing, particularly when such borrowing is not invested into projects that can repay the debt at maturity. This study demonstrates that all the accumulated debt prior to and during the COVID-19 era is causing a significant increase in Ghana’s electricity tariff. This provides an empirical clue as to what the situation is likely to be in other developing countries.

1. Introduction

One possible way to finance state revenue shortfalls is to borrow internally or externally (Owusu-Nantwi & Erickson, 2016). Borrowing to finance government expenditure leads to state debt. Thus, state debt refers to both short-term and long-term loans taken out by governments to finance public expenditures due to insufficient tax revenues (Hilton, 2021). While debt financing remains an important fiscal policy decision, studies have shown that the accumulation of debt by many advanced and developing countries post World War II led to the economic recession and debt crises witnessed in the early 2000s (Donayre & Taivan, 2017). This situation aroused academic debate on how public debt affects the overall economy and its indicators. For instance, Adom (2016) asserts that building up state debt to unsustainable levels affects economic indicators. Hilton (2021) also submits that although borrowing to finance public expenditure is not necessarily detrimental, it equally has adverse effects on the economy if not managed effectively. A key sector that is heavily burdened by state debt accumulation is the energy sector where electricity tariff is usually increased in order to offset accrued debts.
As a developing country, Ghana has a responsibility to managing its debt effectively to avoid negatively impacting its economy. Ghana’s debt accumulation is attributable to the periods of global economic recessions and debt crises. In 2000, Ghana’s debt to GDP ratio was 79.19% and this was classified unsustainable, leading to a declaration of the country as a heavily indebted poor country (HIPC) in 2001 and most of the debts were cancelled by the IMF and World Bank (World Bank, 2004; Hilton, 2021). Though Ghana’s debt stock reduced drastically to 24.95% in 2008, it rose steadily to 57.12% of the GDP in 2016 (World Bank, 2021). Prior to COVID-19, Ghana’s debt stock stood at 63% of the GDP in 2019 but rose to 93.5% as of November 2022 (Ministry of Finance, 2023). The drastic upsurge in the debt stock after 2019 is attributed mainly to the negative impact of COVID-19 (Bank of Ghana, 2021). The consequences of the unsustainable debt level are dire ranging from the inefficient functioning of key state institutions (such as Tema Oil Refinery, Electricity Company of Ghana (ECG), Volta River Authority (VRA), Ghana Cocoa Board, etc., most of which are responsible for the generation and distribution of electrical power in the energy sector) to poor macroeconomic performance. In 2022, the government declared its inability to repay both domestic and foreign debts. This has necessitated a USD 3 billion IMF bailout deal for a 3-year period, warranting a domestic debt exchange programme, and quarterly upward adjustment in electricity tariff. A comparative analysis with other West African countries reveals that Ghana’s debt-to-GDP ratio in 2022 is significantly higher than its peers, including Nigeria, Senegal, Ivory Coast, Mali, and Togo. While Ghana’s energy sector structure is similar to its regional counterparts, its electricity tariff is relatively low. Therefore, understanding the relationship between state debt and electricity tariff is vital to informing policy decisions that balance debt management with the need for affordable electricity, not only in Ghana but also in other developing countries facing similar challenges.
Researchers predominantly assessed the impact of these borrowing practices (domestic and external) on the economic growth (GDP) of Ghana (e.g., Owusu-Nantwi & Erickson, 2016; Adom, 2016; Hilton, 2021). However, there is a dearth of research on the impact of the debt accumulation on electricity tariff, which is a critical factor affecting all sectors of the economy and can even stifle economic growth. Electricity generation and distribution companies are state-owned, and their tariffs are determined and regulated by the Public Utilities Regulatory Commission (PURC), which is also a state institution. Based on the neo-Ricardian theory (NRT) (Sraffa, 1960; Robinson, 1962; Pasinetti, 1977), we argue that electricity companies, institutional factors, and distributional consequences play crucial roles in shaping the potential relationship between state debt and electricity tariff. The NRT highlights the importance of institutional context, suggesting that state ownership and political considerations influence tariff setting (Acheampong et al., 2021). According to the Ricardian Equivalence Hypothesis (REH), the decision to borrow today is the opposite deferment of imposing more taxes, which will eventually be imposed in the future (Ricardo, 1951). Per the REH, borrowing today can cause corresponding increase in taxes or the introduction of new taxes in the future. It follows that continuous rises in state debt may lead to future rises in electricity tariff. While many empirical studies support the REH relative to GDP (e.g., Barro, 1979, 1990; Afzal, 2012; Kourtellos et al., 2013; Onogbosele & Ben, 2016), no direct application was made relative to electricity tariff, which is not tax per se, but a price to pay for consuming electricity and as such may be influenced by debt burdens. For instance, to reduce the negative impact of COVID-19, the government of Ghana provided free electricity and water to some classes of consumers and subsequently introduced a COVID-19 recovery levy as an indirect tax in 2021. Therefore, this paper assesses the impact of state borrowing on electricity tariff in Ghana.
The findings of this study have empirically established the short-term and long-term causal relationship between state debt and electricity tariff to aid policy decisions regarding debt management, particularly in the energy sector. As the country strives to recover from the negative impact of COVID-19, a lot of credit facilities were acquired including the USD 1 billion IMF rapid credit. Hence, we believe that it is vital to know how these recent debt accumulations will likely affect electricity tariff over time to provide useful information to governments, industry players, and households. Finally, the findings of this paper may be applicable in developing countries with similar situations in their quest to roll out economic recovery programmes post the global pandemic.

2. Neo-Ricardian Theory

The NRT builds upon the ideas of the REH, which states that government financing through debt or taxes has equivalent effects on the economy (Ricardo, 1951). The REH suggests that government debt is seen as future taxation, and consumers and firms adjust their behaviour accordingly. The NRT provides a more comprehensive framework for understanding the link between state debt and electricity tariff, particularly in the context of state-owned enterprises. Its consideration of institutional, social, and distributional factors offers a more nuanced explanation. For instance, the NRT considers the institutional and social factors influencing state-owned enterprises, such as inefficiencies and political pressures; highlights the unequal distribution of tax burdens and benefits among different social classes; acknowledges the role of conflict and power struggles between various interest groups; and captures bounded rationality and imperfect markets (Sraffa, 1960; Robinson, 1962; Pasinetti, 1977).
In the context of state debt and electricity tariff, the REH suggests that state debt financing for electricity generation and distribution will eventually lead to higher electricity tariff (future taxation). Consumers anticipate this and adjust their consumption decisions. It follows that increased state debt for energy sector financing may lead to higher electricity tariff; higher tariff can reduce electricity demand, affecting economic activity and anticipated future tax burden (tariff increases) influences the current consumption and investment decisions. However, the REH assumptions may not hold in reality, as it ignores distributional effects (who bears the tax burden) (Pasinetti, 1977) and overlooks potential inefficiencies in state-owned enterprises. These limitations are addressed by the NRT, which emphasizes the role of institutional and social factors to avoid potential exploitation and inequality.
Based on the NRT, we hold that electricity companies, institutional factors, and distributional consequences play crucial roles in shaping the potential effect of state debt on electricity tariff. Ghana’s energy sector debt, primarily financed through state borrowing, has significant implications for electricity tariff. Ghana’s energy sector has faced significant challenges, including high debt levels and inefficient electricity companies. The energy sector debt, estimated at GHS 12.2 billion (USD 2.1 billion) in 2020 (Energy Commission, 2020), primarily funds electricity companies including ECG and VRA. Subsequently, there have been regular tariff adjustments by the PURC to ensure financial sustainability. Thus, the NRT emphasizes the importance of institutional context, suggesting that state ownership and political considerations influence tariff setting (Acheampong et al., 2021). It follows that the principle of tax deferment to borrow to finance state expenditure, due to institutional inefficiencies and political considerations, may cause the upward adjustments of electricity tariff in the long-term. From this perspective, the upsurge in electricity tariffs can be partly attributed to the continuous rise in state borrowing, which is heavily induced by energy sector inefficiencies. In other words, the accumulation of debt may have the propensity to influence the changes in electricity tariff. Therefore, it is imperative to empirically test this possibility given that there is no available literature.

3. Electricity Tariff in Ghana

Electricity is essential for quality healthcare delivery, education, transport, effective communication, mineral exploration, and ultimately serves as the pillar for every sector of an economy (Kumi, 2017). Electricity consumption significantly contributes to long-term economic growth (Chirwa & Odhiambo, 2020). Thus, both developed and developing countries pay critical attention to electricity demand and supply. As far back as the 1960s, Ghana was committed to universal access to electricity by establishing state-owned institutions such as VRA to generate power, Ghana Grid Company Limited (GRIDCO) to transmit electricity from power generation sources to bulk supply points, and ECG to solely distribute the power to the consumers. Based on successive governments’ efforts to expand access to electricity, demand for electricity in Ghana increased by about 52% between 2006 and 2016. This has necessitated the need to double generation capacity over the same period (Kumi, 2017). In spite of the generation capacity being doubled, the country still suffers from persistent power supply challenges. Coupled with the intermittent power supply, Ghanaians are burdened with high electricity tariff (the price to pay for electricity consumption). In order to ensure a stable electricity tariff, the PURC incorporated an Automatic Adjustment Formula (AAF) with the aim of sustaining the real value of the tariff by adjusting it based on variations in factors such as fuel price (light crude oil, natural gas, etc.), exchange rates, inflation rates, and generation mix. The electricity tariff is composed of six categories: residential, non-residential, special load tariff (SLT)—low voltage, special load tariff (SLT)—medium voltage, special load tariff (SLT)—high voltage, and special load tariff (SLT)—mines (Energy Commission, 2020).
The government of Ghana might raise electricity tariff rather than other taxes because tariffs provide a stable source of revenue (IMF, 2019; World Bank, 2020b), and help utility companies recover costs (Energy Commission, 2020; PURC, 2020). In terms of fiscal burden, tariff increases shift the burden from taxpayers to electricity consumers given that a substantial portion of the state debt is used to finance power generation and distribution costs by electricity companies (Ministry of Finance, 2020). Thus, tariff revenues fund energy sector investments and debt servicing (World Bank, 2019). Furthermore, higher tariffs ensure the financial sustainability of the state-owned utilities (Acheampong et al., 2021); they are easier and efficient to collect compared to other taxes (Das-Gupta and Mookherjee, 2017). It is worth noting that IMF and World Bank conditionalities also influence Ghana’s electricity tariff hikes as part of economic reform packages (IMF, 2019; World Bank, 2020a). A case in point is the recent IMF USD 3 billion bailout, which required quarterly upward tariff adjustments. Last but not least, for political considerations, tariff increases are less contentious than broad-based tax hikes, as they often target specific consumers (World Bank, 2020b).

4. State Borrowing and Electricity Tariff

Empirical studies on state debt and electricity tariff are scanty. Nevertheless, there are some related empirical studies that suggest a possible relationship between state debt and electricity tariff. First, the literature shows that state debt has a multiplier effect on the economy, which may go a long way to affect electricity tariff. Such studies indicated that state debt crowds out private investment through the high cost of capital and consequently chokes the overall economy (Kobayashi, 2015; Anning et al., 2016; Kobayashi & Shirai 2017). On the other hand, some scholars (e.g., Kumi, 2017) discovered that electricity tariff have the propensity to influence state debt, suggesting that there could be bi-directional causal relationship between public debt and electricity tariff.
Arguing in favour of the REH, Reinhart and Rogoff (2010), Jalles (2011), and Panizza and Presbitero (2014) empirically held that state borrowing has no causal effect on the economy, meaning that state debt may not have an effect on electricity tariff. This is basically in support of the stance of the REH that claims that debt has a neutral effect on the economy. It follows, therefore, that an empirical study is needed to confirm whether state borrowing would have a neutral impact on electricity tariff because the NRT suggests that, due to state-owned utility inefficiencies and distributional effects, it is probable that government debt will influence electricity tariff adjustments.
Lastly, the literature suggests that inflation rates, exchange rates, and net energy imports may have some controlling effects on electricity tariff (Energy Commission, 2020; Kumi, 2017). This is evidenced by the tariff structure of the PURC where inflation rates and exchange rates keenly featured the adjustment of tariff (PURC, 2020). It is, therefore, important to assess the effect of these variables in addition to state debt.

5. Methods

5.1. Model Estimation

We employed the ARDL-based Granger causality model to examine the causal relationships between state debt and electricity tariff. This approach is particularly suitable for our study due to its ability to accommodate cointegration between variables, flexibility in handling variables with different orders of integration, and capacity to estimate both short-term and long-term dynamics. To address the possible situation of omitted-variable bias, other relevant variables, such as inflation rates, exchange rates, and net energy imports were included. The ARDL bounds test, as prescribed by Pesaran et al. (2001), was utilized to determine cointegration among the regression variables. Subsequently, the error correction model (ECM) was estimated to establish Granger causality in the long-term.
Compared to other models, such as Vector Autoregression (VAR) models, ARDL models are more suitable for our study. VAR models assume that all variables are endogenous and do not account for cointegration, which can lead to unreliable estimates. In contrast, ARDL models provide a more nuanced understanding of the relationships between state debt and electricity tariff. Moreover, the ECM can address endogeneity and simultaneity issues, which may arise when examining the relationships between state debt and electricity tariff. By accounting for the error correction mechanism, the ECM can help mitigate these issues.
The ARDL and ECM are also more efficient, particularly with small sample sizes, compared to the Johansen cointegration model, which is more suitable for large sample sizes (Hilton, 2021). This is particularly relevant for our study, given the relatively small size of 23 annual observations (1998–2020). The effectiveness of these estimation models has been demonstrated in prior empirical studies (Pesaran et al., 2001; Kumar & Woo, 2010; Hilton, 2021; Garedow, 2022). By employing the ARDL model and the ECM, we aim to provide a comprehensive understanding of the causal relationships between state debt and electricity tariff.

5.2. Model Specification

The ARDL model and ECM were estimated on short-term and long-term relationships to support or reject the following hypotheses: (1) causality runs from state debt to electricity tariff (i.e., unidirectional); (2) causality runs from electricity tariff to state debt (i.e., unidirectional); (3) causality runs from and to each other (i.e., bi-directional); and (4) no causality (i.e., neutrality). These hypotheses were tested in both short-term and long-term periods.

5.2.1. Short-Term Model Specification

The short-term ARDL model was specified for all the regression variables (i.e., electricity tariff, state debt, inflation rate, exchange rate, and net energy import) in natural logs. Each variable was estimated as a dependent variable in the ARDL model. In total, (5) short-term equations were estimated as follows.
l n t a r i f f t = α 01 + i = 1 p α 1 i l n t a r i f f t i + i = 1 q α 2 i l n s d t 1 + i = 1 q α 3 i l n i n f t 1 + i = 1 q α 4 i l n e x c t 1 + i = 1 q α 5 i l n n e t e i t 1 + μ 1 t
l n s d t = α 01 + i = 1 p α 1 i l n s d t i + i = 1 q α 2 i l n t a r i f f t 1 + i = 1 q α 3 i l n i n f t 1 + i = 1 q α 4 i l n e x c t 1 + i = 1 q α 5 i l n n e t e i t 1 + μ 1 t
l n i n f t = α 01 + i = 1 p α 1 i l n i n f t i + i = 1 q α 2 i l n t a r i f f t 1 + i = 1 q α 3 i l n s d t 1 + i = 1 q α 4 i l n e x c t 1 + i = 1 q α 5 i l n n e t e i t 1 + μ 1 t
l n e x c t = α 01 + i = 1 p α 1 i l n e x c t i + i = 1 q α 2 i l n t a r i f f t 1 + i = 1 q α 3 i l n s d t 1 + i = 1 q α 4 i l n i n f t 1 + i = 1 q α 5 i l n n e t e i t 1 + μ 1 t
l n n e t e i t = α 01 + i = 1 p α 1 i l n n e t e i t i + i = 1 q α 2 i l n t a r i f f t 1 + i = 1 q α 3 i l n s d t 1 + i = 1 q α 4 i l n i n f t 1 + i = 1 q α 5 i l n e x c t 1 + μ 1 t
where
lntarifft is the annual tariff rate in period t; lnsdt is the total public debt in period t; lninft is the inflation rate in period t; lnexct is the exchange rate in period t; lnneteit is the net energy import in period t; α0 and β0 are the respective constants; α1α5 and β1–β5 are respective regression coefficients; Δ denotes change; μ1t and μ2t are the mutually independent white-noise residuals; p and q are the lag lengths; and t is the time period.

5.2.2. Long-Term Model Specification

The ARDL bounds test has shown only one cointegration vector (i.e., lntarifft), indicating that there is the existence of a long-term relationship when lntarifft is the dependent variable (see Table 2). Therefore, the ECM long-term model was specified as follows:
l n t a r i f f t = α 0 + i = 1 p α 1 i l n t a r i f f t i + i = 1 q α 2 i l n s d t 1 + i = 1 q α 3 i l n i n f t 1 + i = 1 q α 4 i l n e x c t 1 + i = 1 q α 5 i l n n e t e i t 1 + λ E C T t 1 + μ 1 t
where
lntarifft is the annual tariff rate in period t; lnsdt is the total public debt in period t; lninft is the inflation rate in period t; lnexct is the exchange rate in period t; lnneteit is the net energy import in period t; α0 and β0 are the respective constants; α1–α5 and β1–β5 are respective regression coefficients; Δ denotes change; λ is coefficient of ECTt−1; ECTt−1 is the error-correction term lagged once; μ1t and μ2t are the mutually independent white-noise residuals; p and q are the lag lengths; and t is the time period.

5.3. Data

We employed annual time series data from 1998 to 2020. Though the data predate the COVID-19 year (2020), it is important to observe the trend over time since state debt accumulation preceded COVID-19 and the effect might be in both short- and long-term periods. Data on inflation rates, exchange rates, and net energy imports were sourced from the World Bank Development Indicator database (World Bank, 2021), while data on state debt as a percentage of GDP was sourced from the IMF fiscal Affairs Department Database and WEO (IMF, 2021) and data on electricity tariff were obtained from the PURC.

6. Results and Discussion

6.1. Unit Roots Test

We employed ADF to test the unit roots. The results in Table 1 show unit root test with intercept and no trend as well as intercept and trend. The results illustrate that all the series variables are integrated of order one, as the ADF test statistics are all significant at the first difference (Dickey & Fuller, 1981). Since the ADF confirmed the stationarity of all the series variables at order one, the ARDL model and ECM were estimated.

6.2. Cointegration Test

To determine the cointegration among the series variables, we carried out the ARDL bounds test. The results in Table 2 depict one cointegration vector; thus, the null hypothesis (i.e., no long-term relationships exist) is rejected in this case. Accordingly, the ECM was estimated to establish the long-term Granger causality between lntarifft and the exogenous variables (lnsdt, lninft, lnexct, and lnneteit). However, we fail to reject the null hypothesis for lnsdt, lninft, lnexct, and lnneteit, meaning that no long-term relationship exists between them and the exogenous variables. Therefore, only ARDL short-term models were estimated for these variables.

6.3. Lag Length Selection Criterion

The Akaike information criterion (AIC) was employed to select the lag length for the models. The result demonstrates that lntarifft, lnpdt, lninft, lnexct, and lnneteit, respectively, have lag lengths of 1, 2, 0, 1, and 3 (Table 3). Therefore, the ARDL model and ECM estimations were based on these lag lengths.

6.4. Short-Term and Long-Term Causal Relationships

Table 4 presents the short-term and long-term causal relationships among the regression variables. The ARDL short-term model was adopted to test the short-term Granger causality. It can be observed from Table 4 that there is a positive short-term causal relationship between state debt and electricity tariff [Coef = 3.279; p-value = 0.006], and not vice versa [Coef = 0.029; p-value = 0.617]. This means that, in the short-term, state debt has a significant positive impact on changes in electricity tariff, such that, as government(s) accumulate more debt, there is a high possibility of a rise in electricity tariff, ceteris paribus. On the other hand, there is no short-term causal relationship between inflation rates, exchange rates, and net energy imports and electricity tariff, or vice versa. Granger causality runs from exchange rate to state debt [Coef = 0.432; p-value = 0.031].
Furthermore, the ECM was estimated to test long-term causal relationships using ECTt−1. Only electricity tariff were estimated as a dependent variable based on the cointegration test result. As shown in Table 4 [Coef = 1.057; p-value = 0.035], there is long-term Granger causality between all the exogenous variables (state debt, inflation rates, exchange rates, and net energy imports) and electricity tariff. The coefficient is statistically significant at 5% significance level. This implies that all the explanatory variables have an impact on electricity tariff in the long-term. Thus, in the long-term, state debt Granger causes electricity tariff and not vice versa. It follows, therefore, that there is a unidirectional impact of state debt on electricity tariff in the long-term as observed in the short-term. This result is consistent with the REH that debt accumulation influences the future imposition of tax or tariff in this context.
These empirical results support the assumption behind the REH that borrowing today would cause an increase in tax as the government would have to impose more taxes to offset the debt (Ricardo, 1951). But, more importantly, the results underscore the inefficiencies of the electricity companies and the political considerations espoused by the NRT to be underlining factors for the rise in debt stock, causing upward adjustments in electricity tariff (Acheampong et al., 2021). Empirically, our findings do not support Kumi’s (2017) discovery that electricity tariff has the propensity to influence state debt. Hence, there is no bi-directional causal relationship between state debt and electricity tariff as inferred from Kumi’s (2017) study.
It is instructive to note that even though this study is without a precise precedent, it has highlighted the significant impact of state debt on electricity tariff in both the short-term and long-term. Additionally, this study has demonstrated that inflation rates, exchange rates, and net energy imports have a significant impact on electricity tariff in the long-term. It follows that a rise in these exogenous variables will likely cause an increase in electricity tariff. Thus, this paper empirically justifies the inclusion of inflation rates and exchange rates in the adjustment of tariff (Energy Commission, 2020; PURC, 2020). However, net energy imports should also be included in the tariff adjustment formula.

6.5. Serial Correlation and Heteroskedasticity Tests

The Breusch–Godfrey serial correlation and heteroskedasticity tests affirm that the models are not serially correlated and there is no heteroskedasticity as the [Prob. F] for the respective variables are not less than 5% significance level (Table 5). This indicates that the findings are valid and reliable to augment the existing literature.

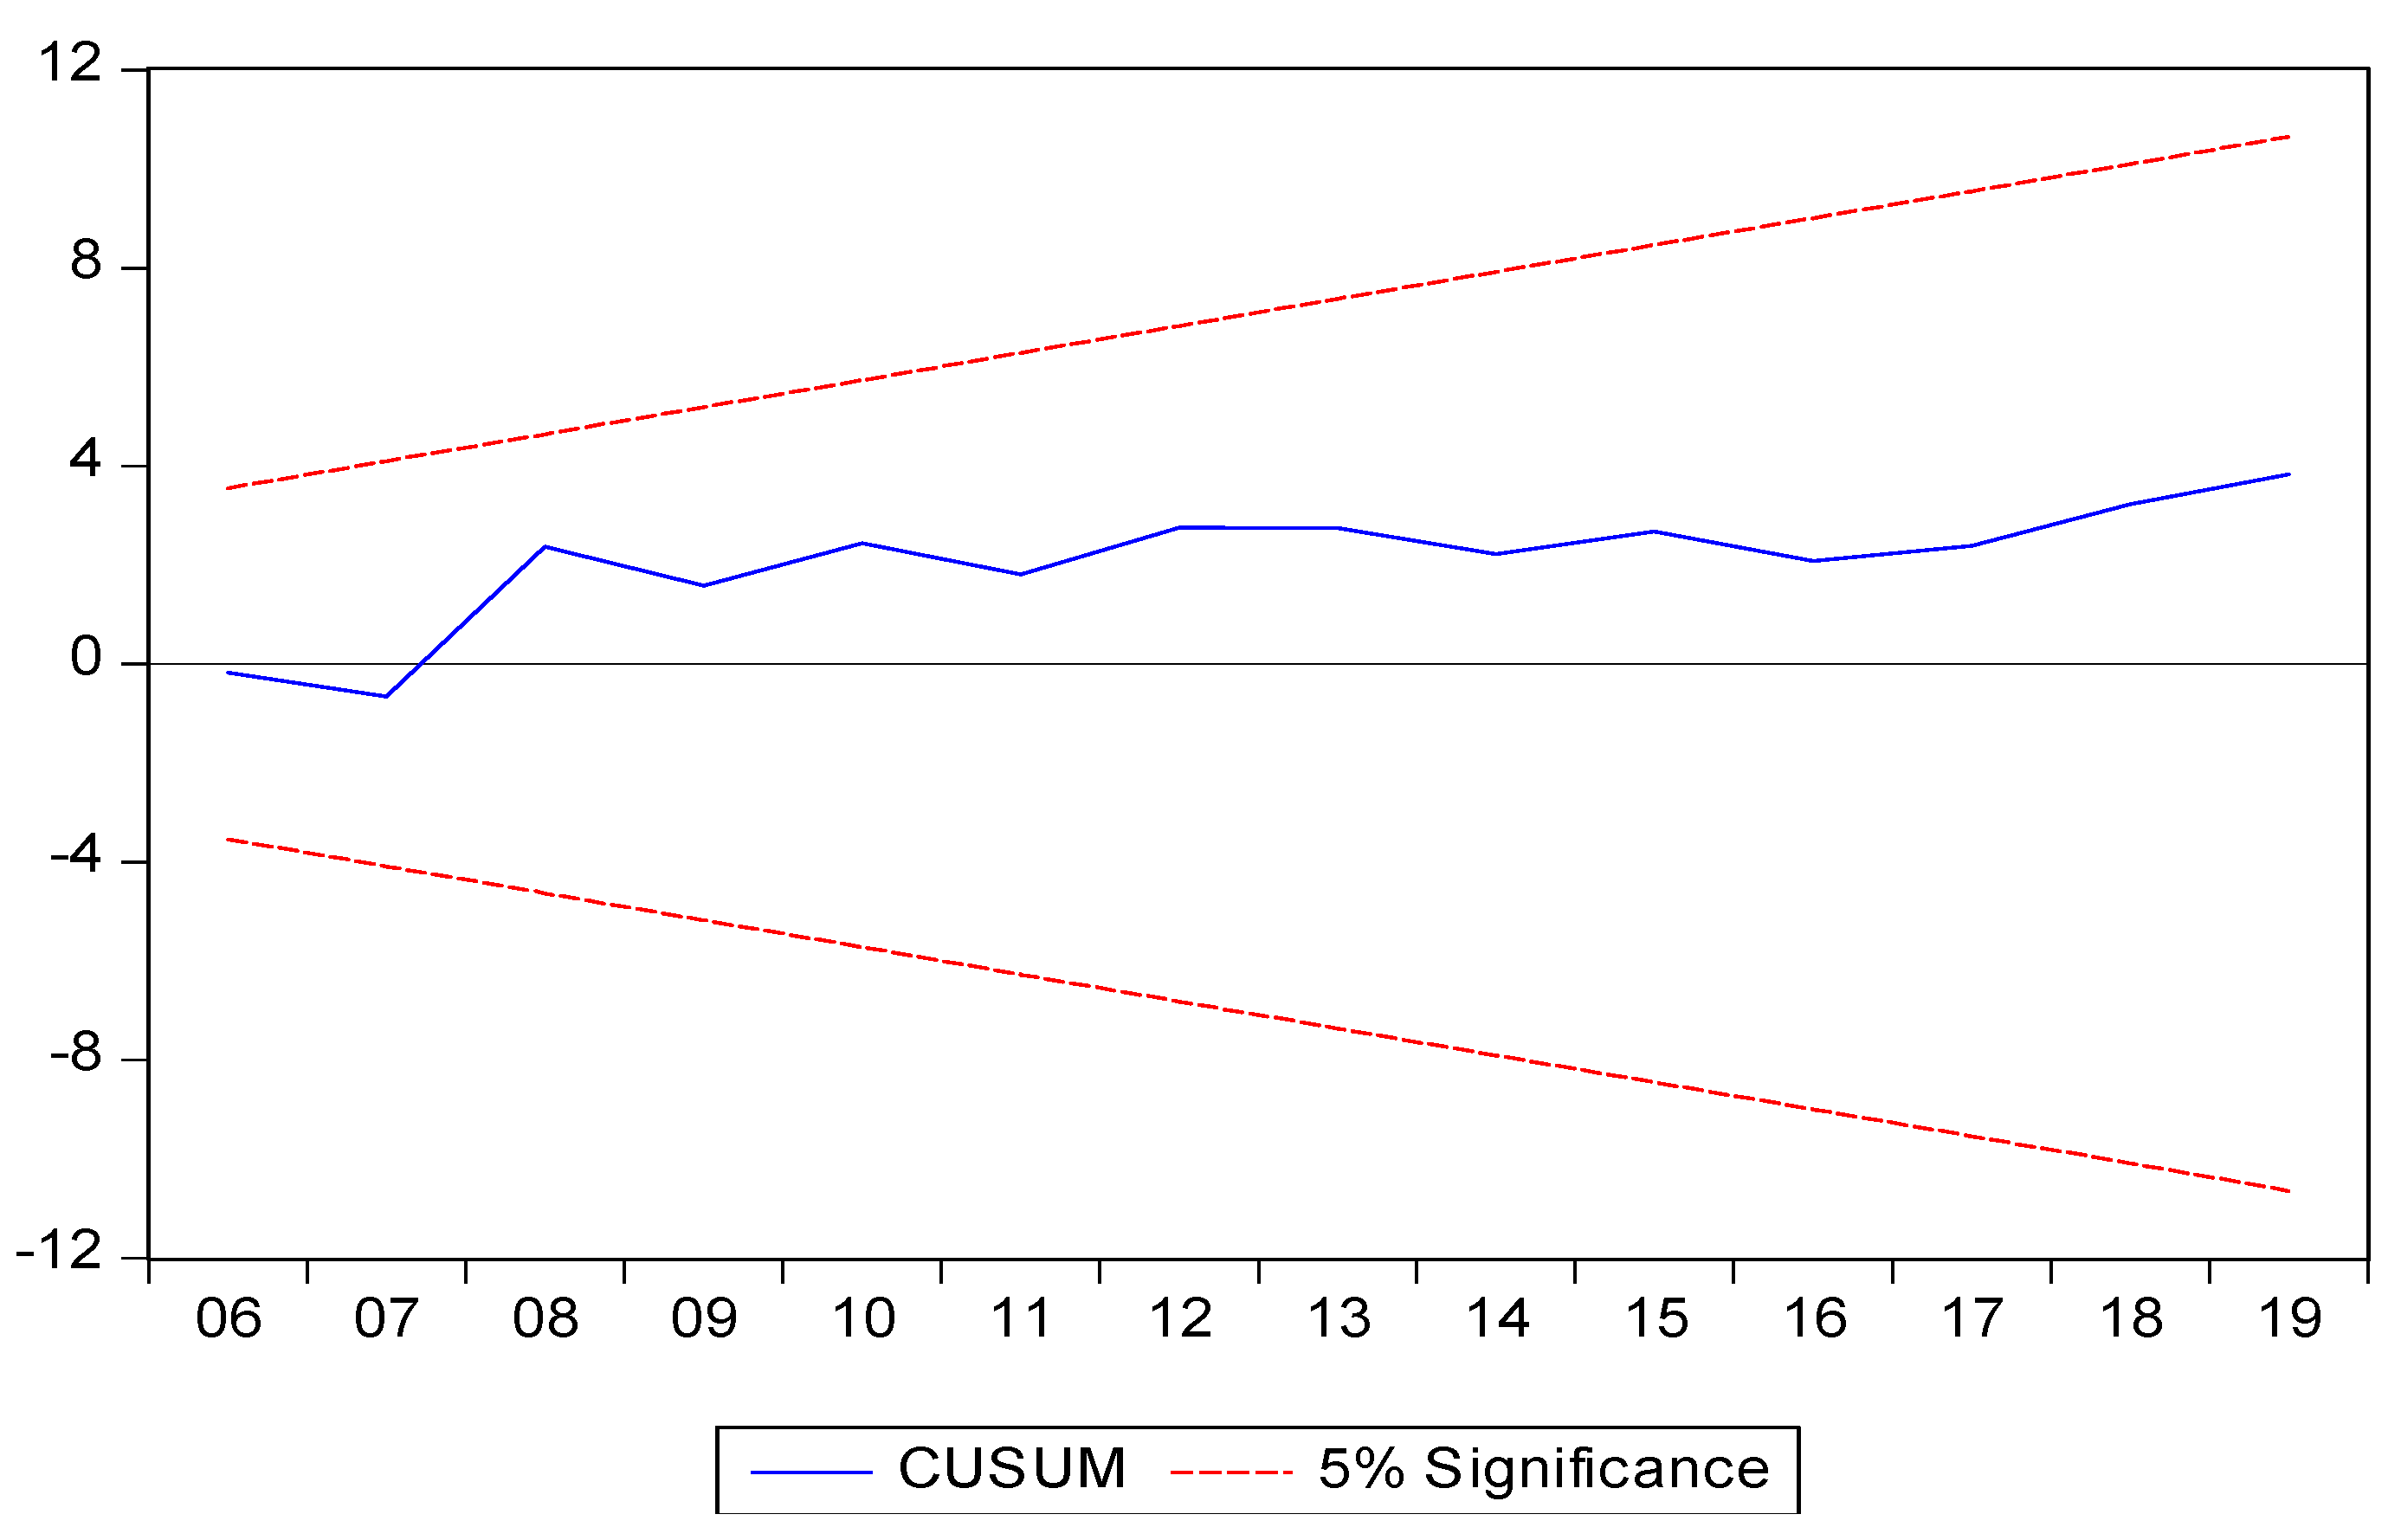
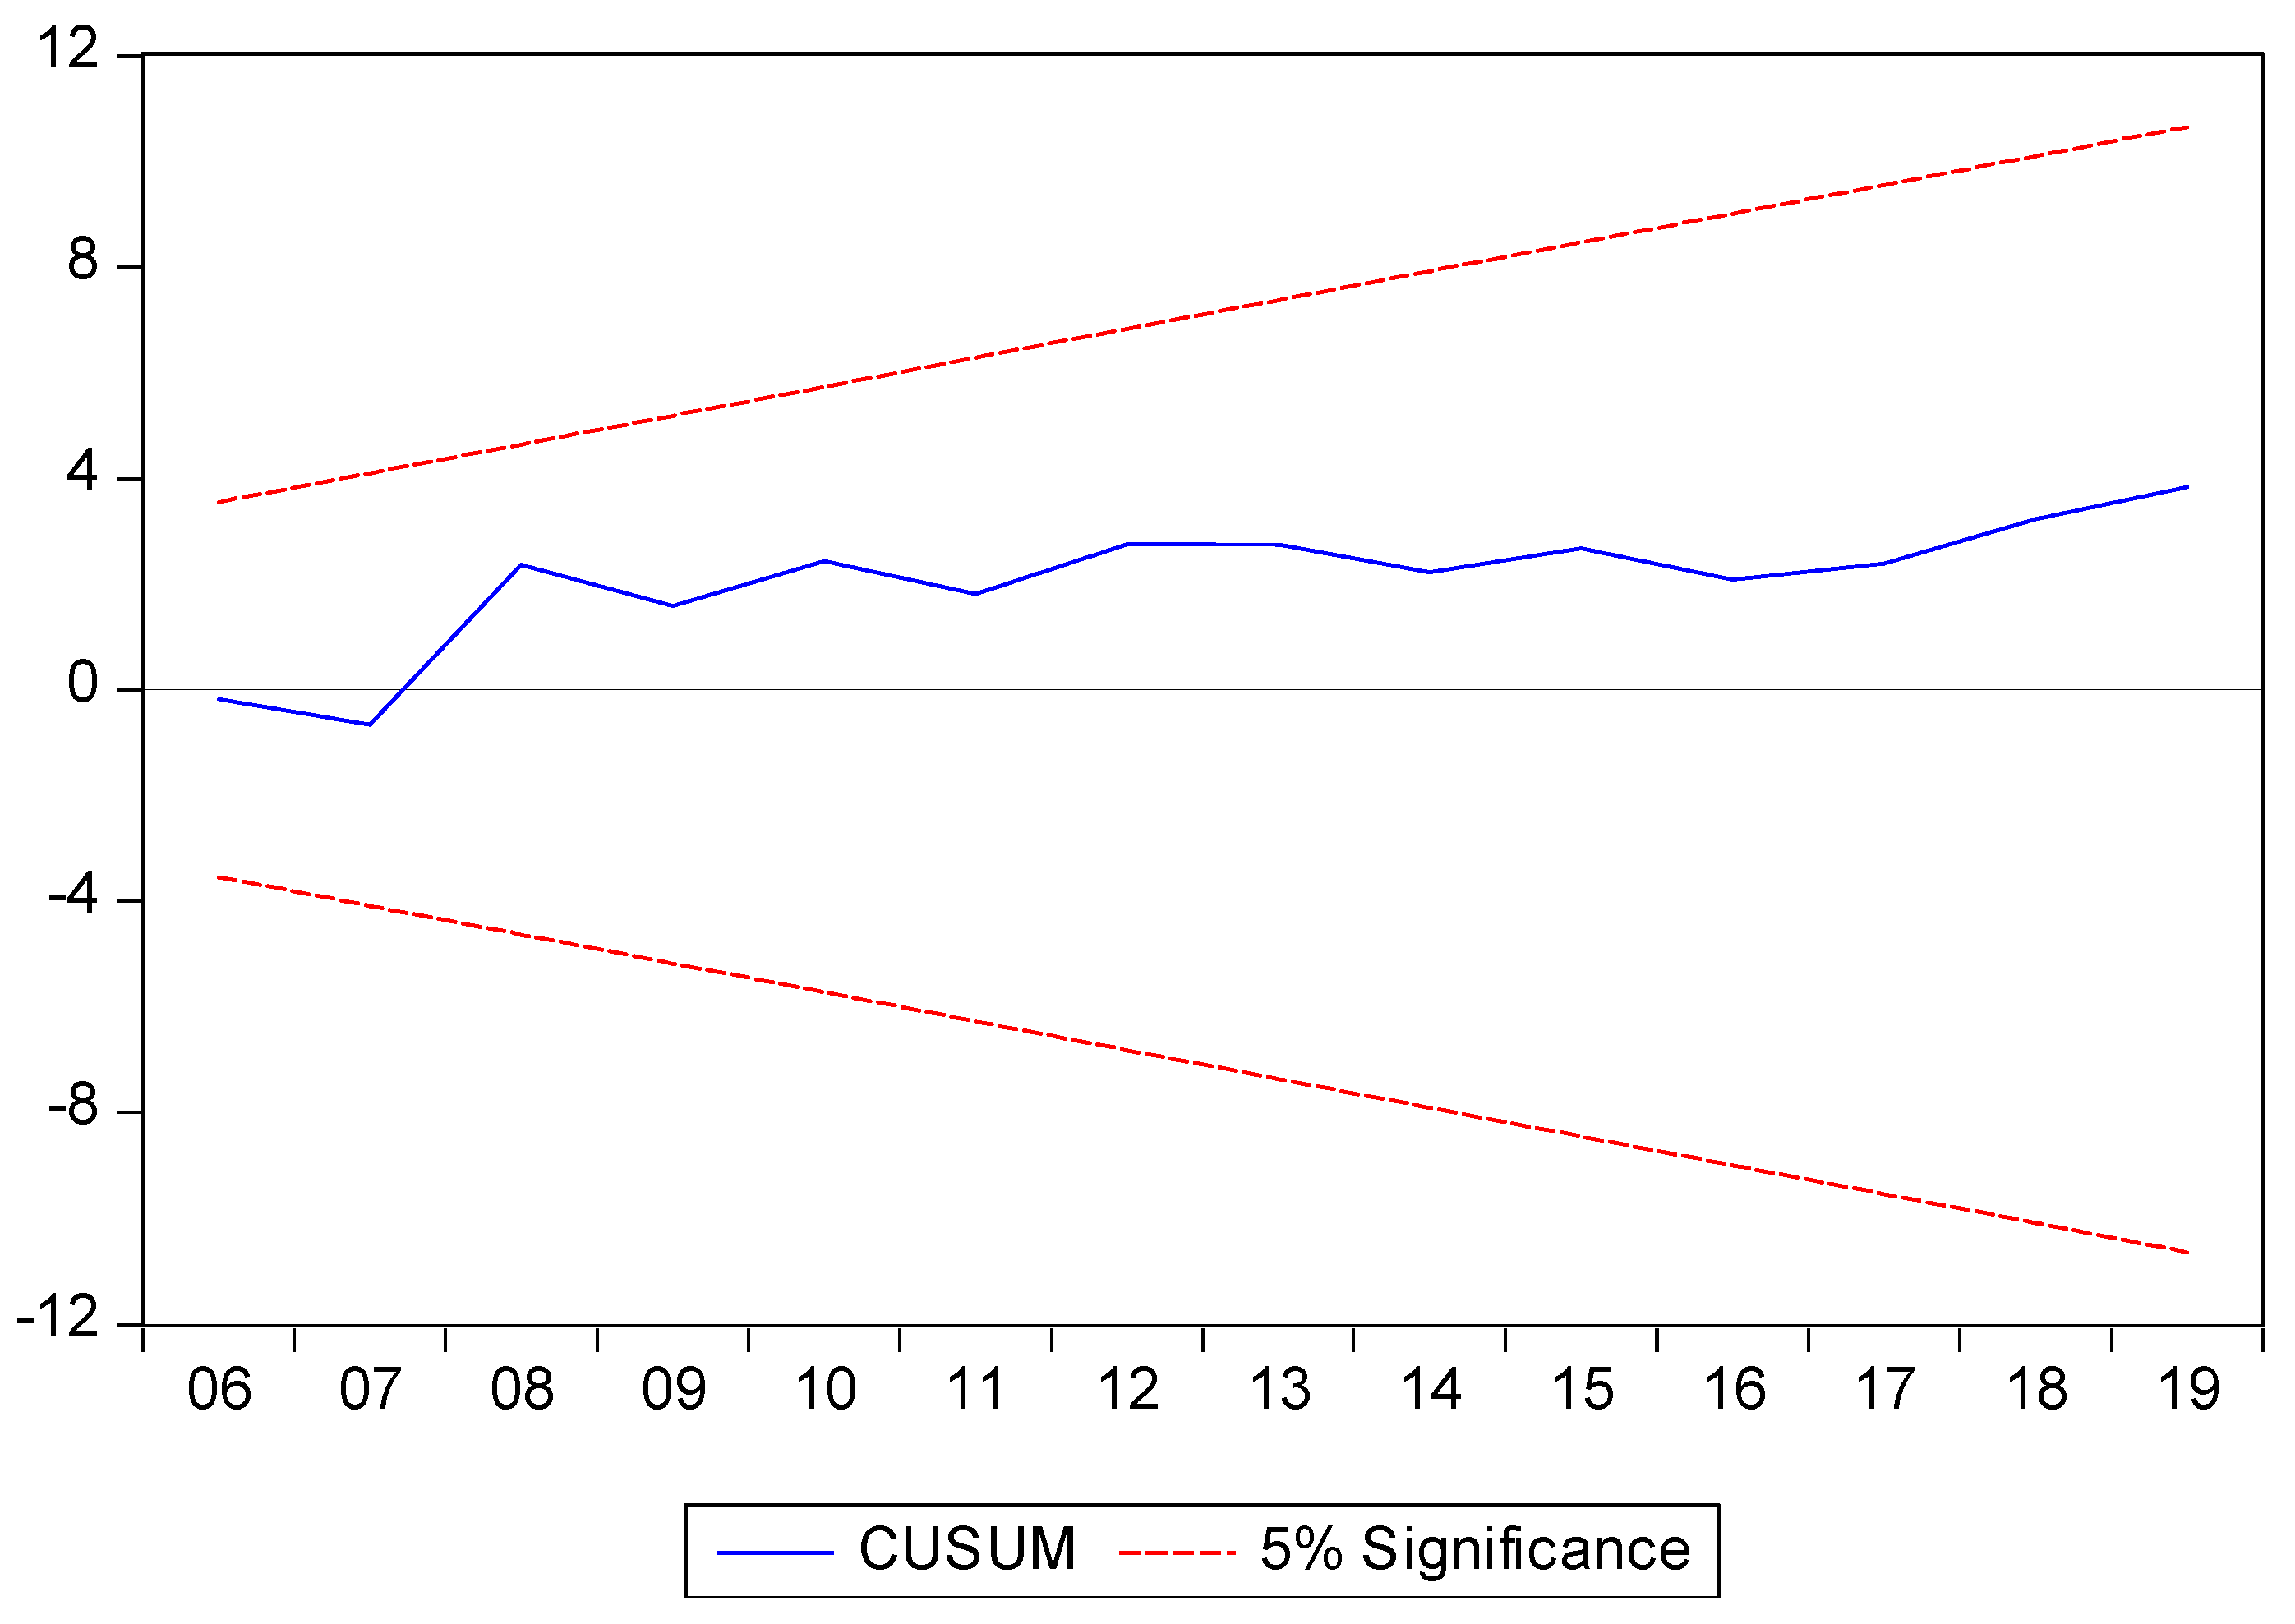
6.6. Residual and Stability Diagnostics Tests

The stability diagnostic test was conducted using CUSUM. The test was run for lntarifft in the short-term ARDL model and the long-term ECM. The stability is assessed at 5% significance boundary. Figure 1 and Figure 2 show the CUSUM test for lntarifft in the ARDL and ECM, respectively. Both models fall within the 5% significance boundary, indicating that they are stable.

7. Conclusions

As the debt stock level of the government continues to rise, partly due to the negative impact of COVID-19, a number of new taxes have been introduced in the 2021 budget alongside an upward adjustment of electricity tariff. Therefore, we were of the view that debt accumulation may have a significant influence on electricity tariff. Hence, we employed the ARDL model and the ECM to test for the Granger causality between state debt and electricity tariff. The results revealed that state debt has both short-term and long-term impacts on electricity tariff. It means that citizens would be required to pay more for electricity consumption in the future in response to rising debt levels today. Furthermore, inflation rates, exchange rates, and net energy imports have long-term impacts on electricity tariff while only exchange rates have short-term effects on state debt. Thus, all the accumulated debts prior to and during the COVID-19 era are causing a significant increase in Ghana’s electricity tariff, providing an empirical clue to what the situation is likely to be in other developing countries where there is poor debt management. These findings imply that effective debt management strategies (e.g., such as restructuring state-owned utilities, negotiating better IMF terms, or incentivizing private investment in energy to reduce a reliance on state borrowing) must be implemented by the government to reduce borrowing, particularly when such borrowing is not invested into projects that can repay the debt at maturity. Given that the government is constrained by budget deficits, borrowing to finance the deficit should be spent on capital stock which will in turn generate income to service the debt. The government may also control budget deficits by reducing consumption expenditure.
This paper significantly augments the extant literature but it is limited in the following way. It examines the case of one emerging economy without consideration of other economies in a similar situation. In jurisdictions where socio-economic factors or governance structures differ, a replication of this study is needed to ensure that the same results are achieved to support the implementation of the recommendations of this paper. Future research should examine the phenomenon in selected developing countries to see whether there will be consistency or inconsistency in the findings. Additionally, due to data availability constraints, we were unable to obtain data up to 2022 or 2023 for all the variables considered in this study. As a result, our analysis covers the period 1998–2020, limiting our ability to fully capture post-COVID dynamics. To address this limitation, we recommend a follow-up study in the future once more recent data becomes available. Future research should also investigate the distributional effects of tariff hikes, which underpin the NRT, but remain largely unexplored empirically.

Author Contributions

S.K.H. was involved in methods, analysis and interpretation of the data, and the final approval of the version to be published. V.A.E. was involved in the conception and data collection, E.D.E. drafted the paper revising it critically for intellectual content by focusing on the introduction while A.A.K. wrote the literature review section and conclusion. We agreed to be accountable for all aspects of the work. All authors have read and agreed to the published version of the manuscript.

Funding

This research received no external funding.

Institutional Review Board Statement

Not applicable.

Informed Consent Statement

Not applicable.

Data Availability Statement

The data can be made available upon request.

Conflicts of Interest

The authors declare no conflicts of interest.

References

  1. Acheampong, T., Menyeh, B. O., & Agbevivi, D. E. (2021). Ghana’s changing electricity supply mix and tariff pricing regime: Implications for the energy trilemma. Oil, Gas and Energy Law (OGEL), 19(3), 1–28. [Google Scholar]
  2. Adom, P. (2016). The DDT effect: The case of economic growth, public debt and democracy relationship. Munich Personal RePEc Archive, 1–35. Available online: https://mpra.ub.uni-muenchen.de/75022/ (accessed on 24 March 2025).
  3. Afzal, M. (2012). Ricardian equivalence hypothesis: Evidence from Pakistan. Journal of Business Management and Economics, 3(6), 258–265. [Google Scholar]
  4. Anning, L., Ofori, C., & Affum, E. (2016). The impact of government on the economic growth of Ghana: A time-series analysis from 1990–2015. International Journal of Innovation and Economic Development, 2(5), 31–39. [Google Scholar]
  5. Bank of Ghana. (2021). January 2020 Bank of Ghana’s summary of financial and economic data: Monetary policy committee report. Bank of Ghana. [Google Scholar]
  6. Barro, R. J. (1979). On the determination of public debt. Journal of Political Economy, 87, 240–271. [Google Scholar]
  7. Barro, R. J. (1990). Government spending in a simple model of endogenous growth. Journal of Political Economics, 98(5/2), 103–125. [Google Scholar]
  8. Chirwa, T., & Odhiambo, N. (2020). Electricity consumption and economic growth: New evidence from advanced, emerging and developing economies. International Journal of Energy Sector Management, 14(1), 1–19. [Google Scholar] [CrossRef]
  9. Das-Gupta, A., & Mookherjee, D. (2017). Tax administration and tax evasion. Journal of Public Economics, 153, 15–28. [Google Scholar]
  10. Dickey, D. A., & Fuller, W. A. (1981). Likelihood ratio statistics for autoregressive time series with unit root. Econometrica, 49, 1057–1072. [Google Scholar] [CrossRef]
  11. Donayre, L., & Taivan, A. (2017). Causality between public debt and real growth in the OECD: A country-by-country analysis. Economic Papers, 36(2), 156–170. [Google Scholar] [CrossRef]
  12. Energy Commission. (2020). 2020 energy (demand and supply) outlook for Ghana. Energy Commission. [Google Scholar]
  13. Garedow, F. A. (2022). Political institutions and economic performance in Ethiopia: An autoregressive distributed lag bound approach to co-integration. Journal of Economics and Development, 24(1), 2–17. [Google Scholar] [CrossRef]
  14. Hilton, S. K. (2021). Public debt and economic growth: Contemporary evidence from a developing economy. Asian Journal of Economics and Banking, 5(2), 173–193. [Google Scholar]
  15. IMF. (2019). Ghana: Staff report for the 2019 article IV consultation. IMF. [Google Scholar]
  16. IMF. (2021). International debt statistics database. IMF. [Google Scholar]
  17. Jalles, J. T. (2011). The impact of democracy and corruption on the debt-growth relationship in developing countries. Journal of Economic Development, 36(4), 41–72. [Google Scholar] [CrossRef]
  18. Kobayashi, K. (2015). Public debt overhang and economic growth, policy research institute, ministry of finance, Japan. Public Policy Review, 11(2), 247–276. [Google Scholar]
  19. Kobayashi, K., & Shirai, D. (2017). Debt-ridden borrowers and economic slowdown (CIGSWorking Paper 17-002E). The Canon Institute for Global Studies. [Google Scholar]
  20. Kourtellos, A., Stengos, T., & Tan, C. M. (2013). The effect of public debt on growth in multiple regimes. Journal of Macroeconomics, 38(8), 35–43. [Google Scholar]
  21. Kumar, M., & Woo, J. (2010). Public debt and growth, IMF working paper 10/174. Available online: https://ssrn.com/abstract=1653188 (accessed on 24 March 2025).
  22. Kumi, E. N. (2017). The electricity situation in Ghana: Challenges and opportunities, CGD policy paper. Center for Global Development. Available online: https://www.cgdev.org/publication/electricity-situation-ghana-challenges-and-opportunities (accessed on 2 July 2021).
  23. Ministry of Finance. (2020). 2020 budget statement and economic policy. Ministry of Finance. [Google Scholar]
  24. Ministry of Finance. (2023). 2023 budget statement and economic policy. Ministry of Finance. [Google Scholar]
  25. Onogbosele, D. O., & Ben, M. D. (2016). The impact of domestic debt on economic growth of Nigeria. Asian Research Journal of Arts & Social Sciences, 1(3), 1–13. [Google Scholar]
  26. Owusu-Nantwi, V., & Erickson, C. (2016). Public debt and economic growth in Ghana. African Development Review, 28(1), 116–126. [Google Scholar]
  27. Panizza, U., & Presbitero, A. F. (2014). Public debt and economic growth: Is there a causal effect? Journal of Macroeconomics, 41, 21–41. [Google Scholar]
  28. Pasinetti, L. (1977). Lectures on the theory of production. Macmillan. [Google Scholar]
  29. Pesaran, M. H., Shin, Y., & Smith, R. (2001). Bound testing approaches to the analysis of level relationship. Journal of Applied Econometrics, 16(3), 289–326. [Google Scholar]
  30. Public Utilities Regulatory Commission. (2020). 2020 tariff report. Public Utilities Regulatory Commission. [Google Scholar]
  31. Reinhart, C. M., & Rogoff, K. S. (2010). Growth in a time of debt. NBER Working Paper No. 15639. National Bureau of Economic Research, Inc. [Google Scholar]
  32. Ricardo, D. (1951). On the principles of political economy and taxation. In P. Sraffa (Ed.), The works and correspondence of david ricardo 1. Cambridge University Press, with the collaboration of M. Dobb. [Google Scholar]
  33. Robinson, J. (1962). Economic philosophy. C.A. Watts. [Google Scholar]
  34. Sraffa, P. (1960). Production of commodities by means of commodities. Cambridge University Press. [Google Scholar]
  35. World Bank. (2004). Ghana-enhanced heavily indebted poor countries (HIPC) debt initiative (English). World Bank. [Google Scholar]
  36. World Bank. (2019). Ghana energy sector review. World Bank. [Google Scholar]
  37. World Bank. (2020a). Ghana country assistance strategy. World Bank. [Google Scholar]
  38. World Bank. (2020b). Ghana economic update: Enhancing growth through improved governance. World Bank. [Google Scholar]
  39. World Bank. (2021). World Bank databank. World development indicators. Available online: http://www.data.worldbank.org (accessed on 2 July 2021).
Figure 1. Stability diagnostic result for lntarifft in ARDL. Source: generated using E-views 10.
Jrfm 18 00184 g001
Figure 2. Stability diagnostic result for lntarifft in ECM. Source: generated using E-views 10.
Jrfm 18 00184 g002
Table 1. Unit root test result.
Intercept and No TrendIntercept and Trend
VariablesLevels First DifferenceLevelsFirst Difference
lntarifft−1.287−3.378 **−1.564−3.289 *
lnsdt−0.885−3.642 **−0.945−3.878 **
lninft−2.658 *−4.152 ***−3.393 *−3.990 **
lnexct−1.571−3.475 **−2.610−3.554 **
lnneteit−1.390−3.071 **2.638−3.778 ***
Note: *, ** and *** signifies the rejection of the null hypothesis of non-stationarity at 10%, 5% and 1% significance levels, respectively. Source: generated using E-views 10.
Table 2. ARDL bounds test.
Dependent Variable F-StatisticCointegrationDecision
lntarifft6.656257YesEstimate ECM (long-term model)
lnsdt1.396649NoEstimate ARDL (short-term model)
lninft2.143308NoEstimate ARDL (short-term model)
lnexct2.754151NoEstimate ARDL (short-term model)
lnneteit1.144439NoEstimate ARDL (short-term model)
Note: Critical values (I0 Bound) are 2.45, 2.86 and 3.74; and critical values (I1 Bound) are 3.52, 4.01 and 5.06; critical values are significant at 10%, 5% and 1%, respectively. Source: generated using E-views 10.
Table 3. Lag length selection test.
Dependent VariableLag LengthAkaike Information Criterion (AIC)
lntarifft13.183147 *
lnsdt2−0.598639 *
lninft00.890928 *
lnexct,1−1.475172 *
lnneteit31.545634 *
* indicates lag order selected by the criterion. Source: generated using E-views 10.
Table 4. Granger causality test results (short-term and long-term causation).
Dependent VariableIndependent Variables
Coefficients [p-Value]
ECTt1
[p-Value]
lntarifftlnsdtlninftlnexctlnneteit
lntarifft-3.279
[0.006]
−0.127
[0.831]
0.904
[0.581]
0.277
[0.517]
1.057
[0.035]
lnsdt0.029
[0.617]
-0.311
[0.175]
−0.451
[0.335]
−0.049
[0.710]
-
lninft1.910
[0.482]
−4.031
[0.762]
-−2.530
[0.646]
−7.861
[0.862]
-
lnexct0.013
[0.706]
0.432
[0.031]
0.049
[0.636]
-0.045
[0.541]
-
lnneteit−0.115
[0.724]
−4.475
[0.428]
−0.511
[0.658]
−0.665
[0.772]
--
Source: Generated using E-views 10.
Table 5. Serial correlation and heteroskedasticity results.
Dependent VariableSerial Correlation LM
F-Statistic [Prob. F]
Heteroskedasticity
F-Statistic [Prob. F]
lntarifft0.403403 [0.5364]1.640081 [0.2056]
lnsdt1.259815 [0.3493]0.784561 [0.6473]
lninft0.122180 [0.7302]1.473456 [0.2599]
lnexct0.534272 [0.4778]0.657109 [0.6615]
lnneteit0.465617 [0.5025]0.294963 [0.9146]
* lntarifft0.002599 [0.9602]2.556428 [0.0736]
Note: * lntarifft is for the ECTt−1. Source: generated using E-views 10.
Disclaimer/Publisher’s Note: The statements, opinions and data contained in all publications are solely those of the individual author(s) and contributor(s) and not of MDPI and/or the editor(s). MDPI and/or the editor(s) disclaim responsibility for any injury to people or property resulting from any ideas, methods, instructions or products referred to in the content.

