

Is Globalization Coming to an End Due to the Rise in Income Inequality?


Abstract
1. Introduction
- Great gains from globalization for the country as a whole and a relatively small rise in within-country inequality (Japan, China, some European countries);
- Small gains from globalization for the country as a whole, but a decline in domestic inequality (some Latin American countries, including Brazil);
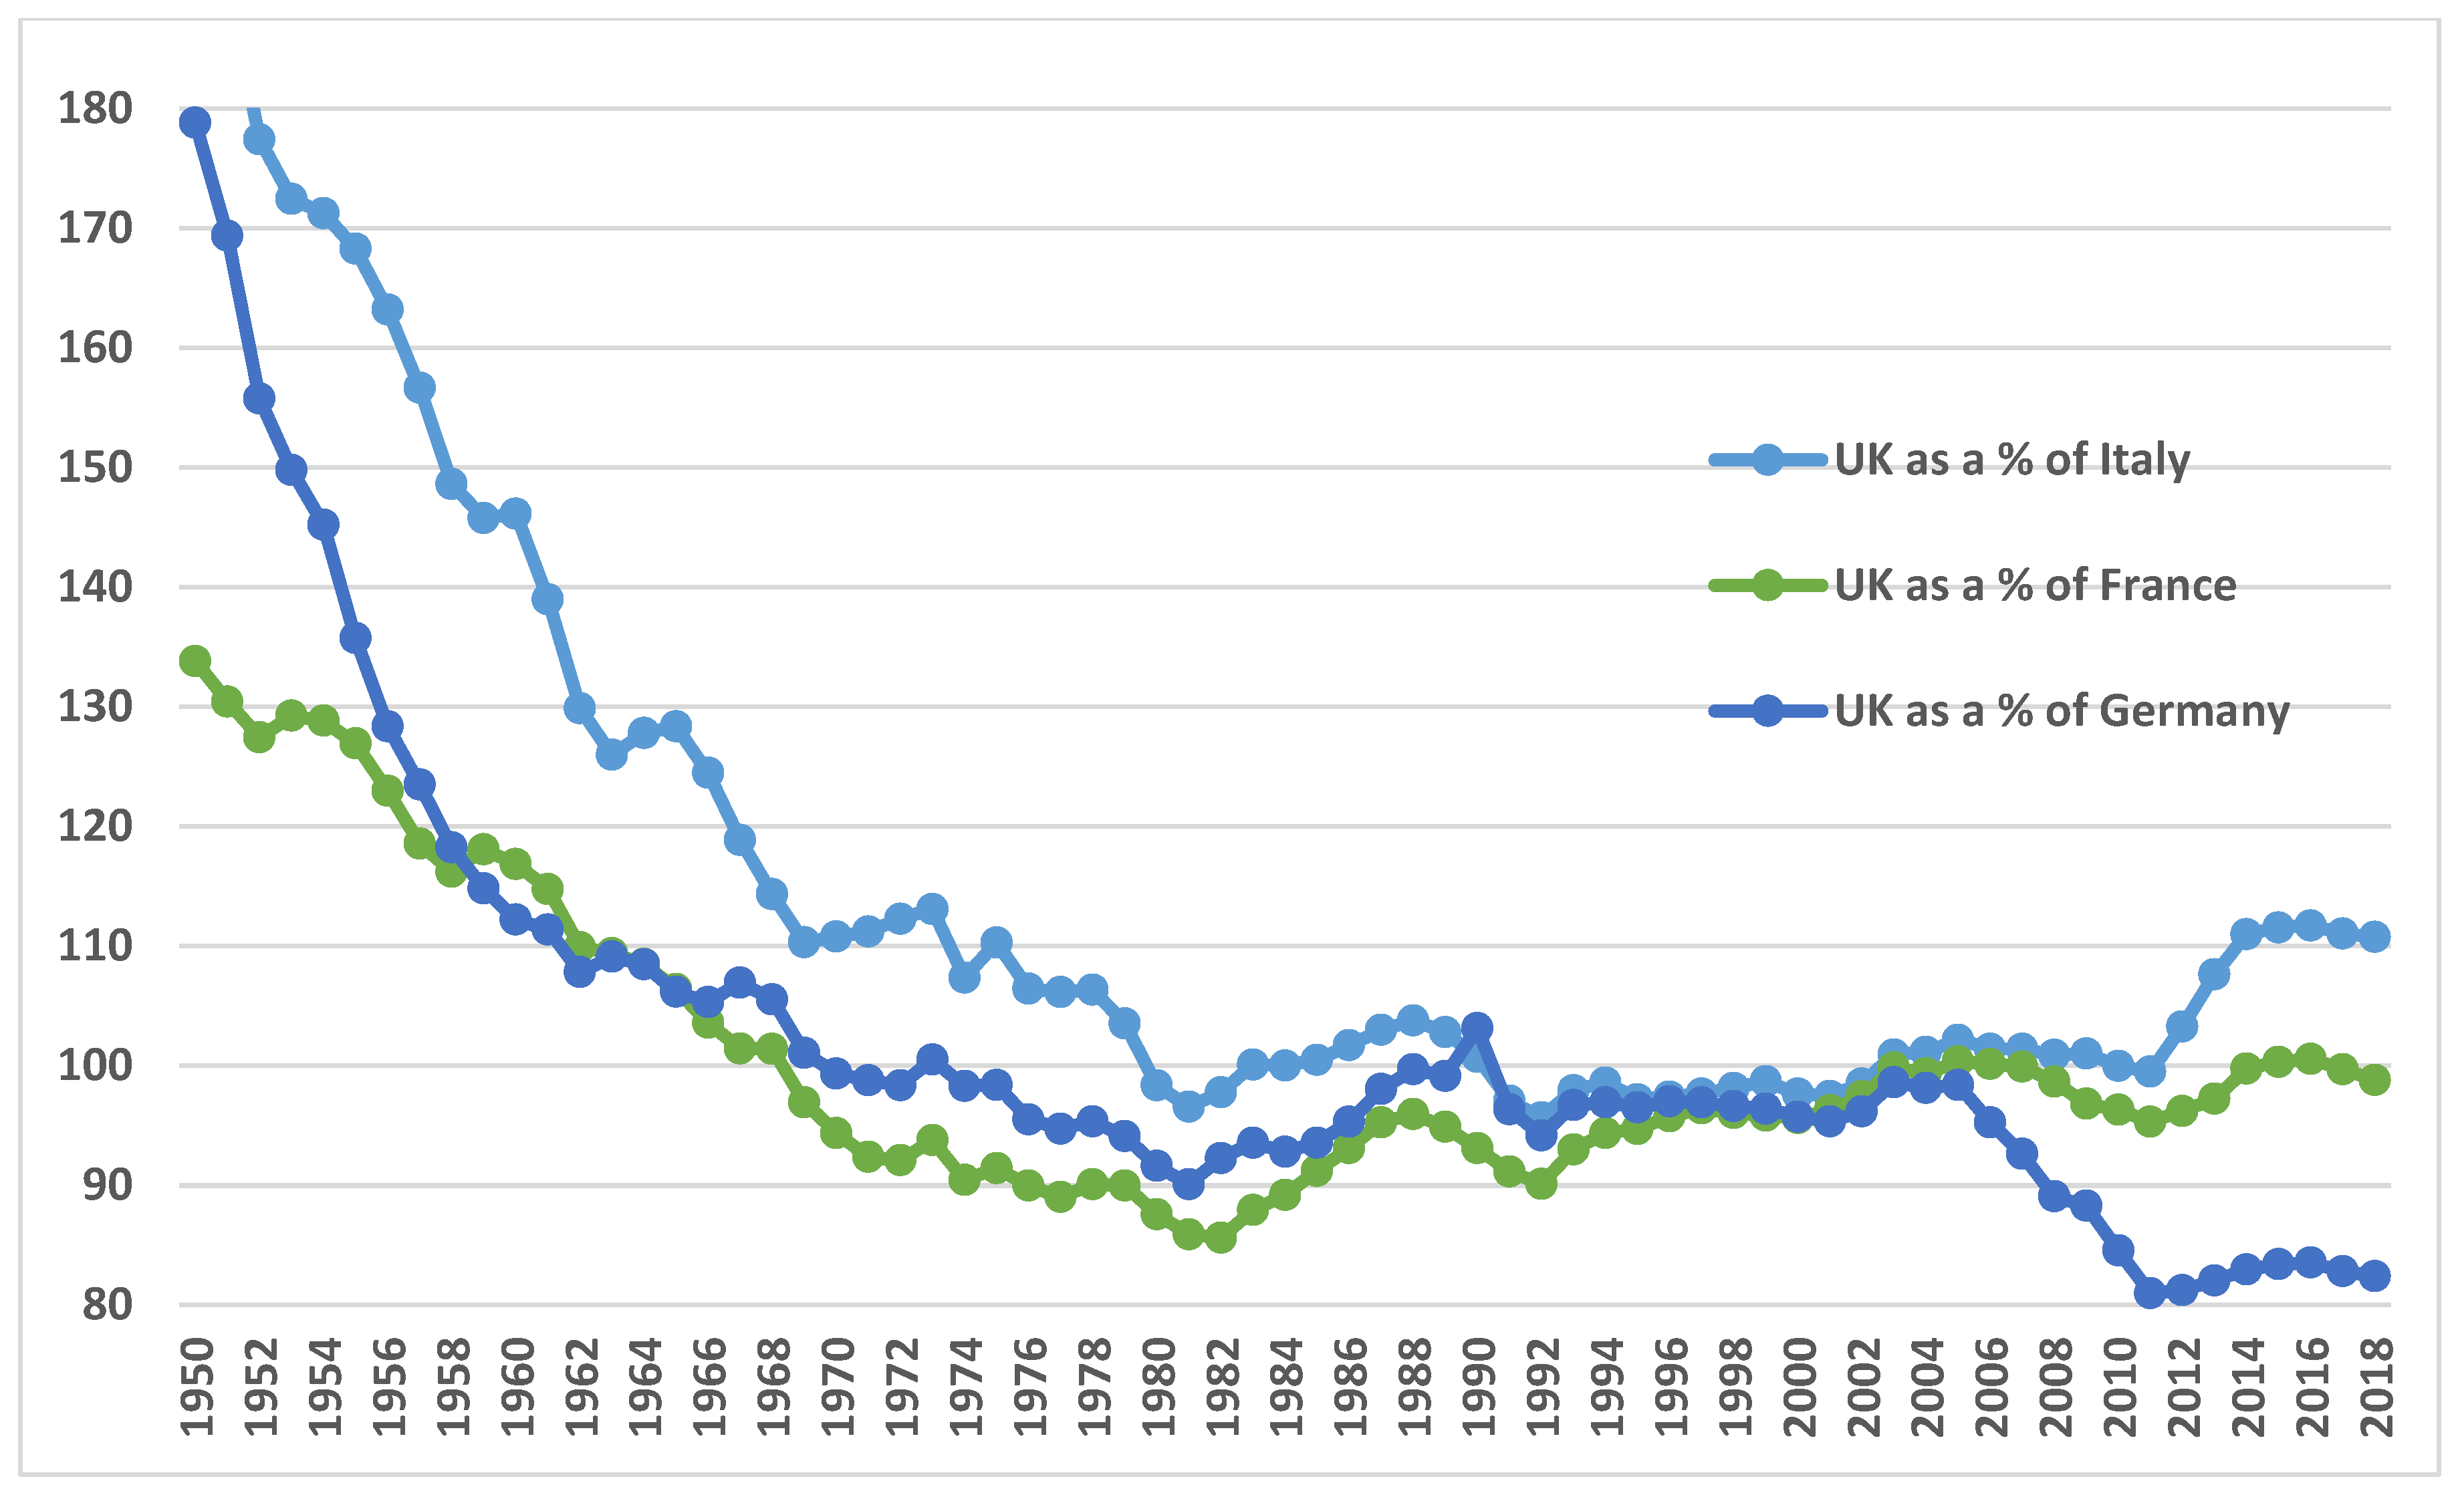
- Large gains from globalization for the country as a whole, but an increase in domestic inequality (Britain);
- Small gains from globalization for the country as a whole and a high level of domestic inequality (the US, Latin American countries, Russia in the 1990s).
2. Nationalism and Inequality Within Countries
3. Empirical Evidence
4. Case Studies—The US, the EU, and Russia
4.1. The US
4.2. The EU
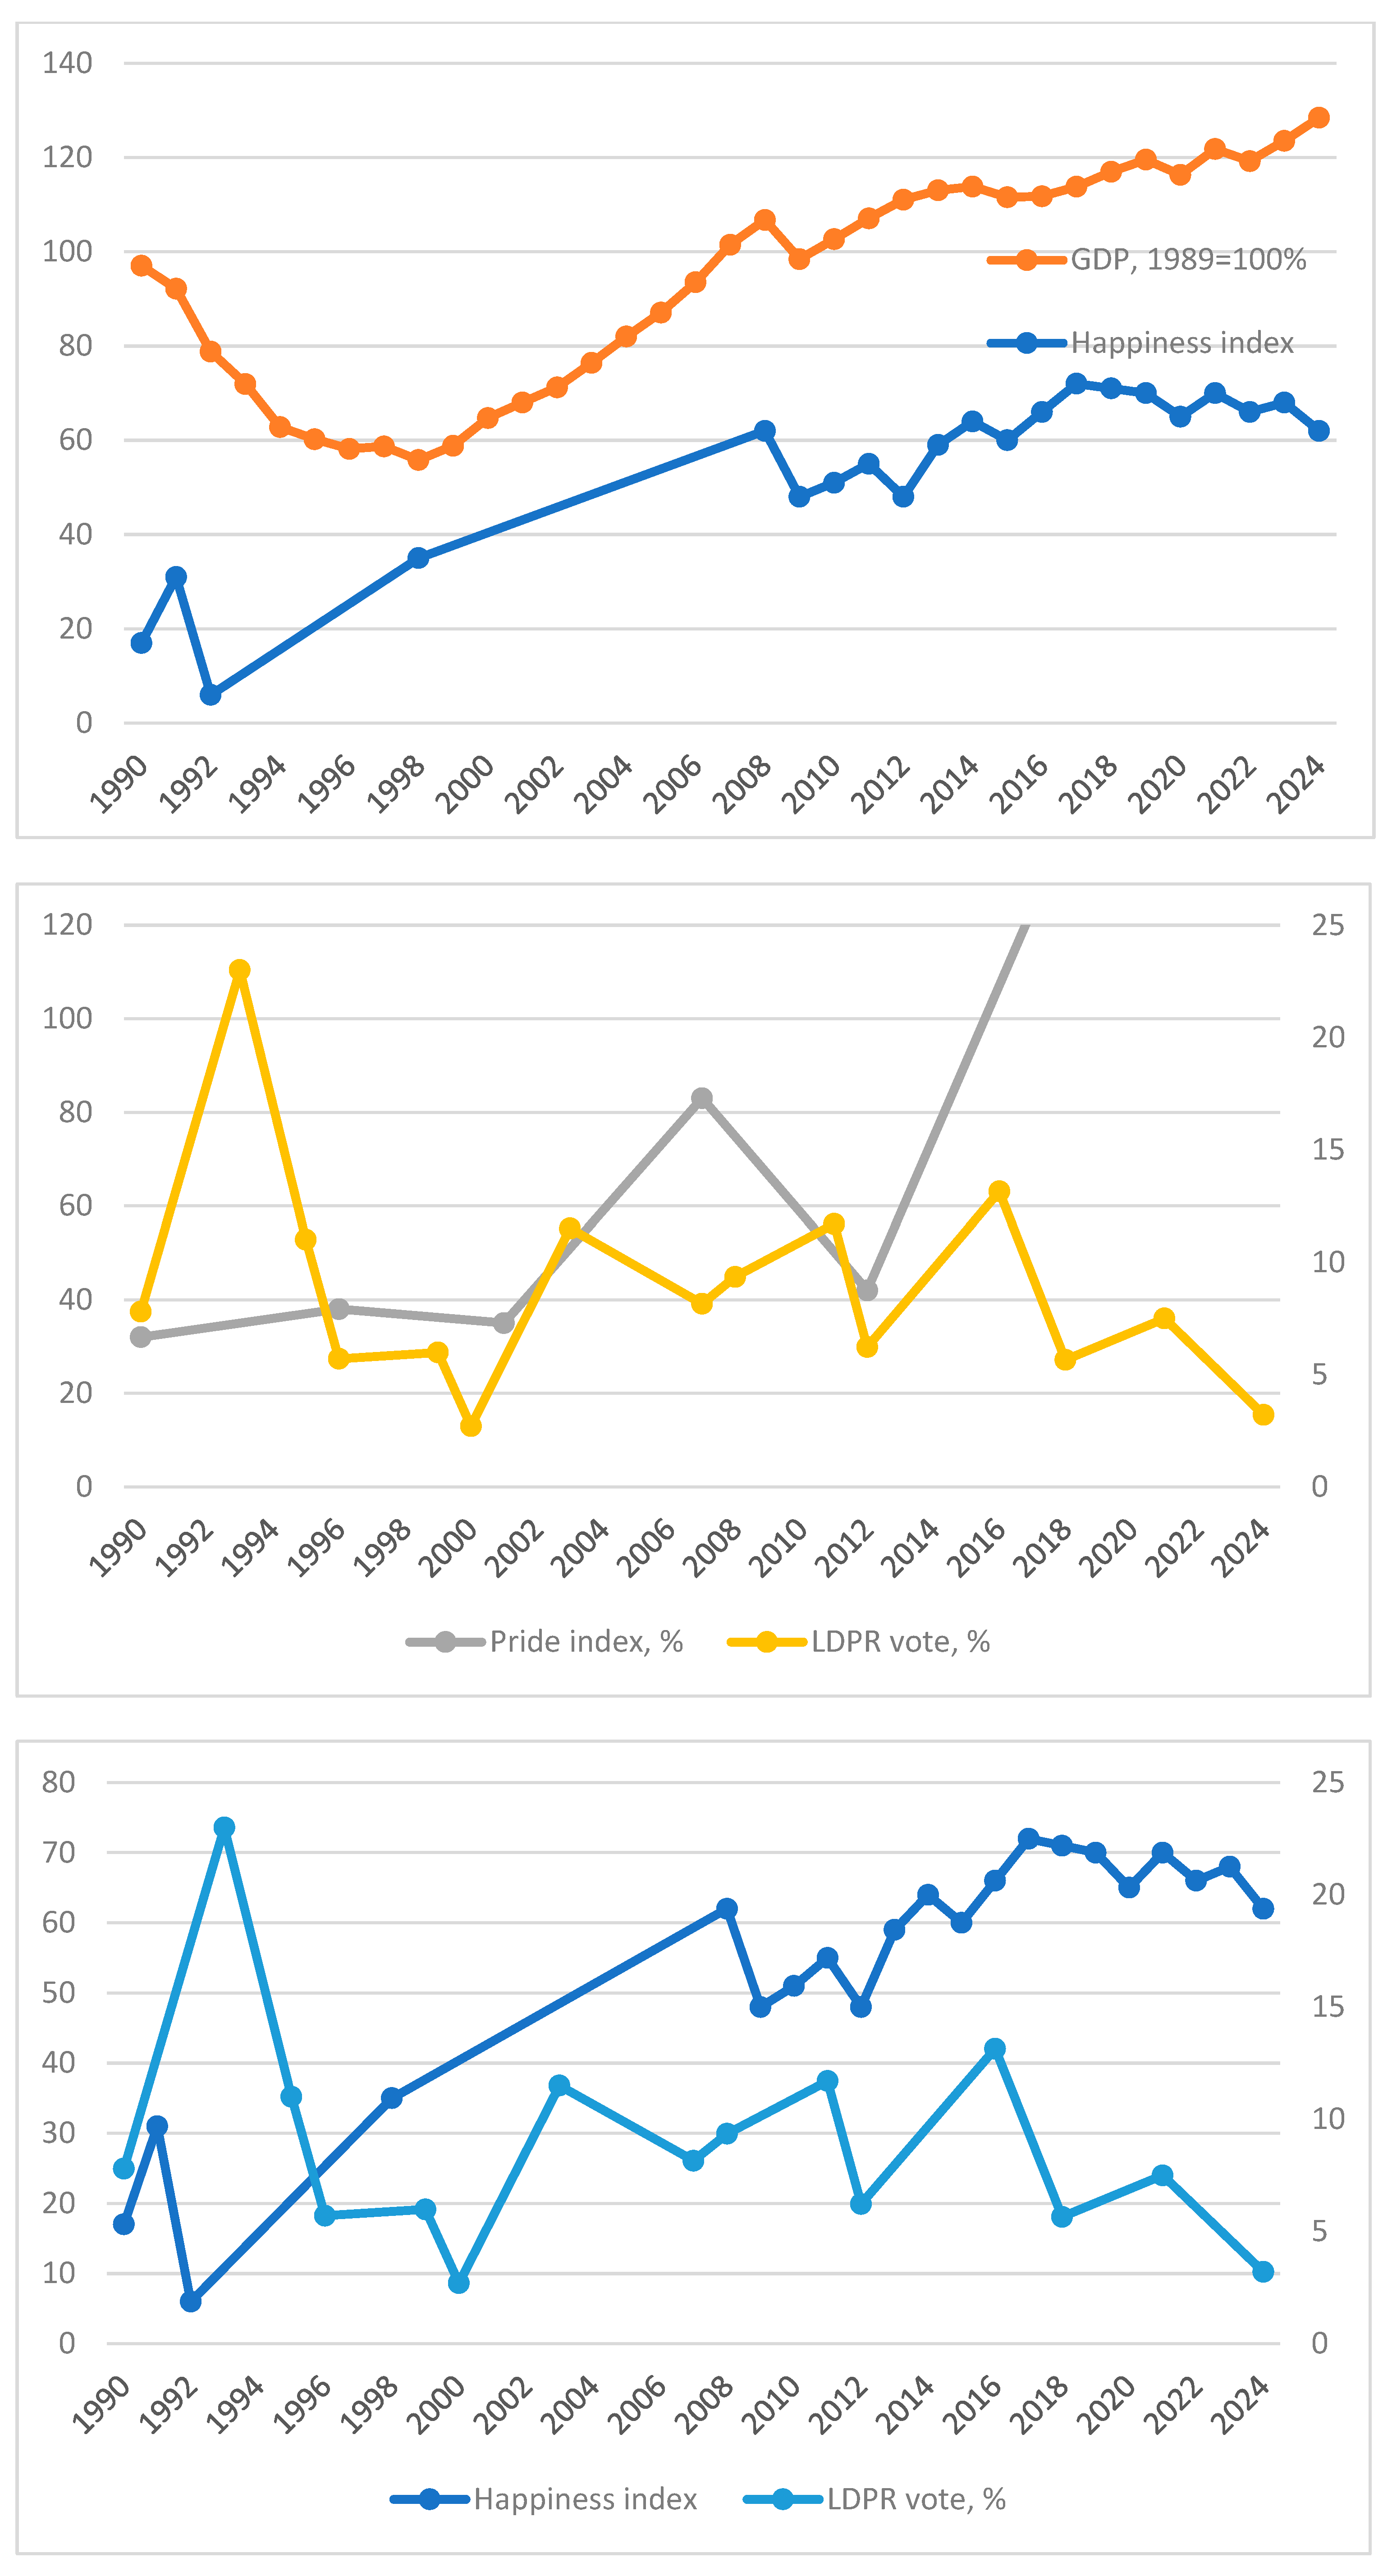
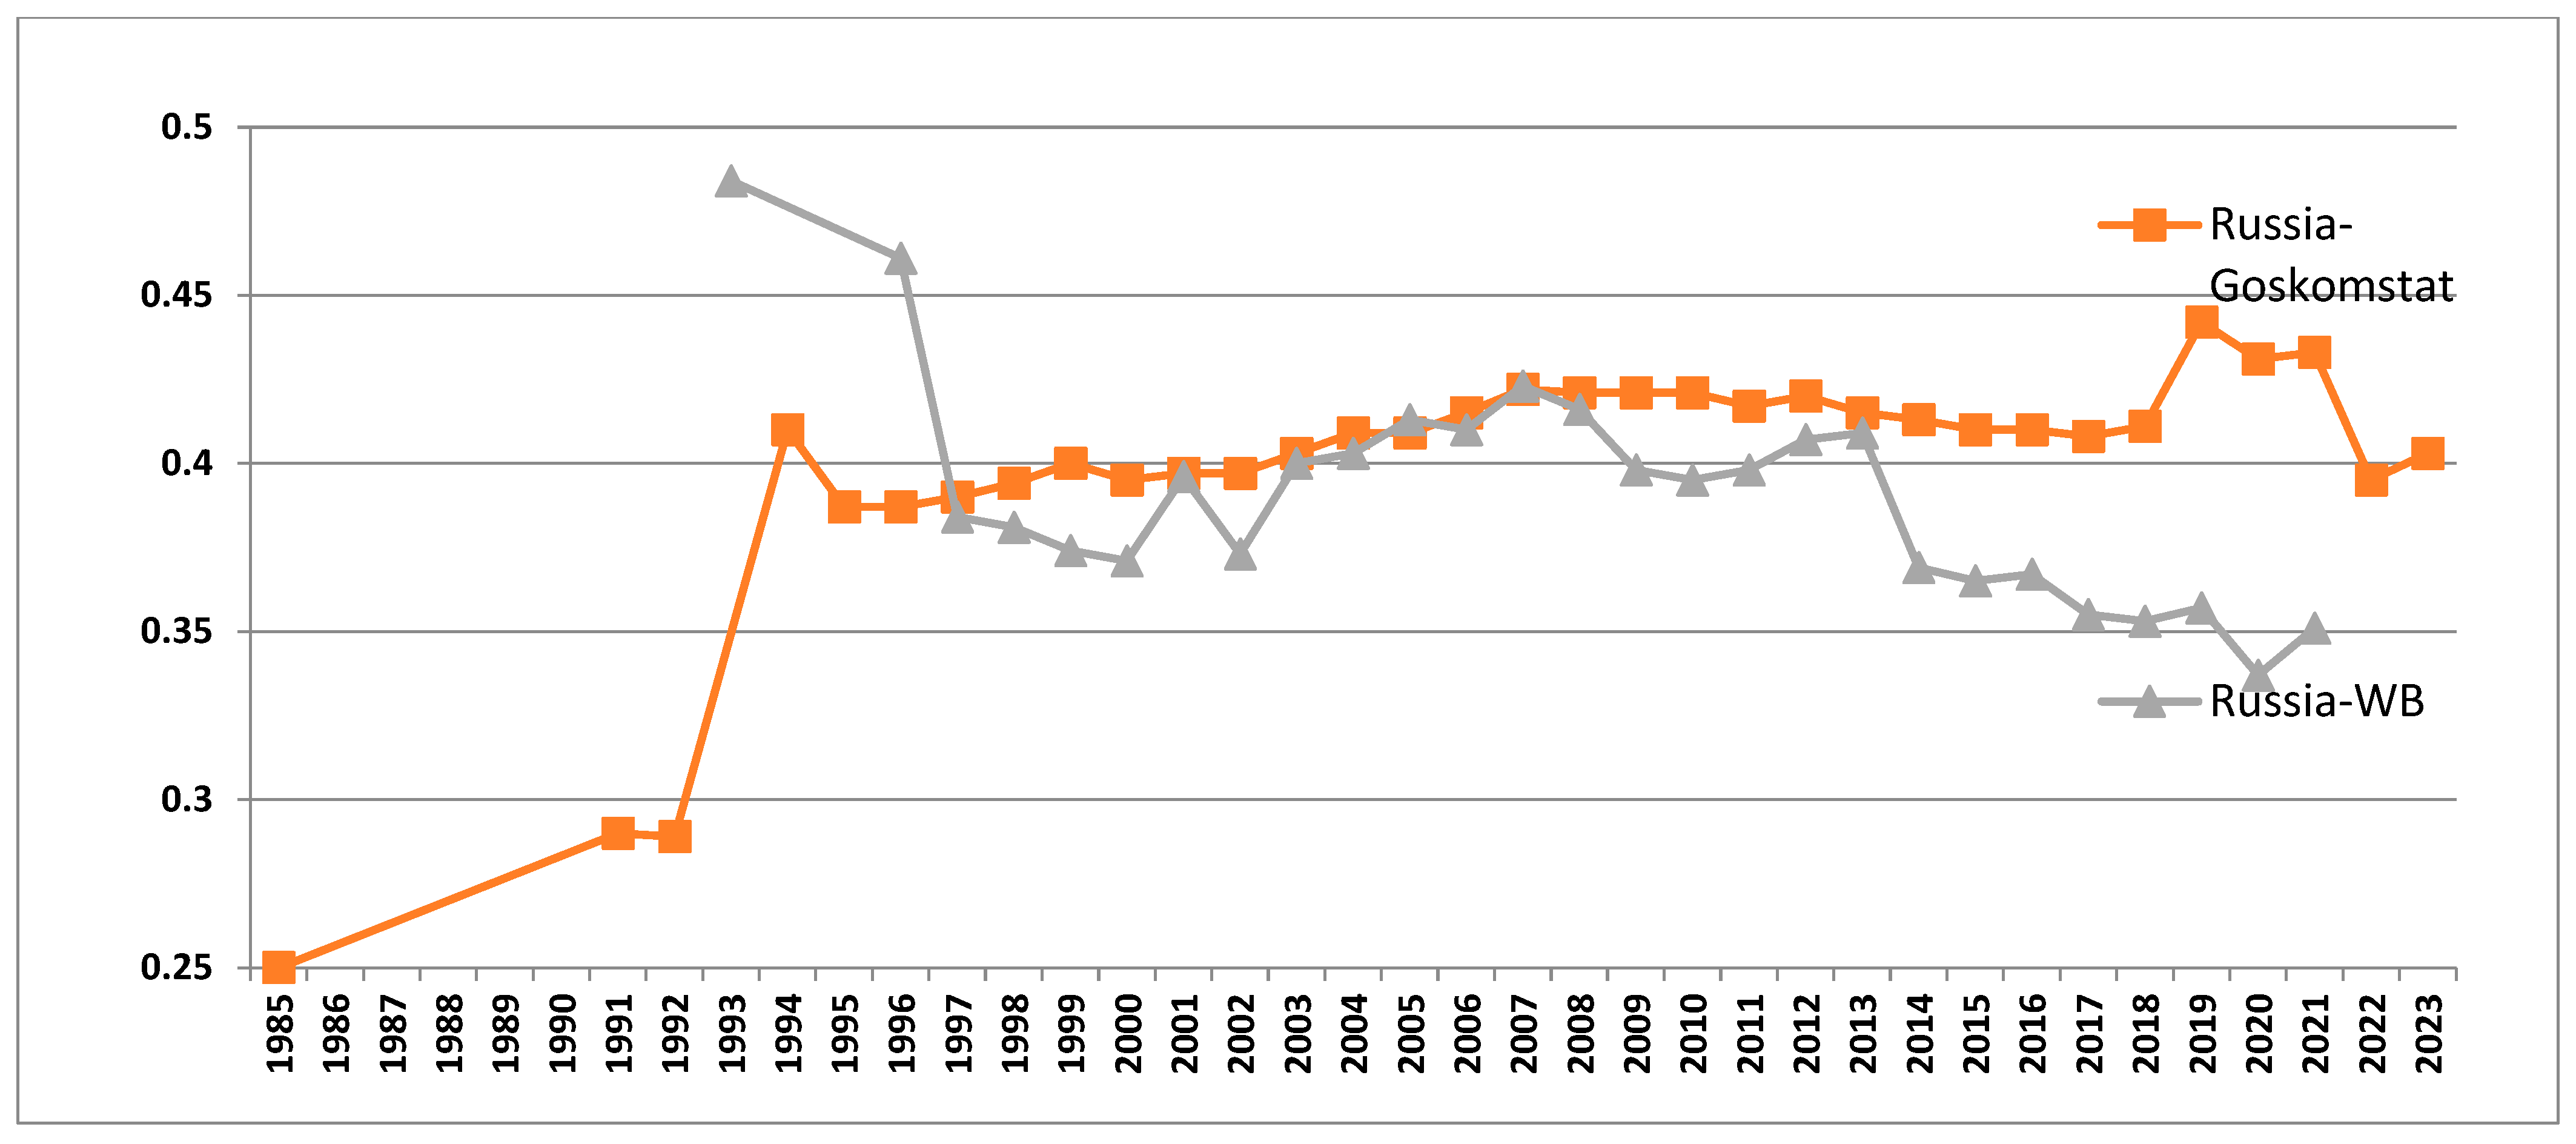
4.3. Russia
5. Conclusions
Funding
Institutional Review Board Statement
Informed Consent Statement
Data Availability Statement
Conflicts of Interest
| 1 | Recent data from the representative nationwide household survey suggest that the Gini index in China may be even higher (47–49% in 2003–2012) than in a previous separate survey among rural and urban areas, but was not really growing in the last decade. It is important though to take into account the size of the country—in terms of both territory and population. Three Chinese provinces (Guangdong, Shandong, and Henan) have a population of over 95 million, another seven have over 50 million, i.e., bigger that most states, so China should be compared with multistate regions, like the European Union or ASEAN, rather than with particular states. In the EU 27, for instance, the coefficient of income inequality around 2005 was approximately 40% with 23 p.p. coming from between-country inequality. In China (29 provinces), the coefficient of income inequality was over 40% with 24 p.p. coming from between-province disparity. In the US, the inequality coefficient was similar (over 40%), but only 6 p.p. came from disparities in income between states (Milanovic, 2012). If China manages to reduce the income gap between its provinces (and the EU—between countries) to a level close to disparities between US states, general inequality between citizens will fall to quite a low level (Popov, 2014a; Jomo & Popov, 2016). |
References
- Alvaredo, F., Atkinson, A. B., & Morelli, S. (2016). Top wealth shares in the UK over more than a century. Working Papers Department of Economics Ca’ Foscari University of Venice No. 01 /WP/20. Available online: https://papers.ssrn.com/sol3/papers.cfm?abstract_id=2903853 (accessed on 25 February 2025).
- Alvaredo, F., Atkinson, A. B., Piketty, T., & Saez, E. (2012). The world top incomes database. Available online: http://www.wid.world/#Introduction (accessed on 25 February 2025).
- Case, A., & Deaton, A. (2015). Rising morbidity and mortality in midlife among white non-Hispanic Americans in the 21st century. Proceedings of the National Academy of Science USA, 112(49). Available online: http://www.ncbi.nlm.nih.gov/pmc/articles/PMC4679063/ (accessed on 25 February 2025). [CrossRef]
- Central Election Commission of the Russian Federation. (2025). Available online: http://cikrf.ru/banners/vib_arhiv/ (accessed on 25 February 2025).
- Federico, G., & Junguito, A. T. (2018). Openness_800_2014_Ftwthd_201710_V01.Xlsx. Federico-Tena World Trade Historical Database. Available online: https://www.uc3m.es/ss/Satellite/UC3MInstitucional/es/TextoMixta/1371246237481/?d=Touch (accessed on 25 February 2025).
- Ferguson, T., Page, B., Rothschild, J., Chang, A., & Chen, J. (2018, October). The economic and social roots of populist rebellion: Support for Donald Trump in 2016 (Working Paper No. 83). Institute for New Economic Thinking. Available online: https://papers.ssrn.com/sol3/papers.cfm?abstract_id=3306267 (accessed on 25 February 2025).
- Global Wealth Report, Credit Suisse. (2025). Available online: https://www.credit-suisse.com/corporate/en/research/research-institute/global-wealth-report.html (accessed on 25 February 2025).
- Goskomstat. (n.d.). State committee for statistics. Available online: www.gks.ru (accessed on 25 February 2025).
- Jomo, K. S., & Popov, V. (2016). Income inequalities in perspective. Development, 58(2), 196–205. Available online: https://link.springer.com/article/10.1057/s41301-016-0019-z (accessed on 25 February 2025).
- Lakner, C., & Milanovic, B. (2013). Global income distribution: From the fall of the Berlin Wall to the Great Recession (report). Policy Research Working Papers. Available online: https://papers.ssrn.com/sol3/papers.cfm?abstract_id=2366598 (accessed on 25 February 2025).
- Lieven, A. (2012). America right or wrong: An anatomy of American nationalism. OUP. [Google Scholar]
- Lindert, P., & Williamson, J. (2016). Unequal gains: American growth and inequality since 1700. Princeton University Press. [Google Scholar]
- Maddison Project. (2020). Maddison project database 2020. Releases | Groningen Growth and Development Centre | University of Groningen (rug.nl). Available online: https://www.rug.nl/ggdc/historicaldevelopment/maddison/releases/maddison-project-database-2020?lang=en (accessed on 25 February 2025).
- Milanovic, B. (2011). The haves and have-nots: A brief and idiosyncratic history of global inequality. Basic Books. [Google Scholar]
- Milanovic, B. (2012, November 9–10). Does economic inequality set limits to EU expansion? [Conference session]. Conference on Sovereign Insolvency, Opatija, Croatia. [Google Scholar]
- Milanovic, B., Lindert, P. H., & Williamson, J. G. (2007). Measuring ancient inequality (World Bank Policy Research Working Paper No. WPS 4412). World Bank. [Google Scholar]
- Milanovic, B., Lindert, P. H., & Williamson, J. G. (2011). Pre-Industrial Inequality. The Economic Journal, 121, 255–272. [Google Scholar] [CrossRef]
- Novokmet, F., Piketty, T., Yang, L., & Zucman, G. (2018). From communism to capitalism: Private versus public property and inequality in China and Russia. AEA Papers and Proceedings, 108, 109–113. [Google Scholar] [CrossRef]
- Oliver, T. (2016, July 21). Brexit survey results. BREXIT, DAHRENDORF NEWS. Available online: http://www.dahrendorf-forum.eu/brexit_survey_results/ (accessed on 25 February 2025).
- Phillips, K. (2002). Wealth and democracy: A political history of the American rich. Broadway Books. [Google Scholar]
- Piketty, T. (2014). Capital in the twenty-first century. Harvard University Press. [Google Scholar]
- Piketty, T., & Sandel, M. (2025, January 18). Two of the world’s leading thinkers on how the left went astray. New York Times. Available online: https://www.nytimes.com/2025/01/18/opinion/piketty-sandel-liberals-open-borders.html (accessed on 25 February 2025).
- Polterovich, V., & Popov, V. (2005). Appropriate economic policies at different stages of development. NES. Available online: https://mpra.ub.uni-muenchen.de/20066/ (accessed on 25 February 2025).
- Popov, V. (2000). Shock therapy versus gradualism: The end of the debate (explaining the magnitude of the transformational recession). Comparative Economic Studies, 42(1), 1–57. Available online: http://www.nes.ru/%7Evpopov/documents/TR-REC-full.pdf (accessed on 25 February 2025). [CrossRef]
- Popov, V. (2014a). Mixed fortunes: An economic history of china, russia and the west. Oxford University Press. [Google Scholar]
- Popov, V. (2014b, March). Socialism is dead, long live socialism! MPRA Paper No. 54294. Available online: https://mpra.ub.uni-muenchen.de/54294/1/MPRA_paper_54294.pdf (accessed on 25 February 2025).
- Popov, V. (2022, November 27). Brexit: Four charts to explain why did Britain make the decision to leave the EU. SSRN paper. Available online: https://papers.ssrn.com/sol3/papers.cfm?abstract_id=4287060 (accessed on 25 February 2025).
- Popov, V. (2023, July). Can China maintain high growth rates under the “dual circulation” decoupling? MPRA paper No. 117953. Available online: https://mpra.ub.uni-muenchen.de/117953/ (accessed on 25 February 2025).
- Popov, V., & Jomo, K. S. (2018). Are developing countries catching up? Cambridge Journal of Economics, 42(1), 33–46. [Google Scholar] [CrossRef]
- Rodrik, D. (2024, May 10). Don’t fret about green subsidies. Project Syndicate. Available online: https://www.project-syndicate.org/commentary/green-subsidies-justified-on-economic-environmental-and-moral-grounds-by-dani-rodrik-2024-05 (accessed on 25 February 2025).
- Russian Public Opinion Research Center (VTSIOM). (2025). Available online: http://wciom.ru/index.php?id=459&uid=114812 (accessed on 25 February 2025).
- Soltow, L. (1989). Distribution of wealth and income in the United States in 1798. University of Pittsburgh Press. [Google Scholar]
- WDI (World Inequality Database). (n.d.). Available online: https://wid.world/world/#sptinc_p90p100_z/US;FR;DE;CN;ZA;GB;WO/last/eu/k/p/yearly/s/false/24.722500000000004/80/curve/false/country (accessed on 25 February 2025).
- World Development Indicators Database. (n.d.). Available online: http://data.worldbank.org/data-catalog/world-development-indicators (accessed on 25 February 2025).
- World Values Survey. (2025). Available online: http://www.worldvaluessurvey.org/wvs.jsp (accessed on 25 February 2025).
- World Wealth and Income Database. (2025). Available online: http://www.wid.world/#Database (accessed on 25 February 2025).


| Years | 14 | 1000 | 1290 | 1550 | 1700 | 1750 | 1800 | 2000 |
|---|---|---|---|---|---|---|---|---|
| Rome | 39 | |||||||
| Byzantine | 41 | |||||||
| Holland | 56 | 63 | 57 | 30.9 | ||||
| England | 36.7 | 55.6 | 52.2 | 59.3 | 37.4 | |||
| Old Castille/Spain | 52.5 | 34.7 | ||||||
| Kingdom of Naples/Italy | 28.1 | 35.9 | ||||||
| France | 55 | 33 |
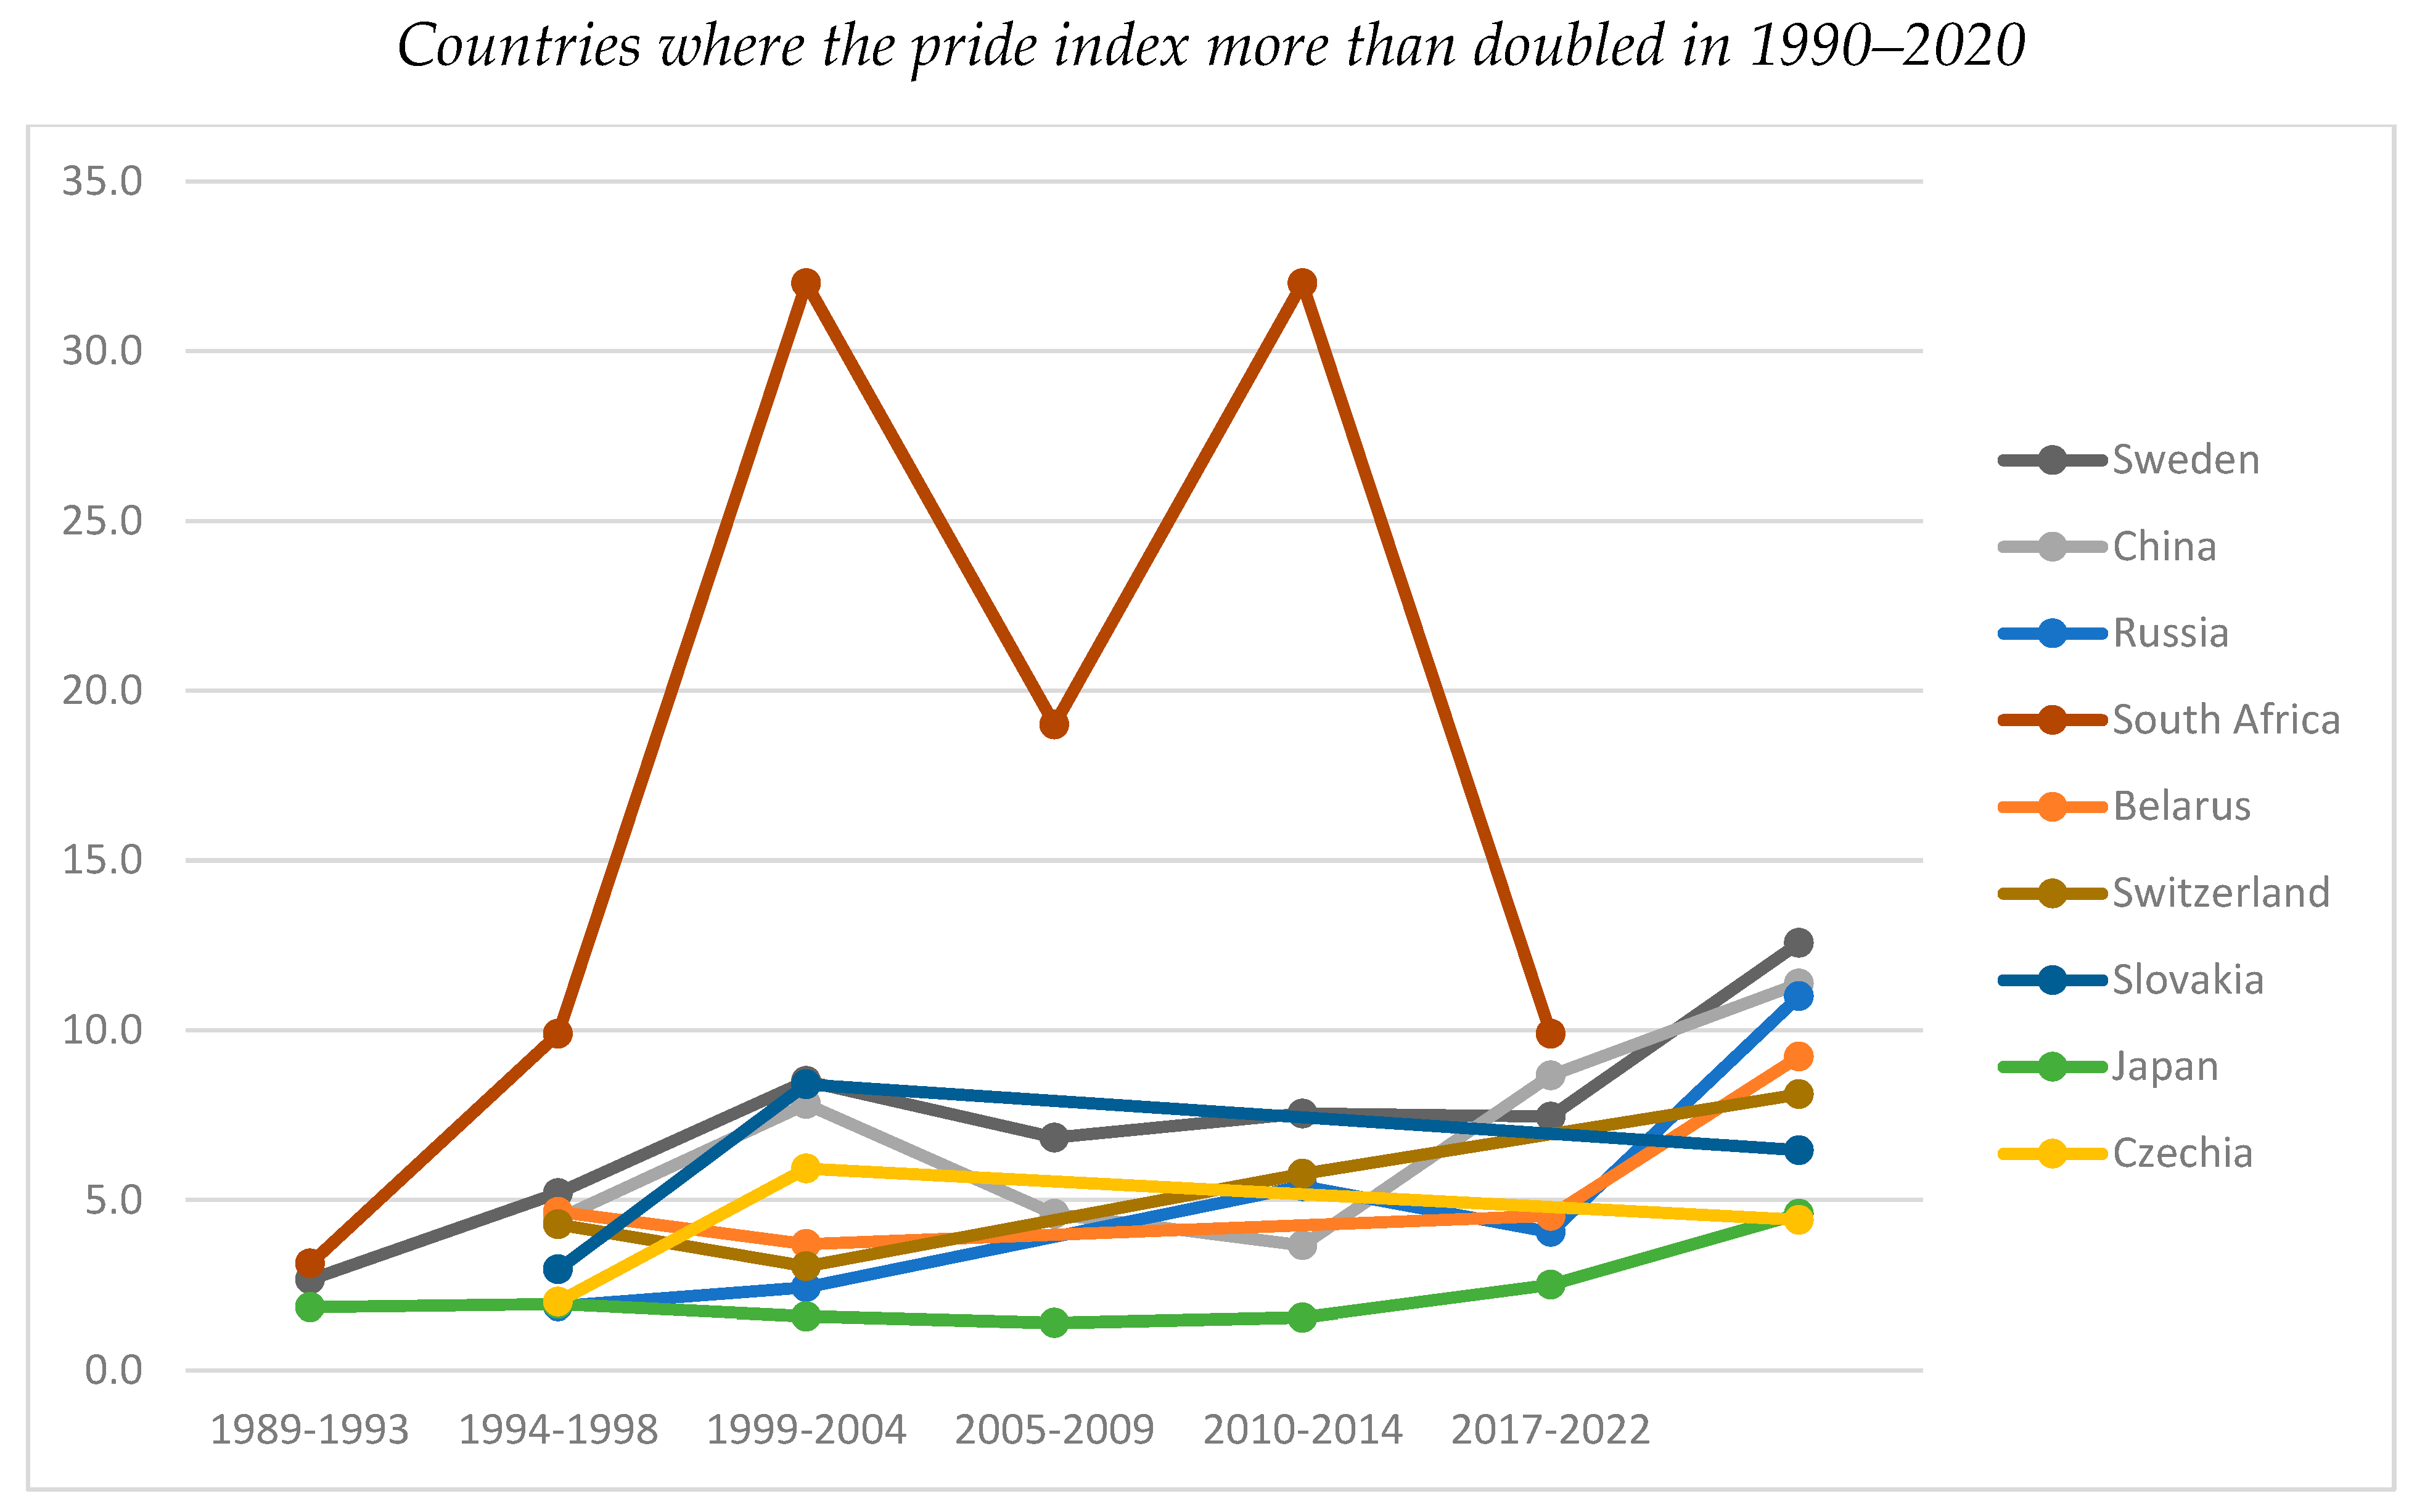
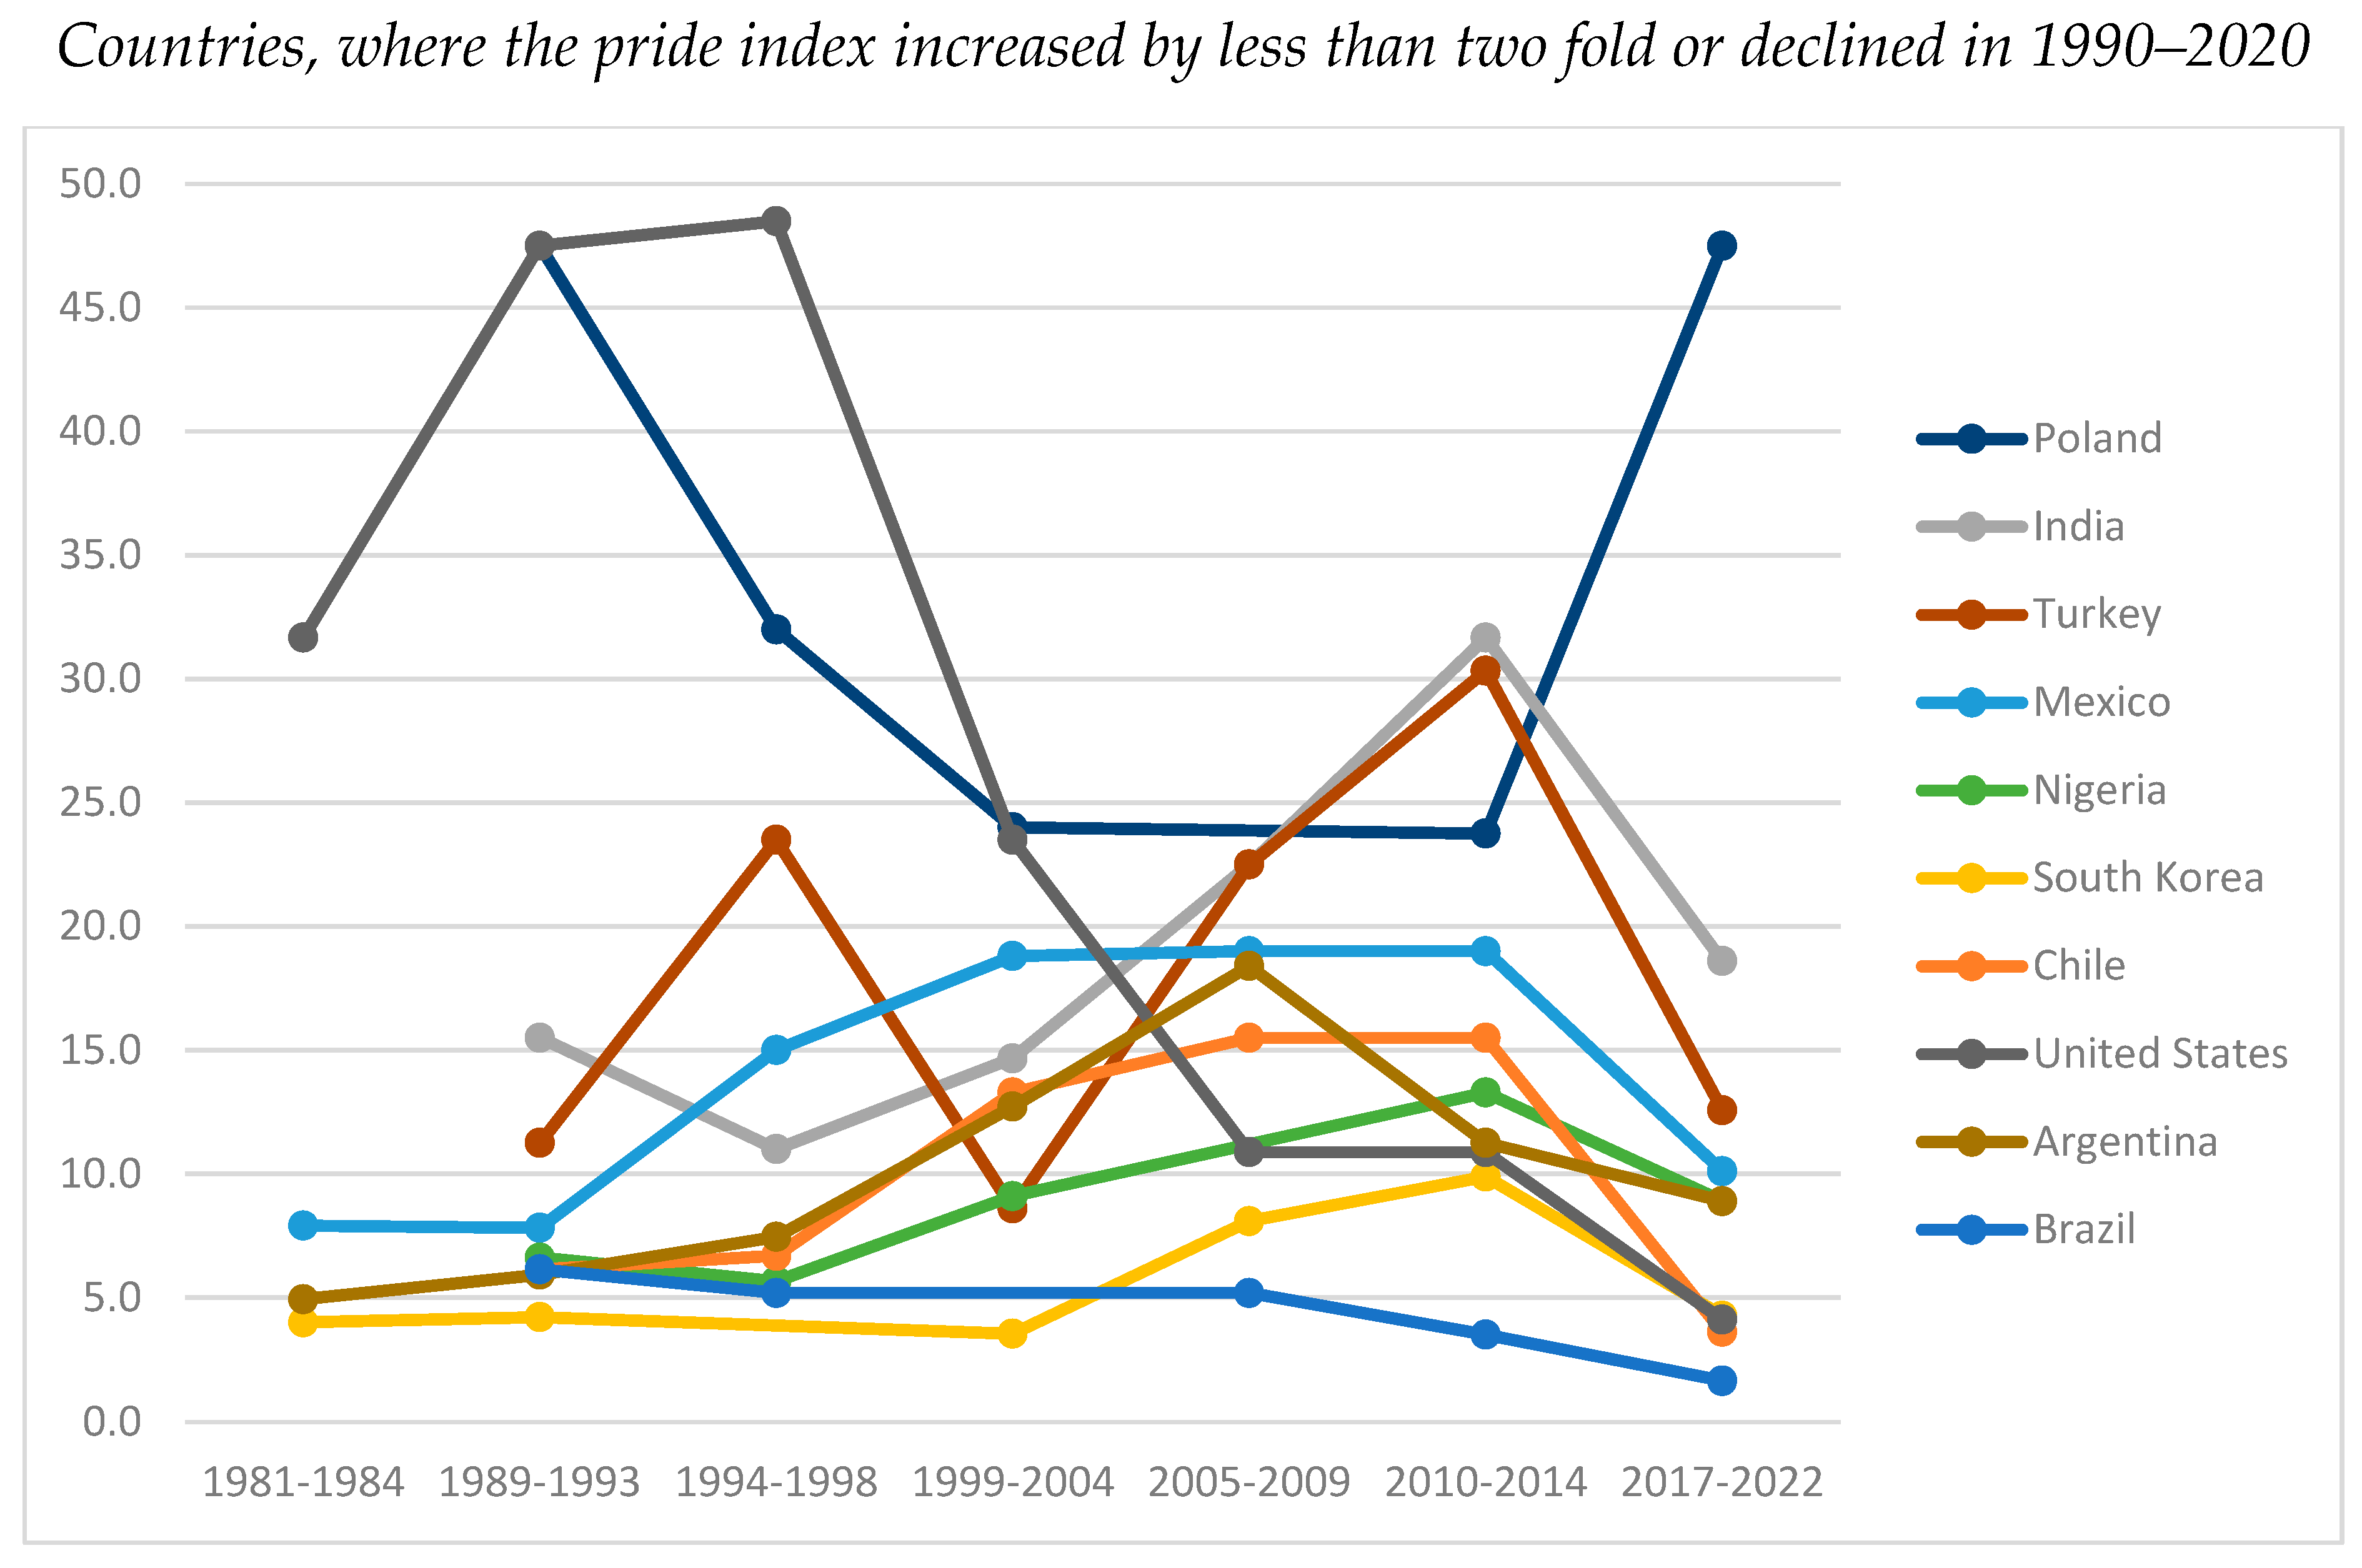
| COUNTRY/PERIOD | Pride Index in Periods of 7 Rounds of World Value Survey | Pride Index in 2020 as a Fraction of 1990 | ||||||
|---|---|---|---|---|---|---|---|---|
| 1981–1984 | 1989–1993 | 1994–1998 | 1999–2004 | 2005–2009 | 2010–2014 | 2017–2022 | ||
| Argentina | 4.9 | 5.9 | 7.5 | 12.7 | 18.4 | 11.3 | 8.9 | 1.5 |
| Brazil | 6.1 | 5.2 | 5.2 | 3.5 | 1.6 | 0.3 | ||
| Belarus | 4.6 | 3.7 | 4.5 | 9.2 | 2.0 | |||
| Chile | 6.1 | 6.7 | 13.3 | 15.5 | 15.5 | 3.6 | 0.6 | |
| China | 4.4 | 7.8 | 4.6 | 3.7 | 8.7 | 11.4 | 2.6 | |
| Czechia | 2.0 | 5.9 | 4.4 | 2.2 | ||||
| India | 15.5 | 11.0 | 14.7 | 22.5 | 31.7 | 18.6 | 1.2 | |
| Japan | 1.8 | 1.9 | 1.6 | 1.4 | 1.5 | 2.5 | 4.6 | 2.4 |
| South Korea | 4.0 | 4.2 | 3.5 | 8.1 | 9.9 | 4.3 | 1.0 | |
| Mexico | 7.9 | 7.8 | 15.0 | 18.8 | 19.0 | 19.0 | 10.1 | 1.3 |
| Nigeria | 6.6 | 5.7 | 9.1 | 13.3 | 8.9 | 1.3 | ||
| Poland | 47.5 | 32.0 | 24.0 | 23.8 | 47.5 | 1.0 | ||
| Russia | 1.9 | 2.4 | 5.4 | 4.1 | 11.0 | 5.9 | ||
| Slovakia | 3.0 | 8.4 | 6.5 | 2.2 | ||||
| South Africa | 3.1 | 9.9 | 32.0 | 19.0 | 32.0 | 9.9 | ||
| Sweden | 2.7 | 5.2 | 8.5 | 6.8 | 7.5 | 7.5 | 12.6 | 2.4 |
| Switzerland | 4.3 | 3.0 | 5.8 | 8.1 | 1.9 | |||
| Turkey | 11.3 | 23.5 | 8.6 | 22.5 | 30.3 | 12.6 | 1.1 | |
| United States | 31.7 | 47.5 | 48.5 | 23.5 | 10.9 | 10.9 | 4.1 | 0.1 |
| Equations/Variables | 1, N = 18 | 2, N = 18 | 3, N = 18 | 4, N = 18 | 5, N = 18 | 6, N = 18 | 7, N = 18 | 8, N = 18 |
|---|---|---|---|---|---|---|---|---|
| Pride1990—level of pride index in 1990 | −0.04 *** | −0.03 *** | −0.03 *** | −0.03 *** | −0.03 *** | |||
| GDPcap1990—GDP per capita in constant 2015 USDs in 1990 | 8.0 × 10⁻⁶ | 6.0 × 10⁻⁶ | 9.9 × 10⁻⁶ * | |||||
| GDPcapINCR—increase in per capita GDP in 1990–2020, times | 0.04 ** | 0.06 * | 0.08 *** | |||||
| GINI2000—Gini coefficient in 2000 or nearest year, % | −0.07 *** | −0.06 *** | −0.06 *** | −0.06 ** | −0.06 *** | −0.06 *** | −0.06 *** | −0.06 *** |
| Russia—Russia dummy variable | 4.4 *** | 4.5 *** | 4.1 *** | 4.2 *** | 4.2 *** | 4.3 *** | ||
| Constant | 4.0 *** | 4.3 *** | 3.7 *** | 3.3 *** | 3.9 *** | 3.8 *** | 3.7 *** | 3.4 *** |
| R2 | 15 | 32 | 59 | 84 | 90 | 90 | 91 | 93 |
Disclaimer/Publisher’s Note: The statements, opinions and data contained in all publications are solely those of the individual author(s) and contributor(s) and not of MDPI and/or the editor(s). MDPI and/or the editor(s) disclaim responsibility for any injury to people or property resulting from any ideas, methods, instructions or products referred to in the content. |
© 2025 by the author. Licensee MDPI, Basel, Switzerland. This article is an open access article distributed under the terms and conditions of the Creative Commons Attribution (CC BY) license (https://creativecommons.org/licenses/by/4.0/).
Share and Cite
Popov, V. Is Globalization Coming to an End Due to the Rise in Income Inequality? J. Risk Financial Manag. 2025, 18, 138. https://doi.org/10.3390/jrfm18030138
Popov V. Is Globalization Coming to an End Due to the Rise in Income Inequality? Journal of Risk and Financial Management. 2025; 18(3):138. https://doi.org/10.3390/jrfm18030138
Chicago/Turabian StylePopov, Vladimir. 2025. "Is Globalization Coming to an End Due to the Rise in Income Inequality?" Journal of Risk and Financial Management 18, no. 3: 138. https://doi.org/10.3390/jrfm18030138
APA StylePopov, V. (2025). Is Globalization Coming to an End Due to the Rise in Income Inequality? Journal of Risk and Financial Management, 18(3), 138. https://doi.org/10.3390/jrfm18030138