Abstract
Using a unique multi-wave dataset from nationally representative surveys in Portugal (2015, 2020, and 2023), this study extends the household finance literature by examining the mechanisms linking financial literacy to capital market participation. We propose and test a moderated mediation framework, arguing that the relationship is channeled through the mediating roles of financial resilience and self-efficacy and is contingent upon sociodemographic moderators. Our findings reveal a decline in average financial knowledge between 2015 and 2020/23, with persistent gaps across socioeconomic groups. Empirical results from count, logit, and ordered logit models provide strong evidence for partial mediation; financial literacy significantly enhances a household’s financial resilience, which in turn is a strong positive predictor of participation in stocks, bonds, and mutual funds. Furthermore, we find that perceived financial knowledge is a more powerful direct driver of participation than objective knowledge. Crucially, these pathways are powerfully moderated by income and education, highlighting that socioeconomic status is a fundamental boundary condition for converting knowledge into investment behavior. The results challenge simplistic direct-effects models and suggest that policy initiatives aimed at boosting market participation, such as the Portuguese National Plan for Financial Education, must look beyond knowledge dissemination to also foster financial resilience, self-efficacy, and address structural inequalities.
1. Introduction
Household financial decision-making—encompassing saving, borrowing, investing, and consumption—is a cornerstone of microeconomic well-being and a critical driver of macroeconomic resilience and capital market depth (e.g., Campbell, 2006; Lusardi & Mitchell, 2014; Agarwal et al., 2020). Within this framework, financial literacy has emerged as a pivotal determinant, with a robust body of literature affirming its positive association with prudent financial management, wealth accumulation, and the ability to withstand economic shocks (e.g., Klapper et al., 2015; Klapper & Lusardi, 2020; Erdem & Rojahn, 2022). A particularly well-established finding is the positive correlation between financial literacy and stock market participation, often explained by the argument that literacy lowers the fixed costs of participating, both informational and procedural (van Rooij et al., 2011; Christelis et al., 2010).
Yet, a persistent empirical puzzle endures, particularly in many European economies: despite documented improvements in financial knowledge, participation rates in securities markets often remain subdued (e.g., Kaustia et al., 2023; Oehler & Horn, 2023). This suggests that the relationship between literacy and complex financial behaviors is not merely direct but is filtered through a complex web of mediating and moderating variables. The Portuguese context exemplifies this puzzle. Data from the National Council of Financial Supervisors (CNSF) reveals a decline in average financial knowledge between 2015 and 2020/2023, yet direct participation in stocks, bonds, or mutual fund markets also fell significantly. This dual decline challenges simplistic knowledge-deficit models and calls for a more nuanced framework that explains how and for whom financial literacy translates into investment behavior.
This study addresses this gap by hypothesizing and testing an integrated moderated mediation framework. We posit that financial literacy must first empower households to build a buffer against shocks—enhancing their financial resilience—which in turn creates the capacity to engage in financial risk-taking (e.g., Hubar et al., 2020; Liu et al., 2025). Furthermore, drawing on social cognitive theory, we argue that perceived financial knowledge (self-efficacy) constitutes a potent psychological pathway that may operate alongside objective knowledge. Finally, we contend that these pathways are not uniform but are critically contingent upon sociodemographic characteristics, which act as key boundary conditions for converting knowledge and resilience into action.
While the individual pathways in our framework—between literacy, resilience, and participation—have been explored in the literature, our study’s primary conceptual contribution lies in empirically validating and theoretically refining this integrated moderated mediation model within a critical, non-Anglo-Saxon context. The Portuguese setting, characterized by its lower financial literacy, weaker social safety nets, and recent history of economic crises, serves as a stringent test of the theory’s generalizability. Our findings do not merely replicate; they clarify and advance the discourse in two keyways. First, we demonstrate that the resilience-mediated pathway is not a secondary channel but a fundamental prerequisite for risk-taking in an environment of heightened economic vulnerability, thereby strengthening the theoretical primacy of the Behavioral Life-Cycle Hypothesis in such contexts. Second, we provide robust, multi-wave evidence that socioeconomic status acts not just as a moderator of the direct literacy–participation link, but as a systemic gatekeeper that governs the entire journey from knowledge to security to investment. This underscores that in economies with higher structural inequality, policy efforts focused solely on literacy are inherently limited. Thus, our contribution transcends the Portuguese case by offering a validated model and a critical policy warning that the pathway to broadening market participation is universally mediated by resilience and powerfully moderated by structural access, a nuance that is most starkly visible—and most critical to address—outside of affluent, financially developed markets.
The remainder of this article is structured as follows. Section 2 presents a comprehensive literature review and develops the conceptual framework. Section 3 formalizes the research hypotheses. Section 4 details the data and empirical methodology. Section 5 reports the empirical results. Finally, Section 6 concludes by summarizing the key insights, outlining policy implications, and suggesting avenues for future research.
2. Literature Review
2.1. Theoretical Foundations of Household Financial Behavior
The study of household finance sits at the intersection of microeconomic theory and behavioral science. Foundational consumption theories—Keynes’ absolute income hypothesis, Modigliani and Brumberg’s life-cycle hypothesis, and Friedman’s permanent income hypothesis—provide the bedrock for understanding intertemporal choice, suggesting that rational, forward-looking households smooth consumption over their lifetimes. In a neoclassical paradigm, households are modelled as optimizing agents who allocate resources to maximize expected utility in an environment of known risks (e.g., Gollier, 2002; Campbell, 2006).
However, empirical evidence consistently reveals systematic deviations from these idealized models. Household financial decision-making is characterized by unique frictions: exposure to non-hedgeable labor income risk, holdings of illiquid assets (such as housing), and significant constraints on borrowing (e.g., Cocco et al., 2005; Gomes et al., 2021).
Moreover, decisions are frequently made under conditions of incomplete information, limited cognitive capacity, and pervasive behavioral biases, leading to ‘satisficing’ outcomes rather than optimal ones (e.g., Simon, 1997; Lusardi & Mitchell, 2014; Hsu et al., 2021; Barrafrem et al., 2024). These departures from full rationality underscore the critical role of psychological factors and, centrally, financial literacy—the ability to understand and use financial concepts—in shaping real-world financial outcomes.
2.2. Theoretical Foundations: Financial Literacy, Resilience, and the Capacity for Risk-Taking
Financial literacy is a cornerstone of sound financial decision-making, enabling individuals to plan for retirement, accumulate wealth, and manage debt effectively (Lusardi & Mitchell, 2014, 2023). A critical, more recent line of inquiry focuses on its role in building financial resilience—the capacity to anticipate, withstand, and recover from financial shocks (Klapper & Lusardi, 2020; Liu et al., 2025). To theoretically ground the mechanism linking literacy to resilience and, subsequently, to risk-taking, we draw upon the Behavioral Life-Cycle Hypothesis (BLC) (Shefrin & Thaler, 1988).
The BLC augments the standard neoclassical life-cycle model by incorporating key psychological biases. It posits that individuals do not treat wealth as fungible but instead utilize mental accounting, partitioning assets into non-fungible categories such as current income, savings, and future wealth. The marginal propensity to consume is highest from the current income account and lowest from future wealth. This framework provides a powerful explanation for how financial literacy operates: literate individuals are better equipped to establish and adhere to self-imposed mental accounting rules that prioritize the creation of a liquid emergency fund (the “savings” or “future wealth” account). This act of mentally labeling and protecting funds is a self-control heuristic that mitigates the temptation for immediate consumption, thereby directly facilitating the accumulation of the financial buffer that defines resilience (Hasler et al., 2017). Thus, the BLC theorizes that the journey from knowledge to resilience is mediated by the behavioral implementation of mental budgets and self-control strategies.
However, the formation of the intention to build resilience and participate in markets is a separate psychological process. Here, the Theory of Planned Behavior (TPB) (Ajzen, 1991) offers a complementary micro-level framework. The TPB posits that intention—the immediate antecedent of behavior—is shaped by three factors: (1) Attitude toward the behavior, (2) Subjective norms, and (3) Perceived Behavioral Control (PBC).
In our context: (i) attitude is influenced by financial literacy as individuals with higher knowledge are likely to have more positive beliefs about the outcomes of saving and investing; (ii) subjective norms capture the social pressure from peers, family, or advisors to engage in prudent financial behavior; (iii) crucially, Perceived Behavioral Control is an individual’s confidence in their ability to perform the behavior, which is conceptually aligned with self-efficacy or perceived financial knowledge. PBC is not merely confidence: it reflects the perceived presence of requisite resources and opportunities.
The TPB thus provides a formal psychological structure for our hypothesized pathways. Financial literacy likely shapes a positive attitude towards building resilience and investing. Simultaneously, high perceived knowledge (a key component of PBC) may have a direct motivating effect on intention, potentially explaining why it emerges as a powerful direct predictor of participation, independent of objective skill. Furthermore, socioeconomic status (income, education) directly enhances actual and perceived behavioral control by providing the necessary material resources and access, thereby moderating the intention-behavior link.
In synthesis, the BLC explains the behavioral architecture of how literacy translates into the tangible outcome of resilience (through mental accounting and self-control), while the TPB explains the psychological process of intention formation that drives both resilience-building and market participation (through attitudes, norms, and perceived control). This integrated theoretical perspective provides a robust foundation for our moderated mediation model, where literacy operates through a BLC-driven resilience pathway and a TPB-driven intentional pathway, both of which are contingent upon the resources that enable perceived and actual behavioral control.
2.3. The Participation Puzzle: Beyond a Direct Link to Capital Markets
The positive correlation between financial literacy and stock market participation is one of the most robust findings in household finance (e.g., van Rooij et al., 2011, 2012). The conventional explanation is that literacy lowers the fixed costs of participation, both informational (understanding diversification, equity risk) and procedural (navigating brokerage platforms) (Christelis et al., 2010).
Yet, a direct-effects model is increasingly seen as insufficient. In Portugal, for instance, the recent rise in financial literacy has not yielded proportional growth in retail investment. This suggests the existence of mediating and moderating variables. Firstly, the pathway is likely mediated by psychological factors like self-efficacy (e.g., Grable et al., 2008) and, as we theorize, by the material buffer provided by financial resilience. A household may understand the benefits of equities but will refrain from investing if it lacks the capacity to absorb potential short-term losses.
Secondly, the relationship is critically moderated by structural and sociodemographic factors. High income and wealth mitigate liquidity constraints, enabling the literate to act on their knowledge (e.g., Bianchi, 2018).
Similarly, institutional access—such as availability of low-cost investment platforms—can strengthen the literacy–participation link by reducing procedural barriers (e.g., Grohmann, 2018). Factors like geographic region and town size may also proxy for access to financial infrastructure and networks, further conditioning this relationship (e.g., Ndou, 2023).
This leads us to propose an integrated moderated mediation framework. We hypothesize that financial literacy fosters market participation primarily through the mechanism of enhanced financial resilience, and that this indirect pathway is not uniform but is significantly stronger for households with higher socioeconomic status and more favorable geographic contexts.
2.4. Synthesis: Towards an Integrated Framework of Literacy, Resilience, and Socioeconomic Context
The reviewed literature, now underpinned by the BLC and TPB, sets the stage for our integrated moderated mediation framework. The core proposition is that financial literacy fosters market participation through two primary channels: (1) a BLC-grounded mechanism where literacy enables the mental accounting and self-control necessary to build financial resilience, which in turn creates the capacity for risk-taking; (2) a TPB-grounded pathway where literacy and confidence (perceived behavioral control) directly strengthen the intention to participate.
The hypothesis that financial resilience acts as a mediator provides a crucial explanatory mechanism for the often observed but imperfect direct link (van Rooij et al., 2011). This aligns with the BLC’s sequential logic: literacy must first empower households to build a buffer against shocks before they can engage in discretionary risk-taking. The potential for perceived knowledge to operate as a parallel psychological pathway is directly explained by the TPB, where PBC is a primary driver of behavioral intention.
Instrumentally, this framework must account for effect heterogeneity. The literature strongly suggests that socioeconomic status (income, education) powerfully moderates these pathways. This affirms the “floor effect” (Bianchi, 2018), where structural resource constraints prevent the conversion of knowledge and intention into action. Higher SES not only facilitates knowledge acquisition but also provides the liquidity (enhancing actual behavioral control) and institutional access that enable households to act. This interplay between knowledge, psychological factors (attitudes, PBC), and structural enablers is captured by our integrated BLC-TPB perspective, which posits that the entire process from literacy to participation is profoundly shaped by a household’s capacity to exercise behavioral control.
2.5. Conceptual Framework
Guided by the synthesized literature, this study proposes a moderated mediation framework to dissect the mechanisms linking financial literacy to capital market participation. The framework integrates insights from human capital theory (Becker, 1993), social cognitive theory (Bandura, 1997), and institutional theory (North, 1990) to explain how financial literacy operates through a mediating mechanism and for whom this process is most effective. It moves beyond a direct-effects model by positing that the relationship is channeled through financial resilience and is contingent upon key sociodemographic boundary conditions. The conceptual model is depicted in Figure 1.
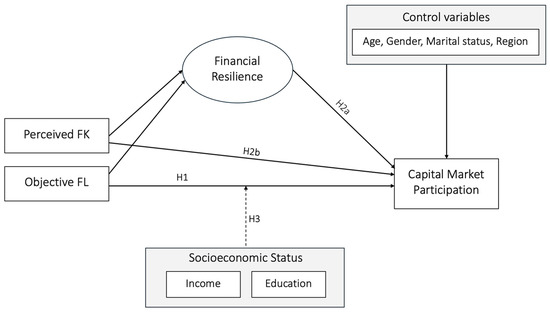
Figure 1.
Moderated Mediation Model of Financial Literacy and Market Participation.
The framework formalizes the following structural relationships:
(i) The Mediated Pathway (H2a): We posit that financial literacy (FL) fosters market participation not only directly but also indirectly by enhancing a household’s financial resilience (Paths a → b). Drawing from the adaptive expectations and bounded rationality literature, we argue that FL provides the foundational knowledge for households to build a financial buffer against shocks (Klapper & Lusardi, 2020). This resilience, in turn, creates the necessary psychological and material security to engage in financial risk-taking (Liu et al., 2025), thereby acting as a critical mediator.
(ii) The Direct Effects and the Role of Self-Efficacy (H1 & H2b): The model specifies a direct effect of FL on participation (Path c). Consistent with human capital theory, objective knowledge (FL_O) is expected to lower informational barriers (van Rooij et al., 2011). Simultaneously, integrating social cognitive theory, we hypothesize that perceived knowledge (FL_P)—a proxy for financial self-efficacy—constitutes a distinct and potent psychological pathway, potentially exerting a stronger direct influence on behavior than objective knowledge alone (H2b).
(iii) The Moderating Role of Socioeconomic Context (H3): Crucially, the framework proposes that the direct literacy–participation link (Path c) is not universal but is moderated by socioeconomic status (Path d). Informed by institutional theory, we contend that structural enablers like income and education are fundamental boundary conditions (Bianchi, 2018; Grohmann, 2018). Higher socioeconomic status mitigates liquidity constraints and enhances access, thereby strengthening the ability of households to act upon their financial knowledge.
3. Hypotheses
Guided by the theoretical framework above, this study develops and tests a set of hypotheses to dissect the channels linking financial literacy to capital market participation in Portugal.
H1.
Financial literacy has a positive direct effect on household participation in capital markets.
Grounded in human capital theory (Becker, 1993), this hypothesis asserts that knowledge reduces informational asymmetries and lowers the perceived costs of engaging with complex financial instruments. Financially knowledgeable households are better equipped to assess risk-return trade-offs and are therefore more likely to participate in securities markets, consistent with prior evidence (e.g., van Rooij et al., 2011).
H2a.
Financial resilience mediates (i.e., strengthens) the positive relationship between financial literacy and capital market participation.
We posit that a significant portion of the effect of knowledge on risk-taking is channeled through the building of a financial buffer. Financially literate households are more likely to accumulate liquid savings for emergencies (Klapper & Lusardi, 2020). This resilience, in turn, creates a safety net that enables them to tolerate the volatility of risky investments.
H2b.
Perceived financial knowledge is a stronger direct predictor of capital market participation than objective financial knowledge.
Drawing on social cognitive theory (Bandura, 1997), we hypothesize that a psychological pathway operates. Confidence in one’s ability to make sound financial decisions (perceived knowledge/self-efficacy) is crucial for the concrete action of market participation, particularly in the face of complexity and uncertainty, and may outweigh the effect of objective knowledge alone.
H3.
Sociodemographic characteristics (income, education) moderate the strength of the direct relationship between financial literacy and participation (H1), such that the effect is stronger for households with higher socioeconomic status.
Informed by institutional theory (North, 1990), this hypothesis states that the capacity to convert knowledge into market participation is not uniform. Structural enablers and constraints critically condition this process. Higher income provides the necessary liquidity, while higher education may enhance access to financial information. Therefore, we expect the direct effect of literacy on participation to be more pronounced among affluent and highly educated households (Bianchi, 2018; Grohmann, 2018).
These hypotheses are tested using the robust, multi-wave dataset and the empirical strategy detailed in the following section.
4. Methodology
4.1. Data Sources and Sample
This study employs a unique, multi-wave dataset constructed by pooling three nationally representative surveys: the Financial Literacy of the Portuguese Population surveys conducted in 2015, 2020, and 2023. These surveys were commissioned by the National Council of Financial Supervisors (CNSF)—comprising the Portuguese Central Bank (Banco de Portugal), the Portuguese Securities Market Commission (CMVM), and the Portuguese Insurance and Pension Funds Supervisory Authority (ASF)—under the aegis of the Portuguese National Plan for Financial Education (PNFF).
The surveys targeted the resident population of Portugal aged 16 years or older, including the autonomous regions of Açores and Madeira.1 A stratified random sampling method was employed to ensure representativeness across key demographic dimensions, including gender, age, geographic location, employment status, and education level. The fieldwork for the 2015, 2020, and 2023 waves resulted in 1100, 1502, and 1510 completed face-to-face interviews, respectively, yielding a final pooled sample of 4112 observations (Banco de Portugal, 2016, 2021, 2024). A parsimonious characterization of the sample is presented in Table A1 (Appendix C).
To maintain consistency across waves, our analysis is restricted to questions and variables that are identical in all three survey editions. This approach ensures the comparability and integrity of the longitudinal dataset.
4.2. Variable Construction
4.2.1. Dependent Variables
- Financial Resilience: Following Estrada-Mejia et al. (2023), this variable is constructed from the survey question: “If you lost your main source of income, how long could you continue to cover your living expenses, without borrowing any money or moving house?” Responses are coded as an ordinal variable: 1 (less than a week), 2 (at least a week, but less than a month), 3 (at least a month, but less than 3 months), 4 (at least 3 months, but less than 6 months), and 5 (more than 6 months).
- Capital Market Participation: A binary dependent variable is created, equal to 1 if the respondent reported having investments in stocks, bonds, or mutual funds at the time of the survey, and 0 otherwise.
4.2.2. Independent and Mediating Variables
- Financial Literacy (Objective): An objective financial knowledge score is computed based on nine financial literacy questions common to all three waves (see Appendix A). The score reflects the total number of correct answers per respondent. ‘Refused to answer’ and ‘Don’t know’ responses are treated as incorrect. For multivariate analysis, this continuous measure is also categorized into terciles (Low, Average, High) to capture potential non-linear effects.2
- Financial Literacy (Perceived): Subjective financial knowledge is measured using respondents’ self-assessment of their financial knowledge level. This variable is used to analyze the gap between perceived and objective knowledge and is included in some model specifications.
- Financial Self-Efficacy: While the core analysis focuses on financial resilience as the primary mediator, the conceptual framework acknowledges the role of self-efficacy. Operationalization is derived from the confidence variable, calculated as the difference between perceived and objective knowledge categories (Abreu & Mendes, 2012). Respondents are classified as overconfident (positive difference), unbiased (zero difference), or underconfident (negative difference) (see Table A2, Table A3 and Table A4, in Appendix C).
4.2.3. Moderating and Control Variables
A comprehensive set of control variables, derived from the survey, is included to account for potential confounding factors. These include:
(i) Sociodemographic Characteristics: Age (and its square to capture non-linear life-cycle effects), gender (Female = 1), marital status (Married = 1), education level (university degree dummy: Schooling_high = 1), employment status (active in the labour force dummy: Occupation_active = 1), and household income level (categorized as High, Average, or Low).
(ii) Household Context: Geographic region of residence (dummies for Alentejo, Algarve, Center, Lisbon, North, with the islands of Açores and Madeira as the baseline) and town size (Big, Middle, with Small as the baseline).
(iii) Survey Wave Dummies: Dummy variables for the 2020 and 2023 survey waves, with 2015 as the reference category, to account for temporal effects and aggregate shocks.
This paper employs established survey-based measures for its core constructs, yet certain definitional limitations must be acknowledged. Our key variables—financial literacy as a score of correct answers, resilience as the perceived duration of financial autonomy, and market participation as a binary indicator—are necessarily parsimonious. The literacy metric captures foundational knowledge but not the nuanced application of that knowledge in financial behaviors. Similarly, the resilience measure reflects a household’s perceived buffer, which may differ from its actual liquid wealth, and the participation variable captures entry but not the sophistication or scale of investments. Consequently, our results should be interpreted as robustly demonstrating the existence and significance of the theorized pathways between these foundational constructs, rather than explaining the full granularity of financial decision-making. The strength and consistency of the relationships we uncover validate this approach, confirming that these core measures, despite their inherent simplification, tap into fundamental and powerfully interconnected economic and psychological realities.
4.3. Empirical Strategy
To test the hypotheses outlined in Section 3, we employ a multi-stage empirical approach.
4.3.1. Preliminary and Descriptive Analysis
Prior to testing the multivariate hypotheses, we conduct a preliminary descriptive analysis to characterize the core variables and their bivariate relationships. This analysis begins with the foundational construct of financial literacy. Table 1, Table 2 and Table 3 and the accompanying discussion detail the distribution and evolution of correct answers to the financial literacy questions over time and across key sociodemographic groups. This establishes the context for the Portuguese case and highlights the initial disparities that the multivariate models will later explore in a causal framework.

Table 1.
Percentage of correct answers (%).
Table 2.
Correct answers, by wave.
Table 3.
Average number of correct answers.
4.3.2. Testing the Mediated Pathways (H1, H2a, H2b)
Our core analysis investigates the direct and indirect effects linking financial literacy to market participation. Given the binary nature of the participation variable and the ordinal nature of resilience, we estimate a series of regression models.
First, to examine the antecedent of the mediation pathway, we model the determinants of financial resilience using an ordered logit model, as specified below:
where encompasses both objective and perceived financial literacy measures.
The use of an ordered logit model for the mediator is a statistically appropriate method for establishing the first leg (Path a) of the mediation pathway when the mediator is an ordinal variable, as it provides unbiased estimates of the effect of the independent variable on the propensity to be in a higher category of the mediator.
Second, we model the probability of capital market participation using a binary logit model:
where is the logistic cumulative distribution function, is financial literacy, and is the vector of control variables.
To test for mediation (H2a), we adopt a causal steps approach (Baron & Kenny, 1986). Evidence of mediation is established if: (i) financial literacy significantly affects participation in a baseline model (H1); (ii) financial literacy significantly affects the proposed mediator, financial resilience; and (iii) the inclusion of financial resilience in the participation model attenuates the coefficient of financial literacy while resilience itself remains significant.
To test H2b regarding the relative power of perceived knowledge, we compare the coefficients and significance levels of objective and perceived financial literacy when both are included in the participation model. A substantial attenuation of the objective literacy coefficient alongside a strong, significant coefficient for perceived literacy would support H2b.
4.3.3. Testing the Moderated Relationships (H3)
Hypothesis H3 posits that sociodemographic conditions moderate the direct relationship between literacy and participation. To test this, we employ a moderated mediation analysis using the conditional process framework (Hayes, 2018). This involves testing for interaction effects between the independent variable (financial literacy) and the proposed moderators (e.g., income, education) in the participation equation. We estimate models with interaction terms to determine if the strength of the direct effect of literacy on participation is conditional on these sociodemographic factors.
5. Results
5.1. Descriptive Statistics and the Evolution of Financial Literacy
Our analysis begins by establishing the foundational context of financial literacy in Portugal across the three survey waves. The data reveals a concerning trajectory. As detailed in Table 1 and Table 2, the average percentage of correct answers fell sharply from 67.6% in 2015 to 55.2% in 2020, with only a partial recovery to 59.1% in 2023. This indicates a significant decline in objective financial knowledge among the Portuguese population during this period. Understanding compound interest (FL_JC) remained the most challenging topic, with correct answers plummeting to 19.7% in 2020 and recovering only marginally to 24.2% in 2023.
Multivariate analysis using a Negative Binomial count model (Table 4) corroborates these trends and identifies key sociodemographic correlates (see also Table 3). Controlling for a host of factors, we confirm that financial knowledge was significantly higher in the 2015 baseline (statistically significant and positive Year 2015 coefficient). Furthermore, higher levels of education (Schooling_high: coef. = 0.217, p < 0.01) and income (Income_high: coef. = 0.444, p < 0.01) are strongly associated with a greater number of correct answers, aligning with human capital and resource-based theories. A notable gender gap persists, with women scoring significantly lower than men (Female: coef. = −0.111, p < 0.01). Age exhibits a non-linear, inverted U-shaped relationship with financial knowledge, peaking around 47 years. Finaly, households in the omitted category (the Açores and Madeira islands) exhibit significantly lower financial knowledge, as indicated by the uniformly positive and statistically significant coefficients on all other regional dummy variables.
Table 4.
Financial knowledge and sociodemographic characteristics—count model.
5.2. The Mediating Role of Financial Resilience (H2a) and the Distinction from Overconfidence (H2b)
A core proposition of our theoretical framework is that financial literacy operates through the mechanism of financial resilience. The results from the ordered logit models in Table 5 provide strong support for the first leg of this mediated pathway (H2a), but not for the role of overconfidence as a proxy for self-efficacy in building resilience (H2b).
Table 5.
Financial resilience regressions—stacked sample.
We find that both objective and perceived financial literacy are potent predictors of financial resilience, in the sense that individuals with higher levels of objective and perceived knowledge could continue to cover their living expenses longer periods of time without borrowing any money or moving house if they lost their main source of income. In the full specification (Table 5, column [3]), which includes both literacy measures and interaction terms, the coefficients for high levels of objective literacy (FL—Objective—High: coef. = 0.599, p < 0.01) and perceived literacy (FL—Perceived—High: coef. = 1.098, p < 0.01) are positive, substantial, and statistically significant. Crucially, the magnitude of these coefficients increases with the level of knowledge, indicating that the marginal impact of literacy on resilience is greatest for the most knowledgeable and confident individuals. This finding confirms that financially literate households are better equipped to build the essential buffer that defines resilience.
However, when we include the overconfidence variable in column [4] of Table 5, its coefficient is positive but lacks statistical significance. This null finding is crucial for a nuanced interpretation of H2b. It clarifies a key distinction between two psychological constructs: financial self-efficacy (captured by high perceived knowledge) and overconfidence (the miscalibration between perceived and objective knowledge). Our results indicate that the beneficial psychological mechanism driving resilience is grounded in a general sense of confidence or self-efficacy, not in a biased overestimation of one’s abilities. In other words, it is “confident competence” that empowers households to build resilience, not “miscalibrated confidence.” This refines the interpretation of H2b, suggesting that the powerful direct effect of perceived knowledge on participation is likely driven by its motivational component as a proxy for self-efficacy, rather than by cognitive bias.
Furthermore, the interaction terms between income and objective financial literacy included in column [3] (e.g., income-high × FL-objective-high) were found to be statistically insignificant (as noted in the Table 5). This indicates that the process of converting financial knowledge into resilience is broadly similar across income groups. The “floor effect” (Bianchi, 2018) may not manifest in the building of resilience from knowledge, but rather in the subsequent step of converting that resilience into investment, as explored next.
Another interesting result is related to the statistically significant, positive, coefficients of the Year 2020 and Year 2023 dummy variables, meaning that financial resilience has increased from 2015 to 2023, even in the context of a sanitary crisis associated with the COVID-19 pandemic.
5.3. Direct and Mediated Effects on Market Participation (H1, H2a & H2b)
The binary logit models for capital market participation (Table 6) allow us to test the direct effect of literacy (H1) and the mediating role of resilience (H2a) and self-efficacy (H2b) simultaneously. The results reveal a nuanced picture that underscores the importance of both material and psychological channels.
Table 6.
Participation regressions—stacked sample.
Results in Table 6, column [2], establish a significant direct effect of high objective financial literacy on participation (FL—Objective—High: coef. = 0.822, p < 0.01), providing initial support for H1. One should also note the non-significant coefficient of the average objective financial knowledge variable, meaning that, compared with the baseline (low financial knowledge), only high financial knowledge is associated with higher probability of market participation. However, when perceived financial literacy is introduced in the model (Table 6, column [3]), its effect is overwhelmingly strong (FL—Perceived—High: coef. = 2.303, p < 0.01), while the coefficient for high objective literacy attenuates considerably (coef. = 0.385, p < 0.10). Thus, financial knowledge (both objective and perceived) is indeed positively associated with the existence of investments in stocks, bonds or mutual funds, and this association is stronger for higher levels of knowledge (particularly perceived). This suggests that confidence in one’s knowledge may be a more immediate driver of investment behavior than knowledge alone, echoing the concept of self-efficacy outlined in H2b.
Most critically, when financial resilience is added to the model in column [4], it exerts a significant positive influence on the likelihood of participation (Financial Resilience: coef. = 0.416, p < 0.01). The introduction of this mediator further attenuates the coefficient for high objective literacy, which becomes statistically insignificant. This pattern of results—where the significant effect of the independent variable (objective literacy) is reduced upon the inclusion of the mediator (resilience)—is consistent with partial mediation, thereby supporting H2a. Financially resilient households are significantly more likely to participate in capital markets, and resilience accounts for a part of the total effect of financial literacy.
The inclusion of the overconfident variable in the participation model (Table 6, column [4]) shows a non-significant coefficient, which contradicts some work in behavioral finance (e.g., Barber & Odean, 2001). This indicates that, unlike generalized self-efficacy (captured by perceived knowledge), the specific bias of overconfidence does not directly drive market participation. This nuanced finding suggests that the psychological channel supporting H2b is more about confident competence than about miscalibrated overconfidence.
A striking finding is the significant negative coefficient for the 2023 wave (Year 2023: coef. = −0.743, p < 0.01 in the final model), indicating a decline in market participation despite the slight recovery in financial knowledge and a reported increase in financial resilience (Table 5). This underscores the complexity of the participation puzzle, suggesting that other macroeconomic or institutional factors not captured in our models (such as the rise in interest rates, the evolution of stock markets or distrust in financial institutions) may have suppressed investment activity during this period.
5.4. The Moderating Role of Sociodemographics (H3)
Our results provide robust evidence for the moderating role of sociodemographic factors, as hypothesized in H3, particularly in the direct link between literacy and participation.
The significant interaction terms in the participation model (Table 6, column [3]) are highly informative. As noted, the interactions income-average × FL-objective-high and income-average × FL-objective-average are statistically significant. This reveals that the direct effect of objective financial literacy on the probability of market participation is not uniform; it is significantly stronger for households with average income compared to the baseline (low-income) group. This provides direct empirical support for H3, demonstrating that income acts as a key boundary condition, enabling households to act upon their financial knowledge.
This finding, combined with the strong, standalone positive coefficients for high income and education across all models (suggesting a positive association between income, education, and the existence of investments in stocks, bonds or mutual funds), demonstrates a dual role for socioeconomic status. Firstly, these resources are fundamental for acquiring financial knowledge (Table 4). Secondly, and crucially, they act as a powerful moderator of the literacy–participation link. Highly educated, high-income households are not only more knowledgeable but are also significantly better positioned to convert that knowledge directly into market participation. This aligns perfectly with our theoretical expectation that structural enablers critically condition the pathway from literacy to behavior (Bianchi, 2018; Grohmann, 2018).
In summary, the empirical evidence supports a complex, multi-stage process. Financial literacy fosters capital market participation both directly and indirectly by building financial resilience. Perceived knowledge is a powerful direct driver. However, this entire pathway is not universal; the direct effect of knowledge on participation is profoundly shaped by a household’s socioeconomic context, which facilitates or constrains the ability to act on knowledge. The journey from financial literacy to market participation is one that is paved not just with knowledge, but with resilience, confidence, and, crucially, the requisite socioeconomic resources.
6. Conclusions
This study set out to unravel the complex relationship between financial literacy and household participation in capital markets by proposing and testing a moderated mediation model in the context of Portugal. Leveraging a robust, multi-wave national survey, we move beyond the established direct correlation to illuminate the underlying mechanisms and boundary conditions.
Our empirical analysis yields several significant findings. First, we document significant changes in average financial knowledge in Portugal between 2015 and 2020/2023, with pronounced gaps across education, income, and gender. Second, we provide robust evidence that financial resilience acts as a partial mediator: both objective and perceived financial literacy significantly bolster a household’s ability to cover expenses after an income shock, and this resilience is a strong, positive predictor of market participation. Third, and crucially, we find that the effect of objective knowledge on participation is substantially attenuated when accounting for perceived knowledge, which emerges as a more powerful direct driver of investment behavior. Finally, our results consistently demonstrate that socioeconomic status (particularly income) powerfully moderates the direct link between literacy and participation, enabling knowledgeable households to actualize their potential for market investment. These findings suggest that effective policy must be multi-pronged, moving beyond knowledge dissemination to also actively foster financial resilience, build self-efficacy, and address underlying structural inequalities.
Our findings confirm that the pathway from knowledge to action is neither simple nor universal. We demonstrate that financial literacy’s influence on market participation is significantly channeled through the building of financial resilience. Literate households are better equipped to create a financial buffer, and this buffer, in turn, provides the security necessary to engage with risky assets. This identifies resilience not just as a desirable outcome but as a critical mediating mechanism in a household investment decision. Simultaneously, we find that perceived financial knowledge is an equally, if not more, powerful driver of participation than objective knowledge alone, underscoring the paramount role of behavioral factors and confidence.
However, these mechanisms are not equally accessible to all. The entire pathway is powerfully moderated by socioeconomic status. Higher income (especially) and education not only facilitate the acquisition of financial knowledge but also enable households to convert that knowledge directly into market participation. This finding highlights a potential vicious cycle where households with fewer resources are less able to act on their knowledge to access higher-return investments, potentially perpetuating wealth inequality.
These insights carry significant policy implications for Portugal’s National Plan for Financial Education (PNFF) and similar initiatives elsewhere. Our results suggest that effective policy must be multi-pronged. While improving financial knowledge remains important, it is likely insufficient on its own. Policies must also directly target the building of financial resilience, particularly among vulnerable groups, through programs that encourage emergency savings and prudent debt management. Furthermore, strategies to boost participation should address the psychological dimension by fostering accurate financial self-efficacy and must work to dismantle the structural barriers that limit access for lower-income and less-educated households.
This study is subject to several limitations that also chart a course for future research. Firstly, reliance on pooled cross-sectional data, while providing valuable snapshots, precludes definitive causal inferences. Future studies would benefit greatly from longitudinal panel data to trace the temporal dynamics of how financial literacy builds resilience and subsequently influences investment decisions over time. Secondly, our binary measure of market participation, though informative, does not capture the intensity (e.g., portfolio value, asset allocation) or quality (e.g., diversification, fee structures) of investments. A promising agenda lies in exploring how literacy and resilience relate to these nuanced aspects of portfolio sophistication. Thirdly, the model could be expanded to include the moderating role of digital financial access and the quality of financial advice, which are increasingly critical in the contemporary financial landscape. Investigating these digital and advisory channels would provide a more comprehensive understanding of the pathways to inclusive capital market participation. Finally, while this study has treated financial literacy as a holistic construct to establish the overarching moderated mediation pathway, our findings invite a more nuanced exploration. Recent methodological advances, particularly the decomposition of financial literacy into its core components—Knowledge, Behavior, and Attitude—and their non-linear aggregation (e.g., Martino & Ventre, 2023; Martino et al., 2025), suggest a promising direction for future research. A critical next step would be to investigate whether the mediation through financial resilience is primarily driven by cognitive knowledge, the practical application of that knowledge in financial behaviors, or the underlying attitudes towards planning and self-control. Disentangling these specific effects could reveal which component most powerfully activates the pathway to participation, thereby allowing for more targeted and effective policy and educational interventions.
In conclusion, the journey to deepening retail capital market participation is more complex than merely improving financial literacy. It requires building resilient households, fostering genuine confidence, and creating an inclusive financial ecosystem where knowledge can be translated into opportunity, regardless of a household’s starting point.
Author Contributions
Conceptualization, methodology, validation, formal analysis, investigation, resources, data curation, writing: M.A., V.M. and M.C.d.S. All authors have read and agreed to the published version of the manuscript.
Funding
This research was funded by FCT, I.P., the Portuguese national funding agency for science, research and technology, grant number UID/06522/2023 and Fundação para a Ciência e a Tecnologia, grant number UIDB/04007/2020.
Institutional Review Board Statement
Ethical review and approval were waived for this study since it relied exclusively on secondary data obtained from a third-party source. The dataset was anonymized before being made available to the authors, and all analyses were conducted on non-identifiable information.
Informed Consent Statement
Informed consent was waived because the study used anonymized secondary data collected by an independent institution. No direct contact with participants occurred, and the dataset contained no identifiable personal information.
Data Availability Statement
Restrictions apply to the availability of these data. Data were obtained from the Portuguese National Council of Financial Supervisors(CNSF) and are available at https://www.todoscontam.pt with the permission of CNSF.
Conflicts of Interest
The authors declare no conflict of interest. The views expressed are those of the author and do not necessarily reflect official positions of the CMVM.
Appendix A. Financial Knowledge Questions
- (FL_Div)—Imagine that 5 brothers are given a gift of 1000 euros in total. If the brothers have to share the money equally, how much does each one get? (A: 200 euros)
- (FL_Inf)—Now imagine that the brothers must wait for one year to get their share of the 1000 euros. If the inflation rate stays at 2%, in one year’s time will they be able to buy: (i) More than they could buy today; (ii) The same that they could buy today; (iii) Less than they could buy today.
- (FL_J25)—You lend 25 euros to a friend, and he gives you the 25 euros back the next day. How much interest has he paid on this loan? (A: 0 euros)
- (FL_Js)—Imagine that someone puts 100 euros into a savings account with an interest rate of 2% per year (assume that no fees or taxes apply). How much would be in the account at the end of the first year, once the interest payment is made? (A: 102 euros)
- (FL_Jc)—And how much would be in the account at the end of five years? (Assume that no fees or taxes are charged and that at the end of each year you leave the amount of interest in that same savings account): (i) More than 110 euros; (ii) Exactly 110 euros; (iii) Less than 110 euros; (iv) Impossible to tell from the information given.
- (FL_RiskRet)—Please tell me if the following statement is true or false: “An investment with a high return is likely to be high risk” (A: True)
- (FL_Diver)—Please tell me if the following statement is true or false: “It is usually possible to reduce the risk of investing in the stock market by buying a wide range of shares” (A: True)
- (FL_Over)—Please, look at the following statement of a current account.
| Current account—Bank statement on 20 April 20aa | € | ||
| Date | Description | Amount | Balance |
| Previous balance | 110.00 | ||
| 24-03-20aa | ATM withdrawal | −60.00 | 50.00 |
| 30-03-20aa | Salary transfer | 1200.00 | 1250.00 |
| 01-04-20aa | Transfer to a time deposit | −120.00 | 1130.00 |
| 02-04-20aa | Home loan instalment | −525.00 | 605.00 |
| 03-04-20aa | Mobile phone | −40.00 | 565.00 |
| 08-04-20aa | Supermarket | −210.00 | 355.00 |
| 12-04-20aa | Electricity | −60.00 | 295.00 |
| 13-04-20aa | Restaurant | −40.00 | 255.00 |
| 16-04-20aa | Bank check | −70.00 | 185.00 |
| 18-04-20aa | ATM withdrawal | −50.00 | 135.00 |
| 20-04-20aa | XPT petrol station | −35.00 | 100.00 |
| Available balance | 100.00 | ||
| Authorized balance | 1060.00 | ||
According to this statement, what is the balance of the current account that can be used on 20 April 20aa without resorting to a bank overdraft? (i) 110 euros; (ii) 100 euros; (iii) 1060 euros; (iv) 1160 euros.
- 9.
- (FL_OverSeg)—Suppose that on 21 April 20aa your car insurance of 250 euros will be debited. Does your account have sufficient balance to cover this payment? (i) No; (ii) Yes, but the account will be overdrawn by 150 euros; (iii) Yes, the account has enough money and there is no need to resort to an overdraft; (iv) Yes, but the account will be overdrawn by 250 euros.
(Correct answers in bold).
Appendix B. Definition of Variables
| Marital status—Married | Binary variable, equal to 1 if the respondent is married | |
| Age | Age of respondent, in years | |
| Occupation—Active | Binary variable, equal to 1 if the respondent is a worker (self-employed or employee) or unemployed but looking for work | |
| Income | ||
| High | Binary variable, equal to 1 if the household’s net monthly income is above 2500 € | |
| Average | Binary variable, equal to 1 if the household’s net monthly income is below 2500 €, but is higher than 1000 € | |
| Schooling—High | Binary variable, equal to 1 if the respondent concluded at least a university degree | |
| Gender—Female | Binary variable, equal to 1 if the respondent is a woman | |
| Financial Literacy (FL) | ||
| Objective | Number of correct answers to the FL questions | |
| Objective—High | Binary variable, equal to 1 if the number of correct answers to the 9 financial literacy questions is 7, 8 or 9 | |
| Objective—Average | Binary variable, equal to 1 if the number of correct answers to the 9 financial literacy questions is 4, 5 or 6 | |
| Perceived | Equal to 1, if the respondent indicates that his/her knowledge of subjects related to financial markets and products is well below the average for the Portuguese population; 2, if they indicate that it is below average; 3, if it is equal to the average; 4, if they indicate that it is above average; and 5, if they indicate that it is well above average | |
| Perceived—High | Binary variable, equal to 1 if FL Perceived > 3 | |
| Perceived—Average | Binary variable, equal to 1 if FL Perceived = 3 | |
| Year | ||
| 2015 | Binary variable, equal to 1 if the wave of the survey is 2015. | |
| 2020 | Binary variable, equal to 1 if the wave of the survey is 2020. | |
| 2023 | Binary variable, equal to 1 if the wave of the survey is 2023. | |
| Region | ||
| Alentejo | Binary variable, equal to 1 if the respondent lives in Alentejo | |
| Algarve | Binary variable, equal to 1 if the respondent lives in Algarve | |
| Center | Binary variable, equal to 1 if the respondent lives in the Center region | |
| Lisbon | Binary variable, equal to 1 if the respondent lives in the Lisbon region | |
| North | Binary variable, equal to 1 if the respondent lives in the North region | |
| Town | ||
| Big | Binary variable, equal to 1 if the respondent lives in a city with 100,000 or more inhabitants | |
| Middle | Binary variable, equal to 1 if the respondent lives in a town with more than 5000 but less than 100,000 inhabitants | |
| Participation | Binary variable, equal to 1 if the respondent has stocks, or bonds or mutual funds in the portfolio | |
| Financial resilience | Equal to 1 if the answer to the question “If you lost your main source of income, how long could you continue to cover your living expenses, without borrowing any money or moving house?” is “less than a week”; 2 is the answer is “at least a week, but less than a month”; 3 if the answer is “at least a month, but less than 3 months”; 4 if the answer is “at least 3 months, but less than 6 months”; and 5 if the answer is “more than 6 months” | |
| Number of correct answers | FL Objective | |
| Underconfident | Binary variable, equal to 1 if FL_Objective is higher than FL_Perceived | |
| Overconfident | Binary variable, equal to 1 if FL_Objective is lower than FL_Perceived | |
| Confidence | Equal to −1 if Underconfident = 1, 0 if Underconfident = 0 and Overconfident = 0, 1 if Overconfident = 1 | |
Appendix C. Additional Tables
Table A1.
Sample—Descriptive statistics.
Table A2.
Objective versus perceived knowledge.
Table A3.
Overconfidence and underconfidence.
Table A4.
Confidence—ordered logit model (stacked sample).
Notes
| 1 | A total of 4 surveys were conducted, in 2010, 2015, 2020 and 2023. The first survey is not used in this paper because the questions asked in 2010 are very different; the lack of a sufficient number of similar questions prevents us from using it. |
| 2 | In this paper, we use “financial literacy” and “financial knowledge” interchangeably. |
References
- Abreu, M., & Mendes, V. (2012). Information, overconfidence and trading: Do the sources of information matter? Journal of Economic Psychology, 33(4), 868–881. [Google Scholar] [CrossRef]
- Agarwal, S., Qian, W., & Tan, R. (2020). Household finance: A functional approach. Springer. [Google Scholar] [CrossRef]
- Ajzen, I. (1991). The theory of planned behavior. Organizational Behavior and Human Decision Processes, 50(2), 179–211. [Google Scholar] [CrossRef]
- Banco de Portugal. (2016). Inquérito à literacia financeira da população Portuguesa 2015: Relatório de resultados [Financial literacy survey of the Portuguese population 2015: Results report]. Banco de Portugal. Available online: https://clientebancario.bportugal.pt/pt-pt/publicacao/relatorio-do-inquerito-literacia-financeira-da-populacao-portuguesa-2015 (accessed on 22 September 2025).
- Banco de Portugal. (2021). Inquérito à literacia financeira da população Portuguesa 2020: Relatório de resultados [Financial literacy survey of the Portuguese population 2020: Results report]. Banco de Portugal. Available online: https://clientebancario.bportugal.pt/pt-pt/publicacao/relatorio-do-inquerito-literacia-financeira-da-populacao-portuguesa-2020 (accessed on 22 September 2025).
- Banco de Portugal. (2024). Inquérito à literacia financeira da população Portuguesa 2023: Relatório de resultados [Financial literacy survey of the Portuguese population 2023: Results report]. Banco de Portugal. Available online: https://clientebancario.bportugal.pt/pt-pt/publicacao/relatorio-do-inquerito-literacia-financeira-da-populacao-portuguesa-2023 (accessed on 22 September 2025).
- Bandura, A. (1997). Self-efficacy: The exercise of control. W. H. Freeman. [Google Scholar]
- Barber, B. M., & Odean, T. (2001). Boys will be boys: Gender, overconfidence, and common stock investment. Quarterly Journal of Economics, 116(1), 261–292. [Google Scholar] [CrossRef]
- Baron, R. M., & Kenny, D. A. (1986). The moderator–mediator variable distinction in social psychological research: Conceptual, strategic, and statistical considerations. Journal of Personality and Social Psychology, 51(6), 1173–1182. [Google Scholar] [CrossRef] [PubMed]
- Barrafrem, K., Tinghög, G., & Västfjäll, D. (2024). Behavioral and contextual determinants of different stages of saving behavior. Frontiers in Behavioral Economics, 3, 1381080. [Google Scholar] [CrossRef]
- Becker, G. S. (1993). Human capital: A theoretical and empirical analysis with special reference to education (3rd ed.). University of Chicago Press. [Google Scholar]
- Bianchi, M. (2018). Financial literacy and portfolio dynamics. The Journal of Finance, 73(2), 831–859. [Google Scholar] [CrossRef]
- Campbell, J. Y. (2006). Household finance. The Journal of Finance, 61(4), 1553–1604. [Google Scholar] [CrossRef]
- Christelis, D., Jappelli, T., & Padula, M. (2010). Cognitive abilities and portfolio choice. European Economic Review, 54(1), 18–38. [Google Scholar] [CrossRef]
- Cocco, J. F., Gomes, F. J., & Maenhout, P. J. (2005). Consumption and portfolio choice over the life cycle. The Review of Financial Studies, 18(2), 491–533. [Google Scholar] [CrossRef]
- Erdem, D., & Rojahn, J. (2022). The influence of financial literacy on financial resilience: New evidence from Europe during the COVID-19 crisis. Managerial Finance, 48(9/10), 1453–1471. [Google Scholar] [CrossRef]
- Estrada-Mejia, C., Mejía, D., & Córdoba, P. (2023). Financial literacy and financial wellbeing: Evidence from Peru and Uruguay. Journal of Financial Literacy and Wellbeing, 1, 403–429. [Google Scholar] [CrossRef]
- Gollier, C. (2002). What does classical theory have to say about household portfolios? In L. Guiso, M. Haliassos, & T. Jappelli (Eds.), Household portfolios (pp. 27–54). MIT Press. [Google Scholar]
- Gomes, F., Haliassos, M., & Ramadorai, T. (2021). Household Finance. Journal of Economic Literature, 59(3), 919–1000. [Google Scholar] [CrossRef]
- Grable, J. E., Britt, S. L., & Webb, F. J. (2008). Environmental and biopsychosocial profiling as a means for describing financial risk-taking behavior. Journal of Financial Counseling and Planning, 19(2), 3–18. Available online: https://fpperformancelab.org/wp-content/uploads/Environmental-and-Biopsychosocial-Profiling-as-a-Means-for-Describing-Financial-Risk-Taking-Behavior.pdf (accessed on 14 October 2025).
- Grohmann, A. (2018). Financial literacy and financial behavior: Evidence from the emerging Asian middle class. Pacific-Basin Finance Journal, 48, 129–143. [Google Scholar] [CrossRef]
- Hasler, A., Lusardi, A., & Oggero, N. (2017). Financial fragility in the US: Evidence and implications. In R. Gupta, A. Hasler, A. Lusardi, & N. Oggero (Eds.), FINAL REPORT—Financial fragility in the US: Evidence and implications. Global Financial Literacy Excellence Center, The George Washington University School of Business. Available online: https://www.nefe.org/_images/research/Financial-Fragility/Financial-Fragility-Final-Report.pdf (accessed on 22 September 2025).
- Hayes, A. F. (2018). Introduction to mediation, moderation, and conditional process analysis: A regression-based approach (2nd ed.). Guilford Press. [Google Scholar]
- Hsu, Y.-L., Chen, H.-L., Huang, P.-K., & Lin, W.-Y. (2021). Does financial literacy mitigate gender differences in investment behavioral bias? Finance Research Letters, 41, 101789. [Google Scholar] [CrossRef]
- Hubar, S., Koulovatianos, C., & Li, J. (2020). The role of labor-income risk in household risk-taking. European Economic Review, 129, 103522. [Google Scholar] [CrossRef]
- Kaustia, M., Conlin, A., & Luotonen, N. (2023). What drives stock market participation? The role of institutional, traditional, and behavioral factors. Journal of Banking & Finance, 148, 106743. [Google Scholar] [CrossRef]
- Klapper, L., & Lusardi, A. (2020). Financial literacy and financial resilience: Evidence from around the world. Financial Management, 49(3), 589–614. [Google Scholar] [CrossRef]
- Klapper, L., Lusardi, A., & Van Oudheusden, P. (2015). Financial literacy around the world. Standard & Poor’s Ratings Services Global Financial Literacy Survey. [Google Scholar]
- Liu, Z., Chen, J.-K., & Xiao, J. J. (2025). Financial resilience: A scoping review, conceptual synthesis and theoretical framework. International Journal of Bank Marketing, 43(7), 1541–1576. [Google Scholar] [CrossRef]
- Lusardi, A., & Mitchell, O. S. (2014). The economic importance of financial literacy: Theory and evidence. Journal of Economic Literature, 52(1), 5–44. [Google Scholar] [CrossRef] [PubMed]
- Lusardi, A., & Mitchell, O. S. (2023). The importance of financial literacy: Opening a new field. Journal of Economic Perspectives, 37(4), 137–154. [Google Scholar] [CrossRef]
- Martino, R., Muñoz Torrecillas, M. J., & Ventre, V. (2025). Discrete Choquet integral aggregation applied to intertemporal choices: Financial literacy components and gender in anomalies and uncertainty aversion. Quality & Quantity, 59(3), 2111–2128. [Google Scholar] [CrossRef]
- Martino, R., & Ventre, V. (2023). Analysis of aggregation between the components of financial literacy through inconsistency in intertemporal choices. Soft Computing, 1–10. [Google Scholar] [CrossRef]
- Ndou, A. (2023). The moderator effect of socioeconomic status on the relationship between parental financial teaching and financial literacy. International Journal of Applied Economics, Finance and Accounting, 17(2), 90–103. [Google Scholar] [CrossRef]
- North, D. C. (1990). Institutions, institutional change and economic performance. Cambridge University Press. [Google Scholar]
- Oehler, A., & Horn, M. (2023). Households’ decision on capital market participation: What are the drivers? A multi-factor contribution to the participation puzzle. Financial Services Review, 31(4), 283–305. [Google Scholar] [CrossRef]
- Shefrin, H. M., & Thaler, R. H. (1988). The behavioral life-cycle hypothesis. Economic Inquiry, 26(4), 609–643. [Google Scholar] [CrossRef]
- Simon, H. A. (1997). An empirically based microeconomics. Cambridge University Press. [Google Scholar]
- van Rooij, M., Lusardi, A., & Alessie, R. (2011). Financial literacy and stock market participation. Journal of Financial Economics, 101(2), 449–472. [Google Scholar] [CrossRef]
- van Rooij, M., Lusardi, A., & Alessie, R. (2012). Financial literacy, retirement planning and household wealth. The Economic Journal, 122(560), 449–478. [Google Scholar] [CrossRef]

Disclaimer/Publisher’s Note: The statements, opinions and data contained in all publications are solely those of the individual author(s) and contributor(s) and not of MDPI and/or the editor(s). MDPI and/or the editor(s) disclaim responsibility for any injury to people or property resulting from any ideas, methods, instructions or products referred to in the content. |
© 2025 by the authors. Licensee MDPI, Basel, Switzerland. This article is an open access article distributed under the terms and conditions of the Creative Commons Attribution (CC BY) license (https://creativecommons.org/licenses/by/4.0/).