The Impact of AI-Integrated ESG Reporting on Firm Valuation in Emerging Markets: A Multimodal Analytical Approach
Abstract
1. Introduction
2. Literature Review
2.1. Theoretical Review
2.2. Hypotheses Development
2.3. Research Gap
3. Data and Methods
3.1. Sample Selection
3.1.1. AI Integration Classification
AI-Integration Disclosures
AI-Integration NLP Scoring
AI-Integration Manual Coding
3.2. Variable Specifications
3.3. Natural Language Processing (NLP) Feature Extraction Framework
3.3.1. Topic Taxonomy
3.3.2. Textual Indexes
3.4. Predictive Analytics Framework
3.5. Econometric Model Specifications
- (A)
- Elastic Net (linear, sparse and stable)
- (B)
- XGBoost (nonlinear, interactions)
Model Comparison Evolution
- Coefficient of determination (Out-of-Sample):
- ii.
- Root Mean Squared Error:
- iii.
- Mean Absolute Error:
4. Empirical Results
4.1. Descriptive Analysis
4.2. Correlation Analysis
4.3. T-Tests Analysis
4.4. Baseline Regression Results
4.5. Robustness Tests
4.6. Model Evaluation of Predictive Analytics
4.6.1. Classification Tasks
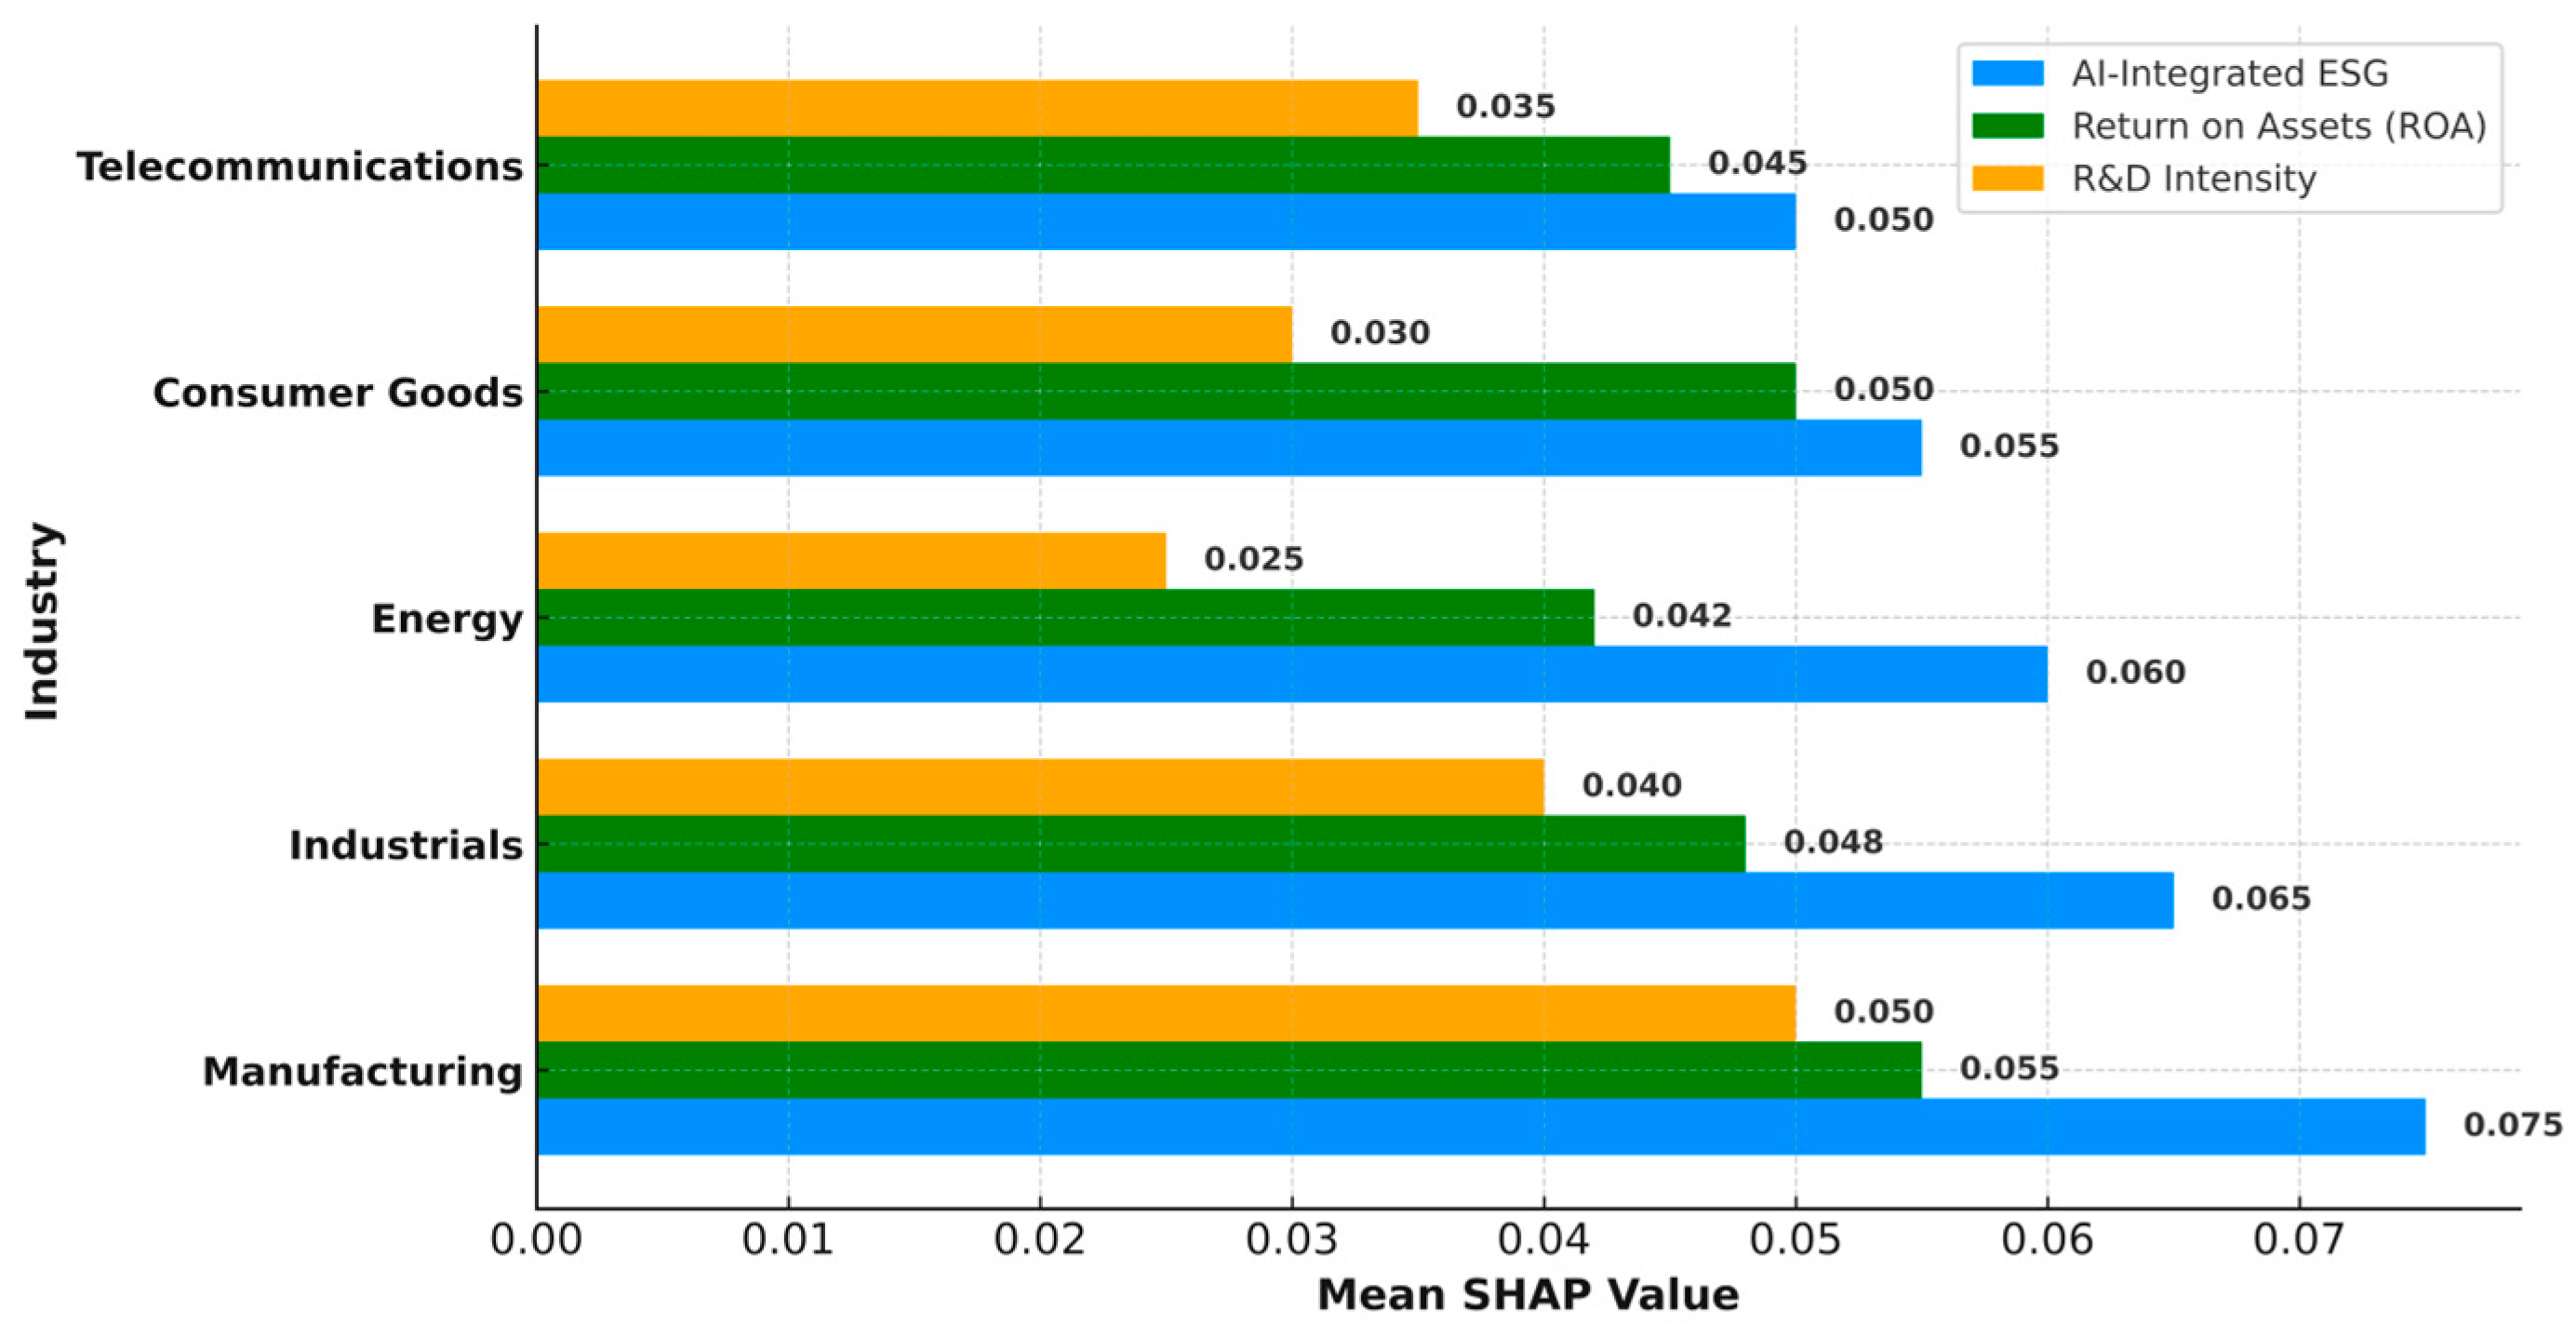
4.6.2. Feature Importance and Classification Performance
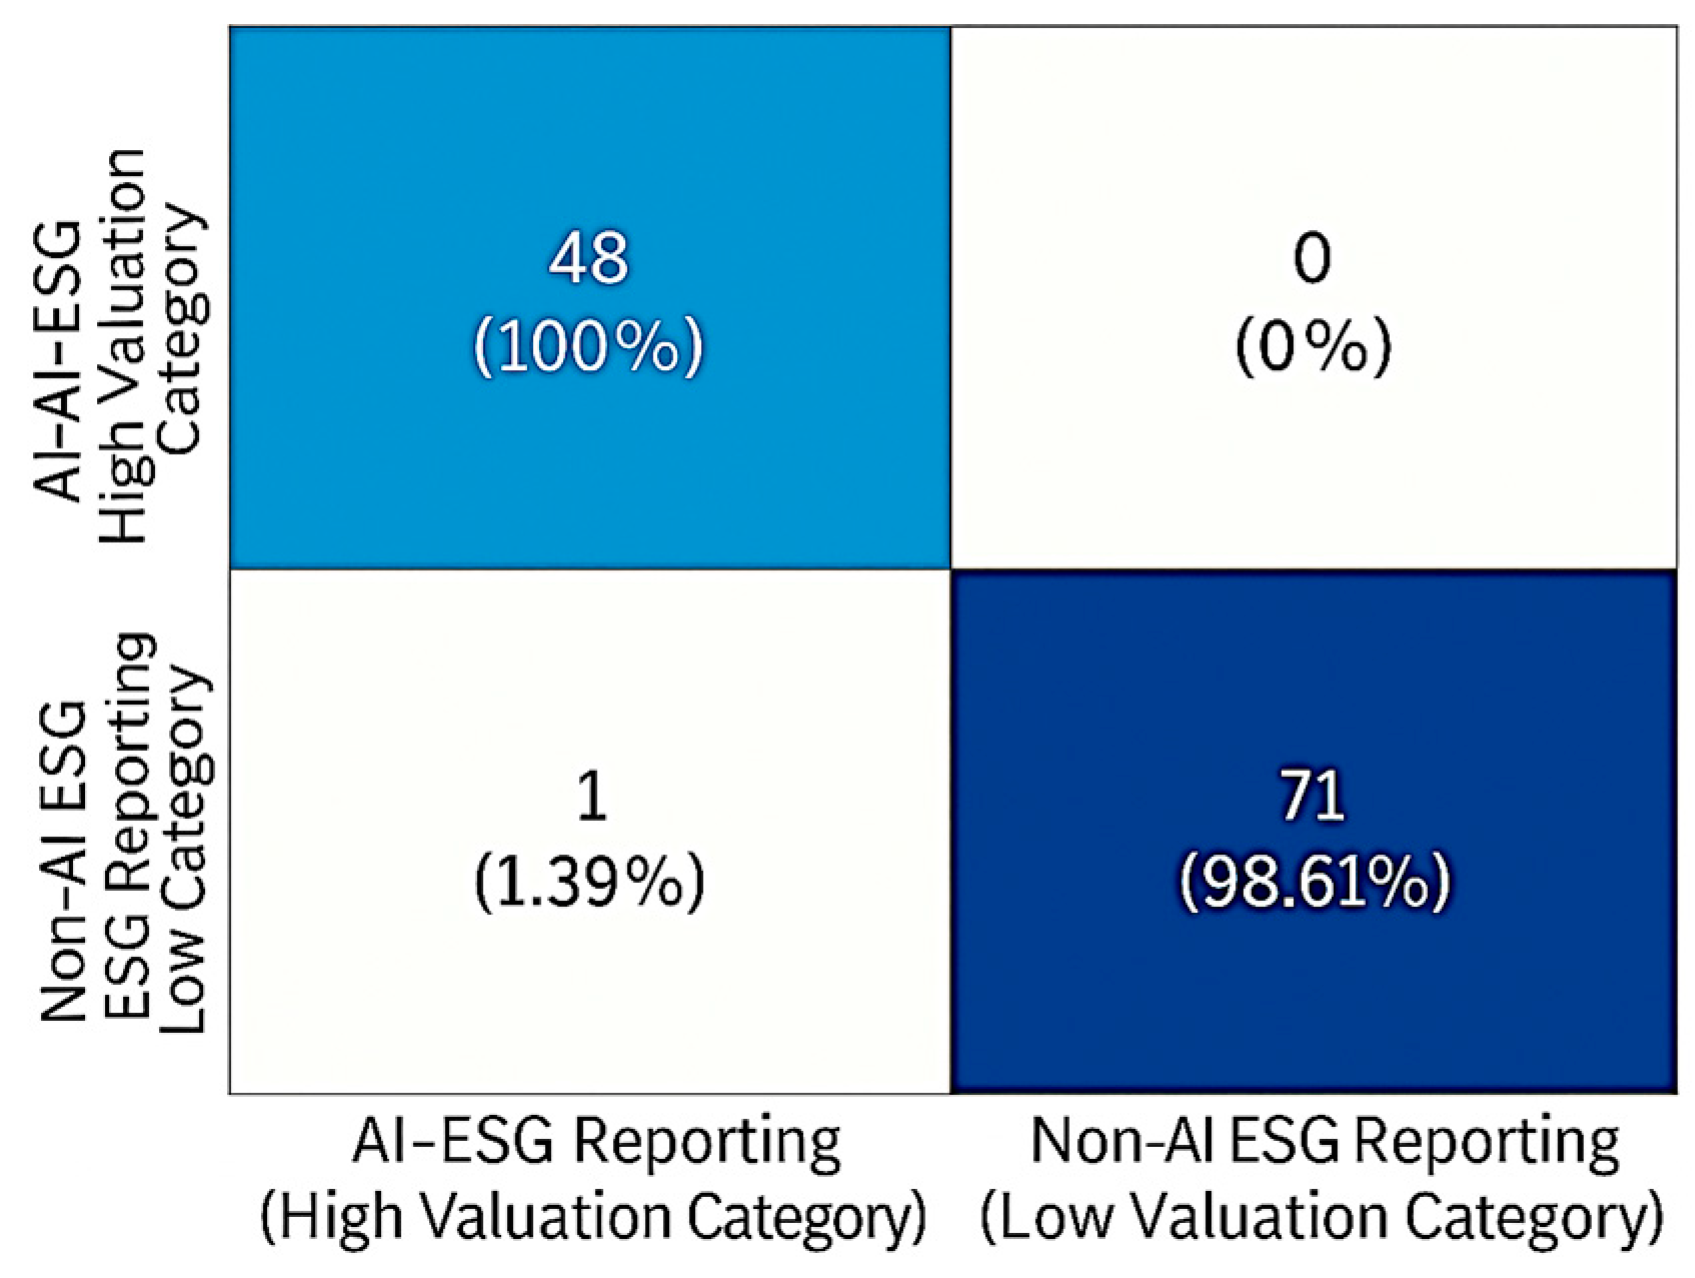
4.6.3. Confusion Analysis
5. Discussion of Findings
5.1. Theoretical Contributions
5.2. Managerial Implications
5.3. Policy Relevance
5.4. Limitations and Further Research
6. Conclusions
Author Contributions
Funding
Institutional Review Board Statement
Informed Consent Statement
Data Availability Statement
Conflicts of Interest
Abbreviations
| AI | Artificial Intelligence |
| AII | AI-Integrated |
| NAII | Non-AI Integrated |
| ESG | Environmental, Social, and Governance |
| ML | Machine Learning |
| NLP | Natural Language Processing |
| LDA | Latent Dirichlet Allocation |
| DTM-lite | Dynamic Topic Modeling (lite version) |
| OLS | Ordinary Least Squares |
| SVR | Support Vector Regression |
| RBV | Resource-Based View |
| ROA | Return on Assets |
| GDP | Gross Domestic Product |
| MAE | Mean Absolute Error |
| R2 | Coefficient of Determination |
| 2SLS | Two-Stage Least Squares |
| PSM | Propensity Score Matching |
| ATE | Average Treatment Effect |
| CSR | Corporate Social Responsibility |
| KPI | Key Performance Indicator |
| R&D | Research and Development |
Appendix A
| Component | Description | Score/Weight | Notes/Clarification |
|---|---|---|---|
| Scoring Scale | No Evidence/Not Mentioned | 0 | No public or internal indication of AI use in ESG processes |
| Exploratory Pilot/Initial Testing | 1 | Early-stage projects, R&D, or trials, but not consistent or formal | |
| Partial Use (<50% of ESG activities) | 2 | AI used in isolated ESG functions or internally only | |
| Broad Use (in multiple ESG operations or reports) | 3 | Integrated across several ESG tools or included in disclosures | |
| Strategic Integration (Core to ESG policy and reporting standards) | 4 | Institutionalized AI in ESG strategy, with clear visibility in external reporting | |
| Feature Weights | Machine Learning | 30% | Core for predictions, classification, and financial-environmental modeling |
| Natural Language Processing (NLP) | 20% | Crucial for text mining, sentiment analysis, and regulatory parsing | |
| Automated ESG Scoring Tools | 30% | Key for standardized benchmarking and investor communications | |
| AI-Driven Analytics | 20% | Useful for real-time ESG monitoring and dashboard reporting | |
| Scoring Formula | Normalized Weighted Score | – | |
| Integration Levels | Low | 0–30% | Little to no meaningful adoption |
| Moderate | 31–60% | Some integration but fragmented or informal | |
| Strong | 61–80% | High-functioning AI use, consistent across several ESG areas | |
| Advanced | 81–100% | AI is an embedded, strategic tool in ESG governance and disclosures |
| Year | Topic 0 | Topic 1 | Topic 2 |
|---|---|---|---|
| 2018 | 0.489626 | 0.187525 | 0.322849 |
| 2019 | 0.352826 | 0.211438 | 0.435736 |
| 2020 | 0.196337 | 0.481482 | 0.322182 |
| 2021 | 0.37969 | 0.138141 | 0.482169 |
| 2022 | 0.275539 | 0.29565 | 0.428811 |
| 2023 | 0.500339 | 0.344187 | 0.155474 |
| 2024 | 0.330911 | 0.303754 | 0.365335 |
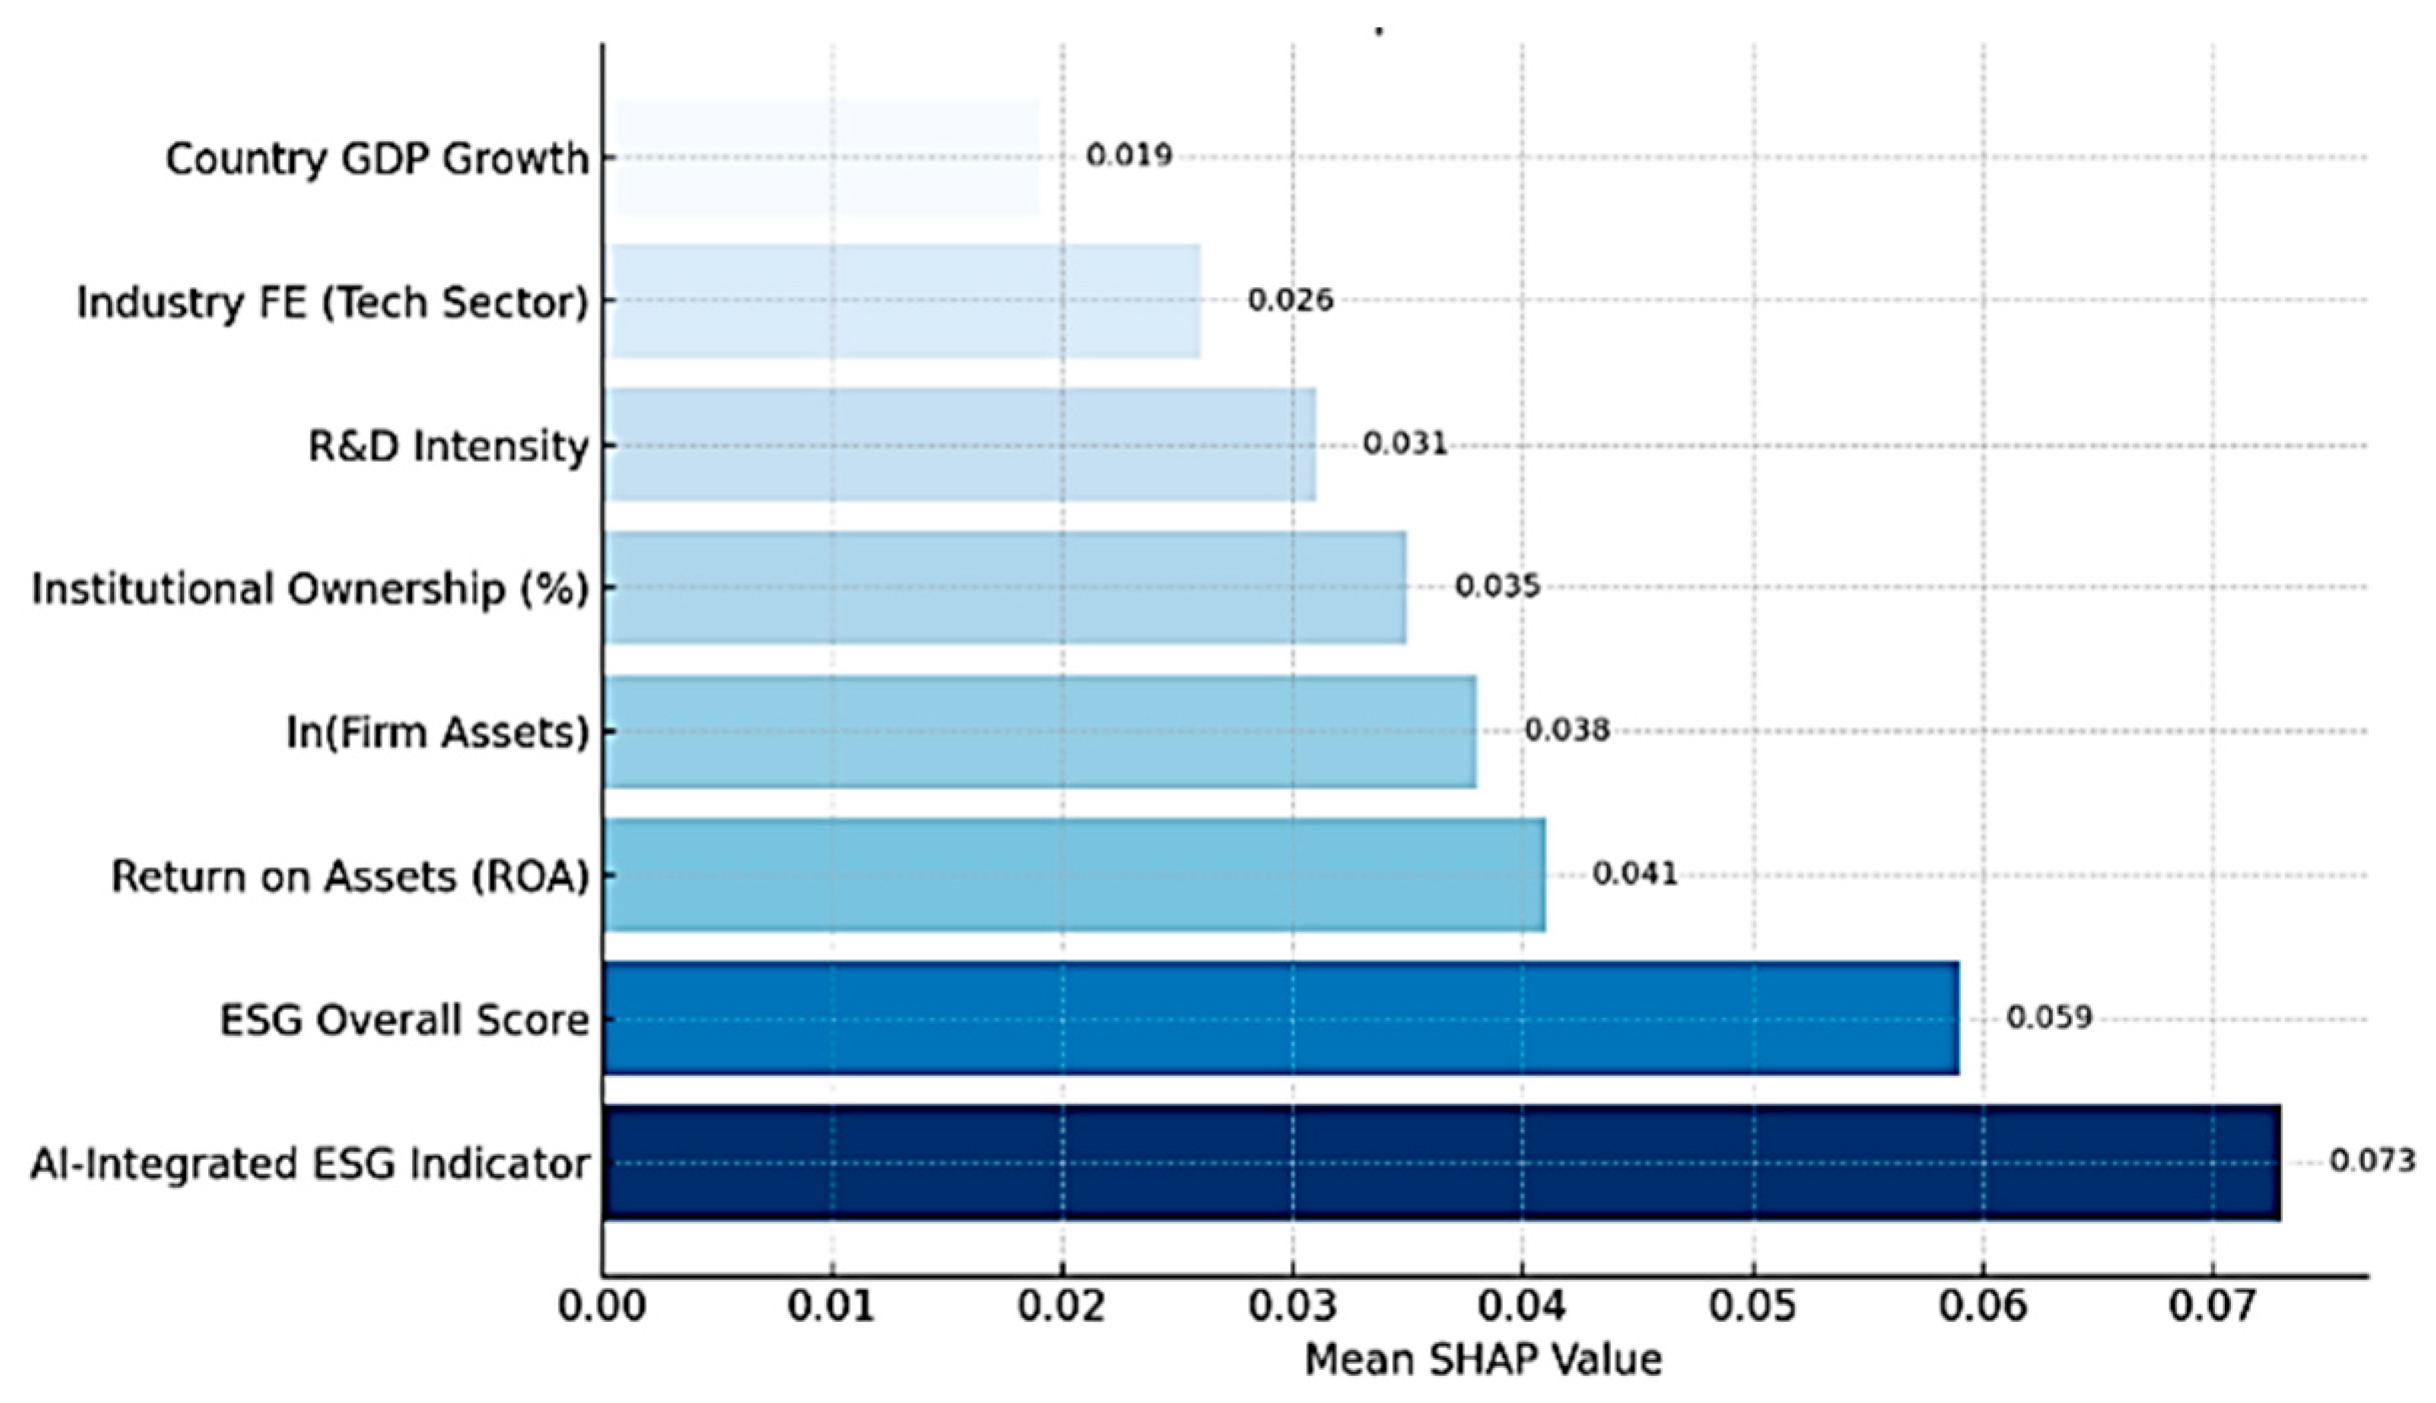
| Feature | OLS/Baseline | Elastic Net (Regularized Selection) | XGBoost (Tree-Based Importance) | SVR (PCA-Compressed) |
|---|---|---|---|---|
| AI-Integrated ESG Indicator | ✔ | ✔ | ✔ | ✔ |
| ESG Overall Score | ✔ | ✔ | ✔ | ✔ |
| Return on Assets (ROA) | ✔ | ✔ | ✔ | ✔ |
| ln (Firm Assets) | ✔ | ✔ | ✔ | |
| Institutional Ownership (%) | ✔ | ✔ | ✔ | ✔ |
| R&D Intensity | ✔ | ✔ | ✔ | ✔ |
| Industry FE (Tech Sector) | ✔ | ✔ | ||
| Country GDP Growth | ✔ | ✔ | ✔ | |
| Governance Score | ✔ | ✔ | ||
| Social Score | ✔ | ✔ | ||
| Environmental Score | ✔ | ✔ |
| Metric | AI-Integrated ESG (High Valuation) | Non-AI ESG (Low Valuation) | Overall |
|---|---|---|---|
| True Positives (TP) | 48 | 71 | – |
| False Positives (FP) | 0 | 1 | – |
| False Negatives (FN) | 0 | 1 | – |
| True Negatives (TN) | 72 | 48 | – |
| Accuracy | – | – | 99.31% |
| Precision | 100% | 98.61% | – |
| Recall (Sensitivity) | 100% | 98.61% | – |
| F1 Score | 100% | 98.61% | 99.30% |
| AUC-ROC (est.) | – | – | >0.99 |
References
- Adeoye, O. B., Okoye, C. C., Ofodile, O. C., & Ajayi-Nifise, A. (2024). Artificial intelligence in ESG investing: Enhancing portfolio management and performance. International Journal of Science and Research Archive, 11(1), 2194–2205. [Google Scholar] [CrossRef]
- Aruwaji, A. M., & Swanepoel, M. (2025, July 12–14). Transforming SME finance through artificial intelligence: A predictive analytics approach. 2025 Conference on Information Communications Technology and Society (ICTAS) (pp. 1–7), Durban, South Africa. [Google Scholar] [CrossRef]
- Barney, J. (1991). Firm resources and sustained competitive advantage. Journal of Management, 17(1), 99–120. [Google Scholar] [CrossRef]
- Blei, D. M., Ng, A. Y., & Jordan, M. I. (2003). Latent Dirichlet allocation. Journal of Machine Learning Research, 3, 993–1022. Available online: http://jmlr.csail.mit.edu/papers/v3/blei03a.html (accessed on 13 August 2025).
- Breiman, L. (2001). Random forests. Machine Learning, 45(1), 5–32. [Google Scholar] [CrossRef]
- Chen, T., & Guestrin, C. (2016, August 13–17). XGBoost: A scalable tree boosting system. 22nd ACM SIGKDD International Conference on Knowledge Discovery and Data Mining (KDD ’16) (pp. 785–794), San Francisco, CA, USA. [Google Scholar] [CrossRef]
- Cheng, B., Ioannou, I., & Serafeim, G. (2014). Corporate social responsibility and access to finance. Strategic Management Journal, 35(1), 1–23. [Google Scholar] [CrossRef]
- Chicco, D., Warrens, M. J., & Jurman, G. (2021). The coefficient of determination R-squared is more informative than SMAPE, MAE, MAPE, MSE and RMSE in regression analysis evaluation. PeerJ Computer Science, 7, e623. [Google Scholar] [CrossRef] [PubMed]
- Côrte-Real, N., Ruivo, P., & Oliveira, T. (2020). Leveraging internet of things and big data analytics initiatives in European and American firms: Is data quality a way to extract business value? Information and Management, 57(1), 103141. [Google Scholar] [CrossRef]
- Delery, J. E., & Roumpi, D. (2017). Strategic human resource management, human capital and competitive advantage: Is the field going in circles? Human Resource Management Journal, 27(1), 1–21. [Google Scholar] [CrossRef]
- Dubey, R., Bryde, D. J., Blome, C., Roubaud, D., & Giannakis, M. (2021). Facilitating artificial intelligence powered supply chain analytics through alliance management during the pandemic crises in the B2B context. Industrial Marketing Management, 96, 135–146. [Google Scholar] [CrossRef]
- Eccles, R. G., Ioannou, I., & Serafeim, G. (2014). The impact of corporate sustainability on organizational processes and performance. Management Science, 60(11), 2835–2857. [Google Scholar] [CrossRef]
- Eccles, R. G., & Krzus, M. P. (2018). The Nordic model: An analysis of leading practices in ESG disclosure. Nordic Journal of Business, 67(1), 4–25. [Google Scholar]
- El Ghoul, S., Guedhami, O., Kwok, C. C. Y., & Mishra, D. R. (2011). Does corporate social responsibility affect the cost of capital? Journal of Banking and Finance, 35(9), 2388–2406. [Google Scholar] [CrossRef]
- Fatemi, A., Glaum, M., & Kaiser, S. (2018). ESG performance and firm value: The moderating role of disclosure. Global Finance Journal, 38, 45–64. [Google Scholar] [CrossRef]
- Floridi, L., & Cowls, J. (2019). A unified framework of five principles for AI in society. Harvard Data Science Review, 1(1), 2–15. [Google Scholar] [CrossRef]
- Freeman, R. E. (1984). Strategic management: A stakeholder approach. Pitman. [Google Scholar]
- Friede, G., Busch, T., & Bassen, A. (2015). ESG and financial performance: Aggregated evidence from more than 2000 empirical studies. Journal of Sustainable Finance and Investment, 5(4), 210–233. [Google Scholar] [CrossRef]
- Grewal, J., Hauptmann, C., & Serafeim, G. (2020). Material sustainability information and stock price informativeness. Journal of Accounting and Economics, 70(2–3), 101344. [Google Scholar] [CrossRef]
- Gyapong, E., Monem, R. M., & Hu, F. (2016). Do women and ethnic minority directors influence firm value? Evidence from post-apartheid South Africa. Journal of Business Finance & Accounting, 43(3–4), 370–413. [Google Scholar] [CrossRef]
- Haniffa, R. M., & Cooke, T. E. (2005). The impact of culture and governance on corporate social reporting. Journal of Accounting and Public Policy, 24(5), 391–430. [Google Scholar] [CrossRef]
- Higgins, C., Stubbs, W., & Love, T. (2020). Walking the talk(s): Organisational narratives of integrated reporting. Accounting, Auditing and Accountability Journal, 33(2), 292–324. [Google Scholar] [CrossRef]
- Hussein, T. M., Michael, A. A., & Goparaju, A. (2025). Reviewing the impact of technological innovation on accounting practices. In E. AlDhaen, A. Braganza, A. Hamdan, & W. Chen (Eds.), Business sustainability with Artificial Intelligence (AI): Challenges and opportunities (Vol. 566). Studies in systems, decision and control. Springer. [Google Scholar] [CrossRef]
- Hyndman, R. J., & Koehler, A. B. (2006). Another look at measures of forecast accuracy. International Journal of Forecasting, 22(4), 679–688. [Google Scholar] [CrossRef]
- Ioannou, I., & Serafeim, G. (2015). The impact of corporate social responsibility on investment recommendations. Strategic Management Journal, 36(7), 1053–1081. [Google Scholar] [CrossRef]
- Khanna, T., & Palepu, K. G. (2010). Winning in emerging markets: A road map for strategy and execution. Harvard Business Press. [Google Scholar]
- Koelbel, J. F., & Rigobon, R. (2022). ESG confusion and stock returns: Tackling the problem of noise [NBER Working Paper No. 30562]. NBER. [Google Scholar] [CrossRef]
- KPMG. (2021). The time has come: The KPMG survey of sustainability reporting 2020. KPMG International. Available online: https://home.kpmg/xx/en/home/insights/2020/11/the-time-has-come-survey-of-sustainability-reporting.html (accessed on 4 July 2025).
- Landis, J. R., & Koch, G. G. (1977). The measurement of observer agreement for categorical data. Biometrics, 33(1), 159–174. [Google Scholar] [CrossRef]
- Li, F. (2008). Annual report readability, current earnings, and earnings persistence. Journal of Accounting and Economics, 45(2–3), 221–247. [Google Scholar] [CrossRef]
- Lim, T. (2024). Environmental, social, and governance (ESG) and artificial intelligence in finance: State-of-the-art and research takeaways. Artificial Intelligence Review, 57(76). [Google Scholar] [CrossRef]
- Loughran, T., & McDonald, B. (2011). When is a liability not a liability? Textual analysis, dictionaries, and 10-Ks. Journal of Finance, 66(1), 35–65. [Google Scholar] [CrossRef]
- Ntim, C. G., Opong, K. K., & Danbolt, J. (2015). Board size, corporate regulations, and firm valuation in an emerging market: A simultaneous equation approach. International Review of Applied Economics, 29(2), 194–220. [Google Scholar] [CrossRef]
- Ntim, C. G., & Soobaroyen, T. (2013). Black economic empowerment disclosures by South African listed corporations: The influence of ownership and board characteristics. Journal of Business Ethics, 116(1), 121–138. [Google Scholar] [CrossRef]
- OECD. (2022). OECD economic outlook, volume 2022 issue 2: Confronting the crisis. OECD Publishing. [Google Scholar] [CrossRef]
- OECD. (2023). 2023 OECD open, useful and re-usable data (OURdata) Index: Results and key findings [OECD Public Governance Policy Papers, No. 43]. OECD Publishing. [Google Scholar] [CrossRef]
- Powers, D. M. W. (2011). Evaluation: From precision, recall and F-measure to ROC, informedness, markedness and correlation. Journal of Machine Learning Technologies, 2(1), 37–63. [Google Scholar]
- Sharma, V., Kulkarni, V., McAlister, F., Eurich, D., Keshwani, S., Simpson, S. H., Voaklander, D., & Samanani, S. (2021). Predicting 30-day readmissions in patients with heart failure using administrative data: A machine learning approach. Journal of Cardiac Failure, 28(11), 1659–1668. [Google Scholar] [CrossRef] [PubMed]
- Shwartz-Ziv, R., & Armon, A. (2022). Tabular data: Deep learning is not all you need. Information Fusion, 81, 84–90. [Google Scholar] [CrossRef]
- Simionescu, M. (2025). Machine learning vs. econometric models to forecast inflation rate in Romania? The role of sentiment analysis. Mathematics, 13(1), 168. [Google Scholar] [CrossRef]
- Spence, M. (2002). Signaling in retrospect and the informational structure of markets. American Economic Review, 92(3), 434–459. [Google Scholar] [CrossRef]
- Wamba, S. F., Queiroz, M. M., & Trinchera, L. (2021). Big data analytics capabilities and firm performance: The mediating role of stakeholder trust. Technological Forecasting and Social Change, 167, 120728. [Google Scholar] [CrossRef]
- Wang, C., Zhang, Y., & Miao, Y. (2025). Artificial intelligence and corporate ESG: Evidence from Chinese listed enterprises. Finance Research Letters, 66, 108547. [Google Scholar] [CrossRef]
- Wong, W. C., Batten, J. A., Mohamed-Arshad, S. B., Nordin, S., & Adzis, A. A. (2021). Does ESG certification add firm value? Finance Research Letters, 39, 101593. [Google Scholar] [CrossRef]
- World Bank. (2022). World development report 2022: Finance for an equitable recovery. World Bank. [Google Scholar] [CrossRef]
- Xie, H., & Wu, F. (2025). Artificial intelligence technology and corporate ESG performance: Empirical evidence from Chinese-listed firms. Sustainability, 17, 420. [Google Scholar] [CrossRef]
- Yu, E. P., & Luu, B. V. (2021). International variations in ESG disclosure—Do cross-listed companies care more? International Review of Financial Analysis, 75, 101731. [Google Scholar] [CrossRef]
- Zhang, C., & Yang, J. (2024). Artificial intelligence and corporate ESG performance. International Review of Economics & Finance, 96, 103713. [Google Scholar] [CrossRef]
- Zhou, X., Peng, Y., Sun, X., Cao, X., Wang, Z., & Zhang, J. (2025). Advancing new energy industry quality via artificial intelligence-driven integration of ESG principles. Humanities and Social Sciences Communications, 12, 1491. [Google Scholar] [CrossRef]
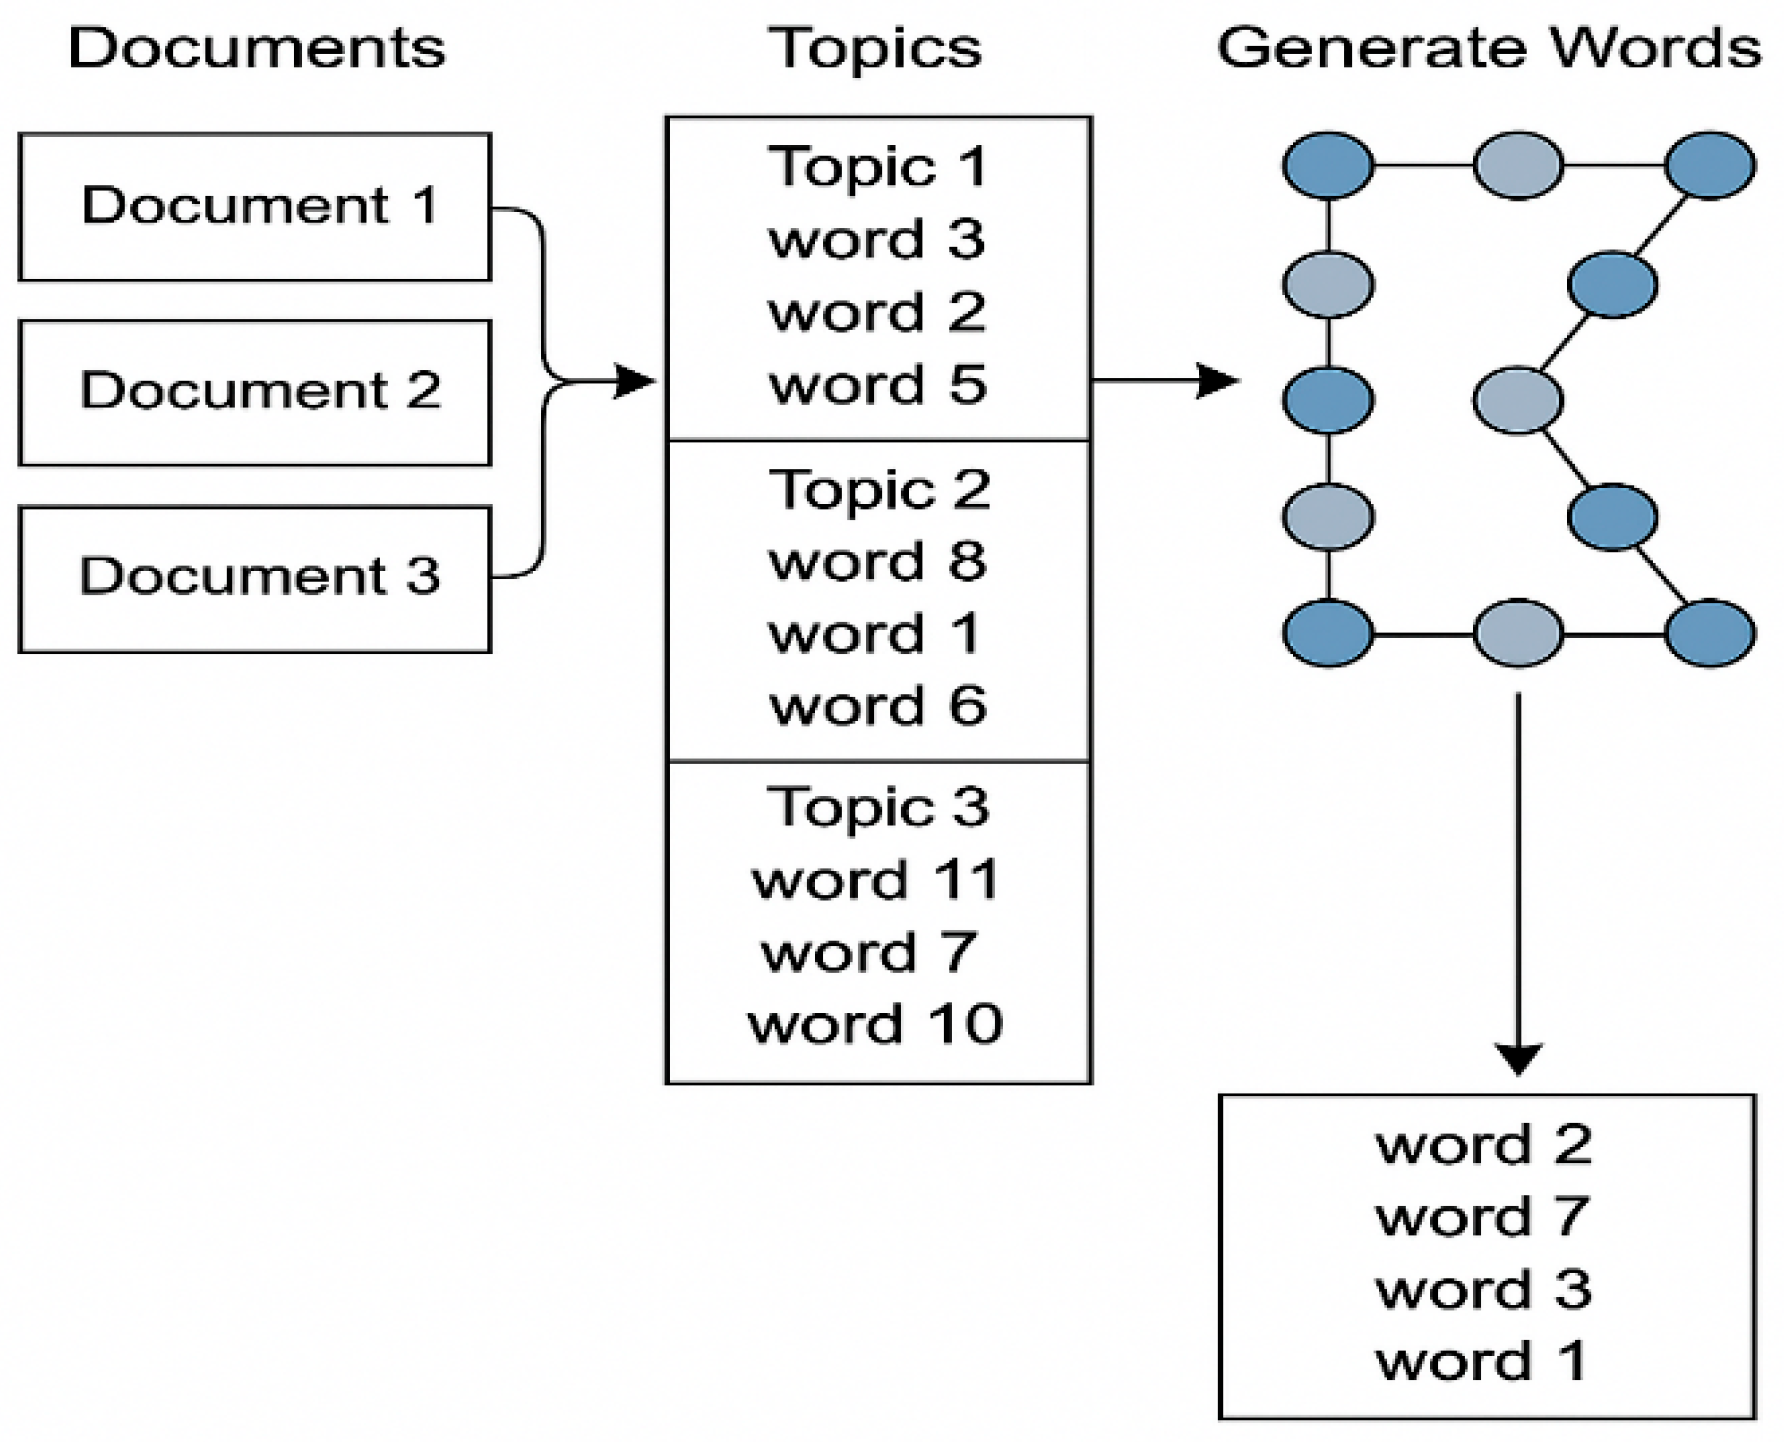
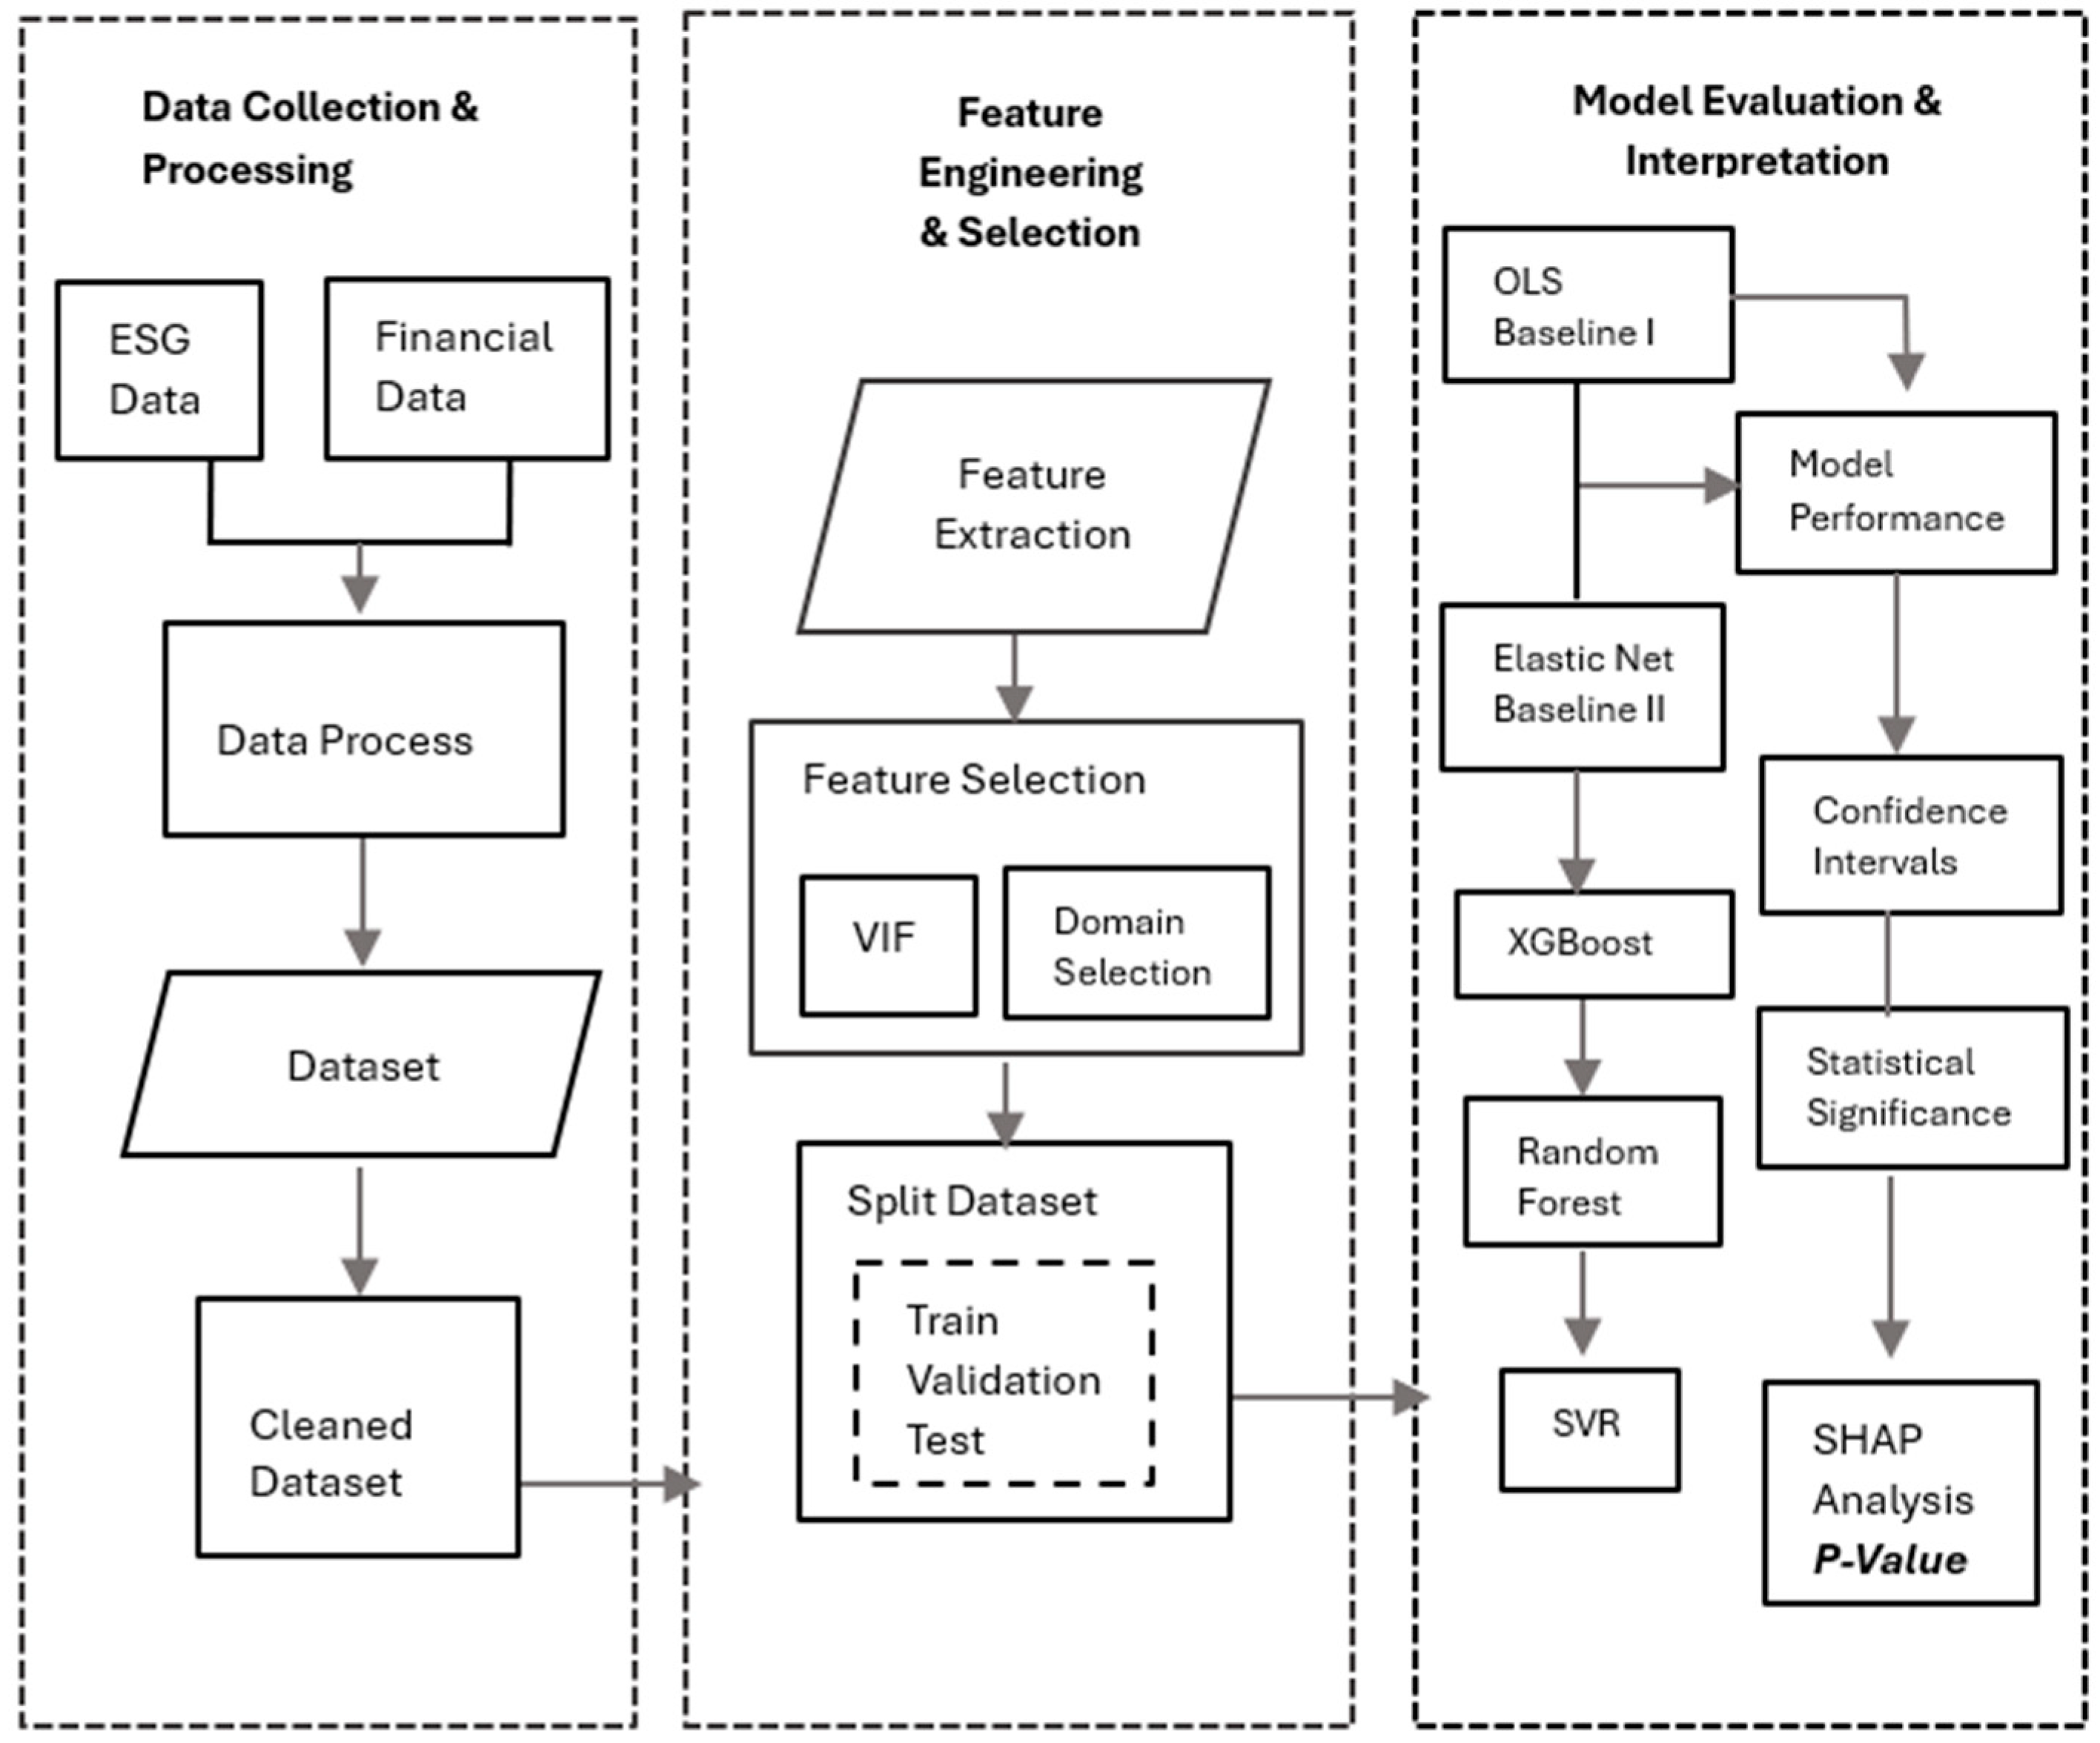

| Country | Manufacturing | Energy | Telecommunications | Consumer Goods | Industrials | Total Firms |
|---|---|---|---|---|---|---|
| South Africa | 12 | 10 | 8 | 8 | 7 | 45 |
| Nigeria | 8 | 6 | 6 | 6 | 4 | 30 |
| Egypt | 5 | 3 | 4 | 4 | 4 | 20 |
| Kenya | 3 | 3 | 1 | 5 | 3 | 15 |
| Morocco | 2 | 3 | 1 | 2 | 2 | 10 |
| Total | 30 | 25 | 20 | 25 | 20 | 120 |
| Step | Procedure | Description | Output |
|---|---|---|---|
| 1 | Keyword Extraction | Automated identification of AI-related terms (“machine learning,” “NLP,” “automated ESG scoring,” “AI-driven analytics”) from sustainability and annual reports. | Initial pool of AI-related text passages. |
| 2 | Contextual Filtering | Rule-based co-occurrence checks requiring AI terms to appear alongside ESG-related concepts (“sustainability,” “disclosure,” “reporting”). | Reduced dataset containing only ESG-relevant AI references. |
| 3 | Coding Framework | Application of structured coding scheme to classify firms as AI-integrated (1) or non-AI-integrated (0) based on explicit evidence in ESG disclosures. | Preliminary binary classification variable. |
| 4 | Reliability Testing | Subsample independently coded by multiple researchers; intercoder reliability evaluated using Cohen’s Kappa and Krippendorff’s Alpha. | Validated and consistent coding results. |
| 5 | Final Integration | Consolidation of validated coding decisions into the panel dataset for econometric analysis. | Final AI-integration dummy variable used in regression models. |
| Country | Manufacturing | Energy | Telecommunications | Consumer Goods | Industrials | Total AI Firms |
|---|---|---|---|---|---|---|
| South Africa | 6 | 5 | 5 | 3 | 3 | 22 |
| Nigeria | 3 | 2 | 3 | 2 | 1 | 11 |
| Egypt | 2 | 1 | 2 | 1 | 1 | 7 |
| Kenya | 1 | 1 | 0 | 2 | 1 | 5 |
| Morocco | 1 | 1 | 0 | 1 | 0 | 3 |
| Total | 13 | 10 | 10 | 9 | 6 | 48 |
| Variable | Type | Definition/Measurement | Scale/Unit | Data Source(s) |
|---|---|---|---|---|
| Dependent Variables | ||||
| Tobin’s Q | Dependent | (Market Value of Equity + Book Value of Debt) ÷ Book Value of Total Assets | Continuous (ratio) | Bloomberg; Refinitiv; Capital IQ |
| Market-to-Sales Multiple | Dependent | Enterprise Value ÷ Annual Sales Revenue | Continuous (ratio) | Bloomberg; Refinitiv; Capital IQ |
| Traditional ESG Metrics | ||||
| ESG Score (aggregate) | Independent | Overall ESG percentile score (0–100) | 0–100 percentile rank | Refinitiv ESG; MSCI ESG Ratings |
| Environmental Score (E) | Independent | ESG sub-score for environmental policies | 0–100 percentile rank | Refinitiv ESG; MSCI ESG Ratings |
| Social Score (S) | Independent | ESG sub-score for social performance | 0–100 percentile rank | Refinitiv ESG; MSCI ESG Ratings |
| Governance Score (G) | Independent | ESG sub-score for governance quality | 0–100 percentile rank | Refinitiv ESG; MSCI ESG Ratings |
| ESG Controversy Indicator | Independent | 100 − Controversy Score (higher = more controversies) | 0–100 scale | Refinitiv ESG |
| AI-Related Metrics | ||||
| AI-Integrated ESG Reporting | Independent | Dummy = 1 if firm explicitly reports AI use in ESG disclosure | Binary (0/1) | Constructed from manual/document review |
| Sentiment Score | AI-derived | NLP-based measure of positive/negative tone | Continuous | Custom NLP analysis |
| Sustainability Topics | AI-derived | Topic proportions derived via LDA | Continuous (0–1) | Custom NLP analysis |
| Linguistic Complexity Index | AI-derived | Sentence length and vocabulary diversity measures | Continuous index | Custom NLP analysis |
| Readability Metrics | AI-derived | Indices such as FOG/Gunning Fog | Continuous index | Custom NLP analysis |
| Control Variables | ||||
| Firm Size | Control | Logarithm of total assets | Continuous (log USD) | Bloomberg; Refinitiv; Capital IQ |
| Profitability (ROA) | Control | Net income ÷ total assets | Continuous (ratio) | Bloomberg; Refinitiv; Capital IQ |
| Institutional Ownership | Control | % of shares held by institutional investors | Continuous (%) | Bloomberg; Refinitiv; Capital IQ |
| GDP Growth | Control | Annual real GDP growth rate | Continuous (%) | World Bank; IMF |
| Inflation | Control | Annual % change in consumer price index | Continuous (%) | World Bank; IMF |
| Currency Adjustment | Data handling | Conversion of financial figures to USD using annual average exchange rates | USD | World Bank |
| ESG Pillar | Topic ID | Topic Name | Illustrative Keywords |
|---|---|---|---|
| Environment | 0 | ESG Linked Performance and Compliance | ESG-linked KPIs, executive compensation, supply chain, fair labor, audits |
| Social | 1 | Community Engagement and Workforce Development | CSR programs, community engagement, education and healthcare, workforce skills |
| Governance | 2 | Governance, Transparency and Data Security | Board independence, transparency, monitoring tools, privacy, data security |
| Country | Sentiment Score | Linguistic Complexity Index | Readability Metric |
|---|---|---|---|
| Egypt | −0.14073 | 0.469098 | 13.22963 |
| Kenya | −0.00535 | 0.484692 | 13.52701 |
| Morocco | 0.050897 | 0.483445 | 12.98981 |
| Nigeria | −0.18912 | 0.364712 | 10.90439 |
| South Africa | −0.03071 | 0.580439 | 13.57511 |
| Country | Nigeria (n = 30) | South Africa (n = 45) | Egypt (n = 20) | Kenya (n = 15) | Morocco (n = 10) |
|---|---|---|---|---|---|
| Variable | Mean (SD) | Mean (SD) | Mean (SD) | Mean (SD) | Mean (SD) |
| Tobin’s Q | 1.12 (0.40) | 1.32 (0.50) | 1.21 (0.42) | 1.18 (0.39) | 1.15 (0.35) |
| M/S Multiple | 2.50 (0.90) | 2.85 (1.15) | 2.60 (1.05) | 2.70 (1.00) | 2.45 (0.85) |
| ESG Overall Score | 48.3 (16.8) | 56.2 (17.5) | 50.1 (18.2) | 49.4 (16.1) | 45.8 (15.7) |
| Environmental Score (E) | 42.1 (18.2) | 48.7 (19.4) | 43.2 (17.9) | 40.8 (18.7) | 39.5 (16.3) |
| Social Score (S) | 47.9 (17.6) | 54.1 (16.3) | 48.5 (18.5) | 46.7 (17.1) | 44.2 (15.2) |
| Governance Score (G) | 58.2 (14.7) | 62.9 (13.9) | 59.3 (15.0) | 57.4 (14.2) | 55.8 (13.8) |
| ESG Controversy Indicator | 21.5 (18.0) | 25.3 (17.5) | 22.1 (17.8) | 20.7 (16.9) | 19.9 (15.5) |
| AI-Integrated ESG Reporting % | 20.0 | 35.5 | 25.0 | 18.0 | 15.0 |
| Sentiment Score | 0.09 (0.27) | 0.18 (0.32) | 0.12 (0.30) | 0.10 (0.26) | 0.07 (0.22) |
| Sustainability Topics (LDA) | 0.23 (0.09) | 0.30 (0.11) | 0.25 (0.10) | 0.22 (0.08) | 0.20 (0.07) |
| Linguistic Complexity Index | 17.3 (3.5) | 19.4 (3.8) | 18.1 (3.4) | 16.9 (3.2) | 16.5 (3.1) |
| Readability Metrics | 15.1 (2.8) | 14.2 (3.0) | 14.8 (2.9) | 15.5 (2.7) | 15.9 (2.5) |
| Firm Size (log assets) | 14.2 (0.9) | 14.9 (1.1) | 14.4 (1.0) | 14.3 (0.8) | 14.1 (0.7) |
| Profitability (ROA, %) | 5.9 (3.8) | 6.5 (4.2) | 6.1 (3.9) | 5.8 (3.5) | 5.4 (3.2) |
| Institutional Ownership (%) | 35.2 (20.5) | 42.6 (21.3) | 36.1 (19.8) | 34.5 (18.7) | 32.4 (17.2) |
| GDP Growth (%) | 3.1 (1.2) | 3.4 (1.4) | 3.0 (1.3) | 2.8 (1.1) | 2.6 (1.0) |
| Inflation Rate (%) | 7.2 (2.1) | 6.3 (2.5) | 6.8 (2.3) | 7.5 (2.0) | 7.9 (1.9) |
| Variable | Mean | Median | Maximum | Minimum | Std. Dev. | Skewness | Kurtosis |
|---|---|---|---|---|---|---|---|
| Tobin’s Q | 1.22 | 1.09 | 1.3 | 0.95 | 0.11 | 0.62 | 0 |
| Market-to-Sales Multiple | 2.62 | 2.65 | 3.2 | 2.1 | 0.34 | 0 | −0.61 |
| ESG Composite Score | 49.96 | 50 | 70 | 30 | 10 | −0.04 | −0.35 |
| Environmental | 42.86 | 43 | 65 | 25 | 8.5 | 0.1 | −0.5 |
| Social | 48.28 | 48 | 70 | 30 | 9.2 | 0.05 | −0.4 |
| Governance | 58.72 | 59 | 75 | 40 | 7.5 | −0.15 | −0.45 |
| AI Integration | 0.6 | 1 | 1 | 0 | 0.52 | −0.48 | −2.28 |
| Sentiment Analysis | 0.11 | 0.1 | 0.5 | −0.2 | 0.15 | 0.2 | −0.3 |
| Linguistic Complexity Index | 17.64 | 17.6 | 20 | 15 | 1.2 | 0.15 | −0.25 |
| Readability Score | 15.1 | 15 | 18 | 12 | 1 | 0.05 | −0.2 |
| Firm Size (Log Assets) | 14.62 | 14.6 | 15.1 | 14.2 | 0.29 | 0.3 | −0.65 |
| Return on Assets (%) | 6.28 | 6.25 | 7 | 5.5 | 0.48 | −0.06 | −0.84 |
| Institutional Ownership (%) | 38.5 | 38.5 | 45 | 30 | 4.35 | −0.44 | 0.38 |
| Variable | VIF | (1) | (2) | (3) | (4) | (5) | (6) | (7) | (8) | (9) | (10) | (11) | |
|---|---|---|---|---|---|---|---|---|---|---|---|---|---|
| (1) | ESG Overall Score | 5.3 | 1.00 | ||||||||||
| (2) | Environmental Score | 7.2 | 0.88 | 1.00 | |||||||||
| (3) | Social Score | 6.5 | 0.82 | 0.67 | 1.00 | ||||||||
| (4) | Governance Score | 5.9 | 0.80 | 0.65 | 0.62 | 1.00 | |||||||
| (5) | ESG Controversy Indicator | 2.1 | −0.50 | −0.45 | −0.42 | −0.47 | 1.00 | ||||||
| (6) | AI-Integrated ESG Reporting | 1.5 | 0.30 | 0.28 | 0.25 | 0.33 | −0.28 | 1.00 | |||||
| (7) | Sentiment Score | 2.0 | 0.22 | 0.19 | 0.17 | 0.20 | −0.16 | 0.35 | 1.00 | ||||
| (8) | Linguistic Complexity Index | 2.4 | 0.25 | 0.21 | 0.20 | 0.23 | −0.18 | 0.40 | 0.45 | 1.00 | |||
| (9) | Firm Size (log assets) | 3.1 | 0.45 | 0.40 | 0.30 | 0.42 | −0.20 | 0.38 | 0.28 | 0.30 | 1.00 | ||
| (10) | Profitability (ROA) | 1.7 | 0.20 | 0.15 | 0.18 | 0.23 | −0.10 | 0.14 | 0.12 | 0.16 | 0.30 | 1.00 | |
| (11) | Institutional Ownership | 2.5 | 0.38 | 0.32 | 0.35 | 0.40 | −0.25 | 0.26 | 0.24 | 0.29 | 0.50 | 0.32 | 1.00 |
| Variable | Mean AI | SD AI | N AI | Mean Non-AI | SD Non-AI | N Non-AI | T Stat | p Value | Mean Diff. | Cohen’s d |
|---|---|---|---|---|---|---|---|---|---|---|
| Tobin’s Q | 1.39 | 0.42 | 336 | 1.16 | 0.37 | 864 | 9.12 | 0.001 | +0.23 | 0.597967 |
| ESG Overall Score | 61.8 | 15.2 | 336 | 49.2 | 16.9 | 864 | 11.75 | 0.001 | +12.6 | 0.766314 |
| Sentiment Score | 0.18 | 0.28 | 336 | 0.09 | 0.24 | 864 | 4.9 | 0.001 | +0.09 | 0.35739 |
| Linguistic Complexity | 19.2 | 3.8 | 336 | 17.5 | 3.4 | 864 | 7.3 | 0.001 | +1.7 | 0.483444 |
| Variable | Model 1 | Model 2 | Model 3 | Model 4 (Full) |
|---|---|---|---|---|
| AI-Integrated ESG Reporting | 0.102 *** (8.91) | 0.089 *** (7.88) | 0.084 *** (7.55) | 0.081 *** (7.34) |
| ESG Overall Score | 0.0041 *** (5.64) | 0.0040 *** (5.58) | 0.0039 *** (5.45) | |
| AI × ESG Overall Score | 0.0024 (1.03) | |||
| Firm Size (log assets) | 0.110 *** (9.85) | 0.113 *** (10.12) | 0.117 *** (10.36) | |
| ROA | 0.0068 *** (4.70) | 0.0072 *** (4.92) | 0.0075 *** (5.10) | |
| Institutional Ownership | 0.0009 * (1.93) | 0.0010 * (2.01) | ||
| GDP Growth | 0.0041 * (1.94) | 0.0043 * (2.05) | ||
| Inflation Rate | −0.0028 * (−1.92) | −0.0031 * (−2.08) | ||
| Sentiment Score | 0.013 * (1.92) | 0.014 ** (2.11) | ||
| Sustainability Topics (LDA) | 0.007 * (1.95) | 0.009 ** (2.24) | ||
| Linguistic Complexity Index | 0.005 * (1.92) | 0.006 ** (2.14) | ||
| Readability (Gunning-Fog) | −0.011 * (−1.97) | −0.010 * (−1.88) | ||
| Year Fixed Effects | Yes | Yes | Yes | Yes |
| Firm Fixed Effects | No | No | Yes | Yes |
| R2 | 0.358 | 0.443 | 0.579 | 0.602 |
| Adjusted R2 | 0.228 | 0.332 | 0.451 | 0.479 |
| Observations | 1200 | 1200 | 1200 | 1200 |
| Variable | Model 1 | Model 2 | Model 3 | Model 4 (Full) |
|---|---|---|---|---|
| AI-Integrated ESG Reporting | 0.109 *** (9.03) | 0.098 *** (8.15) | 0.096 *** (7.92) | 0.094 *** (7.61) |
| ESG Overall Score | 0.0037 *** (5.45) | 0.0036 *** (5.38) | 0.0035 *** (5.23) | |
| AI × ESG Overall Score | 0.0018 (0.91) | |||
| Firm Size (log assets) | 0.138 *** (10.11) | 0.141 *** (10.45) | 0.145 *** (10.66) | |
| ROA | 0.0074 *** (4.85) | 0.0078 *** (5.01) | 0.0080 *** (5.23) | |
| Institutional Ownership | 0.0011 * (1.94) | 0.0013 * (2.02) | ||
| GDP Growth | 0.0040 * (1.88) | 0.0042 * (2.01) | ||
| Inflation Rate | −0.0034 * (−1.93) | −0.0038 * (−2.11) | ||
| Sentiment Score | 0.012 * (1.90) | 0.013 ** (2.15) | ||
| Sustainability Topics (LDA) | 0.008 * (1.94) | 0.009 ** (2.20) | ||
| Linguistic Complexity Index | 0.006 * (1.89) | 0.007 ** (2.17) | ||
| Readability (Gunning-Fog) | −0.009 * (−1.91) | −0.008 * (−1.84) | ||
| Year Fixed Effects | Yes | Yes | Yes | Yes |
| Firm Fixed Effects | No | No | No | No |
| R2 | 0.366 | 0.454 | 0.570 | 0.581 |
| Adjusted R2 | 0.239 | 0.344 | 0.452 | 0.456 |
| Observations | 1200 | 1200 | 1200 | 1200 |
| (Tobin’s Q) | (M/S Multiple) | ||
|---|---|---|---|
| Method | Variable | Coefficient (95% CI) p-Value | Coefficient 95% CI p-Value |
| Panel A | |||
| Instrumental Variables (2SLS) | |||
| Instruments: Lagged AI ESG, Oxford AI Readiness Index | Predicted AI-Integrated ESG | 0.061 *** (0.015, 0.107) 0.012 | 0.067 *** (0.018, 0.116) 0.009 |
| ESG Overall Score | 0.0038 *** (0.0016, 0.0060) <0.001 | 0.0035 *** (0.0012, 0.0058) 0.002 | |
| First-stage F-statistic | 19.45 | 17.83 | |
| Observations | 1080 | 1080 | |
| Year, Firm Fixed Effects | Yes | Yes | |
| Panel B | |||
| Propensity Score Matching | |||
| Nearest Neighbor | Average Treatment Effect (ATE) | 0.073 *** (0.032, 0.114) 0.001 | 0.079 *** (0.037, 0.121) 0.001 |
| Kernel | Average Treatment Effect (ATE) | 0.070 *** (0.033, 0.107) <0.001 | 0.075 *** (0.034, 0.116) <0.001 |
| Matched Observations (N) | 672 | 672 | |
| Panel C | |||
| Lagged Models | |||
| AI-Integrated ESG Reporting | 0.055 *** (0.016, 0.094) 0.006 | 0.059 *** (0.020, 0.098) 0.004 | |
| Lagged ESG Overall Score | 0.0032 *** 0.0010, 0.0054) <0.001 | 0.0030 *** (0.0007, 0.0053) 0.010 | |
| Observations | 1080 | 1080 | |
| Year, Firm Fixed Effects | Yes | Yes |
| Variable | Train Min | Train Max | Train Mean | Validation Min | Validation Max | Validation Mean | Test Min | Test Max | Test Mean |
|---|---|---|---|---|---|---|---|---|---|
| Tobin’s Q | 0.75 | 2.1 | 1.32 | 0.8 | 2 | 1.3 | 0.85 | 2.15 | 1.34 |
| M/S Multiple | 1.25 | 3.5 | 2.65 | 1.3 | 3.4 | 2.6 | 1.35 | 3.6 | 2.68 |
| Traditional ESG Score | 40 | 95 | 63 | 42 | 92 | 61 | 45 | 97 | 64 |
| Environmental Score | 35 | 90 | 59 | 37 | 87 | 57 | 40 | 92 | 60 |
| Social Score | 38 | 92 | 60 | 39 | 89 | 58 | 42 | 94 | 61 |
| Governance Score | 50 | 98 | 65 | 52 | 95 | 63 | 54 | 99 | 67 |
| ESG Controversy Indicator | 10 | 45 | 25 | 12 | 43 | 24 | 14 | 48 | 26 |
| AI-Integrated ESG Reporting | 0 | 1 | 0.35 | 0 | 1 | 0.3 | 0 | 1 | 0.38 |
| Sentiment Score | −0.15 | 0.35 | 0.1 | −0.12 | 0.32 | 0.09 | −0.1 | 0.38 | 0.11 |
| Sustainability Topics | 0.05 | 0.65 | 0.22 | 0.06 | 0.6 | 0.21 | 0.07 | 0.68 | 0.23 |
| Linguistic Complexity Index | 10.5 | 23.5 | 18 | 11 | 22.8 | 17.6 | 11.5 | 24 | 18.3 |
| Readability Metrics | 9 | 21 | 14.5 | 10 | 20 | 14.2 | 10.5 | 22 | 14.8 |
| Firm Size | 12.5 | 16 | 14 | 12.7 | 15.8 | 13.8 | 13 | 16.5 | 14.3 |
| Profitability (ROA) | 2.5 | 10.5 | 6.2 | 3 | 10.2 | 6 | 3.5 | 11 | 6.3 |
| Institutional Ownership | 20 | 70 | 45 | 22 | 68 | 44 | 24 | 72 | 46 |
| GDP Growth | 2 | 7 | 4.5 | 2.3 | 6.8 | 4.3 | 2.5 | 7.2 | 4.6 |
| Inflation Rate | 3.5 | 10.5 | 6.1 | 3.8 | 10 | 6 | 4 | 11 | 6.2 |
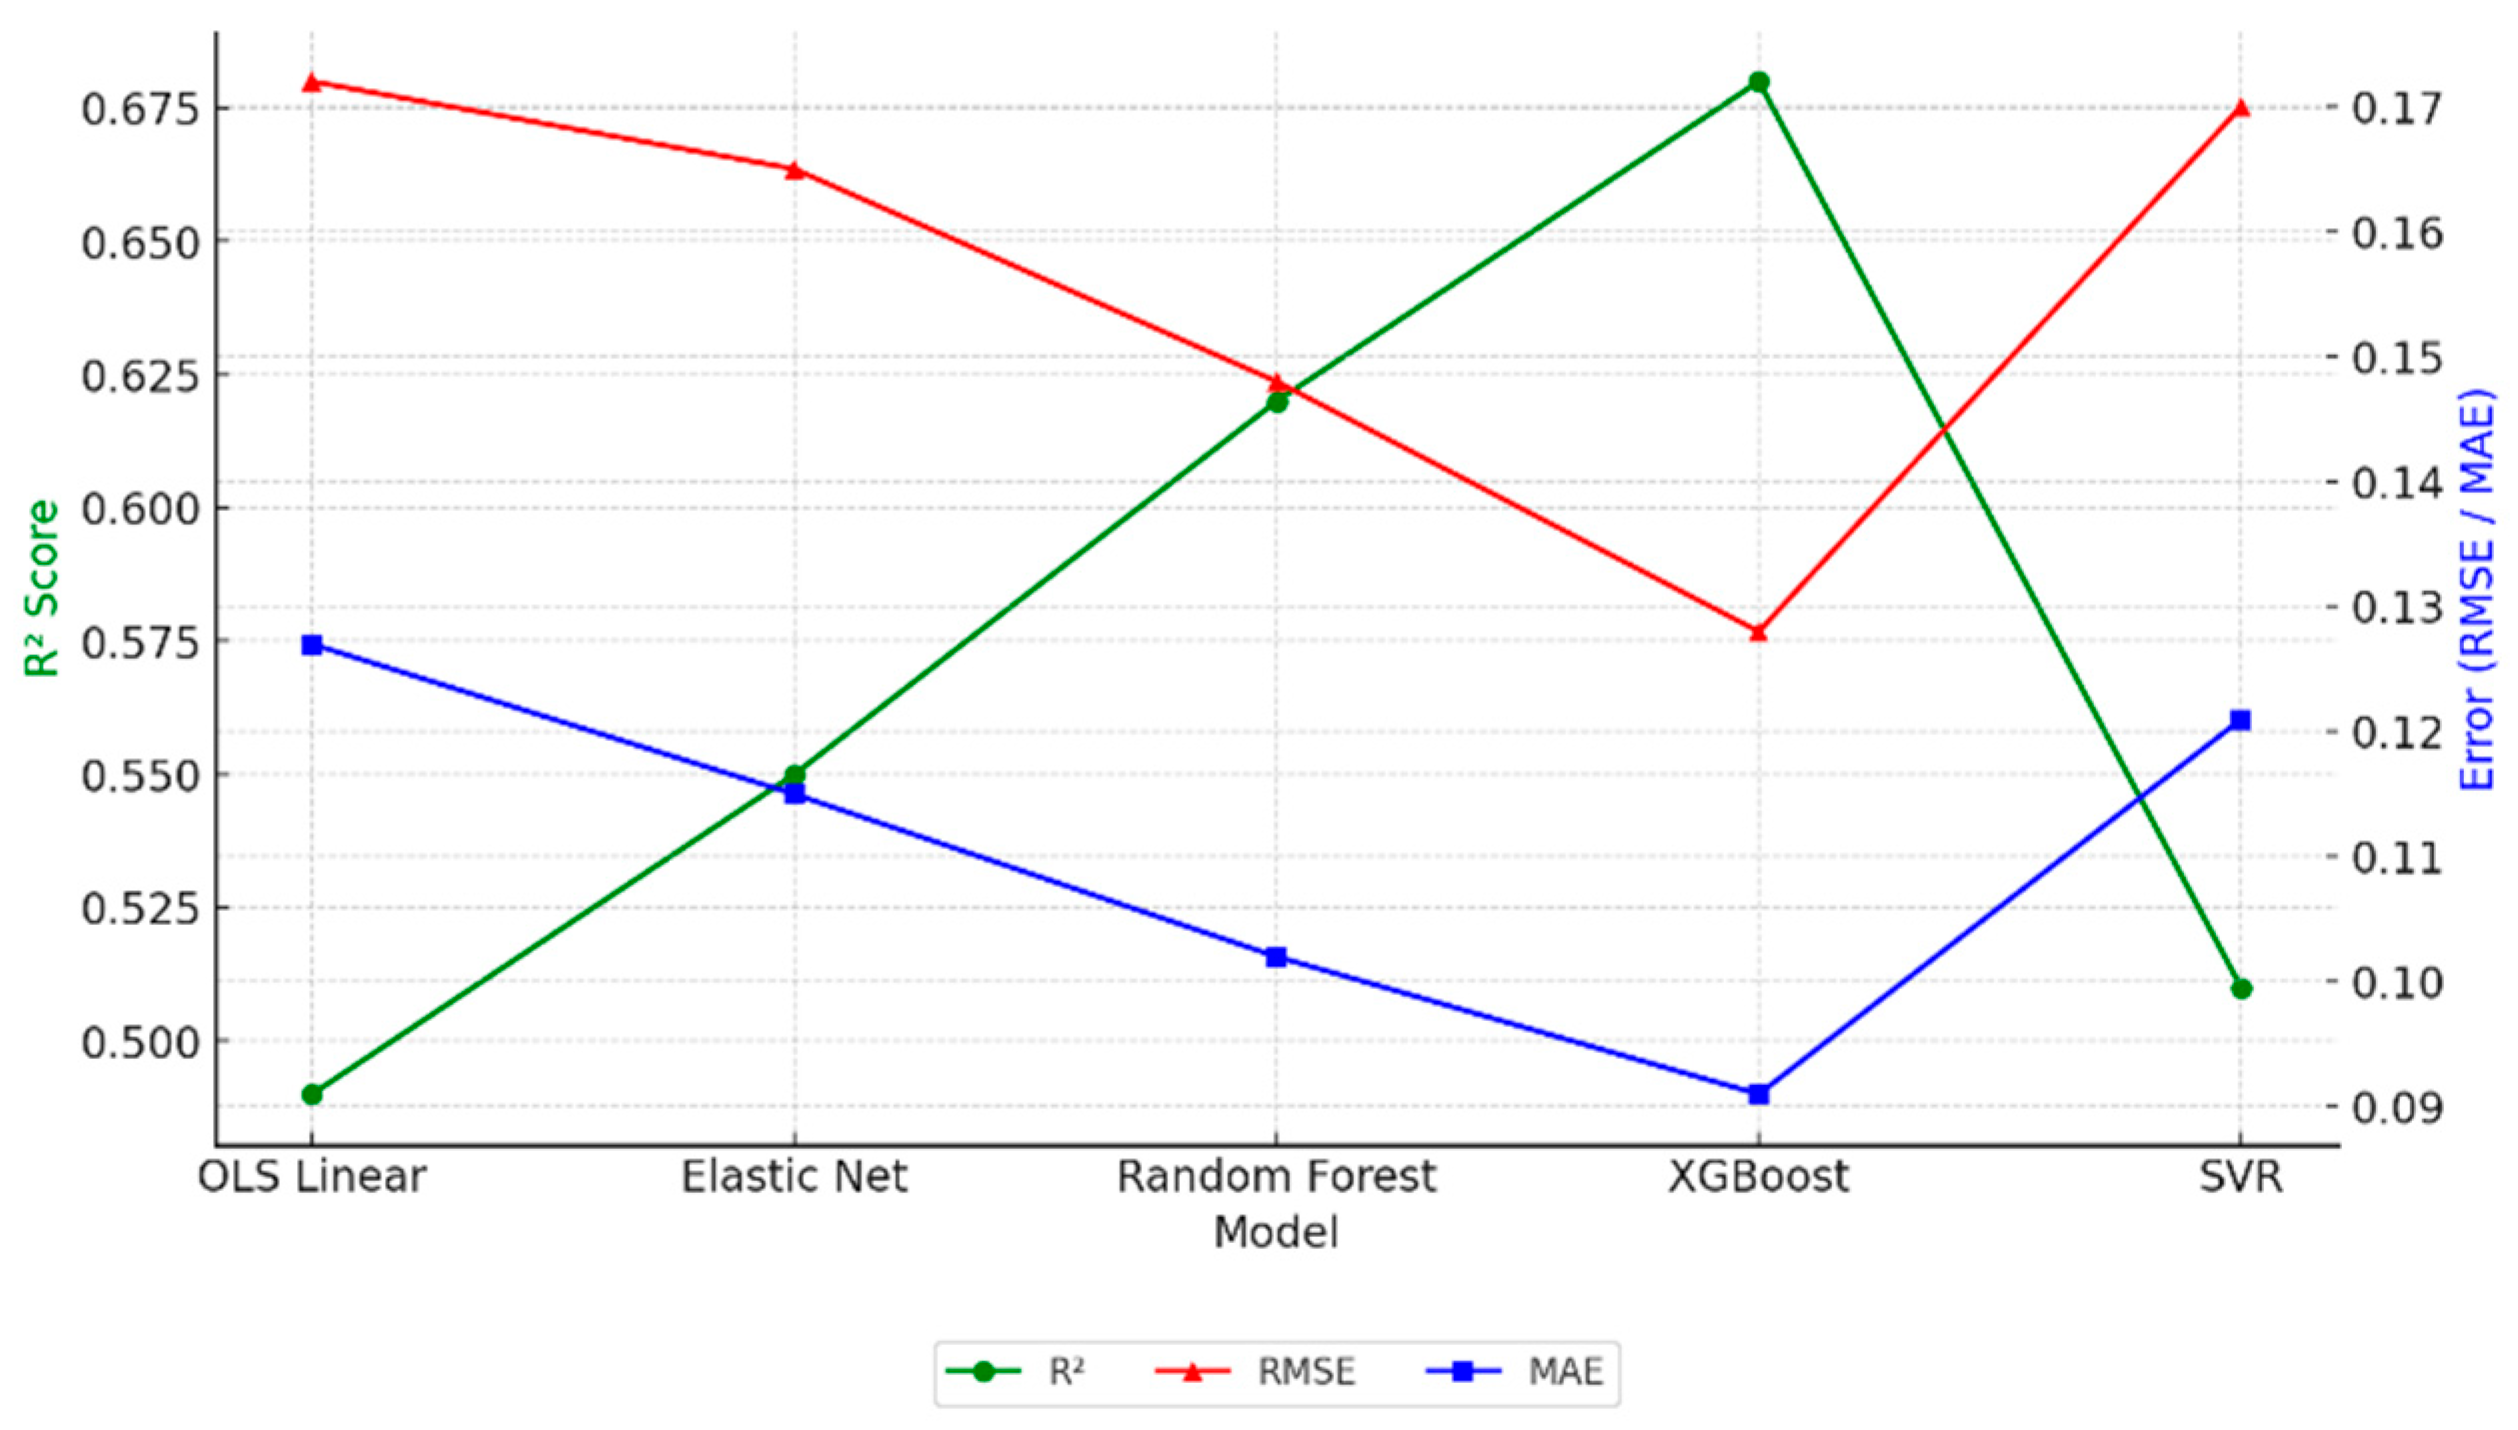
| Model | R2 (±95% CI) | RMSE (±CI) | MAE (±CI) | Statistical Significance | Test Used |
|---|---|---|---|---|---|
| OLS (Baseline 1) | 0.49 ± 0.03 | 0.172 ± 0.007 | 0.127 ± 0.006 | ||
| Elastic Net (Baseline 2) | 0.55 ± 0.02 | 0.165 ± 0.006 | 0.115 ± 0.005 | p = 0.041 vs. OLS | Paired t-test |
| Random Forest | 0.62 ± 0.02 | 0.148 ± 0.005 | 0.102 ± 0.004 | p = 0.003 vs. Elastic Net | Wilcoxon signed-rank |
| XGBoost | 0.68 ± 0.02 | 0.128 ± 0.004 | 0.091 ± 0.003 | p < 0.001 vs. RF and all others | Wilcoxon signed-rank |
| SVR | 0.51 ± 0.03 | 0.170 ± 0.008 | 0.121 ± 0.006 | p = 0.146 vs. OLS (Not significant) | Paired t-test |
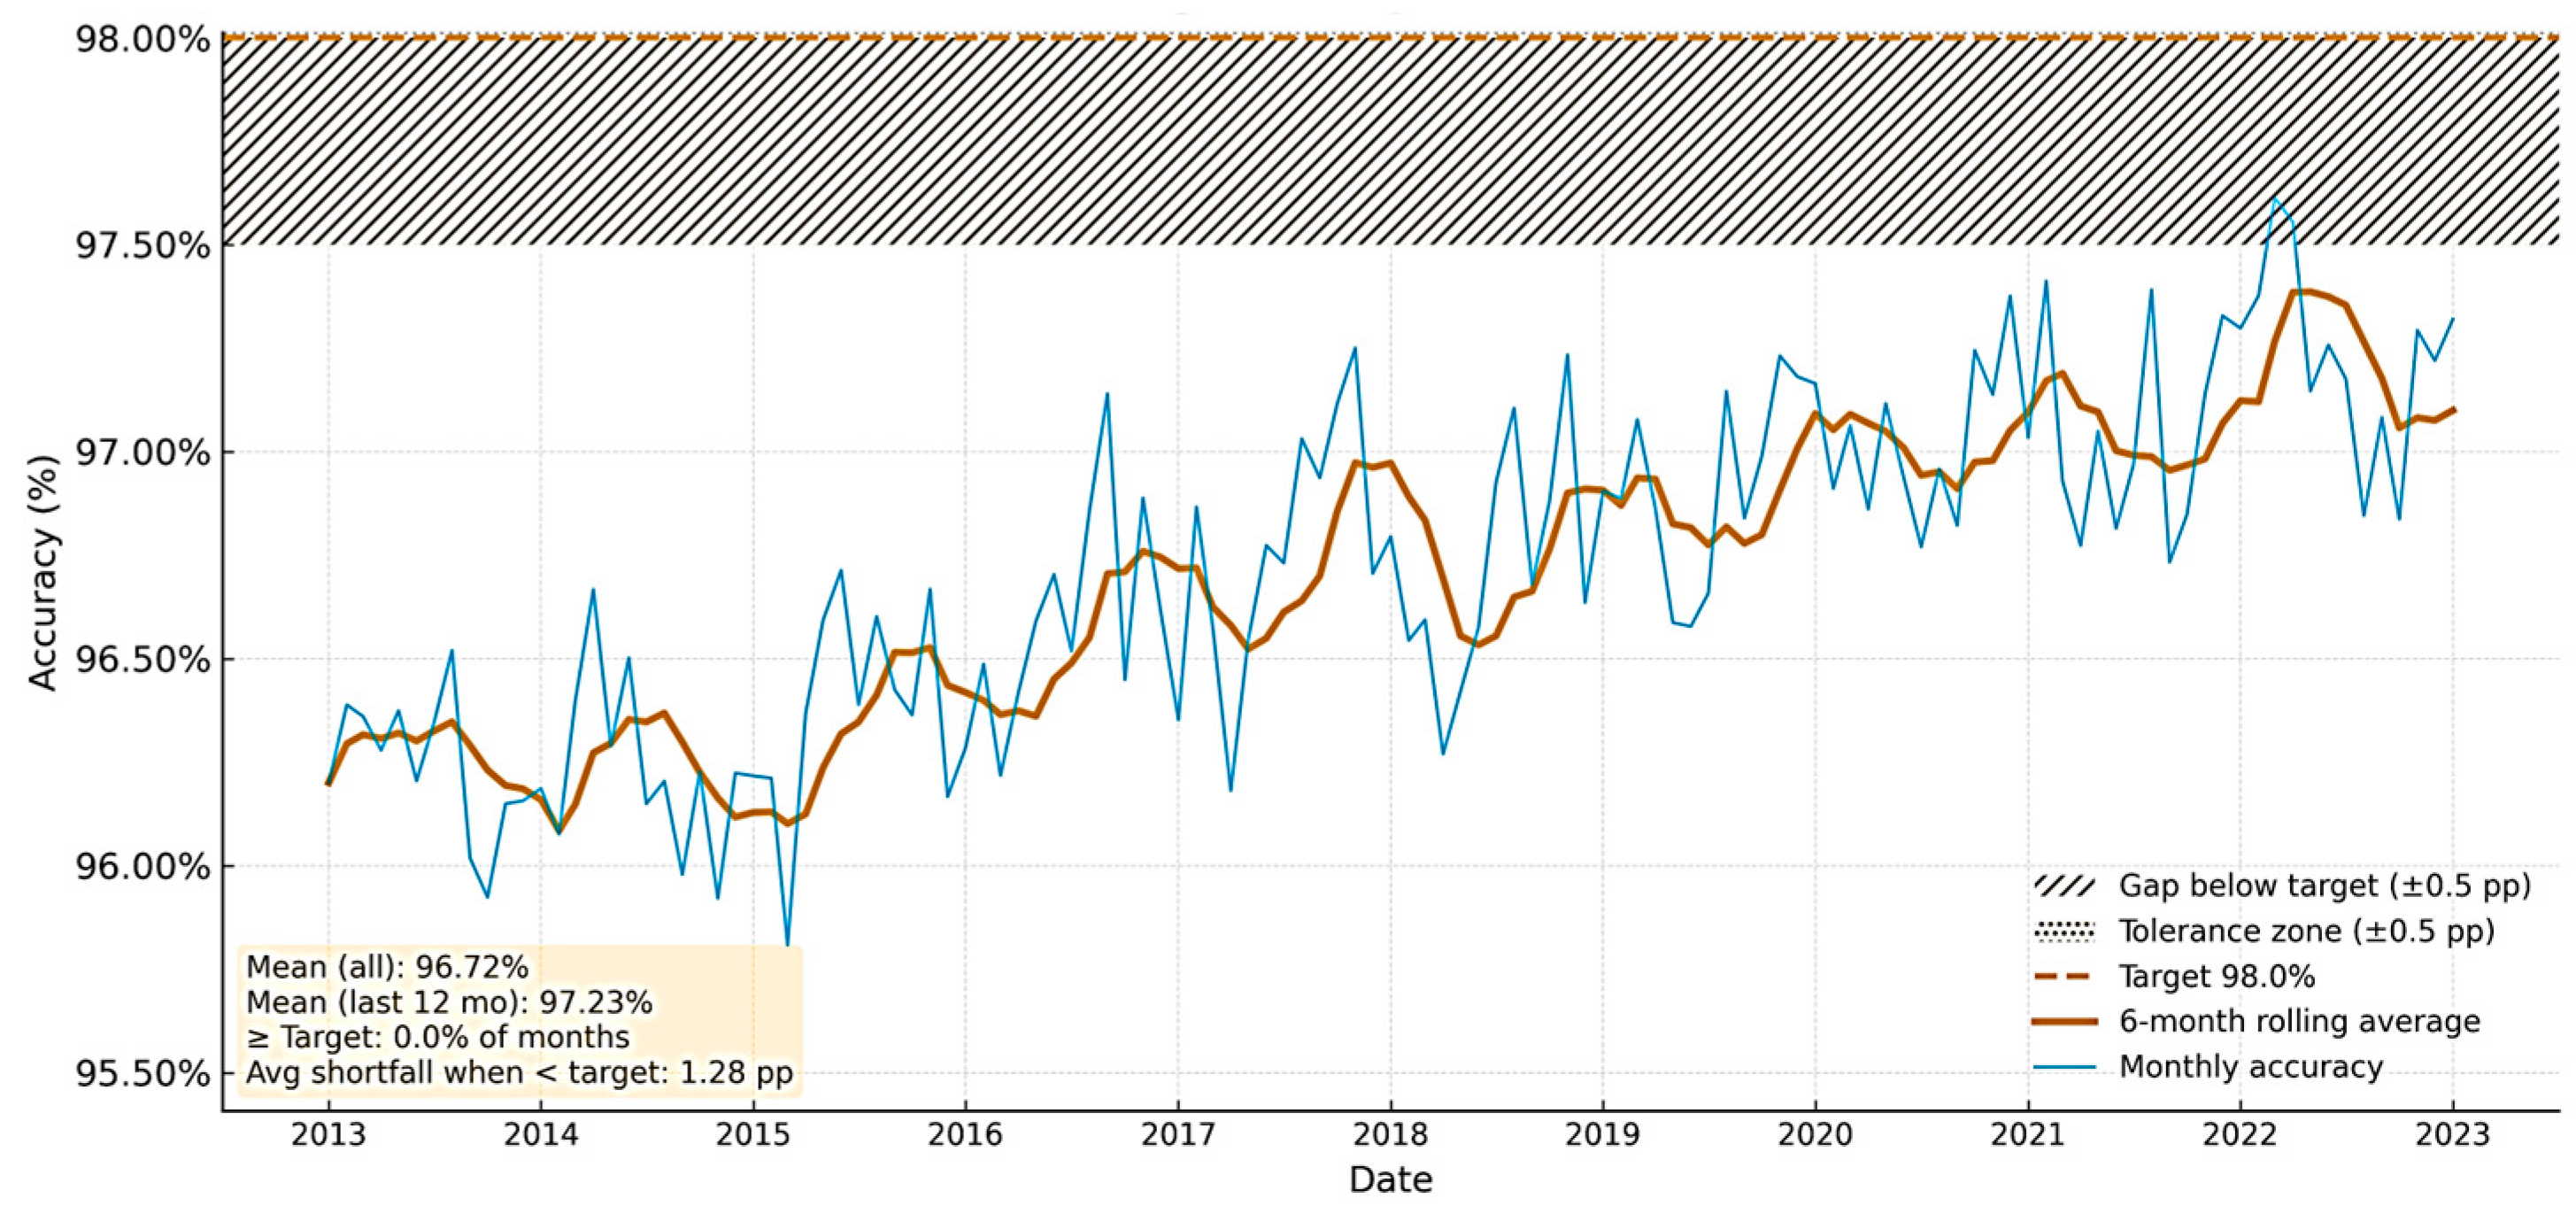
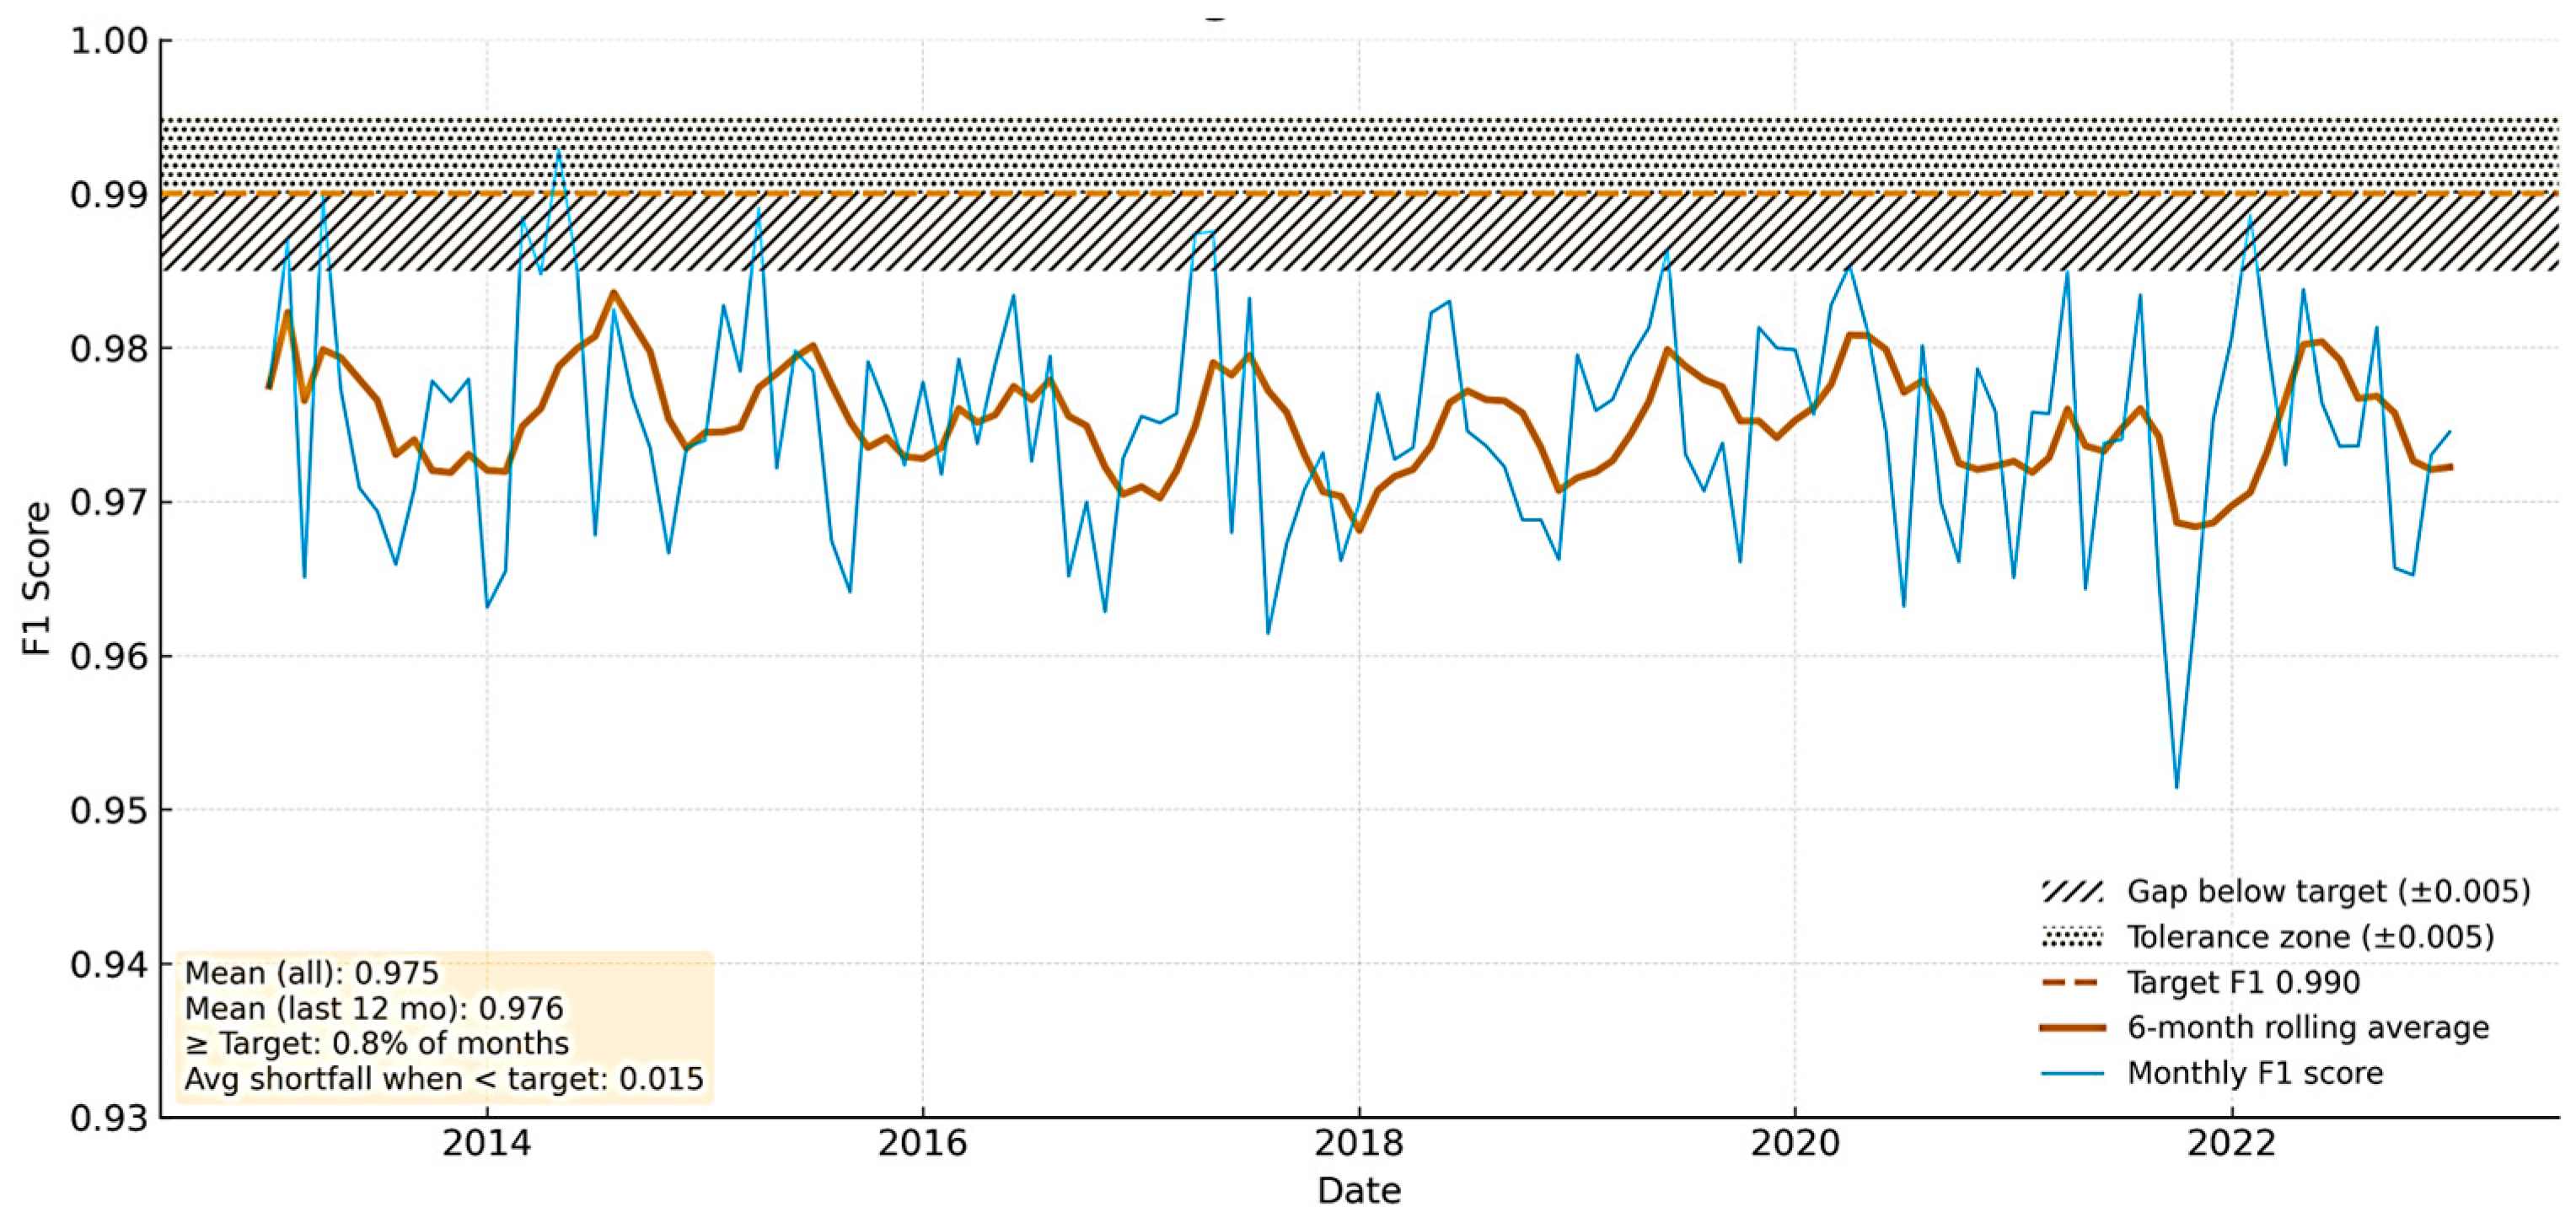
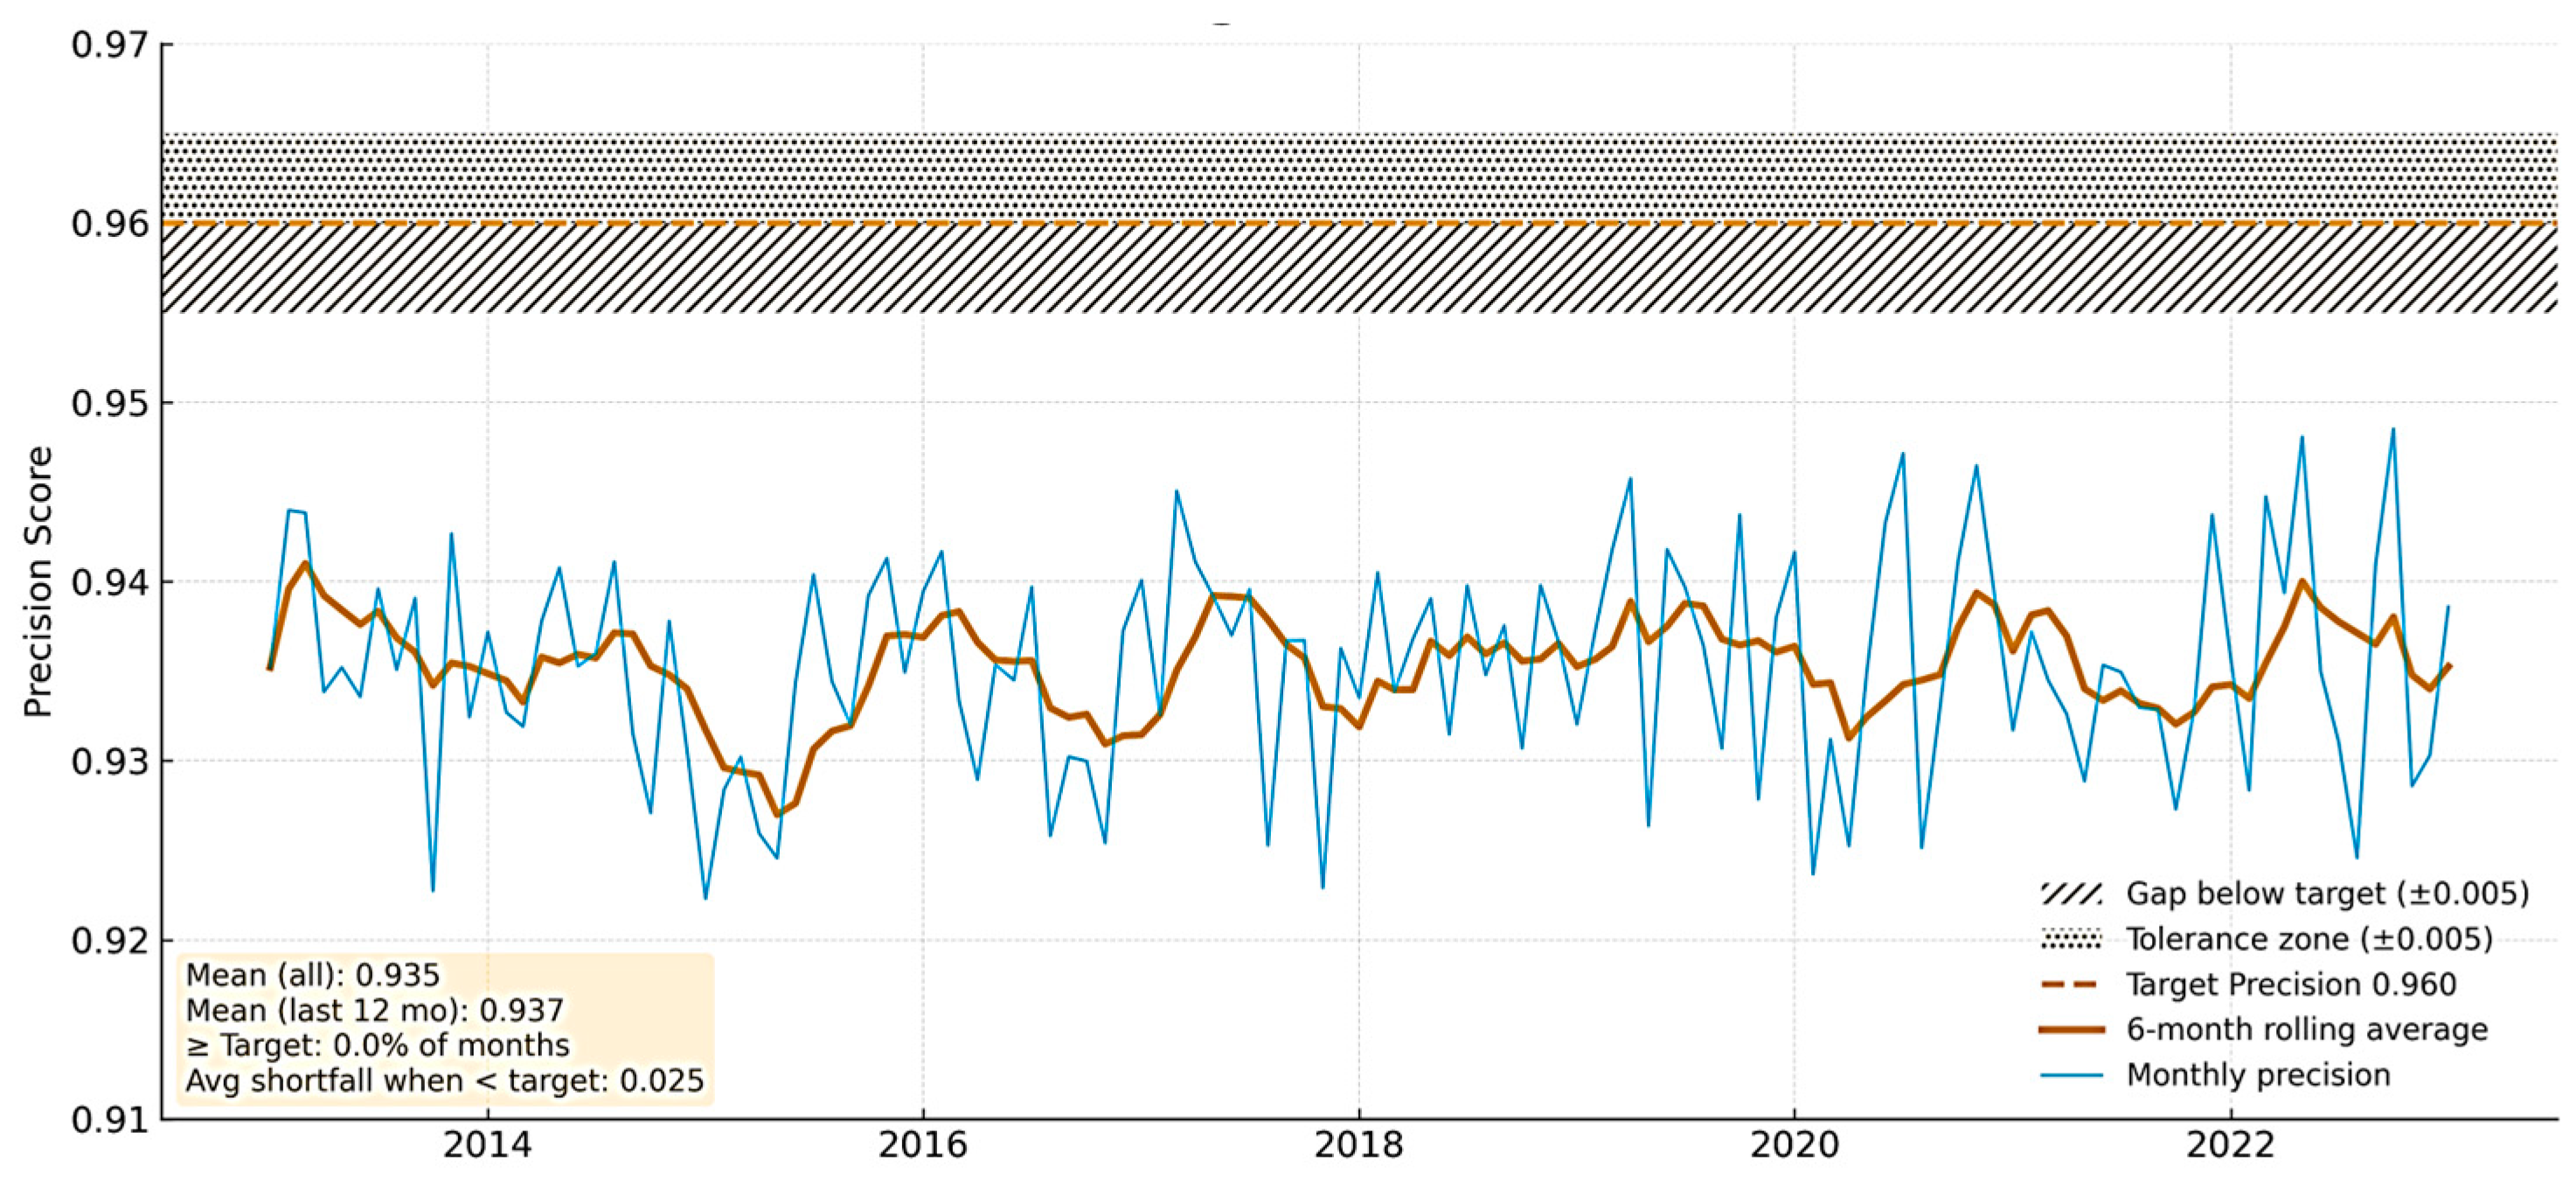
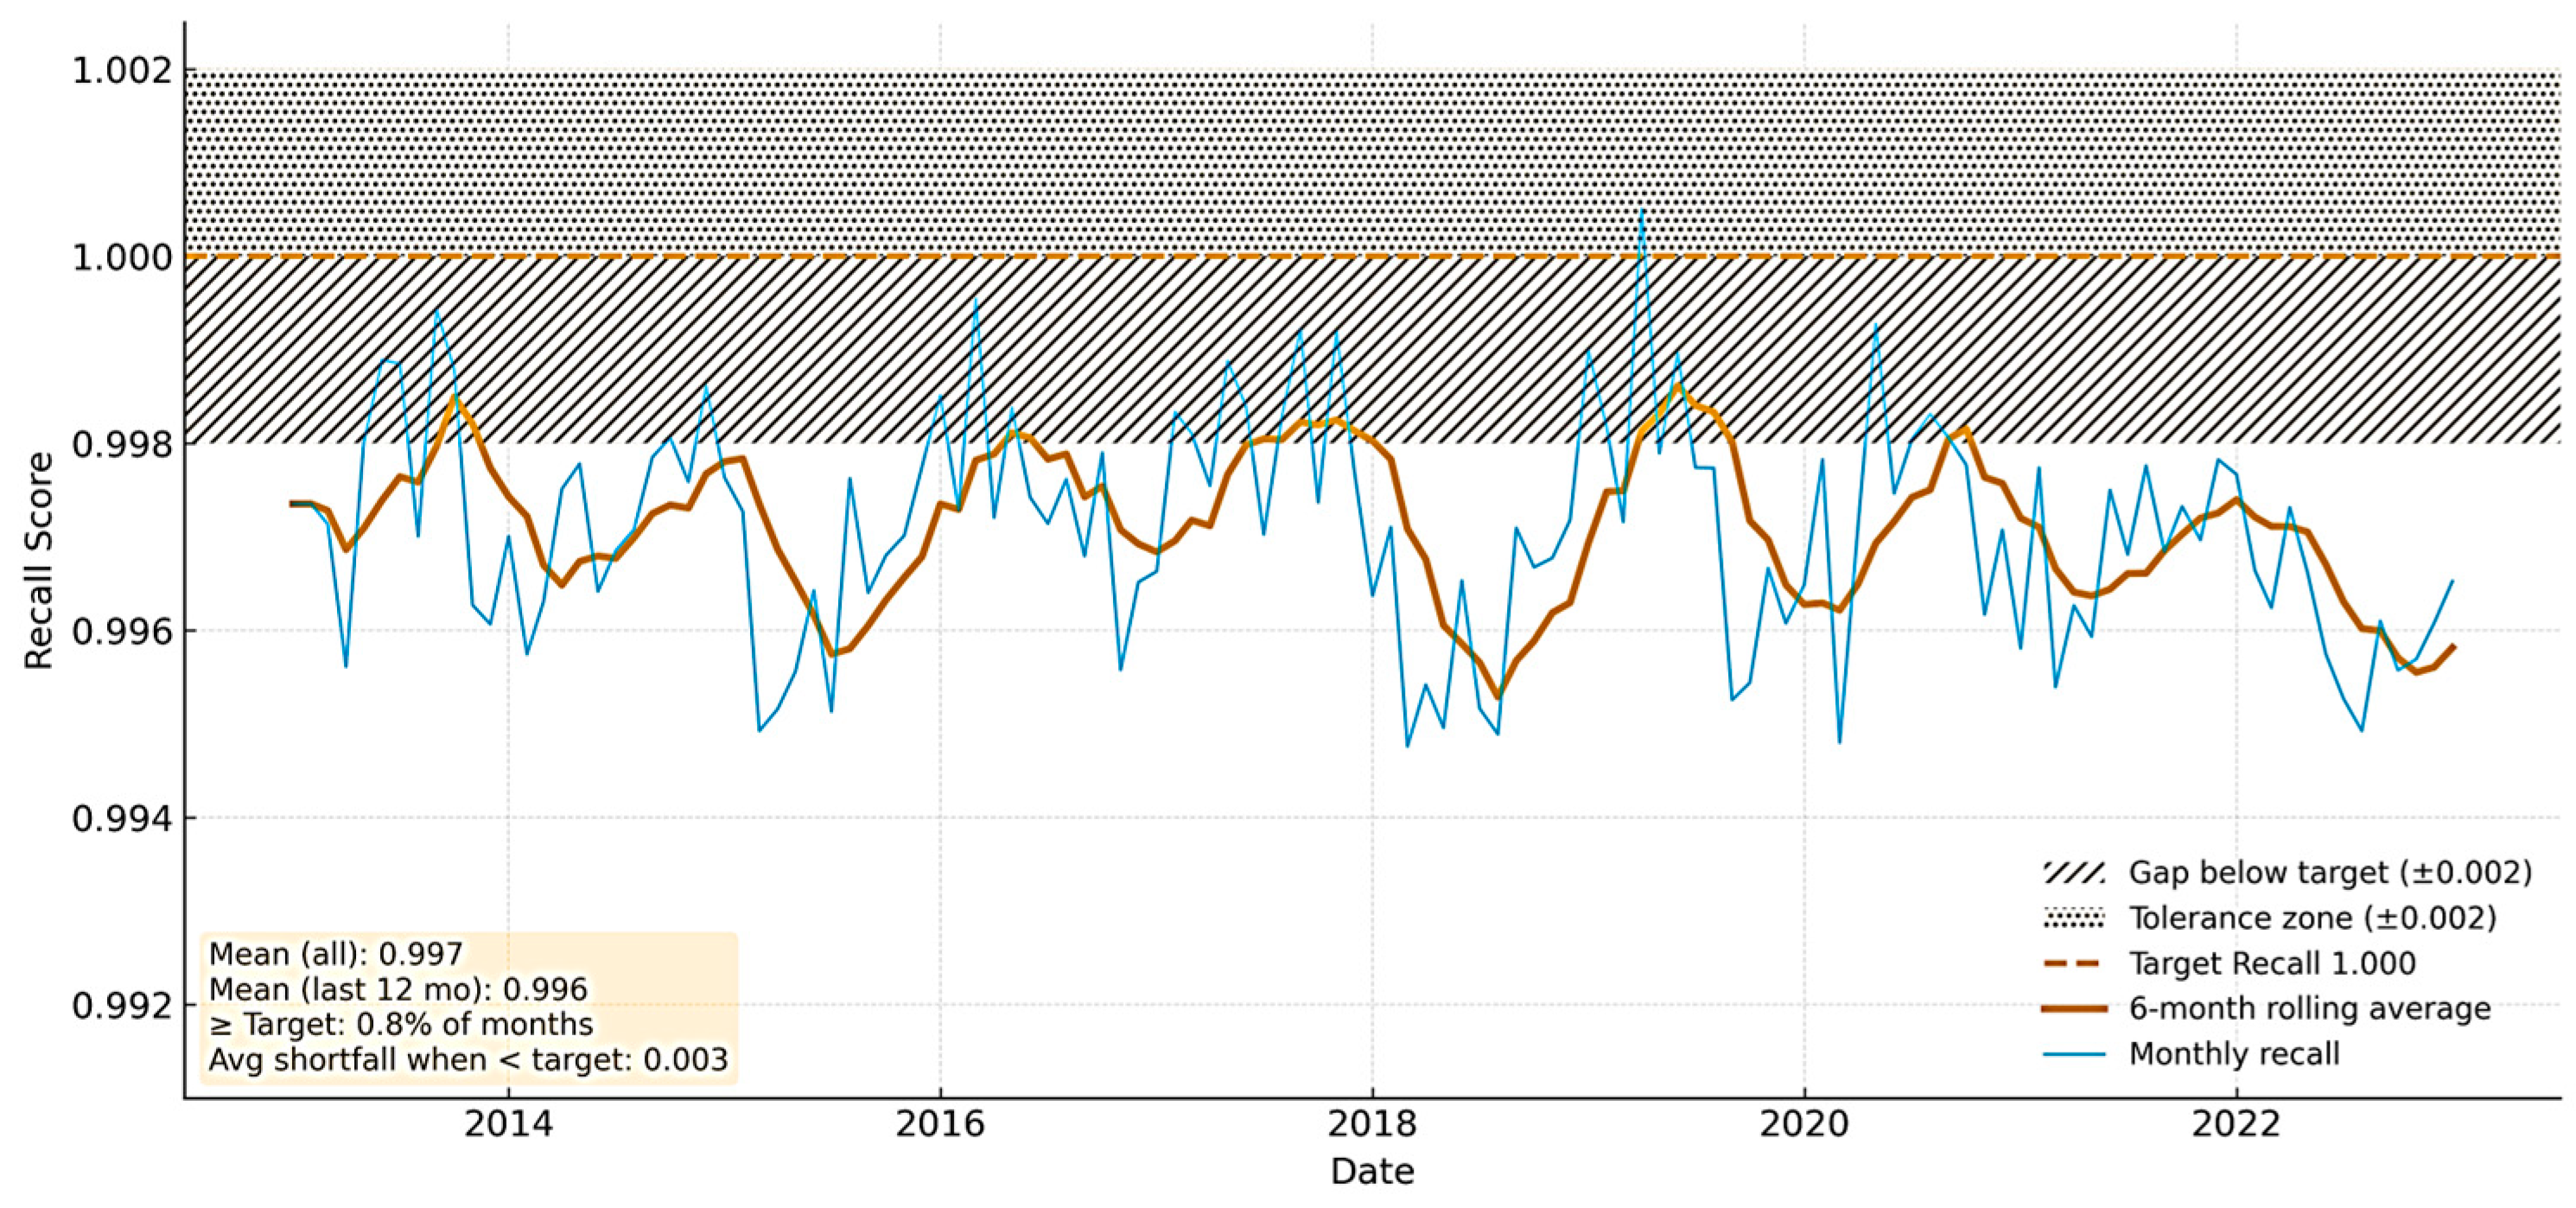
| Metric | XGBoost | Target | Gap |
|---|---|---|---|
| Accuracy | 96.8 ± 0.3% | ≥98.5% | +0.7 |
| F1 Score | 0.975 ± 0.01 | ≥0.99 | +0.01 |
| Precision (Class 1) | 0.935 ± 0.01 | ≥0.96 | +0.02 |
| Recall (Class 1) | 0.996 ± 0.00 | 1.00 | None |
| ROC-AUC | 0.987 ± 0.01 | >0.99 | None |
Disclaimer/Publisher’s Note: The statements, opinions and data contained in all publications are solely those of the individual author(s) and contributor(s) and not of MDPI and/or the editor(s). MDPI and/or the editor(s) disclaim responsibility for any injury to people or property resulting from any ideas, methods, instructions or products referred to in the content. |
© 2025 by the authors. Licensee MDPI, Basel, Switzerland. This article is an open access article distributed under the terms and conditions of the Creative Commons Attribution (CC BY) license (https://creativecommons.org/licenses/by/4.0/).
Share and Cite
Aruwaji, M.A.; Swanepoel, M.J. The Impact of AI-Integrated ESG Reporting on Firm Valuation in Emerging Markets: A Multimodal Analytical Approach. J. Risk Financial Manag. 2025, 18, 675. https://doi.org/10.3390/jrfm18120675
Aruwaji MA, Swanepoel MJ. The Impact of AI-Integrated ESG Reporting on Firm Valuation in Emerging Markets: A Multimodal Analytical Approach. Journal of Risk and Financial Management. 2025; 18(12):675. https://doi.org/10.3390/jrfm18120675
Chicago/Turabian StyleAruwaji, Michael Akinola, and Matthys J. Swanepoel. 2025. "The Impact of AI-Integrated ESG Reporting on Firm Valuation in Emerging Markets: A Multimodal Analytical Approach" Journal of Risk and Financial Management 18, no. 12: 675. https://doi.org/10.3390/jrfm18120675
APA StyleAruwaji, M. A., & Swanepoel, M. J. (2025). The Impact of AI-Integrated ESG Reporting on Firm Valuation in Emerging Markets: A Multimodal Analytical Approach. Journal of Risk and Financial Management, 18(12), 675. https://doi.org/10.3390/jrfm18120675


