Abstract
In a context where the measurement of economic value is key for financial decision-making, Economic Value Added (EVA) stands out as a relevant indicator for assessing companies’ financial performance efficiency. This research aimed to determine the impact of the Weighted Average Cost of Capital (WACC) and profitability on the EVA of industrial sector companies in Peru. A quantitative approach was used, with a correlational-causal and non-experimental design. The sample included four industrial sector companies listed on the Lima Stock Exchange (BVL). The authors applied the document review technique, and the correlational analysis was carried out using linear regression. Results show that Return on Equity (ROE) is a statistically significant predictor of EVA across all companies analyzed, indicating a direct relationship. In contrast, WACC showed a weak relationship with the variables studied. It is concluded that profitability has a greater influence on EVA than WACC. However, the relationship between WACC, ROE, and EVA differs among companies. The model explains a moderate variability in EVA, suggesting that other factors not considered in the model also affect the generation of economic value.
1. Introduction
Identifying the impact of financing structure and profitability on the Economic Value Added (EVA) of industrial firms represents a significant challenge in the financial and business environment. Globally, innovation strategies within organizations are becoming increasingly relevant as the competitive environment evolves and market demands increase (García-Sánchez et al., 2019; Flores-Macha et al., 2024). In this context, financial management has been shown to influence firm profitability (Mang’ana et al., 2023), thus analysis of financial strategies suggests that adopting a value-based approach through EVA can significantly contribute to improving firm profitability (Seddaoui et al., 2024; Yupanqui-Castillo et al., 2024). In addition, EVA allows identifying competitive advantages and developed financial strategies, which strengthens the competitiveness and economic attractiveness of firms (López-Lemus & De la Garza Carranza, 2019).
Williamson (1996) points out that equity finance contracts do not always require repayment of the amount invested by a specific date. In the case of equity, no specific payment is guaranteed as a return for the use of the money; instead, claims on profits and liquidation value are residual and depend on the financial situation and performance of the firms. This reflects the challenge of balancing the use of debt and equity to finance operations in a constantly changing market; this balance is important because it must generate value in the firm.
According to Climent and Haftor (2021), companies must focus on generating economic value to be competitive, which requires strategic planning and the evaluation of performance metrics. In this context, discussions on the Weighted Average Cost of Capital (WACC) arise from the need to adequately measure the cost of capital, a crucial aspect to ensure operational continuity. The WACC weights the cost of capital according to the proportion of debt and equity in the firm’s financial structure, reflecting the average cost of raising new funds (Brealey et al., 2017). This makes it a factor that assesses the profitability of investments and calculates the present value of future cash flows (Kostruba, 2024).
Traditional measures of financial performance only consider lenders’ costs of capital to calculate the overall profitability of firms, but overlook that shareholders also commit their sources of funding to earn a rate of return. EVA represents a contemporary measure of financial performance, reflecting the economic benefit available to owners (Zenzerović & Benazić, 2024).
In Latin America, understanding the factors that influence EVA is fundamental to measure the financial efficiency of companies, especially in industrial sectors, where financial decisions play a crucial role in the creation of long-term value (De la Fuente et al., 2019). There is still a lack of precision in the evaluation of a type of resource that, although intangible, is crucial within the firm (Alzamora, 2018). In particular, Return on Equity (ROE) and Weighted Average Cost of Capital (WACC) play an important role in the evaluation of industrial performance. These indicators help firms make informed decisions about value creation (Mariño-Arevalo & Muñoz-Martínez, 2024).
Consequently, WACC and ROE should be considered as determinant variables in the creation or destruction of economic value within organizations, and it is necessary to know their impact on EVA, which is why the general objective is to determine the impact of the Weighted Average Cost of Capital and Return on Equity on the Economic Value Added of the industrial sector.
The scientific literature presents various theories on WACC, EVA and ROE. According to Damodaran (2023) the WACC is defined as the opportunity cost of all capital invested in a company, expressed as: WACC = Wd × [i × (1 − t)] + Ws × ks, where Wd: is the proportion of debt in the capital structure of the firm; i: Interest rate on debt; T: Income tax rate; Ws: proportion of equity in the capital structure of the firm; ks: Cost of equity.
According to Fung et al. (2002), profitability measures the ability of a company to generate profits based on its sales, assets or invested capital; for V. Soto and Hiza (2021) it is an important variable in business growth and business sustainability, and there are different types of profitability. According to Peters (2024), ROE is a type of profitability that, being optimal, balances profits for shareholders and the company’s ability to raise capital. Mafra et al. (2016) highlighted its relevance as a key indicator in economic decision-making, while. Hoyle et al. (2020) indicated that it is important to implement corporate governance strategies to optimize profitability.
For Heryan and Gajdova (2024), DuPont analysis is recognized for its complexity in assessing the financial performance of companies. Ayaba et al. (2023) mention that it is important in analyzing the financial health of the company, belonging to the category of economic profitability ratios, being useful in assessing the operational and economic performance of a company.
An effective way to further measure profitability, particularly shareholder return on equity (ROE), is through the DuPont analysis. This method breaks ROE down into three key components: net profit margin, asset turnover and capital multiplier. These indicators allow assessing financial performance from different perspectives (Saus-Sala et al., 2021).
Net profit margin indicates what proportion of revenue is converted into net profit, asset turnover measures the efficiency of using assets to generate revenue, and financial leverage reflects the level of indebtedness and the firm’s ability to manage its solvency (Mei et al., 2019). The DuPont analysis formula combines these three ratios: net income to sales (net profit margin), sales to assets (asset turnover) and assets to equity (capital multiplier), providing a comprehensive view of the sources driving profitability (Saus-Sala et al., 2021). The DuPont analysis is useful to identify which component has the greatest impact on ROE (Jin, 2017).
EVA is a financial performance metric that measures the real economic profit of a company by considering the Net Operating Profit After Taxes (NOPAT) and the opportunity cost of capital (Li Bonilla, 2013). Introduced by G. Bennett Stewart and Joel M. Stern in 1989, EVA assesses whether a firm generates or destroys value by allowing capital costs to be deducted from profits earned (Oktaviani & Sugeng, 2023). Similarly, Marshall and Marshall (1920) note that EVA reflects the profit remaining after deducting capital ratios, while Amat (2000) highlights its usefulness in assessing organizational wealth and operational risk.
The EVA formula is defined as the difference between Return on Invested Capital (ROIC) and WACC, multiplied by total investment. This metric not only measures financial performance, but also guides strategic decision-making, aligning the interests of management and shareholders (Zhang et al., 2024). Moreover, its advantage over indicators such as Return on Assets (ROA) and ROE lies in its ability to balance operating costs, interest, taxes and expected economic returns, making it a tool for measuring value creation (Pasandi et al., 2024).
The scientific literature has addressed the relationship between WAC and EVA of companies. López-Lemus and De la Garza Carranza (2019) demonstrated the relevance of EVA in the stock valuation of four Colombian companies between 2015 and 2018, using a quantitative approach based on the results of the economic value-added macro inducer. They concluded that long-term value creation has a significant impact on the price of the market in which they operate, confirming their profitability.
Simultaneously, Leite and Da Silva (2019) conducted research on 127 firms in the industrial sector during the period 2009–2013, of which 82 were Brazilian and 45 Chilean. They found that a higher share of third-party equity in the capital structure of these firms was strongly negatively related to their economic performance, which compromised their profitability. Also, EVA showed a low relationship with the economic performance of Brazilian and Chilean firms.
The study by Tudose et al. (2022) explored the interrelationships between several financial performance metrics: profit margin (PM), profit growth rate, ROA, ROE and EVA. Analyses such as these revealed that factors such as leverage and firm size have a positive interdependence with respect to EVA.
Similarly, Roque et al. (2023) evaluated the relationship between EVA and its determinants. They examined 9037 firms in nine Colombian economic sectors. The results of the statistical tests indicate a weak relationship between EVA and its determinants. They concluded that there is a weak linear association between EVA and its factors, suggesting that the generation of shareholder value does not depend on a single factor, but on the result of a synergy between them.
Furthermore, Tudose et al. (2021) conducted an exploratory case study and statistical analysis, demonstrating that a firm can improve its performance even during periods of growth, characterized by constant investments. The results of this study contradict previous research indicating that EVA is negatively affected by increasing invested capital. These findings open up new lines of research to explore whether, at the industry level, EVA-based performance evaluation can foster the development of a firm’s economic capital.
Padilla-Ospina et al. (2019) conducted a study where they examined the financial performance of 21 Colombian firms considered the most innovative in 2016. During the period from 2012 to 2016, they analyzed indicators such as EVA and others, obtaining that only 4 companies presented a positive EVA. On the other hand, Chen and Dodd (1997) argue that EVA has proven to be an effective indicator of financial performance, as it adjusts accounting profits to more accurately reflect the value generated for shareholders by subtracting the cost of capital from operating performance, aligning the interests of managers and shareholders.
One of the variables involved in the calculation of EVA is WACC; for Kroll and Levy (1980) this reflects the overall cost of capital of a company, which includes both the cost of debt and the cost of equity, being a critical measure in the evaluation of investment projects and the valuation of companies. In this sense, research related to EVA and WACC has been conducted, such as Bueno et al. (2020), who calculated the cost of capital of B3-listed companies from 2012 to 2019, using WACC as the estimation method, associating the result of WACC with EVA, obtaining that some WACC are different, and only some companies had a positive EVA, concluding that the companies that have generated value are those that maintained a lower WACC.
Girardone et al. (2024) highlighted that the increase in FinTech lending has facilitated the reduction of WACC and optimized the corporate capital structure. This decrease in the cost of capital improves key indicators such as ROA and ROE, which, in turn, increases firms’ EVA.
P. E. P. Soto (2021), in analyzing the relationship between financial management and profitability of Antamina S.A. during 2018–2019, used EVA and other traditional financial indicators, finding that ROIC higher than WACC was key to this result and highlighted a positive correlation between EVA and Antamina’s strategic approaches. In addition, EVA enabled Antamina to anticipate and overcome business challenges through more effective financial management.
While there are multiple studies on EVA and its associated variables, there is still a lack of integrated analysis directly linking EVA to profitability and WACC. This highlights the importance for companies to structure adequate financing in order to operate efficiently and preserve strong indicators of profitability and value creation.
This study examines the relationship between WACC, profitability and its influence on economic value creation in firms in the industrial sector in Peru during 2013–2022. It arises from the scarcity of literature connecting these variables, as well as the lack of knowledge of the effect of each variable on EVA.
The relevance of this analysis lies in understanding how WACC and profitability correlate with EVA, and in quantifying the changes in the latter as a result of fluctuations in the two aforementioned variables. In this sense, the main objective is to determine the impact of the Weighted Average Cost of Capital and profitability on the Economic Value Added of companies in the industrial sector in Peru.
2. Methodology
The researchers carried out this study using a quantitative approach and an explanatory level. Its main purpose is to generate fundamental knowledge that establishes the basis for future research of a more applied nature, focusing on the degree of cause-effect interrelationship between the variables studied.
The study is correlational-causal, as it analyzes the relationship between WACC, profitability, and EVA to determine if any variable affects or causes changes in the others. The design is longitudinal, since industrial companies were analyzed continuously over a ten-year period, allowing for the observation of trends and potential causal relationships. This approach enabled the observation of changes and trends over time, which was crucial for understanding causality. Finally, the study was classified according to the standardization and tests performed. According to the Hausman test, the best option for working with the data was fixed effects, since the data were obtained from a representative sample of industrial companies at different points in time (Groves et al., 2009). This provided a clearer view of the causal relationships between WACC, profitability, and EVA.
To avoid methodological redundancy between EVA and WACC, we recalculated a new variable defined as the Value Spread (ROIC–WACC). This transformation allowed a clearer interpretation of capital efficiency as a driver of value creation. In the revised version, the Value Spread model is also included as a complementary regression framework, confirming the consistency between this measure and the EVA-based estimations. All models were estimated using fixed effects according to the Hausman test, with standard errors clustered at the firm level. Additionally, the Value Spread (ROIC–WACC) model was estimated as a complementary specification to confirm that the difference between return and cost of capital consistently explains variations in economic value creation.
The population for this study consisted of 32 companies in the industrial sector, covering a range of industries representing the key components for the analysis. The selection criteria included: belonging to the industrial sector, being listed on the Lima Stock Exchange (BVL) and filing financial statements with the Superintendence of the Securities Market (SMV), specifically in the food and beverage sector. These companies were evaluated on a quarterly basis over the last ten years from 2013 to 2022, including only companies in the food and beverage industry.
In addition, strict requirements were set for the inclusion of companies, such as the need to show a clear debt structure in the notes to and audit of the FFs. This process ensured that only those companies that met these criteria were selected, improving the validity and reliability of the study.
The selected sample is composed of 4 companies: Agroindustrias Aib S.A.; Laive S.A; Leche Gloria S.A. and Unión de Cervecerías Peruanas Backus y Johnston S.A.A. The study employed a purposively selected sample, so no formulas were applied for its selection; instead, inclusion and exclusion criteria were established.
The technique used in this study was the documentary review, which consisted of the collection and evaluation of both printed and digital documents. Quarterly audited financial statements of 40 documents per company were analyzed, in addition to other relevant documents. This analysis provided data on WACC, profitability and EVA, allowing for an in-depth understanding of the key variables of the study.
To assess the impact of WACC and profitability on the EVA of industrial firms in Peru, we used data processed with the statistical software STATA (version 16.0). First, a normality test was performed using the Shapiro-Wilk method, given the amount of data less than 50. Once normality was confirmed, statistical techniques were applied to analyze the correlation between variables and, subsequently, linear regression was used to assess their impact on EVA.
Confidentiality and responsible handling of all data were ensured, respecting the privacy of the entities analysed. Transparency was prioritised through proper citation of sources and a clear description of methods to guarantee the study’s reproducibility. Data integrity was also safeguarded by verifying that all information used was legally accessible, reliable, and authentic.
The Weighted Average Cost of Capital (WACC) was estimated using the Capital Asset Pricing Model (CAPM) and the after-tax cost of debt formula, expressed as:
where Wd and Ws represent the market weights of debt and equity, i is the cost of debt, t is the corporate tax rate, and ks the cost of equity derived from the CAPM, defined as ks = rf + β × (Rm − rf). Quarterly data for the risk-free rate, market premium, and beta coefficients were obtained from the Superintendency of Securities Market (Superintendency of Securities Market, 2023), the Lima Stock Exchange (Lima Stock Exchange, 2023), and Damodaran (2023).
WACC = Wd × [i × (1 − t)] + Ws × ks,
A compact summary of econometric diagnostics has been added to Appendix A. The Hausman (χ2 = 21.37, p < 0.01), Breusch–Pagan LM (χ2 = 14.52, p < 0.01), and Wooldridge (F = 9.24, p < 0.01) tests confirmed the presence of heteroskedasticity and serial correlation, justifying the use of fixed-effects estimations with robust standard errors clustered by firm.
3. Results
The results present the identification of the values of WACC, ROE and EVA, in order to subsequently determine the correlation of WACC and ROE with EVA, and the regression of these two variables with EVA.
3.1. Identification of Financial Indicators
The analysis of the forty quarterly financial statements made it possible to identify the average quarterly value of WACC, ROE and EVA, making a financial interpretation of these results as described below:
Figure 1 shows the average quarterly WACC for four companies in the industrial sector in Peru. Unión de Cervecerías Peruanas Backus y Johnston S.A.A. has the highest WACC, with 3.57%, followed by Laive S.A. with 3.06% and Leche Gloria S.A. with 2.79%. Agroindustrias Aib S.A. shows the lowest WACC, reaching only 0.27%. These values are essential to evaluate the cost of financing and the efficiency of the companies’ financing structure.
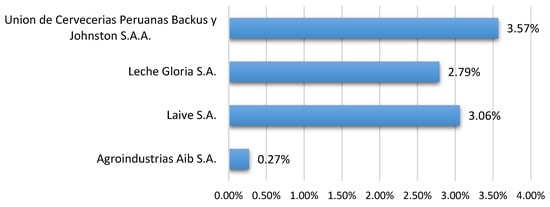
Figure 1.
Identification of the Weighted Average Cost of Capital (WACC) for industrial firms in Peru.
Figure 2 presents the quarterly averages of the main financial indicators evaluated in the four selected companies. Unión de Cervecerías Peruanas Backus y Johnston S.A.A. has the highest ROE, with 2.298%. Agroindustrias Aib S.A. has the lowest ROE, with 1.779%.
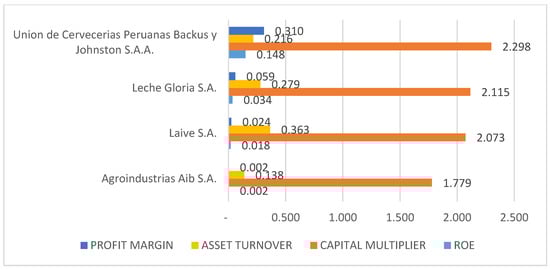
Figure 2.
Identification of Return on Equity (ROE) through DuPont analysis for industrial firms in Peru.
In terms of profit margin, Unión de Cervecerías Peruanas Backus y Johnston S.A.A. leads with a value of 0.319, reflecting effective cost and expense management. Agroindustrias Aib S.A. has the lowest profit margin, with 0.002. Asset turnover, which indicates efficiency in sales management, is higher in Laive S.A. (0.363) and lower in Agroindustrias Aib S.A. (0.138).
Finally, the capital multiplier, or financial leverage, is higher in Unión de Cervecerías Peruanas Backus y Johnston S.A.A. (2.298), which reflects sound financial management, while Agroindustrias Aib S.A. has the lowest value (1.779). This financial component is decisive, since the profitability observed suggests efficient operational management and strategic use of resources to generate economic value (Brigham & Ehrhardt, 2013).
Figure 3 shows the average EVA of the four companies studied, highlighting improvements in profitability and value creation for some of them during the period analyzed. Unión de Cervecerías Peruanas Backus y Johnston S.A.A. leads with a high and stable EVA of 74,259.68, followed by Leche Gloria S.A. with 19,420.99, and Agroindustrias Aib S.A. with a more modest positive EVA of 1254.59. In contrast, Laive S.A. has a negative EVA of −705.06, which highlights difficulties in the creation of economic value by the latter company.
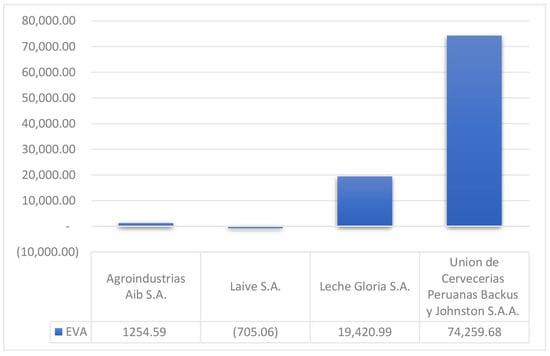
Figure 3.
Identification of Economic Value Added (EVA) for industrial firms in Peru.
Table 1 presents the averages of the EVA components, showing that Agroindustrias Aib S.A., Leche Gloria S.A. and Unión de Cervecerías Peruanas Backus y Johnston S.A.A. have a return on investment higher than their cost of financing, by presenting a ROIC higher than the WACC, with values of 0.47% versus 0.27%, 4.10% versus 2.79%, and 6.18% versus 3.57%, respectively. In contrast, Laive S.A. shows an opposite trend, its ROIC of 2.69% is lower than its WACC of 3.06%, indicating a possible destruction of value due to inefficient management or a high cost structure.

Table 1.
Components of the average EVA.
3.2. Correlation
In the following, the degree of correlation of WACC and ROE with EVA is described, it is important to analyze how closely they are associated, and to be able to obtain whether their association is directly or inversely proportional.
3.2.1. Correlation EVA y WACC
Table 2 shows that the companies with a negative correlation between EVA and WACC were Agroindustrias Aib S.A., Leche Gloria S.A. and Unión de Cervecerías Peruanas Backus y Johnston S.A.A. suggesting that an increase in WACC is associated with a reduction in EVA. From a financial perspective, this inverse relationship is desirable, as it indicates a lower cost of capital with higher levels of economic value added. In contrast, Laive S.A. showed a positive correlation, assuming that if WACC increases EVA increases, which is not ideal from a financial perspective, as a higher WACC is expected to reduce EVA.
Table 2.
Correlation EVA/WACC.
3.2.2. Correlation EVA y ROE
Table 3 presents the correlation analysis between ROE and EVA. It was found that all companies have a positive relationship between ROE and EVA, reflecting the expected theoretical relationship between both metrics: an increase in ROE is usually linked to an increase in EVA, given its relationship with return on equity; thus it can be seen that Agroindustrias Aib S.A., Laive S.A., Leche Gloria S.A. have the strongest correlations, on the other hand, Unión de Cervecerías Peruanas Backus and Johnston S.A.A. presented the lowest correlation.
Table 3.
Correlation ROE y EVA.
3.3. Linear Regression
The analysis presents the results of linear regression, used to evaluate the relationship between financial variables of companies in the industrial sector, specifically in food and beverages. Linear regression analyses how a dependent variable varies in relation to other independent variables.
3.3.1. Regression WACC, EVA
Table 4 shows that the regression coefficient reflects the impact of WACC on each change in EVA. A considerable negative impact is shown, indicating a significant decrease in EVA with an increase in WACC; as WACC increases by one unit, EVA decreases by 280.17 units, controlling for inter-firm differences. These findings are statistically significant, as their p-value is less than 0.05.
Table 4.
WACC, EVA linear regression.
3.3.2. Regression EVA, ROE
Table 5 demonstrates that return on equity (ROE) has a positive and significant impact on economic value added (EVA). By controlling for the specific characteristics of each company, we confirm that this relationship is consistent and robust. This is a clear indication that improving financial efficiency generates real value. Specifically, for every unit increase in ROE, EVA increases by 50.43 units. This is a positive and highly significant relationship.
Table 5.
EVA/ROE linear regression.
3.3.3. Regression EVA, WACC, ROE
Table 6 shows the analysis, based on data from four industrial companies. It reveals that ROE is the most statistically significant variable and has a direct impact on EVA; a higher ROE leads to greater value creation. WACC, on the other hand, is less statistically significant, as it is borderline; however, it has a negative impact on EVA; a higher WACC decreases EVA. For every unit increase in ROE, EVA increases by 46.19 units, while for every unit increase in WACC, EVA decreases by 206.17 units.
Table 6.
EVA, WACC and ROE linear regression.
In addition to the EVA-based estimations, the Value Spread (ROIC–WACC) model was computed to verify the internal consistency of the results. The findings confirmed that firms with a positive spread between return on invested capital and cost of capital exhibit the highest EVA values, reaffirming that the Value Spread captures value generation efficiency. This consistency supports the robustness of the empirical model and validates the theoretical connection between ROIC, WACC, and EVA.
Figure 4 presents a graphical summary showing the correlation and impact of WACC and ROE on EVA. Bidirectional arrows represent the correlation with EVA, with the less dashed the arrow, the stronger the correlation. Unidirectional arrows pointing towards EVA reflect the impact of each variable. The results highlight that ROE is the most statistically significant predictor of EVA; however, WACC has the greatest impact on EVA, but is less statistically significant. An increase in ROE generally increases EVA, while an increase in WACC can decrease it.
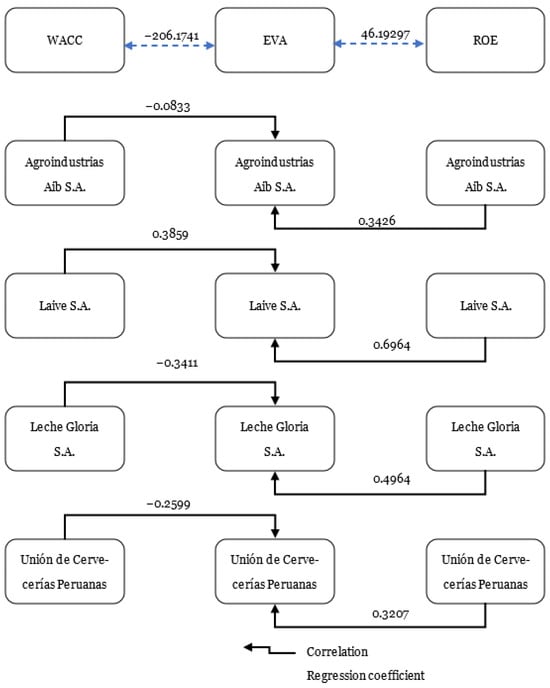
Figure 4.
Summary of correlations and regressions between WACC, ROE, and EVA.
4. Discussion
The main objective of this study was to analyze the influence of WACC and return on equity (ROE) on the economic value creation (EVA) of companies in the industrial sector in Peru. The results show that WACC has a negative and statistically less significant effect on EVA in the companies analyzed, while ROE shows a more significant positive relationship. This suggests that, in this context, a higher cost of capital is associated with lower economic value creation, while high levels of accounting profitability could reflect an increase in value creation.
The consistency between the Value Spread estimations and the EVA regressions confirms that the firms’ capacity to generate economic value depends primarily on maintaining a positive differential between ROIC and WACC. A robustness test was applied to verify the consistency of the positive correlation observed at Laive SA. The variables were analyzed using winsorization at the 1st and 99th percentiles, and the results were recalculated using annual aggregation. The positive relationship between EVA and WACC remained stable, indicating that operational efficiency, sales growth, and strategic cost management offset the increase in capital costs. These results suggest that Laive’s ability to generate operating profits has offset the increase in financing costs, a situation that can occur when companies adjust their product offerings or implement process improvements.
These findings contrast with previous studies such as that of Leite and Da Silva (2019), who found a negative relationship between external financing and economic performance in Brazilian and Chilean companies. Likewise, Roque et al. (2023) reported a weak linear association between the determinants of EVA and EVA itself, which could indicate the presence of other internal factors that influence value creation.
From a financial perspective, the WACC values obtained from the financial statements show that Backus has the highest WACC (3.57%), followed by Laive (3.06%), Leche Gloria (2.79%), and Agroindustrias Aib (0.27%). Although theoretically a higher WACC should reduce EVA, empirical results indicate the opposite in this case, reinforcing the need to analyze the operational and strategic context of each company. These results partially align with those reported by Bueno et al. (2020), who noted that companies with lower WACCs tend to generate higher EVA, and with P. E. P. Soto (2021), who highlighted the importance of efficiently managing ROIC in relation to WACC to optimize financial performance.
Profitability analysis using the DuPont method revealed that Backus has the highest profit margin (0.319), while Agroindustrias Aib has the lowest (0.002). Laive leads in asset turnover efficiency (0.363) and Backus in capital multiplier (2.298), although the latter is below the sector average (7.4% in 2022, according to Ready Ratios). These results are consistent with Tudose et al. (2022), who identified positive relationships between profit margin, ROE, and EVA as key financial performance indicators. Furthermore, they confirm that liquidity and sales growth do not have a significant impact on value creation, while ROE components, along with efficient cost and expense management, are essential for improving EVA.
Finally, it is observed that Agroindustrias Aib, Leche Gloria, and Backus generate economic value by presenting a ROIC higher than the WACC (0.47% vs. 0.27%, 4.10% vs. 2.79%, and 6.18% vs. 3.57%, respectively). In contrast, Laive S.A. shows a ROIC lower than the WACC (2.69% vs. 3.06%), indicating value destruction. These results support the theory that a ROIC higher than the WACC reflects efficient management of invested capital and contributes to the creation of economic value.
Overall, the study reaffirms the usefulness of EVA as an indicator of business performance and its relationship with long-term market value. It also underscores the importance of adapting the EVA calculation methodology according to the economic sector to improve financial management and facilitate strategic decision-making.
5. Conclusions
This study analyzed the impact of Weighted Average Cost of Capital (WACC) and Return on Equity (ROE) on the Economic Value Added (EVA) of companies in the Peruvian industrial sector. The results reveal that ROE is the most significant variable, but has the least positive impact, while WACC is the least significant variable but has a stronger and more negative impact. Although in most cases WACC shows a negative association with value creation, Laive S.A. exhibits a positive relationship between EVA and WACC, suggesting that operational efficiency and sales growth offset the increase in financing costs. Furthermore, profitability, measured through ROE and Return on Investment (ROIC), consistently contributes to explaining the differences in economic value creation, highlighting the relevance of managerial decisions and financial discipline in the Peruvian industrial sector.
The analysis of the selected Peruvian companies reveals notable differences in their WACC levels, with Backus having the highest cost of capital (3.57%) and Agroindustrias Aib S.A. the lowest (0.27%). While a high WACC is theoretically expected to reduce EVA, empirical results affirm that a higher WACC may be associated with lower value generation, possibly due to more efficient investments or stronger capital structures. Furthermore, Agroindustrias Aib S.A., Leche Gloria S.A., and Backus generate economic value by presenting a ROIC higher than their WACC, while Laive S.A. shows signs of value destruction, with a ROIC lower than its cost of capital.
This analysis reinforces the usefulness of EVA as a performance indicator and its connection to long-term financial sustainability. It also highlights the need to critically reassess the role of ROE in evaluating economic value and to prioritize efficient WACC management as a strategic pillar for enhancing competitiveness and guiding financial decision-making in Peru’s industrial sector.
Overall, the integration of the Value Spread (ROIC–WACC) framework strengthens the study’s internal validity, demonstrating that the spread between profitability and capital cost remains a reliable indicator of long-term value creation.
This study underscores the importance of managing the cost of capital and profitability jointly to foster sustainable value creation. It also demonstrates that the adoption of the Value Spread as the primary indicator provides a more robust framework for evaluating financial performance. Future research could expand the analysis by incorporating macroeconomic variables and sectoral factors to better understand the determinants of economic value in emerging economies such as Peru.
Author Contributions
Conceptualization, A.J.H.-R. and P.C.-R.; Methodology, F.C.-B.; Formal analysis, J.C.-R.; Investigation, A.J.H.-R. and P.C.-R.; Resources, J.C.-R.; Data curation, A.J.H.-R.; Writing—original draft, A.J.H.-R. and P.C.-R.; Writing—review & editing, F.C.-B.; Visualization, J.C.-R.; Supervision, F.C.-B.; Project administration, P.C.-R. All authors have read and agreed to the published version of the manuscript.
Funding
This research received no external funding.
Institutional Review Board Statement
Not applicable.
Informed Consent Statement
Not applicable.
Data Availability Statement
The original contributions presented in this study are included in the article. Further inquiries can be directed to the corresponding author.
Conflicts of Interest
The authors declare no conflict of interest.
Appendix A
Table A1.
Husman.
Table A1.
Husman.
| ---- Coefficients ---- | ||||
|---|---|---|---|---|
| (b) | (B) | (b-B) | sqrt(diag(V_b-V_B)) | |
| fe | re | Difference | S.E. | |
| ROE_dec | 46.19 | 30.50 | 15.70 | 9.64 |
| WACC_dec | −206.17 | −86.66 | −119.52 | 95.56 |
Table A2.
Components of WACC.
Table A2.
Components of WACC.
| GLORIA SA | |||||||
|---|---|---|---|---|---|---|---|
| Kd | rl Trimestral | Beta | rm Trimestral | Riesgo País | Ke | WACC | |
| 31 March 2013 | 1.12% | 0.13% | 0.58 | 0.03 | 0.20 | 21.69% | 2.98% |
| 30 June 2013 | 1.05% | 3.24% | 0.58 | 0.08 | 0.19 | 24.92% | 3.33% |
| 30 September 2013 | 0.88% | 3.24% | 0.58 | 0.08 | 0.18 | 24.23% | 3.19% |
| 31 December 2013 | 0.96% | 3.24% | 0.58 | 0.08 | 0.18 | 23.78% | 3.35% |
| 31 March 2014 | 1.02% | 3.24% | 0.58 | 0.08 | 0.18 | 23.49% | 3.05% |
| 30 June 2014 | 1.27% | 3.24% | 0.58 | 0.08 | 0.17 | 23.33% | 2.99% |
| 30 September 2014 | 1.25% | 3.24% | 0.58 | 0.08 | 0.17 | 23.10% | 2.96% |
| 31 December 2014 | 1.28% | 3.24% | 0.58 | 0.08 | 0.17 | 22.93% | 2.82% |
| 31 March 2015 | 1.03% | 3.24% | 0.58 | 0.08 | 0.17 | 22.82% | 2.70% |
| 30 June 2015 | 0.99% | 3.24% | 0.58 | 0.08 | 0.17 | 22.78% | 2.57% |
| 30 September 2015 | 0.96% | 3.24% | 0.58 | 0.08 | 0.17 | 22.74% | 2.64% |
| 31 December 2015 | 1.69% | 3.24% | 0.58 | 0.08 | 0.17 | 22.75% | 3.10% |
| 31 March 2016 | 1.62% | 3.24% | 0.58 | 0.08 | 0.17 | 22.79% | 2.86% |
| 30 June 2016 | 1.54% | 3.24% | 0.58 | 0.08 | 0.17 | 22.78% | 2.74% |
| 30 September 2016 | 1.50% | 3.24% | 0.58 | 0.08 | 0.17 | 22.79% | 2.83% |
| 31 December 2016 | 1.55% | 3.24% | 0.58 | 0.08 | 0.17 | 22.79% | 2.94% |
| 31 March 2017 | 0.95% | 3.24% | 0.58 | 0.08 | 0.17 | 22.77% | 0.67% |
| 30 June 2017 | 1.53% | 3.24% | 0.58 | 0.08 | 0.17 | 22.68% | 2.89% |
| 30 September 2017 | 1.52% | 3.24% | 0.58 | 0.08 | 0.17 | 22.58% | 2.90% |
| 31 December 2017 | 1.51% | 3.24% | 0.58 | 0.08 | 0.17 | 22.53% | 2.89% |
| 31 March 2018 | 1.29% | 3.24% | 0.58 | 0.08 | 0.17 | 22.51% | 2.62% |
| 30 June 2018 | 1.53% | 3.24% | 0.58 | 0.08 | 0.17 | 22.47% | 2.73% |
| 30 September 2018 | 1.52% | 3.24% | 0.58 | 0.08 | 0.16 | 22.38% | 2.74% |
| 31 December 2018 | 1.57% | 3.24% | 0.58 | 0.08 | 0.16 | 22.26% | 2.83% |
| 31 March 2019 | 1.55% | 3.24% | 0.58 | 0.08 | 0.16 | 22.18% | 2.76% |
| 30 June 2019 | 1.55% | 3.24% | 0.58 | 0.08 | 0.16 | 22.08% | 2.65% |
| 30 September 2019 | 1.41% | 3.24% | 0.58 | 0.08 | 0.16 | 21.95% | 2.58% |
| 31 December 2019 | 1.56% | 3.24% | 0.58 | 0.08 | 0.16 | 21.89% | 2.76% |
| 31 March 2020 | 1.44% | 3.24% | 0.58 | 0.08 | 0.16 | 21.95% | 2.76% |
| 30 June 2020 | 1.45% | 3.24% | 0.58 | 0.08 | 0.16 | 22.08% | 2.81% |
| 30 September 2020 | 1.38% | 3.24% | 0.58 | 0.08 | 0.16 | 22.21% | 2.95% |
| 31 December 2020 | 1.33% | 3.24% | 0.58 | 0.08 | 0.16 | 22.31% | 3.08% |
| 31 March 2021 | 1.44% | 3.24% | 0.58 | 0.08 | 0.17 | 22.45% | 3.29% |
| 30 June 2021 | 1.46% | 3.24% | 0.58 | 0.08 | 0.17 | 22.71% | 2.65% |
| 30 September 2021 | 1.60% | 3.24% | 0.58 | 0.08 | 0.17 | 23.06% | 2.63% |
| 31 December 2021 | 1.26% | 3.24% | 0.58 | 0.08 | 0.18 | 23.50% | 2.35% |
| 31 March 2022 | 1.42% | 3.24% | 0.58 | 0.08 | 0.18 | 23.76% | 2.57% |
| 30 June 2022 | 1.59% | 3.24% | 0.58 | 0.08 | 0.18 | 23.99% | 2.73% |
| 30 September 2022 | 1.71% | 3.24% | 0.58 | 0.08 | 0.18 | 24.24% | 2.82% |
| 31 December 2022 | 1.73% | 3.24% | 0.58 | 0.08 | 0.19 | 24.44% | 2.86% |
References
- Alzamora, E. (2018). El poder del conocimiento y de la información como generador de valor en las organizaciones. Conocimiento Global, 3(1), 10–20. (In Spanish). [Google Scholar]
- Amat, O. (2000). EVA valor económico agregado. Editorial Norma. (In Spanish) [Google Scholar]
- Ayaba, M. M., Amo-Bediako, E., & Takawira, O. (2023). Evaluating the financial performance of listed REIT firms in South Africa: A 7-step DuPont model technique. International Journal of Applied Economics, Finance and Accounting, 17(2), 267–278. [Google Scholar] [CrossRef]
- Brealey, R. A., Myers, S. C., & Allen, F. (2017). Principles of corporate finance (12th ed.). McGraw-Hill Education. [Google Scholar]
- Brigham, E. F., & Ehrhardt, M. C. (2013). Financial management: Theory & practice (14th ed.). Cengage Learning. [Google Scholar]
- Bueno, G., de Oriani, L., & Faria, J. (2020). Weighted average cost of capital and value creation of agribusiness companies listed on B3 between 2012 and 2019. Custos e Agronegocios, 16, 1–23. [Google Scholar]
- Chen, S., & Dodd, J. L. (1997). Economic Value Added (EVATM): An empirical examination of a new corporate performance measure. Journal of Managerial Issues, 9(3), 318–333. [Google Scholar]
- Climent, R. C., & Haftor, D. M. (2021). Value creation through the evolution of business model themes. Journal of Business Research, 122, 353–361. [Google Scholar] [CrossRef]
- Damodaran, A. (2023). Data archives. Stern School of Business, New York University. Available online: https://pages.stern.nyu.edu/~adamodar/ (accessed on 18 January 2024).
- De la Fuente, A., García, M. A., & Sánchez, A. R. (2019). La salud financiera del sistema público de pensiones español. Revista Hacienda Pública Española, 229(2), 123–156. (In Spanish) [Google Scholar] [CrossRef]
- Flores-Macha, J. R., Pariona-Camyo, J. C., Cuyate-Reque, P. J., & Cordova-Buiza, F. (2024). Financial planning to minimize liquidity risk: A systematic review. In R. El Khoury (Ed.), Technology-driven business innovation: Unleashing the digital advantage. Studies in systems, decision and control (Vol. 540). Springer. [Google Scholar] [CrossRef]
- Fung, H., Xu, X. E., & Yau, J. (2002). Global hedge funds: Risk, return, and market timing. Financial Analysts Journal, 58(6), 19–30. [Google Scholar] [CrossRef]
- García-Sánchez, I., Gallego-Álvarez, I., & Zafra-Gómez, J. (2019). Do the ecoinnovation and ecodesign strategies generate value added in munificent environments? Business Strategy and the Environment, 29(3), 1021–1033. [Google Scholar] [CrossRef]
- Girardone, C., Nieri, L., Piserà, S., & Santulli, R. (2024). Does FinTech credit affect firms’ cost of capital and capital structure? European Journal of Finance, 1, 1–21. [Google Scholar] [CrossRef]
- Groves, R. M., Fowler, F. J., Jr., Couper, M. P., Lepkowski, J. M., Singer, E., & Tourangeau, R. (2009). Survey methodology (2nd ed.). John Wiley & Sons. [Google Scholar]
- Heryan, T., & Gajdova, K. (2024). DuPont analysis among European dentistry companies to measure the impact of the COVID-19 pandemic. E&M Economics and Management, 27(1), 161–174. [Google Scholar] [CrossRef]
- Hoyle, J. A., Dingus, R., & Wilson, J. H. (2020). An exploration of sales forecasting: Sales manager and salesperson perspectives. Journal of Marketing Analytics, 8(3), 127–136. [Google Scholar] [CrossRef]
- Jin, Y. (2017). DuPont Analysis, Earnings persistence, and return on equity: Evidence from mandatory IFRS adoption in Canada. Accounting Perspectives, 16(3), 205–235. [Google Scholar] [CrossRef]
- Kostruba, A. (2024). Comparative analysis of the squeeze-out procedure in Ukraine and the EU. Theoretical and Practical Research in Economic Fields, 15(2), 162. [Google Scholar] [CrossRef] [PubMed]
- Kroll, Y., & Levy, H. (1980). Sampling errors and portfolio efficient analysis. Journal of Financial and Quantitative Analysis, 15(3), 655. [Google Scholar] [CrossRef]
- Leite, M., & Da Silva, T. P. (2019). Relação da estrutura de capital e do valor econômico agregado no desempenho econômico em empresas industriais brasileiras e chilenas. Revista Facultad de Ciencias Económicas, 27(1), 11–42. [Google Scholar] [CrossRef]
- Li Bonilla, F. (2013). El valor económico agregado (EVA) en el valor del negocio. Revista Nacional de Administración, 1(1), 55–70. (In Spanish) [Google Scholar] [CrossRef]
- Lima Stock Exchange. (2023). Información financiera. Available online: https://www.bvl.com.pe/ (accessed on 15 January 2024). (In Spanish).
- López-Lemus, J. A., & De la Garza Carranza, M. T. (2019). La creación de valor a través de la planeación estratégica en microempresas emprendedoras. Contaduría y Administración, 65(3), 185. (In Spanish) [Google Scholar] [CrossRef]
- Mafra, V., Gónzales, E., Ricardo, P., & Wahrlich, R. (2016). A cost-benefit analysis of three gillnet fisheries in Santa Catarina, Brazil: Contributing to fisheries management decisions. Latin American Journal of Aquatic Research, 44(5), 1096–1115. [Google Scholar] [CrossRef]
- Mang’ana, K., Ndyetabula, D., & Hokororo, S. (2023). Financial management practices and performance of agricultural small and medium enterprises in Tanzania. Social Sciences & Humanities Open, 7(1), 100494. [Google Scholar] [CrossRef]
- Mariño-Arevalo, A., & Muñoz-Martínez, I. T. (2024). Propuesta de adaptación de la metodología valor económico agregado (EVA) aplicada a diez instituciones de educación superior (IES) en Colombia. Revista Finanzas y Política Económica/Revista Finanzas y Política Económica, 16(1), 215–242. (In Spanish) [Google Scholar] [CrossRef]
- Marshall, A., & Marshall, M. P. (1920). The economics of industry. Macmillan and Company. [Google Scholar]
- Mei, Z., Fei, F., Zhilong, Z., & Jinghua, W. (2019). Limitations of the DuPont financial index system and its improvement. In Advances in intelligent systems and computing (pp. 985–993). Springer. [Google Scholar] [CrossRef]
- Oktaviani, N., & Sugeng, I. S. (2023). Analisis kinerja keuangan dengan menggunakan metode eva (Economic value added) pada perusahaan konstruksi yang terdaftar di bursa efek Indonesia. Zenodo (CERN European Organization for Nuclear Research). [Google Scholar] [CrossRef]
- Padilla-Ospina, A. M., Rivera-Godoy, J. A., & Ospina-Holguín, J. H. (2019). Desempeño financiero de las empresas más innovadoras del sector real de Colombia. Entramado, 15(1), 78–97. (In Spanish) [Google Scholar] [CrossRef]
- Pasandi, A. G., Botshekan, M., Jalilvand, A., Rastegar, M. A., & Noroozabad, M. R. (2024). Mapping capital ratios to bank lending spreads: The role of efficiency and asymmetry in performance indices. Journal of Risk and Financial Management, 17(7), 289. [Google Scholar] [CrossRef]
- Peters, L. L. (2024). FERC’s theory of anomalous capital markets. The Electricity Journal, 37(3), 107394. [Google Scholar] [CrossRef]
- Roque, D. I., Caicedo-Carrero, A., & De La Oliva De Con, F. (2023). Medición de los factores que determinan la creación de valor en los sectores económicos colombianos: Periodo 2016–2020. Revista Finanzas y Política Económica, 15(1), 213–244. (In Spanish) [Google Scholar] [CrossRef]
- Saus-Sala, E., Farreras-Noguer, À., Arimany-Serrat, N., & Coenders, G. (2021). Compositional DuPont analysis. A visual tool for strategic financial performance assessment. In Advances in compositional data analysis. Springer. [Google Scholar] [CrossRef]
- Seddaoui, N. R., Abdullah, N. S. S., Ahmad, N. S., & Gorundutse, N. A. H. (2024). Influence of marketing innovation and advanced technologies on firm performance: The Case of Algeria. Journal of Advanced Research in Applied Sciences and Engineering Technology, 48(2), 183–196. [Google Scholar] [CrossRef]
- Soto, P. E. P. (2021). Evaluación de la administración económica empresarial, usando el Eva, y su impacto en la rentabilidad de la compañía minera Antamina S.A. Revista Juridica del IPEF, 81(1), 1–11. (In Spanish). [Google Scholar]
- Soto, V., & Hiza, O. (2021). The profitability-growth nexus in the Mexican manufacturing industry. Social Sciences & Humanities Open, 4(1), 100220. [Google Scholar] [CrossRef]
- Superintendency of Securities Market. (2023). Estados financieros. Available online: https://www.smv.gob.pe/SMV/ (accessed on 27 January 2024). (In Spanish)
- Tudose, M. B., Rusu, V. D., & Avasilcăi, S. (2021). Performance management for growth: A framework based on EVA. Journal of Risk and Financial Management, 14(3), 102. [Google Scholar] [CrossRef]
- Tudose, M. B., Rusu, V. D., & Avasilcăi, S. (2022). Financial performance—Determinants and interdependencies between measurement indicators. Business, Management and Economics Engineering, 20(1), 119–138. [Google Scholar] [CrossRef]
- Williamson, O. (1996). The mechanisms of governance. Oxford University Press. [Google Scholar]
- Yupanqui-Castillo, A. L., Werner-Masters, K., & Cordova-Buiza, F. (2024). Corporate tax collection in times of COVID-19 pandemic: An analysis of Peruvian economy. Public and Municipal Finance, 13(2), 98–109. [Google Scholar] [CrossRef]
- Zenzerović, R., & Benazić, M. (2024). The impact of selected financial ratios on economic value added: Evidence from Croatia. Journal of Risk and Financial Management, 17(8), 338. [Google Scholar] [CrossRef]
- Zhang, R., Wang, J., & Kang, H. (2024). Effect of waste cooking oil on the performance of EVA modified asphalt and its mechanism analysis. Scientific Reports, 14(1), 14072. [Google Scholar] [CrossRef]
Disclaimer/Publisher’s Note: The statements, opinions and data contained in all publications are solely those of the individual author(s) and contributor(s) and not of MDPI and/or the editor(s). MDPI and/or the editor(s) disclaim responsibility for any injury to people or property resulting from any ideas, methods, instructions or products referred to in the content. |
© 2025 by the authors. Licensee MDPI, Basel, Switzerland. This article is an open access article distributed under the terms and conditions of the Creative Commons Attribution (CC BY) license (https://creativecommons.org/licenses/by/4.0/).