Article

The Influence of Managerial Risk-Taking and Corporate Leadership on Firm Sustainability

Department of Economics, Lafayette College, Easton, PA 18042, USA
J. Risk Financial Manag. 2025, 18(11), 609; https://doi.org/10.3390/jrfm18110609
Submission received: 8 August 2025 / Revised: 14 October 2025 / Accepted: 15 October 2025 / Published: 30 October 2025
(This article belongs to the Special Issue Corporate Finance: Financial Management of the Firm)

Abstract

This study examines whether CEO risk tolerance influences a firm’s sustainable practices, as measured by Environmental, Social, and Governance (ESG) scores. The analysis uses facial width–height ratio (fWHR) as a proxy for CEO testosterone and risk-taking behavior. A regression analysis of S&P 500 firms from 2018 to 2022 shows that a greater fWHR is negatively associated with ESG scores, although the economic effect is small. A one standard deviation increase in fWHR decreases ESG by half a point on a 100-point scale. Further investigation into CEO turnover reveals a surprising asymmetry: when a new CEO has a higher fWHR, ESG scores increase significantly compared to firms without a CEO change. This finding, along with other confounding effects, suggests that a certain amount of calculated, strategic risk-taking may be necessary to successfully promote corporate sustainability programs.

1. Introduction

Corporate sustainability centers on a firm’s ability to measure and manage different risks. The literature posits that sustainable practices enhance value, partly because managing risk preserves firm assets and presents strategic opportunities. Starks (2009), for instance, suggests that sustainability might increase firm value through its effects on regulatory risk, supply chain risk, product and technology risk, litigation risk, reputational risk, and physical risk. Husted (2005) models corporate social responsibility as a real option that explicitly accounts for value stemming from a limited downside risk.
The chief executive officer ensures that the firm follows sustainable practices and other value-enhancing procedures. Nevertheless, executive decisions may be influenced by personal traits, and upper echelons theory suggests that managerial characteristics ultimately predict organizational outcomes (Hambrick & Mason, 1984; Hambrick, 2007). In its original form, upper echelons theory focuses on observable managerial characteristics such as age, tenure at the firm, and education. Hambrick and Mason (1984) originally place an emphasis on observable features given that psychological dimensions such as values or perceptions are difficult to measure.
As risk is central to any notion of corporate sustainability, it is critical to capture an executive’s tolerance for risk in any test of upper echelons theory. However, risk tolerance is typically not directly observed, so some indirect measure or proxy must be used. Given the measurement difficulties, little work to date has shown the relationship between executive risk tolerance and corporate sustainability.
The following analysis seeks to fill the gap in the literature and investigates the relationship between CEO characteristics and firm sustainability. Of particular interest is whether executive risk-taking influences the sustainability practices of the firm. The research employs facial width–height ratio (fWHR) as a proxy for CEO testosterone and risk-taking, while the Environmental, Social, and Governance practices of the firm (ESG) measure sustainability. The analysis examines S&P 500 firms from 2018 to 2022 and uses multiple regression analysis along with a matched-pair t-test around the event of a CEO turnover. The findings indicate that, while greater fWHR is associated with lower ESG scores, the effect is relatively small. Further evidence suggests that a certain amount of calculated, strategic risk-taking may be necessary to successfully promote corporate sustainability programs. This study contributes to the literature by providing empirical evidence of a direct link between a specific, measurable CEO characteristic and a firm’s sustainability performance.

2. Literature Review

Following upper echelons theory, CEO attributes, including risk-taking behavior, impact firm outcomes. For instance, Bertrand and Schoar (2003) show that older executives tend to be more conservative in their decision-making. Ding et al. (2021) find that the pandemic-induced drop in stock prices was milder among firms with a greater corporate social responsibility. If truncated tail risk results from corporate risk management, it follows that executive risk tolerance is inversely related to corporate sustainability.
Executives might encourage firms to engage with their stakeholders through a number of activities that implicitly mitigate risk and increase firm value. Malik (2015) suggests that pursuing social goals might improve employee productivity, build brand value with consumers and the community, and reduce supplier costs. Environmental objectives enhance value through more favorable treatment by regulators and further improve corporate reputation. Welch and Yoon (2023) find that firms with highly rated managers and high sustainability ratings exhibit significantly higher future stock returns. Thus, better management facilitates the selection of sustainability practices that enhance shareholder value.

2.1. CEO Risk-Taking Behavior

The financial motivation for risk-taking behavior is a higher expected return, and investor profile questionnaires try to measure a person’s tolerance for risk (see, for example, Schwab, n.d.). However, obtaining similar information from CEOs is unlikely. Moreover, corporate risks extend beyond financial risks and include operational and enterprise risk. Thus, any measure of risk-taking behavior should be more general in nature and capture the executive’s willingness to seek all types of risk for additional reward.
Some studies consider the risk-seeking behavior of individuals directly and document a positive relationship between testosterone and financial risk-taking. Apicella et al. (2008) administered saliva tests to male game participants and found that higher testosterone levels lead to greater future financial risk. In a later experiment, Apicella et al. (2014, p. 58) influenced testosterone in male participants with a game of chance and observed that “men who experience a greater increase in bioactive testosterone take on more risk”.
Kaplan et al. (2022) accessed detailed assessments of over 2600 managerial candidates. The assessments show that overconfidence, positively linked to aggressive behavior, contributes to CEO decisions that make projects highly sensitive to cash flows. This drives investment decisions away from fundamentals and towards internal funding, which leads to inefficiencies and missed opportunities.
Without querying CEOs directly, risk-taking must be indirectly measured using some proxy. For example, Cain and McKeon (2016) consider the possession of a private pilot license as evidence of individual risk-taking. They examined S&P 1500 firms and found that companies led by pilot-licensed CEOs had higher risk as measured by equity return volatility. However, in another study of pilot CEOs, Sunder et al. (2017) suggest that flying may also indicate the desire to pursue novel experiences and creativity. Based on their findings, they conclude that sensation seeking is a valuable trait that could be used to identify CEOs likely to spark corporate innovation. Thus, while risk-seeking behavior may be inconsistent with sustainable practices, pilot-licensed CEOs might offer creative solutions to environmental and social problems.
In the absence of CEO hormone data, studies sometimes use a person’s facial width/height ratio (fWHR) as a proxy for testosterone levels. Lindberg et al. (2005) document that higher testosterone during puberty causes the facial bone to grow more masculine, with a higher fWHR. Furthermore, Penton-Voak and Chen (2004) find that individuals judge the faces of men with higher testosterone in their saliva to be more masculine. Additionally, Lu and Teo (2022) present evidence that hedge funds run by high-fWHR managers underperform compared to funds run by low-fWHR managers, fail more often, and generally have a greater downside risk.
Kamiya et al. (2019) note the correlation of fWHR to testosterone, aggression, and social dominance, and posit a direct association between CEO masculinity and firm risk. Using headshots of 1162 CEOs in the Execucomp database, they find that firms with more masculine-looking executives had a higher stock return volatility, higher financial leverage, and spent more on acquisitions. Kamiya et al. calculated fWHR both by hand and using artificial intelligence and observed that the results are robust for either measure of masculinity.
In a similar line of research, Ahmed et al. (2019) examined the relationship between CEO masculinity and bank risk-taking. Their sample included 134 CEOs and 104 banks in the S&P 1500 from 2006 to 2014. The analysis used three alternative risk measures: return volatility, idiosyncratic risk, and the bank’s Z-score, to test for the effects of masculinity on bank risk. Ahmed et al. find that the fWHR is positively associated with the market-based risk measures, return volatility and idiosyncratic risk, but not related to the accounting-based Z-score. They interpret the results to mean that, while investors perceive banks led by CEOs with masculine facial features to be riskier, Z-scores suggest that the banks are no more likely to become insolvent.
Several studies have examined the difference in risk-taking between males and females. Byrnes et al. (1999) conducted a meta-analysis of 150 studies and found that the mean effects for 14 out of 16 types of risk-taking are significantly larger for men than women. However, certain types of risk (e.g., intellectual and physical skills) produce larger differences than others (e.g., smoking). They also note that the gender gap varies by age and appears to be growing smaller over time.
While fWHR has been associated with male aggressive behavior, Hahn et al. (2017) found that CEOs of companies in the Dow Jones index and German DAX index have facial ratios that positively correlate with their firm’s charitable contributions and environmental sensitivity. Moreover, CEO fWHRs are larger, on average, than the general population’s. This finding extends to influential leaders of NGOs, as well as to the Pope. Thus, Hahn et al. (2017, p. 1) conclude that the evidence “speak(s) against the simplistic view that wider-faced men achieve higher social status through antisocial tendencies and overt aggression”. Mindful of these authors’ work, the relationship between fWHR and any measure of sustainability may not be clear-cut or unequivocal.

2.2. Measures for Firm Sustainability

Measuring sustainability also has its challenges. While risk management is central to the concept of corporate sustainability, a more holistic approach considers long-term value-enhancing factors of the firm. Does the company treat its employees fairly? Do the firm’s suppliers follow a code of conduct similar to the firm itself? Is there environmental transparency? Answers to these types of questions suggest value-enhancing actions that Environmental, Social, and Governance (ESG) metrics frequently measure. Thus, sustainability may be described by a collection of ESG drivers of long-term value. In this way, corporate sustainability is not a binary concept, but rather reflects a continuum of possibilities. While higher ESG scores reflect more sustainable firms, Edmans (2023, p. 3) cautions that “(W)e want great companies, not just companies that are great at ESG”.
Two studies examine firm sustainability measures and provide insights into the connection between ESG and firm risk. Shackleton et al. (2022) focused on the environmental and social performance of firms using MSCI-KLD data (hereafter, simply MSCI data). They found that poor stock performance precedes improved ES activities, especially for firms with more financial slack, enlightened customers after the financial crisis, and in firms with activist ES investors (Shackleton et al., 2022). A second study by Matsumura et al. (2022) investigated the relationship between climate risk disclosure and firm risk. Their results showed that disclosing the firm’s climate risk in the SEC’s 10-K report lowered the cost of equity by 27 basis points, and they conclude that “markets use expectations of climate risk materiality to infer the credibility of managers’ climate risk disclosure decisions” (Matsumura et al., 2022, p. 1).
Zhang et al. (2021) document lower implied volatility for higher ESG rated firms. However, they also find more negative implied skewness and higher implied kurtosis and conclude that left-hand tail risk is greater for companies with higher ESG measures. They further observe that large firms are likely to have higher ESG measures but more negative implied skewness, while small firms have lower ESG ratings with a less negative left-hand tail.
While implied pdf moments from option prices are forward-looking, Burson et al. (2022) investigate tail risk on an ex-post basis. They look at historical data on a set of firms continually in the Dow Jones Sustainability North America Composite Index. The market capitalization of the selected companies, on average, exceeded the market cap of firms in the S&P 500 Index, and the tail risk results largely reinforce those of Zhang et al. (2021). Specifically, the returns of these high ESG rated companies were more highly correlated with the market during contractionary periods than during expansion. Moreover, during the spring of 2020, when stocks in the S&P 500 fell an average 34% from their peak due to COVID, the average drawdown for the sustainable stocks was 9.48% greater than the S&P 500 Index. Both findings provide evidence that tail risk tends to be greater for firms with high ESG ratings.
The association between ESG as a measure of sustainability and firm risk is further clouded by the frequent conflicting appraisals of the numerous rating agencies. Chatterji et al. (2016) first showed the divergence of ESG ratings among the different agencies. In addition to low correlation between rating agencies, Dimson et al. (2020) indicate considerable discrepancies for several large and well-known companies. For example, MSCI’s ESG rating for Wells Fargo is in the 12th percentile, in contrast to FTSE’s 94th percentile rating. More recently, Berg et al. (2022) found that, in examining six different ESG ratings agencies, pairwise correlation coefficients ranged from 0.38 to 0.71. They ascribe differences to scope (selection of criteria), weight (relative importance of criteria), and measurement of the criteria itself.

2.3. Other Factors That Affect Firm Risk

Previous corporate finance studies have examined firm characteristics as other explanatory variables of the company’s ESG rating. For example, Hegde and Mishra (2019) found a positive relationship between firm size (total assets) and ESG ratings. Gregory (2024) also observed a positive association between firm size and ESG ratings, but adds that the results are sensitive to the rating agencies. He hypothesizes that the size effect is the product of economies of scale when investing in sustainable activities. Borghesi et al. (2014) showed that more profitable firms (higher return on assets) were positively associated with ESG performance, while less financially constrained companies (lower leverage) also performed better (Hong et al., 2012).
As businesses navigate an ever-changing landscape, one factor that shapes their trajectory is the behavior of their chief executive officers (CEOs). CEO risk-taking has been the subject of extensive research and debate. The question that arises is whether an increase in CEO risk-taking ultimately leads to consequences for firm sustainability, as reflected by ESG metrics. In this context, examining the relationship between CEO risk-taking and firm sustainability can offer insights into the dynamics that shape the long-term viability of businesses in today’s socially and environmentally conscious world.

3. Hypotheses, Methodology, and Data

3.1. Hypotheses and Methodology

The main question of interest I examine is the following: Does an increase in CEO risk-taking decrease firm sustainability as proxied by ESG measures? If fWHR is our measure of risk-taking, this suggests the following hypothesis:
H1. 
An increase in fWHR will decrease firm sustainability as measured by ESG ratings.
While I initially measure sustainability using the total ESG ratings, sub-hypotheses look at the effects of risk-taking on the individual measures of E, S, and G. In all cases, the proposition is that an increase in the risk-taking measure, fWHR, will decrease the individual sustainability gauge.
Sustainability might also be thought of as a destination, rather than a journey. A change in a company’s CEO affords a new direction for the firm that might include adopting more sustainable practices. This suggests a second set of related hypotheses that investigates episodes of CEO turnover. The second proposition is as follows:
H2. 
A change in a firm’s CEO will increase sustainability as measured by ESG more than at a similar firm that does not experience CEO turnover.
Additionally, embracing sustainable practices is likely a “sticky” policy. It is hard to imagine that firms adopting renewable energy, enforcing socially responsible supply chain agreements, or implementing environmentally friendly manufacturing processes will suddenly backtrack and return to previous procedures. If true, advancing sustainability suggests an asymmetry when there is CEO turnover, and a final testable hypothesis is as follows:
H2a. 
CEO turnover from a less risk-taking to a more risk-taking executive has no relative effect on sustainable ESG measures, whereas a change in CEO from a more risk-taking to a less risk-taking executive will comparatively increase the firm’s sustainable practices.
In examining the effects of CEO characteristics on firm sustainability, the main trait of interest is executive risk-taking. I consider a direct path that stems from higher testosterone, which is believed to produce aggression and risk-taking behavior. An executive’s fWHR proxies for their testosterone levels. As risk-taking has been found to be positively related to testosterone levels, fWHR serves as a measure of executive risk-taking. I have gathered a collection of CEO photos from Annual Reports, LinkedIn, and other public sources of company information.

3.2. Estimating a CEO’s fWHR

To calculate fWHR, I use a publicly available program written by Professor Ties de Kok (2022) at the University of Washington. This is an alternative to manually measuring facial features, which can be very labor-intensive. The program uses artificial intelligence “to detect the face and facial features required to determine the corners of the ‘fWHR box’” (de Kok, 2022).
In the first step, the computer program processes the photo by specifying a path to a local image. The program then identifies the points depicted in Figure 1.
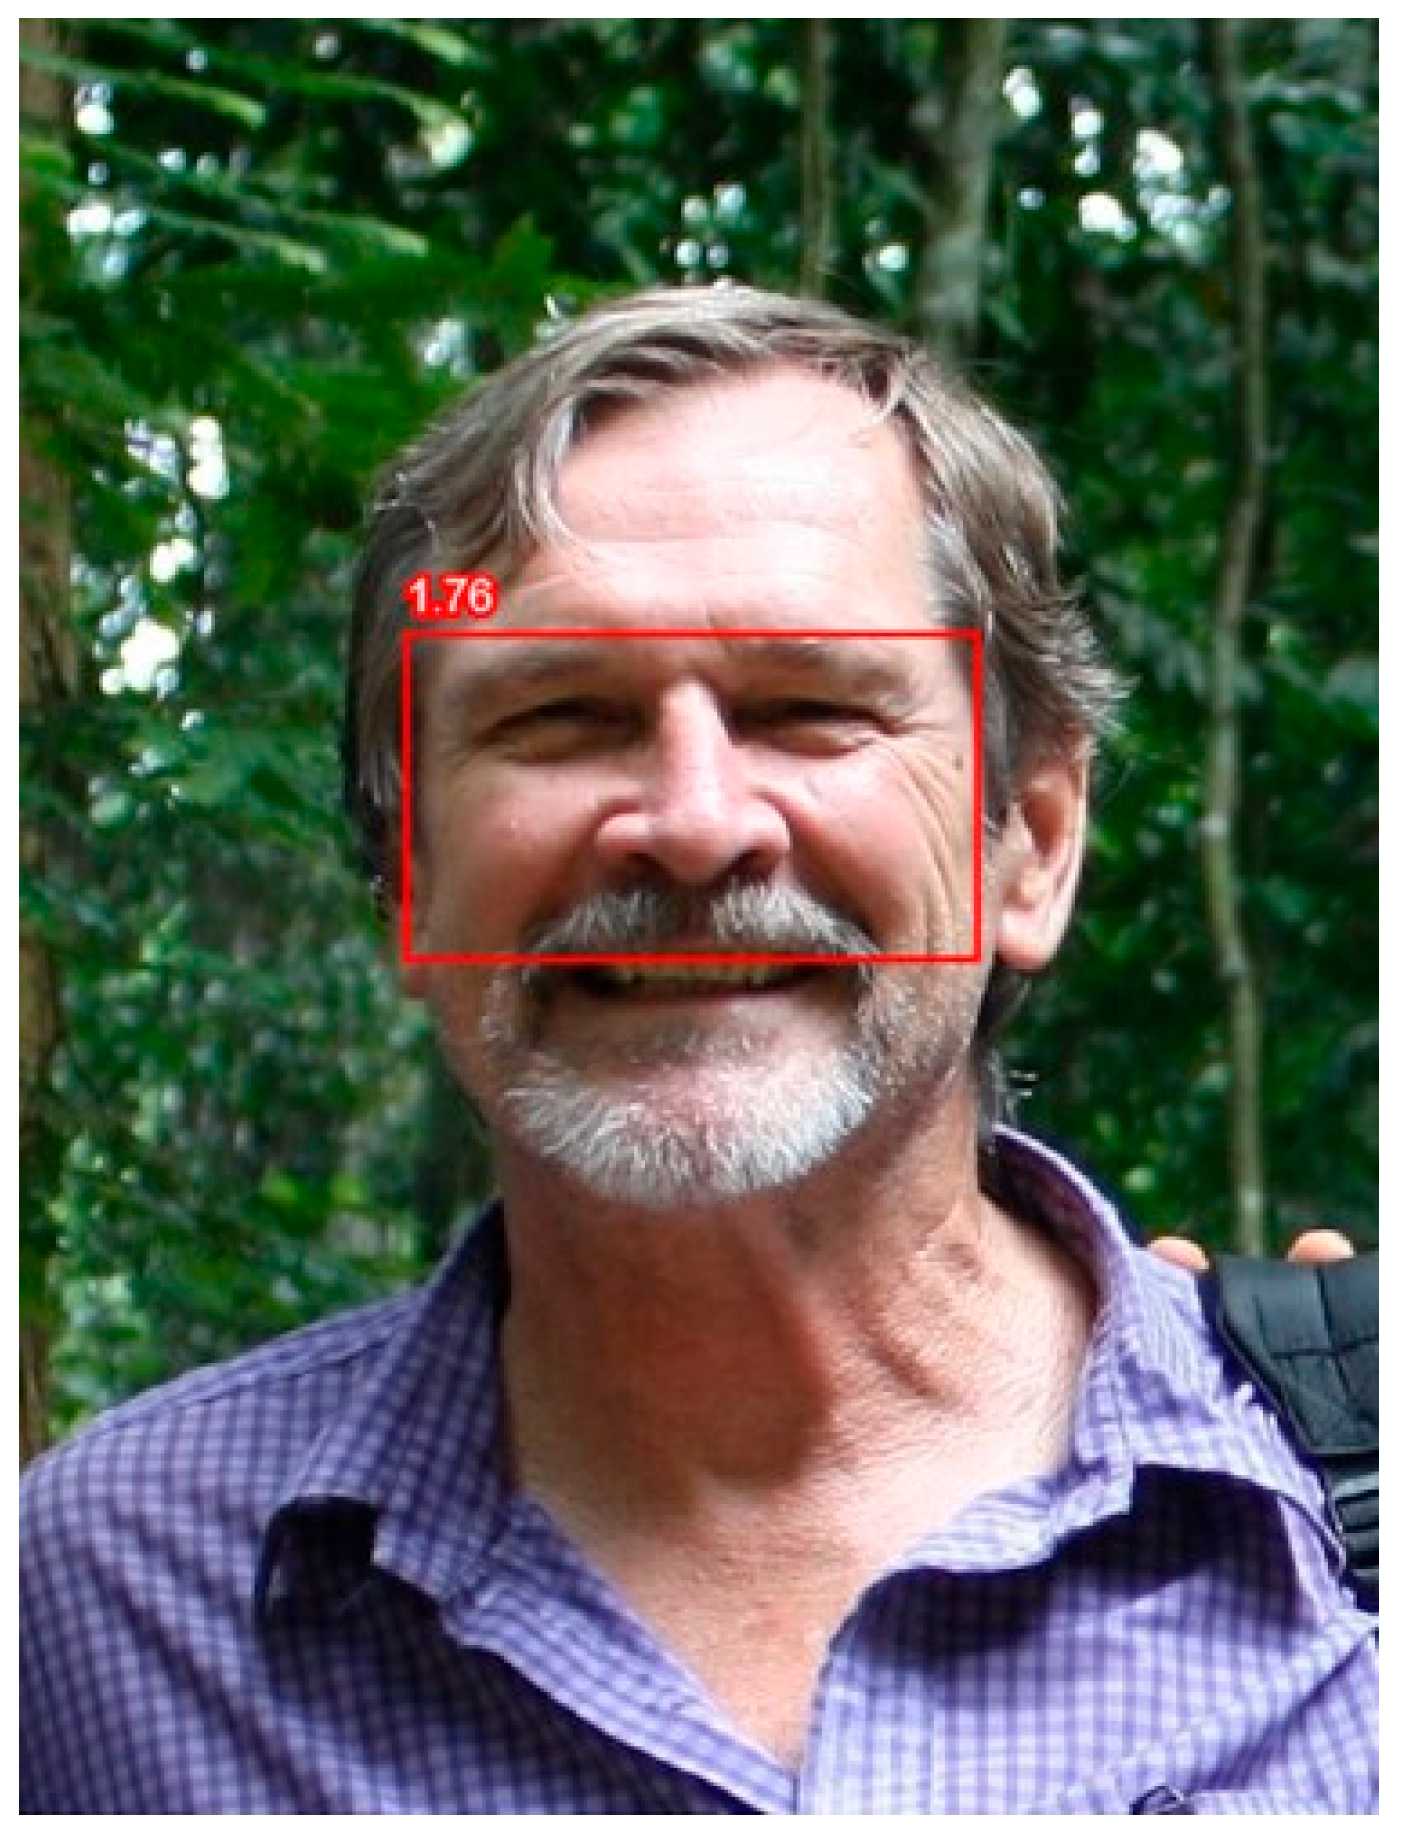
The bizygomatic width equals the maximum horizontal facial distance, taken to be the length between the upper left and right cheekbone (points 0 and 16). Height corresponds to the distance between the upper lip (points 50 and 52) and either the upper eyelids (points 37 and 43) or eyebrows (points 18 and 25). The coordinates yield a box surrounding the face whose dimensions imply the value for fWHR (Figure 2).

3.3. Structural Equation for a Test of Hypothesis 1

The main test of the first hypothesis employs multiple regression analysis and follows the general form of Kamiya et al. (2019):
SUSTAINi,t+1 = a + b(RiskTakei,t) + c(CEOi,t) + d(FIRMi,t) + FEi,t + ϵi,t
where SUSTAIN is an ESG measure of sustainability for firm i, RiskTake is a risk-taking metric associated with the chief executive officer, CEO is a vector of CEO characteristics including age, gender, and cash compensation, FIRM is a vector of firm characteristics such as size (assets), leverage, and profitability, FE equals year and industry fixed effects, and ϵ is an error term. There is a lead-lag effect, so that the independent variables in year t influence the firm’s sustainability measure in t + 1. Thus, the model implies that CEO and firm characteristics affect next year’s sustainability measure.
For the main measure of risk-taking, the analysis uses the CEO’s fWHR. Thus, a test of Hypothesis 1 examines the sign of the coefficient, b. A greater fWHR implies greater risk-taking, so the main hypothesis predicts that the RiskTake coefficient, b, will be negative, holding all else constant. Thus, an increase in CEO risk-taking decreases the sustainability of the firm.

3.4. Tests for Hypotheses 2 and 2a

To test Hypothesis 2, I first identify all firms that had CEO turnover within the sample period of analysis. I then randomly match the company with another firm in the same industry that did not experience a change in CEO that year. Having already identified the industry and fiscal year, there frequently remains only a small group of potential matching firms. Thus, I use a random selection process rather than some machine learning algorithm that would require a larger potential data set.
To see if a new CEO produces an increase in firm sustainability over the following year above what you would expect, the analysis compares the change in sustainability over the year following CEO turnover to the change in sustainability of the matching firm. To formally test Hypothesis 2, I then run a matched pair t-test comparing changes in ESG, our measure of sustainability.
Hypothesis 2a predicts an asymmetric response to firm sustainability when there is CEO turnover. Specifically, a change from a less risk-taking to a more risk-taking executive will have no relative effect on sustainable measures, while a CEO switch from a more risk-taking to a less risk-taking individual will increase the firm’s sustainable practices. To test this hypothesis, the analysis separates CEOs according to their fWHR.
Group 1 is the upper quartile of fWHR values, group 2 is the interquartile, and group 3 is the lower quartile. If the new CEO is in a higher fWHR group than the former CEO, i.e., a sign of more aggressive, risk-taking behavior, they are subsequently matched with a firm that has no CEO turnover for the year. Following Hypothesis 2a, a matched pair t-test is then run to see if there are any differences in firm sustainability.
Similarly, when the new CEO is in a lower fWHR group than their predecessor, they are again compared to a control group to see the relative change in sustainability. According to Hypothesis 2a, there should be little or no difference in sustainability in the first case, whereas the second case predicts a higher relative change in ESG.

3.5. Data

The estimation of the first set of regressions uses panel data covering a five-year period from 2018 to 2022. The analysis examines member firms in the S&P 500 at the end of 2022 that were publicly traded in the previous five years. The empirical work excludes utilities and financial institutions, consistent with established finance research. The research frequently excludes both industries as they are highly regulated and, in the case of financial institutions, report different metrics of operations and performance. This produces a final sample of 290 companies.
From 2018 to 2022, there were 463 different CEOs in the 290 firm sample. Hand collecting the pictures from publicly available sources yields 455 readable photos that are then scored by de Kok’s fWHR calculator app (de Kok, n.d.). Appendix A lists all variables, their definitions, and how they were constructed.
The regression dependent variable is either the total ESG or one of the individual components: Environmental, Social, or Governance. I obtained ESG scores for these variables from S&P Global. As of spring 2024, S&P Global covers 13,500 firms worldwide, representing 99% of global market capitalization (S&P Global, n.d.).
The S&P Global rates firms on a 0–100 scale, where 100 is the maximum score (S&P Global, 2023). The score represents “a company’s performance on and management of material ESG risks, opportunities, and impacts informed by a combination of company disclosures, media and stakeholder analysis, modeling approaches, and in-depth company engagement via the S&P Global Corporate Sustainability Assessment (CSA)” (S&P Global, 2023, p. 4). The score is a relative measure that compares the firm’s performance on ESG risks, opportunities, and impacts to other companies within the same industry.
A CSA includes one of 62 industry-specific surveys sent to the firm with approximately 120 total questions. If a question is unanswered, a team of experts will fill in the information if publicly available. If not available, the CSA assigns a zero.
The CSA covers each of the three dimensions, Environmental, Social, and Governance. In addition to climate strategy and environmental policy and management, the Environmental dimension includes energy, waste & pollutants, and water. Social topics span across issues such as community relations, human capital management, labor practices, and occupational health and safety. Finally, governance includes business ethics, corporate governance, product quality, risk and crisis management, and supply chain management. The S&P Global marks each of the three dimensions on a 0-to-100-point scale and then takes a weighted average of the three scores to obtain the total ESG score.
Each firm has a two-month participation window to gather and send the requested data. The first window begins in April, with the first score releases beginning in August. In all cases, the regression analysis uses ESG scores from as late in the calendar year as they appear, with none sooner than a September release. For most of the firms in the sample, the ESG measure is within three months of the end of their fiscal year.
To better understand both the content and outcome of a firm’s ESG rating, consider the current ESG rating for Tesla, Inc. The firm is in the automobile industry and has an ESG rating equal to 40. The record shows that there is a “medium” data availability, so some information must be collected by the S&P Global. Furthermore, Tesla is “Under Review”, which indicates that the S&P Global is completing a “Media and Stakeholder Analysis,” with the possibility that the ESG score may subsequently change.
The ESG score is broken down along the three different dimensions, E, S, and G, and also compares the outcomes to industry norms. Tesla is well below the maximum industry ratings in all three dimensions. In the case of its social ratings, Tesla scores a 29, which is below even the industry average. While the environmental score is greater than the industry average, it is still a middling mark, equal to 53.
Finally, other ESG ratings, such as the MSCI data, were considered for the analysis. However, measures of strengths minus concerns yield a scale that hovers near zero and may not be as intuitive as the 100-point index of the S&P Global. Moreover, like the MSCI data, the S&P’s ratings and those of its predecessor RobecoSAM go back two decades, and its protocol, followed in the Corporate Sustainability Assessment (CSA), has long been recognized as one of the most sophisticated ESG scoring methodologies.

4. Results

I first present the descriptive statistics for the variables used in the analysis and the correlations among them. Next, I examine the main question of interest: Does an increase in CEO risk-taking decrease firm sustainability as proxied by ESG measures? For testing Hypothesis 1, the analysis uses panel data and a CEO’s fWHR as the measure of risk-taking. I then test Hypothesis 2, analyzing the effect of CEO turnover on a firm’s ESG score to provide further evidence regarding managerial risk-taking and firm sustainability.

4.1. Univariate Descriptive Statistics and Pairwise Correlations

To obtain a sense of the size of each variable used in the regression analysis, distribution figures appear in Table 1. Each observation represents a firm-year. Beginning with the dependent variable, total ESG, the mean score for sample firms is 46.8, ranging from a low of 11 to a high of 91. Separate dimension mean values are Governance, 50.27; Environmental, 48.74; and Social, 40.8. Governance has the smallest dispersion around the mean, with a standard deviation of 14.84, while there is more dissonance in the Environmental scores, where the standard deviation is 21.55. These outcomes may in part be a function of a better reporting setting for Governance items compared to Environmental issues.
The average CEO age in the sample is nearly 58 years old, and 5% of the CEOs are women. Cash compensation and bonus, which is often used in the literature to adjust risk aversion, averages $1.38 million, although the range is from 0 to $23.5 million. An alternative measure related to wealth is the percentage of total shares owned by the CEO. The median is 0.12% of all company shares owned by the CEO, although one CEO owns more than 17% of the corporation.
The risk-taking variable of interest, fWHR, has a relatively compact dispersion around its mean value of 1.7. The fWHR ranges from a low of 1.47 to a high of 2.06. Because of this tight band, the regression analysis also considers upper and lower quartile clustering of CEO fWHRs.
Looking at FIRM variables, size is the natural log of total assets (in millions USD) of the firm. Logs are used to compensate for outliers, as some firms like Apple have assets of nearly USD 400 billion. The average debt ratio (book value of debt/total assets) is 64%, with a book value of debt sometimes exceeding assets for some firms. The market to book value of equity has a mean value of 5.3, while the average firm’s return on assets is 8%. Average research and development scaled by assets equals 0.03, but for many firms the value of R&D is 0. Finally, the average dividend yield is 2%, although some firms pay as high as 7%.
Turning to pairwise correlations in Table 2, the standard deviation of stock returns (SD), sometimes referred to as vol, has a negative but near 0 correlation with total ESG, as well as E, S, and G individually. Vol measures financial risk and ESG measures more holistic firm risk, but the two have a low correlation. However, the negative relation between the two supports the conjecture that greater risk reflects an increase in vol but a decrease in ESG ratings.
Table 2 reports three other relationships of note. First, firms led by female CEOs have higher ESG scores, suggesting that women CEOs have a lower risk tolerance, a result in accordance with Byrnes et al. (1999). Second, size is positively related to ESG ratings, with a correlation coefficient approximately equal to 0.3. A positive correlation between firm size and ESG ratings is consistent with earlier empirical studies. Third, dividends also have a positive correlation with ESG. Thus, firms with strong, steady dividends tend to have higher ESG scores. This may, in part, be due to the positive association between firm size and dividends. Finally, the panel data used in the analysis suggest that it is worthwhile to examine the grouping of data across time (annually) and industry.
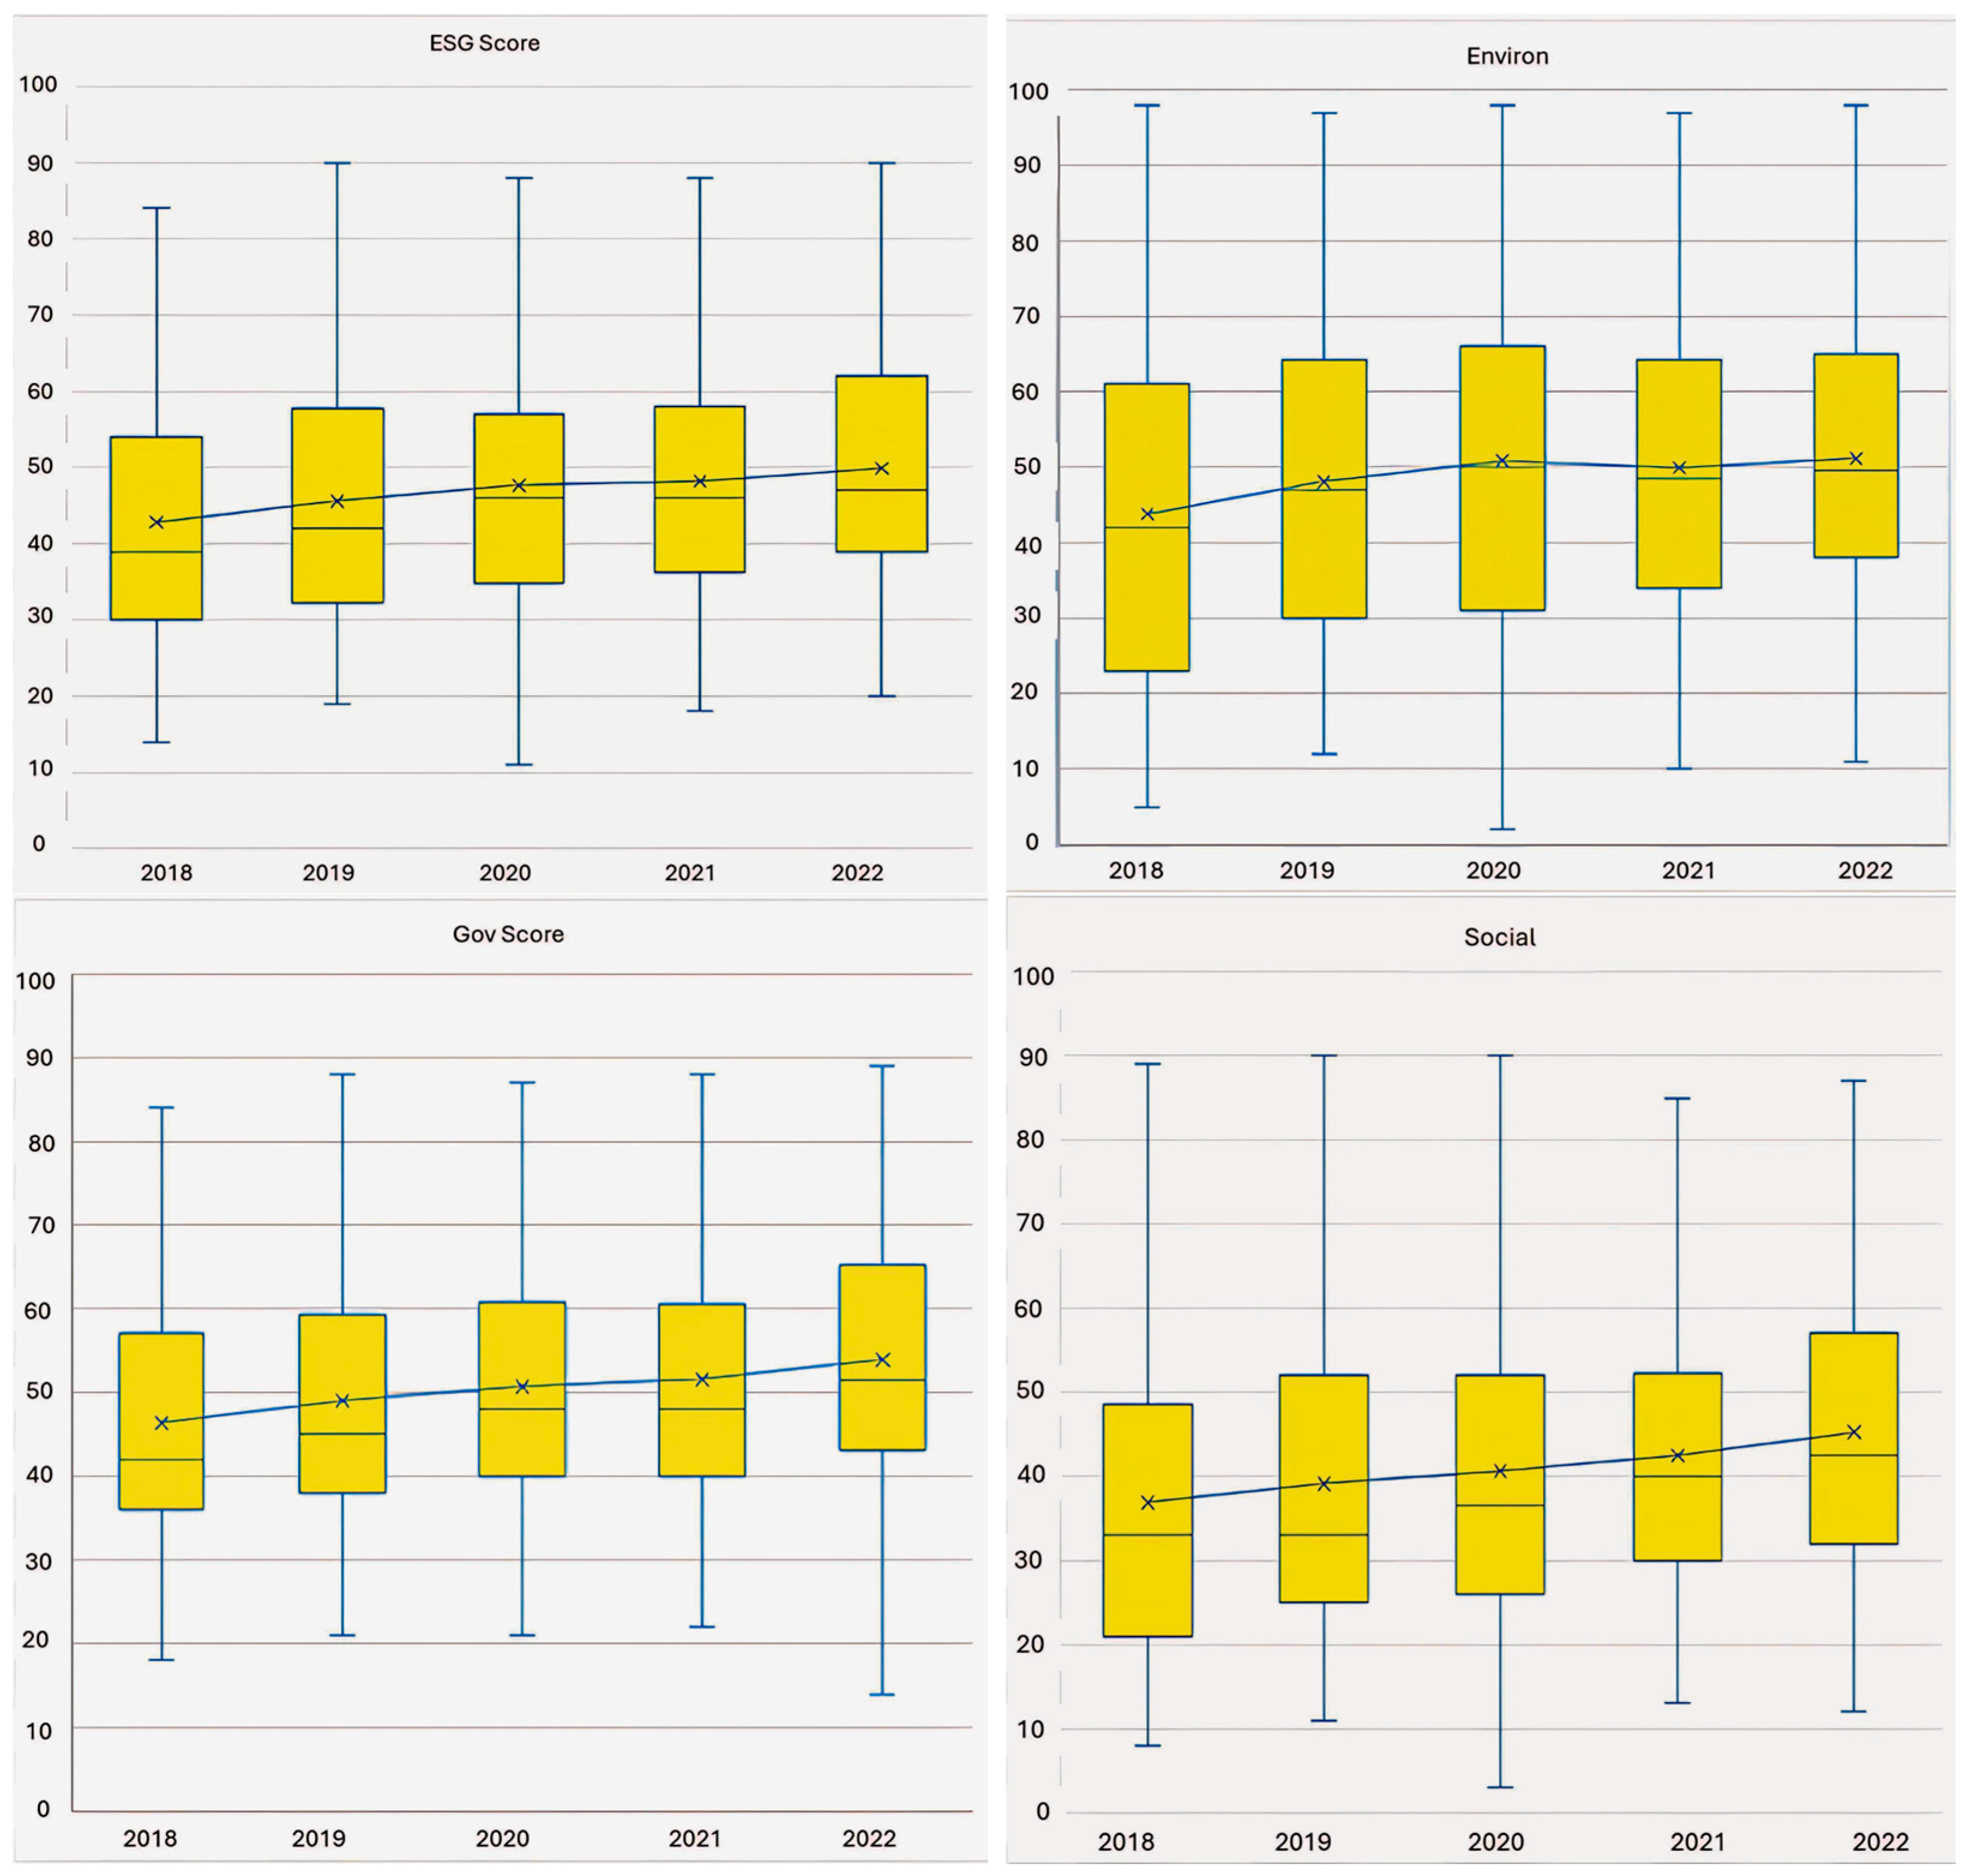
Looking at the box and whisker diagrams for ESG over time (Figure 3) in the upper lefthand corner, the mean of total ESG increases over time. By 2022, the average ESG rating equals 50. The range for the interquartile is approximately 25 points every year, and upper and lower quartile whiskers are mostly between 10 and 20 points. Thus, while the interquartile is relatively compact, the max–min range in 2022 is from 20 to a score of 90.
Of the individual dimensions, the widest range for the interquartile is for the Environmental dimension. The mean and median for the Environmental dimension show little change after the third sample year. Also, in 2020, the max–min range is from near 0 to almost 100, and suggests either the diversity of firms with regard to their environmental position or the difficulty of collecting and reporting in this dimension. Social and Governance dimensions have time patterns more similar to the total ESG (Figure 3).
Firms may also be grouped by industry. The mean ESG significantly varies across industries, with food, beverage, and tobacco at the high end and media entertainment at the low end (Figure 4). Food, beverage, and tobacco also display the greatest range of ESG scores, from the teens to the mid-eighties.

4.2. Results for Testing Hypothesis 1

The regression results testing Hypothesis 1 appear in Table 3. Column (1) pools the data and estimates the regression using ordinary least squares (OLS). All explanatory variables except fWHR, age, and market to book are statistically significant. However, the Breusch–Pagan statistic of 40.48 rejects the null hypothesis of no heteroscedasticity (p < 0.01), so that subsequent regressions include the two-way fixed effects of fiscal year (time) and industry (4-digit GICS). The clustering of observations yields robust standard errors.
Column (2) is the main estimation of interest. A statistically significant fWHR coefficient of −4.927 supports the first hypothesis. While significant, the economic effect is small. One standard deviation of fWHR equals 0.1, and would increase the total ESG by approximately one half-point.
Female CEO-led firms, on average, have ESG scores that are three points higher than their counterparts. This finding agrees with the correlation results and further supports the Byrnes et al. (1999) meta-analysis that found women were generally less risk-tolerant than men. Consistent with the earlier findings that large firms tend to have higher ESG measures, size positively affects sustainability. Debt is also positive and significant. While an increase in the total debt ratio implies greater leverage, and therefore greater risk, the result appears to motivate firms to manage this risk. Managing downside risk is especially important for nearly bankrupt firms with high debt ratios. (See, for example, Morrell and Swan (2006), who show the value of hedging oil prices for nearly bankrupt airlines.) Furthermore, from Table 2, debt positively correlates with size, so that the positive debt coefficient could also be partially a size effect.
A significant and positive ROA coefficient implies that more profitable firms have higher ESG scores. Firms with greater research and development also have higher ESG measures. As R&D is a risky activity of the firm, this seems at odds with the negative fWHR risk-taking coefficient. Finally, higher dividends lead to greater sustainability. An increase in dividend yield of one percent increases ESG by nearly 15 points. As shown earlier, this might also be conflated with the size effect as larger, established firms tend to pay higher dividends.
Given the possibility of measurement error for fWHR, (3) separates ratios into the lower quartile, fWHR_25, the upper quartile, fWHR_75, and the interquartile, the base group between 25 and 75 percent. Hypothesis 1 implies that the lower (higher) quartile dummy indicates CEOs with lower (higher) testosterone and risk-taking, so that these CEO-led firms should have a positive (negative) coefficient. While fWHR_75 does have a negative and significant coefficient, so does fWHR_25. Relative to the interquartile group, both outer quartiles have lower ESG scores on average.
Finally, column (4) is similar to (2), except I substitute the percent of total shares owned by the CEO (TSO) for cash compensation. The former perhaps better reflects the undiversified wealth of the CEO rather than the former, and thus may better proxy risk aversion. The TSO coefficient of −0.824 implies that the typical CEO with a median TSO value of 0.12 manages a firm with an ESG score that is 0.1 lower, ceteris paribus. Thus, while statistically significant, the practical effect of this variable is small. Again, however, the negative and significant fWHR coefficient implies that CEOs with more testosterone run firms with lower ESG scores.
Table 4 replicates the general structural model estimated in Table 3, column (2), only now the dependent variables are the individual dimensions, E, S, or G. The main takeaway from Table 4 is that, for all three dimensions, fWHR is negative, significant, and of the same magnitude as the fWHR coefficient for estimating the total ESG. Moreover, the remainder of the explanatory variables are similar in sign and magnitude to the corresponding coefficients in the total ESG model as well.

4.3. Results for Testing Hypothesis 2

In testing Hypothesis 2, I identify 103 cases of CEO turnover where firms could be matched contemporaneously with another firm in the same industry that had no CEO change that year (Table 5). Firms experiencing CEO turnover have a greater increase in ESG scores the following year than do firms with no change in chief executive: 2.43 vs. 1.75. However, the difference is not significant (p = 0.14, one-tailed matched pair t-test).
It may be that the reason the ESG difference is insignificant between the two groups is that some of the CEO turnover is a change from higher to lower risk-taking as measured by fWHR, whereas in other CEO changes, risk-taking is in the reverse direction. Hypothesis 2a suggests an asymmetry in changes in ESG between these two possibilities. Table 6 considers the two cases separately.
The analysis classifies a(n) decrease (increase) in fWHR as one where the new CEO is in a lower (higher) quartile group than the former chief executive. The first paired t-test going from higher to lower CEO risk-taking shows that there is no significant difference in ESG changes between firms with CEO turnover and those firms where there is no change (p = 0.37) (Table 6). However, if fWHR goes up, ESG increases by 3.91 compared to 1.45 for the no CEO change set of firms, and this relationship is statistically significant (p = 0.02). While there is asymmetry between the two cases, it is in the reverse direction of that predicted in Hypothesis 2a.

5. Discussion

Upper echelons theory and the proxies for risk-taking and corporate sustainability lead to the main hypothesis that CEOs with higher fWHRs will lead firms that have lower ESG scores, in other words, are less sustainable. In examining nearly 300 firms over a five-year period, I find evidence that supports the main hypothesis. However, there are a number of confounding effects that suggest the relationship between risk-taking and sustainability may not be as simple as first posited. Thus, it is necessary to “read the tea leaves” and give reasons for the empirical findings. Potentially, a richer theory evolves from the discussion.
First, while the empirical analysis finds that an increase in the CEO’s fWHR leads to a negative and statistically significant decrease in a firm’s ESG rating, practically speaking the effect is small. A one standard deviation change in fWHR implies a half-point change in ESG on a 100-point scale. Moreover, when dummy variables are used for the upper and lower quartiles for CEO fWHR measures, both the upper and lower quartiles have negative coefficients. Technically, this could be explained by a quadratic being the true relationship between fWHR and ESG, with the inter quartile exhibiting a higher level of ESG than the outer quartiles. Nevertheless, when estimating a linear relationship, the overall trend is found to be negative.
The follow-up question is what might explain this quadratic relationship, where some risk-taking is optimal if trying to increase the firm’s sustainability (ESG score). Remember that, in Hypothesis 2, when a firm experiences CEO turnover, on average, ESG ratings go up more than a matching firm in the industry with no change in CEO. Moreover, in Hypothesis 2a, when the new CEO has a higher fWHR than the former executive, the firm’s ESG is not only higher than the control firm; it is statistically significant.
Putting these pieces of the puzzle together suggests that, perhaps, there is an optimal amount of executive risk-taking necessary to enhance a firm’s sustainability. Too much risk-taking is not good, but too little is not ideal either. Remember, also, that firms with higher R&D ratios, and thus led by CEOs that appear willing to take on risk, have higher ESG scores.
More subtly, the analysis also suggests that how CEOs think of risk might matter. Recall that Sunder et al. (2017) posit that pilot CEOs have a desire for novel experiences and creativity. Thus, perhaps a certain amount of entrepreneurial risk-taking leads to successful corporate sustainability practices. This type of risk-taking is calculated, creative, and strategic.1
A further possibility is that CEO values are a function of lifetime experiences or inherited traits. If these values are not idiosyncratic, but instead systematically related to any of the CEO explanatory variables in the model, this may lead to biased coefficients. Examples of experiential-based values include Covington et al. (2024), who show that CEOs who have a number of state hunting and fishing licenses tend to lead firms with lower environmental scores. Huixian and Zhihui (2024) observe that CEOs that experience early life disasters are likely to reduce green activities when they perceive catastrophic shocks. Finally, Marra et al. (2023) find that CEO altruism is an inherited trait related to the executive’s ancestral homeland and that more altruistic CEOs lead firms with stronger CSR performances.
A final thought is the possibility that measurement error may be a problem that affects the empirical work. First is the issue of ESG as a measure of sustainability. As already noted, there are several ESG rating firms, and research has shown that a pairwise correlation between any two firms is low. The earlier example of Tesla shows a low ESG score of 40, with a particularly low social mark below the automotive industry average. This low rating may be surprising to some, and, in fact, Tesla is no longer part of the Dow Jones North American Sustainability Index due to its relatively low ratings (Kolodny, 2022). In any event, examples like this beg the following question: what, exactly, does ESG measure? This has led many corporate employees to view ESG ratings as nothing more than “tick the box” exercises (e.g., EcoOnline, n.d.).
There is also the possibility that the fWHRs of CEOs have a significant measurement error. Appendix B considers the case of Apple’s Tim Cook, a widely photographed CEO of one of the world’s largest companies. Depending upon the picture selected for the analysis, there is considerable variation in the possible value of fWHR.

6. Conclusions

Upper echelons theory posits that managerial traits and values affect executive decision-making. As risk management is at the root of corporate sustainability, a natural question is whether a CEO’s risk tolerance influences their firm’s sustainable practices. With ESG scores used as a measure of firm sustainability and a CEO’s fWHR serving as a proxy for testosterone and ultimately risk-taking behavior, the evidence suggests that executive risk-taking negatively affects a firm’s sustainable programs. While the effect is statistically significant, it is relatively small. A one standard deviation increase in fWHR produces a half-point decrease in ESG on a 100-point scale.
CEO turnover results, along with the finding of a positive correlation between a firm’s R&D expenditures and ESG score, imply that the relationship between risk-taking and sustainability may not be straightforward. A more nuanced reading of the empirical evidence indicates how CEOs think of risk matters. Leveraging work that shows certain CEOs have a desire for novel experiences gives rise to the possibility of creative solutions for many of the firm’s social and environmental problems. In short, a certain amount of entrepreneurial risk-taking may be necessary for successful corporate sustainability programs.
The analysis highlights two areas that plague research in this area and limit practical application of the findings. First is the varying quality and selection of available CEO headshots in order to measure fWHR and associated testosterone levels. Without standardization of position, lighting, and picture quality, the final fWHR measure is subject to selection choice of the researcher. Perhaps some of the problems can be mitigated by either incorporating specifications within the image recognition software itself or by correcting biases with the aid of artificial intelligence.
The bigger issue both in terms of the analysis at hand as well as the broader area of sustainability is in the ESG measure itself. Notwithstanding nearly two decades of work in this area, no standards exist detailing how to measure ESG, or even what ESG is meant to represent. For both managers and investors, existing ESG ratings are often looked upon as “tick the box” exercises. Until there is agreement on what ESG represents and how best to measure the uniform standards, the use and practical applications of ESG ratings will be limited.
While this study faces limitations, future research can advance the field by merging fWHR measures with the managerial assessments used by Kaplan et al. (2022) to evaluate how CEO risk-taking and aggressiveness affect firm sustainability. Incorporating survey-based assessments would capture a broader set of managerial traits, offering a more nuanced view of their influence on sustainable practices. Over time, as ESG ratings improve and sustainability disclosure standards become widely adopted, these constraints will diminish, allowing for more robust tests of the relationships explored here.

Funding

This research received no external funding.

Institutional Review Board Statement

Not applicable.

Informed Consent Statement

Not applicable.

Data Availability Statement

Restrictions apply to the availability of these data. Data were obtained from a Vendor and are available from the author with the permission of S&P Global (for ESG ratings, Compustat and Execucomp variables).

Acknowledgments

I would like to thank Mark Leighton and Sudhakar Raju for their detailed comments and suggestions, and Elaine Kornitzky and Mukamani Luchera for their excellent research assistance. Remarks from two anonymous reviewers improved the final manuscript. Thanks also to participants, including Brian Clark, in sessions at the Southwestern Finance Association and Multinational Finance Society conferences.

Conflicts of Interest

The authors declare no conflict of interest.

Appendix A. Variable Definitions

Below are definitions and sources of data for variables used in the statistical analysis. Execucomp and Compustat item names are in quotations.
Dependent Variables
ESG ScoreTotal ESG score as reported in S&P Global (0–100-point scale)
Gov ScoreGovernance and Economic score in S&P Global (0–100-point scale)
EnvironEnvironmental score in S&P Global (0–100-point scale)
SocialSocial score in S&P Global (0–100 points)
SDStandard deviation of five years of monthly stock returns, annualized
CEO Variables
AgeAge of CEO at end of firm’s fiscal year (“page” in Execucomp)
FemaleDummy variable equal to 1 if CEO is female, 0 otherwise (Constructed from “gender” in Execucomp)
CompCEO compensation equal to salary and cash bonus (“salary” + ”bonus” in Execucomp)
Total Shares OwnedPercentage of total shares owned by the CEO (“shrown_tot_pct” in Execucomp)
fWHRFacial width height ratio (fWHR measurement of publicly available headshot of CEO using python program of de Kok (2022))
FIRM Variables
SizeFirm size equal to natural logarithm of total assets (ln(“at”) in Compustat)
DebtTotal debt ratio (“lt”/”at” in Compustat)
MBMarket to book value of equity (“mkvalt”/”ceq” in Compustat)
ROAReturn on assets (“ni”/”at” in Compustat)
RDResearch and development as percentage of total assets (“xrd”/”at” in Compustat)
DivDividend yield (“dvpsp_f”/”prcc_f” in Compustat)
Note: firm variables are winsorized at the 1 and 99% levels.

Appendix B. Measuring fWHR, the Example of Tim Cook

Consider the case of Tim Cook, Apple’s CEO. For proper reading, the photograph must be of relatively high quality. The subject’s nose should be pointing towards the camera lens, and the face should not be tilted (de Kok, n.d.).
I examine three photos of Tim Cook to see if the fWHR measure is consistent across all figures. The first picture of Cook (https://investor.apple.com/leadership-and-governance/person-details/default.aspx?ItemId=cb4c5428-aaa5-4e54-b553-69f4778fa361, accessed on 14 October 2025) appears on the investor’s relation web page of Apple.com and shows his fWHR is equal to 1.66. Another headshot from the magazine British Vogue (Alastair Nicol, https://www.vogue.co.uk/article/exclusive-apple-ceo-tim-cook-future-of-fashion-augmented-reality, accessed on 14 October 2025) photographs Cook head-on but with a slightly bigger grin. In this picture, his fWHR falls to 1.61. Finally, in a headshot from The Atlantic (https://www.theatlantic.com/the-atlantic-festival-2020/#speakers, accessed on 14 October 2025), Cook has a neutral look, neither smiling nor grinning as in previous pictures. Because of dark shading around Cook’s right ear, the fWHR drops to 1.52.
The implication from these examples is that the fWHR measure for an individual may vary considerably over a number of pictures, making it difficult to determine the true value. Thus, the analysis is a joint test of our original hypothesis, an inverse relationship between risk-taking and ESG, and the supposition that our measures of fWHR are correct (or at least unbiased measures of the true values). Simply averaging the different measures across several headshots will not produce the correct or a necessarily better estimate of the CEO’s true fWHR. A grin here, raised eyebrow there, or shading on one side of the face can have a substantial impact on the CEO’s fWHR. For Tim Cook, the range of measures (1.52 to 1.66) is equal to 1.4 times the sample standard deviation of fWHR.
It is time consuming finding good headshots of CEOs. Moreover, in many cases, a CEO’s picture does not appear in company reports or on the firm’s web page. Finding the “correct” headshot to yield the true fWHR may be a difficult if not impossible task.

Note

1
There also exists the possibility that external factors, like option-based compensation, might influence executives to take more risk. However, a separate analysis offers no support for this mechanism (empirical results available from the author). Examining the effect of a CEO’s compensation delta and gamma on ESG in 2018 yields results similar to findings in other work, including Kamiya et al. (2019). Typical option-based compensation incentives appear to present little in the way of inducing CEOs to take the necessary risks for greater firm sustainability. Instead, Gao et al.’s (2023) work suggests that compensation linked to corporate social responsibility may be a more direct and efficient route to promote firm sustainability and increase ESG.

References

  1. Ahmed, S., Sihvonen, J., & Vähämaa, S. (2019). CEO facial masculinity and bank risk-taking. Personality and Individual Differences, 138, 133–139. [Google Scholar] [CrossRef]
  2. Apicella, C. L., Dreber, A., Campbell, B., Gray, P., Hoffman, M., & Little, A. (2008). Testosterone and financial risk preferences. Evolution and Human Behavior, 29(6), 384–390. [Google Scholar] [CrossRef]
  3. Apicella, C. L., Dreber, A., & Mollerstrom, J. (2014). Salivary testosterone change following monetary wins and losses predicts future financial risk-taking. Psychoneuroendocrinology, 29, 58–64. [Google Scholar] [CrossRef]
  4. Berg, F., Kölbel, J. F., & Rigobon, R. (2022). Aggregate confusion: The divergence of ESG ratings. Review of Finance, 26(6), 1315–1344. [Google Scholar] [CrossRef]
  5. Bertrand, M., & Schoar, A. (2003). Managing with style: The effect of managers on firm policies. Quarterly Journal of Economics, 118(4), 1169–1208. [Google Scholar] [CrossRef]
  6. Borghesi, R., Houston, J., & Naranjo, A. (2014). Corporate socially responsible investments: CEO altruism, reputation, and shareholder interests. Journal of Corporate Finance, 26, 164–181. [Google Scholar] [CrossRef]
  7. Burson, J., Banta-Ryan, C., & Swidler, S. (2022). Sustainable company resilience: Alpha and beta in up and down markets. The Journal of Impact and ESG Investing, 3(2), 94–107. [Google Scholar] [CrossRef]
  8. Byrnes, J. P., Miller, D. C., & Schafer, W. D. (1999). Gender differences in risk taking: A meta-analysis. Psychological Bulletin, 125(3), 367–383. [Google Scholar] [CrossRef]
  9. Cain, M., & McKeon, S. (2016). CEO personal risk-taking and corporate policies. Journal of Financial and Quantitative Analysis, 51(1), 139–164. [Google Scholar] [CrossRef]
  10. Chatterji, A. K., Durand, R., Levine, D. I., & Touboul, S. (2016). Do ratings of firms converge? Implications for managers, investors and strategy researchers. Strategic Management Journal, 37, 1597–1614. [Google Scholar] [CrossRef]
  11. Covington, T., Swidler, S., & Yost, K. (2024). Hunting and fishing CEOs: Environmental plunderers or saviors? Journal of Business Ethics, 197, 423–444. [Google Scholar] [CrossRef]
  12. de Kok, T. (n.d.). FWHR calculator app. Available online: https://www.tiesdekok.com/calculatefwhr/ (accessed on 11 July 2024).
  13. de Kok, T. (2022, October 17). Use python to calculate the facial width to height ratio (FWHR). ARC. Available online: https://eaa-online.org/arc/blog/2017/11/22/use-python-calculate-facial-width-height-ratio-fwhr/ (accessed on 16 October 2025).
  14. Dimson, E., Marsh, P., & Staunton, M. (2020). Divergent ESG ratings. The Journal of Portfolio Management, 47(1), 75–87. [Google Scholar] [CrossRef]
  15. Ding, W., Levine, R., Lin, C., & Xie, W. (2021). Corporate immunity to the COVID-19 pandemic. Journal of Financial Economics, 141(2), 802–830. [Google Scholar] [CrossRef]
  16. EcoOnline. (n.d.). Half of employees see ESG reporting as a box-ticking exercise. Available online: https://www.ecoonline.com/news/half-of-employees-see-esg-reporting-as-a-box-ticking-exercise (accessed on 5 August 2024).
  17. Edmans, A. (2023). The end of ESG. Financial Management, 52, 3–17. [Google Scholar] [CrossRef]
  18. Gao, L., Sheikh, S., & Zhou, H. (2023). Executive compensation linked to corporate social responsibility and firm risk. International Journal of Managerial Finance, 19(2), 269–290. [Google Scholar] [CrossRef]
  19. Gregory, R. P. (2024). The influence of firm size on ESG score controlling for ratings agency and industrial sector. Journal of Sustainable Finance & Investment, 14(1), 86–99. [Google Scholar] [CrossRef]
  20. Hahn, T., Winter, N. R., Anderl, C., Notebaert, K., Wuttke, A. M., Clément, C. C., & Windmann, S. (2017). Facial width-to-height ratio differs by social rank across organizations, countries, and value systems. PLoS ONE, 12(11), e0187957. [Google Scholar] [CrossRef] [PubMed]
  21. Hambrick, D. C. (2007). Upper echelons theory: An update. Academy of Management Review, 32(2), 334–343. [Google Scholar] [CrossRef]
  22. Hambrick, D. C., & Mason, P. (1984). Upper echelons: The organization as a reflection of its top manager. The Academy of Management Review, 9(2), 193–206. [Google Scholar] [CrossRef]
  23. Hegde, S. P., & Mishra, D. R. (2019). Married CEOs and corporate social responsibility. Journal of Corporate Finance, 58, 226–246. [Google Scholar] [CrossRef]
  24. Hong, H., Kubik, J. D., & Scheinkman, J. A. (2012). Financial constraints on corporate goodness (No. w18476). National Bureau of Economic Research.
  25. Huixian, Z., & Zhihui, G. (2024). How CEOS’ early-life disaster experiences impact green innovation: An empirical study based on natural experiments. Available online: https://ssrn.com/abstract=4688618 (accessed on 16 October 2025).
  26. Husted, B. W. (2005). Risk management, real options, and corporate social responsibility. Journal of Business Ethics, 60(2), 175–183. [Google Scholar] [CrossRef]
  27. Kamiya, S., Kim, Y. H., & Park, S. (2019). The face of risk: CEO facial masculinity and firm risk. European Financial Management, 25, 239–270. [Google Scholar] [CrossRef]
  28. Kaplan, S. N., Sørensen, M., & Zakolyukina, A. A. (2022). What is CEO overconfidence? Evidence from executive assessments. Journal of Financial Economics, 145(2), 409–425. [Google Scholar] [CrossRef]
  29. Kolodny, L. (2022, May 18). Why Tesla was kicked out of the S&P 500’s ESG index. CNBC. Available online: https://www.cnbc.com/2022/05/18/why-tesla-was-kicked-out-of-the-sp-500s-esg-index.html (accessed on 16 October 2025).
  30. Lindberg, M., Vandenput, L., Movèrare, S. S., Vanderschueren, D., Boonen, S., Bouillon, R., & Ohlsson, C. (2005). Androgens and the skeleton. Minerva Endocrinologica, 30, 15–25. [Google Scholar] [PubMed]
  31. Lu, Y., & Teo, M. (2022). Do alpha males deliver alpha? Facial width-to-height ratio and hedge funds. Journal of Financial and Quantitative Analysis, 57(5), 1727–1770. [Google Scholar] [CrossRef]
  32. Malik, M. (2015). Value-enhancing capabilities of CSR: A brief review of contemporary literature. Journal of Business Ethics, 127(2), 419–438. [Google Scholar] [CrossRef]
  33. Marra, M., Ruan, J., Schopohl, L., & Yin, C. (2023). CEO inherited altruism and firm corporate social responsibility. Available online: https://ssrn.com/abstract=4671303 (accessed on 16 October 2025).
  34. Matsumura, E. M., Prakash, R., & Vera-Muñoz, S. C. (2022). Climate-risk materiality and firm risk. Review of Accounting Studies, 29, 33–74. [Google Scholar] [CrossRef]
  35. Morrell, P., & Swan, W. (2006). Airline jet fuel hedging: Theory and practice. Transport Reviews, 26(6), 713–730. [Google Scholar] [CrossRef]
  36. Penton-Voak, I. S., & Chen, J. Y. (2004). High salivary testosterone is linked to masculine male facial appearance in humans. Evolution and Human Behavior, 25, 229–241. [Google Scholar] [CrossRef]
  37. S&P Global. (n.d.). ESG Scores: Rating company ESG performance. Available online: https://www.spglobal.com/esg/solutions/esg-scores-data (accessed on 13 July 2024).
  38. S&P Global. (2023). S&P global ESG scores. Available online: https://portal.s1.spglobal.com/survey/documents/spglobal_esg_scores_methodology.pdf (accessed on 12 July 2024).
  39. Schwab. (n.d.). Investor profile questionnaire. Available online: https://www.schwab.com/resource/investment-questionnaire (accessed on 7 August 2024).
  40. Shackleton, M., Yan, J., & Yao, Y. (2022). What drives a firm’s ES performance? Evidence from stock returns. Journal of Banking & Finance, 136, 106304. [Google Scholar] [CrossRef]
  41. Starks, L. T. (2009). EFA keynote speech: “Corporate governance and corporate social responsibility: What do investors care about? What should investors care about?”. The Financial Review, 44(4), 461–468. [Google Scholar] [CrossRef]
  42. Sunder, J., Sunder, S. V., & Zhang, J. (2017). Pilot CEOs and corporate innovation. Journal of Financial Economics, 123(1), 209–224. [Google Scholar] [CrossRef]
  43. Welch, K., & Yoon, A. (2023). Do high-ability managers choose ESG projects that create shareholder value? Evidence from employee opinions. Review of Accounting Studies, 28, 2448–2475. [Google Scholar] [CrossRef]
  44. Zhang, J., De Spiegeleer, J., & Schoutens, W. (2021). Implied tail risk and ESG ratings. Mathematics, 9(14), 1611. [Google Scholar] [CrossRef]
Figure 1. Photo recognition points. Note. The computer program identifies facial contour points, including coordinates used to determine the fWHR box (de Kok, 2022).
Jrfm 18 00609 g001
Figure 2. fWHR box. Note. The box dimensions imply the fWHR value (equal to 1.76 in this example) used as a proxy for testosterone levels.
Jrfm 18 00609 g002
Figure 3. Box and whisker diagrams for ESG over time, 2018–2022. Note. The yellow box denotes the interquartile, 25–75%, while the “whiskers” illustrate the upper and lower quartile. The horizontal dash within the yellow box is the median, and the x marks the distributional mean.
Jrfm 18 00609 g003
Figure 4. Box and whisker diagram for ESG across industries. Note. The yellow box denotes the interquartile, 25–75%, while the “whiskers” illustrate the upper and lower quartile. The horizontal dash within the yellow box is the median, and the x marks the distributional mean.
Jrfm 18 00609 g004
Table 1. Descriptive statistics: distribution of regression variables.
nMeanSDMedMinMaxRangeSkewKurt
Dep. Variables
ESG Score142346.816.35441191800.51−0.51
Gov Score142350.2714.84471489750.51−0.54
Environ142348.7421.5548298960.2−0.82
Social142340.817.9437392890.59−0.43
SD14460.280.10.260.11.171.072.4813.35
CEO Variables
Age144757.786.55583391580.582.45
Female14500.050.2200114.1415.17
Comp145013761151.81223.8023,50023,50010.18157.65
Total Shares Owned 14240.642.140.12017.1717.175.5632.19
fWHR14331.70.11.691.472.060.590.450.22
FIRM Variables
Size145010.011.129.97.7412.815.060.37−0.21
Debt14500.640.210.630.191.251.060.430.22
MB14495.322.014.01−121.2597.71218.96−1.2616.56
ROA14500.080.070.07−0.170.30.470.031.93
RD14500.030.050.0100.240.242.466.55
Div14500.020.010.0100.070.070.960.85
Table 2. Pairwise correlation coefficients.
SizeDebtMBROARDDivCompTSOAgeFemalefwhrESG ScoreGov ScoreEnvironSocialSD
Size1.00
Debt0.101.00
MB−0.03−0.071.00
ROA−0.28−0.050.121.00
RD−0.11−0.190.060.251.00
Div0.330.20−0.05−0.16−0.171.00
Comp0.220.050.00−0.02−0.070.101.00
TSO0.08−0.10−0.010.000.06−0.15−0.121.00
Age0.090.04−0.02−0.05−0.160.030.040.251.00
Female0.060.080.040.020.020.04−0.01−0.05−0.031.00
fwhr0.030.030.000.03−0.12−0.050.000.030.04−0.121.00
ESG Score0.300.110.02−0.030.050.260.02−0.150.010.08−0.021.00
Gov Score0.230.110.01−0.04−0.010.230.01−0.170.030.09−0.010.951.00
Environ0.340.130.04−0.020.060.290.05−0.11−0.010.060.000.910.791.00
Social0.310.080.02−0.040.060.240.02−0.140.010.08−0.020.960.880.821.00
SD−0.06−0.03−0.04−0.250.06−0.070.000.020.020.02−0.08−0.03−0.01−0.07−0.011.00
Table 3. Regressions testing Hypothesis 1; the effect of fWHR on ESG.
ESG_Score
(1)(2)(3)(4)
fwhr−1.058−4.927 ** −4.137 **
1.3491.978 2.017
fwhr_25 −2.500 ***
0.327
fwhr_75 −3.184 ***
0.223
Age0.007−0.008−0.010.063 ***
0.0160.0240.0240.018
Female3.104 ***3.061 ***3.084 ***2.873 ***
0.8780.7580.7750.730
Comp−0.001 **−0.0001−0.0001
0.00030.00030.0003
TSO −0.824 ***
0.104
Size3.815 ***4.655 ***4.648 ***4.870 ***
0.2370.4220.3940.375
Debt5.527 ***6.959 ***6.580 ***6.376 ***
0.4370.4780.4330.503
MB0.0250.0230.0230.021
0.0220.0150.0150.015
ROA8.459 ***13.687 ***12.940 ***13.324 ***
1.8221.9872.0231.836
RD38.156 ***46.895 ***45.303 ***55.251 ***
3.5126.4046.4526.791
Div211.028 ***148.029 ***148.228 ***128.697 ***
24.5029.64610.8609.611
Constant1.682
5.217
Observations1386138613861386
R20.1410.150.1570.16
Adjusted R20.1340.1280.1350.139
F Statistic22.520 ***23.818 ***22.852 ***25.779 ***
Standard errors appear below estimated coefficients. * p < 0.1; ** p < 0.05; *** p < 0.01. Note. Total ESG score is the dependent variable for all regressions.
Table 4. Regressions testing the effect of fWHR on individual dimensions.
EnvironSocialGov Score
(1)(2)(3)
fwhr−2.13−6.523 ***−2.849
2.6752.5231.733
Age−0.085 **−0.0030.032
0.0340.0200.031
Female2.442 *3.939 ***3.285 ***
1.3141.0580.437
Comp−0.0002−0.00030.0001
0.00050.00020.0003
Size7.045 ***5.154 ***3.147 ***
0.5370.4630.363
Debt7.765 ***6.893 ***6.972 ***
1.0890.8460.423
MB0.046 *0.0190.016
0.0260.0130.014
ROA20.319 ***13.804 ***10.590 ***
3.1071.8123.111
RD63.514 ***46.053 ***32.376 ***
13.1025.280−6.521
Div232.570 ***140.758 ***116.459 ***
22.36014.61310.408
Observations138613861386
R20.1840.1430.101
Adjusted R20.1630.120.078
F Statistic30.429 ***22.458 ***15.231 ***
Standard errors appear below estimated coefficients. * p < 0.1; ** p < 0.05; *** p < 0.01. Note. Dependent variables are E, S, or G, respectively, for Columns (1)–(3).
Table 5. Test of Hypothesis 2.
CEO TurnoverNo CEO Change
Mean2.431.75
Variance56.0146.56
Observations103.00103.00
Pearson Correlation0.63
Hypothesized Mean Difference0.00
df102.00
t Stat1.11
P(T<=t) one-tail0.14
t Critical one-tail1.66
P(T<=t) two-tail0.27
t Critical two-tail1.98
Note. Matched Pair t-test analyzing CEO turnover and the effect on a firm’s ESG score.
Table 6. Test of Hypothesis 2a.
CEO Turnover, −Δ fWHRNo CEO Change
Mean0.560.91
Variance25.807.83
Observations32.0032.00
Pearson Correlation0.05
Hypothesized Mean Difference0.00
df31.00
t Stat−0.34
P(T<=t) one-tail0.37
t Critical one-tail1.70
P(T<=t) two-tail0.73
t Critical two-tail2.04
CEO Turnover, +Δ fWHRNo CEO Change
Mean3.911.45
Variance45.4035.63
Observations33.0033.00
Pearson Correlation0.42
Hypothesized Mean Difference0.00
df32.00
t Stat2.05
P(T<=t) one-tail0.02
t Critical one-tail1.69
P(T<=t) two-tail0.05
t Critical two-tail2.04
Note. −Δ fWHR denotes new CEO has lower fWHR (risk-taking) than old CEO, whereas +Δ fWHR denotes new CEO has higher fWHR (risk-taking) than old CEO.
Disclaimer/Publisher’s Note: The statements, opinions and data contained in all publications are solely those of the individual author(s) and contributor(s) and not of MDPI and/or the editor(s). MDPI and/or the editor(s) disclaim responsibility for any injury to people or property resulting from any ideas, methods, instructions or products referred to in the content.