

Investing in US Timberland Companies
Abstract
1. Introduction
2. Methodology
2.1. The National Council of Real Estate Investment Fiduciaries (NCREIF)
2.1.1. NCREIF Fundamentals
2.1.2. NCREIF’s Timberland Index
2.1.3. Issues with the NCREIF Timberland Index
2.2. Real Estate Investment Trusts (REITs)
2.2.1. The Structure of REITs
- Derive at least 75% of the REIT’s gross income from real estate rent, from interest on mortgages that finance real estate, or from their real estate transactions;
- At least 75% of the REIT’s total assets must be invested in real estate, cash, or US Treasury securities;
- Pay out to the REIT shareholders every year at least 90% of the REIT’s income in the form of cash dividends that are subject to income taxes;9
- Be managed by a board of directors or trustees;
- Be a company that is organized and taxed as a corporation;
- Have at least 100 shareholders after the first year of existence;
- Have no more than 50% of its shares held by five or fewer shareholders.
2.2.2. Three Timberland REITs
2.2.3. Tree Care
- Weyerhaeuser is a dues-paying member of the Forest Stewardship Council (FSC), the Sustainable Forestry Initiative (SFI), and some similar trade groups.11 The FSC is an international non-profit organization that promotes responsible management of the world’s forests via timber certification. This organization uses a market-based approach to implement its international environmental policies. In contrast, the SFI is a sustainability organization operating in the US and Canada that works in four directions: set standards, conservation, community relations, and education. SFI also operates two youth education initiatives, named Project Learning Tree and Project Learning Tree Canada. Weyerhaeuser certifies that 100% of its timberlands and wood products conform to SFI standards.12
- Carbon is one the main ingredients in tree trunks, branches, roots, and leaves. Weyerhaeuser estimates that its trees remove the equivalent of 32 million metric tons of carbon dioxide per year from the world’s atmosphere. Stated differently, Weyerhaeuser estimates that its timberlands provide atmospheric benefits equivalent to taking 7 million automobiles off the US roads every year.
- Weyerhaeuser estimates that its trees remove more than four times the amount of carbon dioxide that its aggregate corporate operations create and emit each year. This makes the Weyerhaeuser Corporation a consistent major net negative carbon citizen.
- When Weyerhaeuser reforests its land, it follows good forestry guidelines to maximize the growth and sustainability of the new forest.
- Weyerhaeuser does not harvest the trees growing along the edges of its lakes and streams because these are areas where wildlife is most active.
- Weyerhaeuser publicly sells permits to camp, hunt, and fish on most of its land.
- Weyerhaeuser plants between 130–150 million tree seedlings each year.
- Weyerhaeuser harvests only about 2% of its 10–12 million acres of timberlands each year, and most of the harvested acreage is reforested within one year. Weyerhaeuser owns virtually no barren land.
2.2.4. Significant Characteristics of REITs
2.2.5. Trends in the Timberland Industry
2.3. Empirical Statistics from the Timberland Returns
2.4. The Wood Processing Industry
3. Results
3.1. The Returns from Weyerhaeuser and NCREIF
3.2. Comparing Average Returns
4. Discussion of Portfolio Performance Theories
4.1. The Sharpe Ratio and Treynor Ratios (Treynor 1965)
4.2. Discussion of Markowitz Portfolio Theory
5. Four Conclusions
5.1. Inflation Hedging
5.2. Investment Rankings
5.3. Photosynthesis
5.4. Increasing the Incentives to Plant Trees
Author Contributions
Funding
Data Availability Statement
Conflicts of Interest
| 1 | In 2022 the Weyerhaeuser Corporation and the Occidental Petroleum Corporation (OXY) signed a lease agreement for 30,000 acres of subsurface pore space that Weyerhaeuser controls. These acres will be used to develop a carbon capture and sequestration project designed to reduce the amount of carbon dioxide released into the world’s atmosphere (Securities and Exchange Commission (SEC) n.d.). |
| 2 | Photosynthesis is an important chemical process discovered by a medical doctor named Jan Ingenhousz in 1779 (Ingenhousz 1779). Photosynthesis occurs as every green tree, blade of grass, or other green plant absorbs carbon dioxide and creates new oxygen in order to sustain itself. |
| 3 | For a scientific discussion about the harmful effects of climate change see (Walker et al. 2021). |
| 4 | In 2009 the US Forest Service classified 22% of the US as timberland, or land capable of producing industrial wood. David Swensen, (Swensen 2009, pp. 215–16). In 2023, the US federal government owned 238 million acres (31%) of US forests, most of which are managed by the US Forest Service (FS) as part of the National Forest System (NFS) and the Bureau of Land Management (BLM). |
| 5 | Information about individual NCREIF members is not disclosed, only NCREIF’s aggregate portfolio statistics are published. |
| 6 | The NCREIF Timberland Price Index was developed when Hancock Timber Resource Group (HTRG), Forest Investment Associates (FIA), PruTimber, the Frank Russell Company, and NCREIF teamed up to develop it in 1992. |
| 7 | For more detail about the statistical issues in appraisal-based data see the discussion of Exhibits 4–9 in (Francis and Ibbotson 2009). |
| 8 | Two types of REITs exist. First, US law permits an equity REIT to own and rent homes, office buildings, timberlands, shopping centers, and other physical real estate. Second, the REIT Act of 1960 defines mortgage REITs that are only permitted to buy mortgage loans that have real estate as collateral, collect interest income from mortgages, and buy and sell mortgages. Mortgage REITs are not discussed further because they do not own any timberland. Mortgage REITs comprise only a small part of the total REIT market. In 2021, NAREIT.com estimated that only about 6% of all outstanding REITs were mortgage REITs. |
| 9 | At the corporate level, US tax law requires that at least 90% of every REIT’s income must be paid out as tax-exempt cash dividends, but this tax-exempt cash dividend income is 100% taxable income at the share-holder level. Portfolios of tax-deferred pension funds and tax-exempt portfolios owned by tax-exempt charitable institutions would benefit little, or not all, from the tax savings granted to REIT investors. |
| 10 | J.D. Irving, Sierra Pacific Industries [the Emmerson Family], Green Diamond Resource Company [the Reed Family] and Peter Buck are large private owners of US timberland. None own as many acres of timberland as Weyerhaeuser. |
| 11 | See Gutierrez Garzon et al. (2020). https://open.fsc.org/handle/resource/917 (accessed on 21 May 2024). |
| 12 | The FSC, SFI, and good forestry cannot totally eliminate all the harm that might be done by foresters. Working a forest will disrupt the lives of fish, fungi, insects, birds, and other forms of forest life in many subtle but long-lasting ways that are not easy to measure. |
| 13 | For unknown reasons, most timberland REITs have not aggressively endeavored to profit from selling carbon credits. Their managers may prefer to avoid the fraud and greenwashing that sometimes occurs in the carbon credit industry (National Association of Real Estate Investment Trusts (NAREIT) 2023). See: https://www.agriinvestor.com/carbon-credits-are-changing-timberland-ownership-and-investment-models-manulife/ (accessed on 21 May 2024). |
| 14 | For a detailed and informative scholarly discussion of REITs and TIMOs, see Daowei Zhang’s 2021 book entitled From Backwoods to Boardrooms: The Rise of Institutional Investment in Timberland (Zhang 2021). |
| 15 | CatchMark Timber Trust (CTT) is a large REIT that was not included in the index because it is significantly newer than the three REITs we chose to study. Including CTT in Table 2 and Table 3 and the REIT index would have shortened the duration of the sample used to compute the statistics in Table 2. Furthermore, in 2022 PotlatchDeltic merged with CatchMark Timber Trust, Inc. in an all-stock transaction that created an integrated timber REIT. Transactions like this are too complicated to include in our study. |
| 16 | |
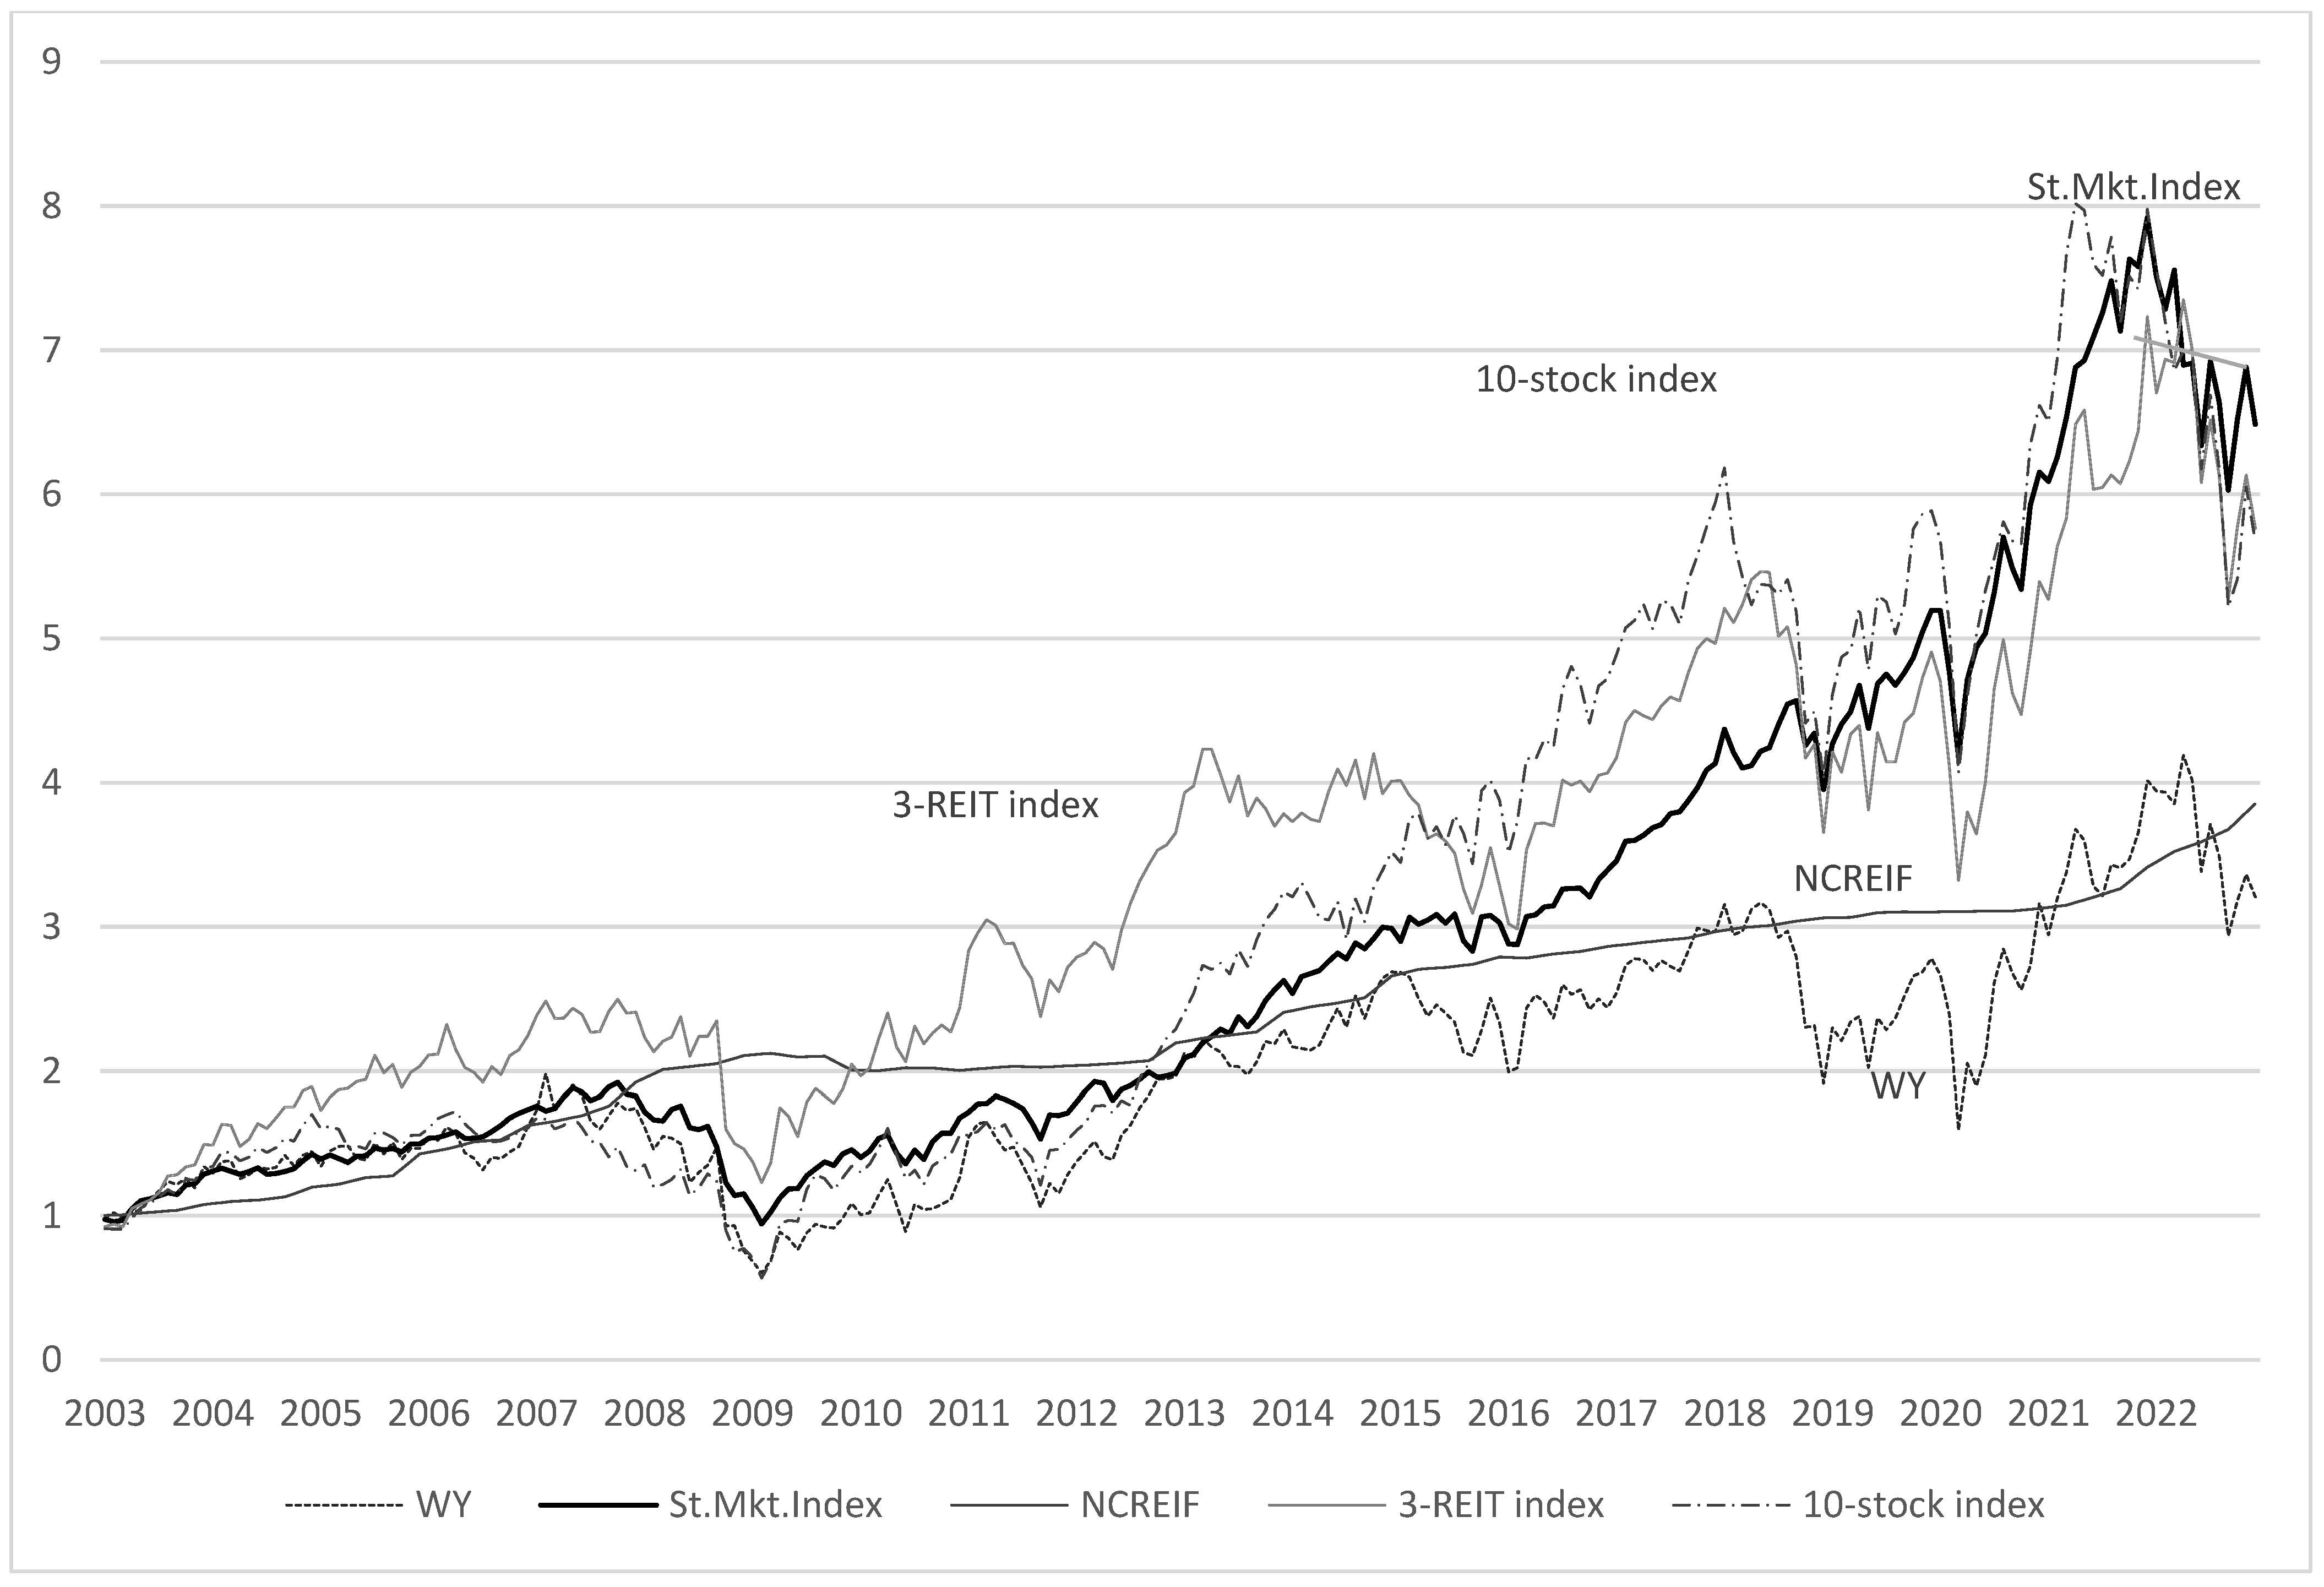
| 17 | Some results in Figure 1 seem to conflict with the results in Table 3. Figure 1 shows that over the 20-year sample the highly diversified stock market index finished slightly above both the 10-stock wood processors’ portfolio and the 3-REIT portfolio. These results conflict with the rankings of the arithmetic average total returns shown in Table 3, because Figure 1 is based on compounded (geometric mean) returns, while Table 3 contains arithmetic average returns. This apparent conflict is not an error, but provides one more example of a well-known statistical phenomenon. The arithmetic average of a series of numbers exceeds the geometric mean of that series by a difference that increases with the variance of the numbers in the series (Young and Trent 1969). |
| 18 | The data are available from Professor French’s website: https://mba.Tuck.Dartmouth.edu/pages/faculty/Ken.French/data_library.html (accessed on 21 May 2024). (Fama and French n.d.). |
| 19 | More saplings are planted in the US every year. Unfortunately, forest fires and other man-made activities destroy more trees than are planted in the US almost every year. In fact, the net number of standing trees in the world is continually decreasing (World Resources Institute 2024). |
References
- BizVibe. 2020. Global Timber and Wood Products Industry Fact Sheet 2020. March 13. Available online: https://blog.bizvibe.com/blog/largest-wood-producing-countries (accessed on 21 May 2024).
- Chapman, Gretchen B., and Eric J. Johnson. 2002. Incorporating the Irrelevant: Anchors in Judgments of Belief and Value. In Heuristics and Biases: The Psychology of Intuitive Judgment. Edited by Thomas Gilovich, Dale Griffin and Daniel Kahneman. New York: Cambridge University Press. [Google Scholar] [CrossRef]
- Chuddy, Rafal P., and Frederick W. Cubbage. 2020. Research trends. Forest investments as a financial asset class. Foreign Policy Economics 119: 102273. [Google Scholar] [CrossRef] [PubMed]
- Cubbage, Frederick, Bruno Kanieski, Rafael Rubilar, Adriana Bussoni, Virginia Morales Olmos, Gustavo Balmelli, Patricio Mac Donagh, Roger Lord, Carmelo Hernández, Pu Zhang, and et al. 2020. Global timber investments, 2005 to 2017. Foreign Policy Economics 112: 102082. [Google Scholar] [CrossRef]
- Ellefson, Paul V., and Michael A. Kilgore. 2010. United States Wood-Based Industry: A Review of Structure and Organization. Staff Paper Series Number 206. St. Paul: Department of Forest Resources, University of Minnesota and Department of Forest Resources, University of Minnesota. Available online: https://conservancy.umn.edu/server/api/core/bitstreams/17c34186-a125-4203-ac64-be6de66be348/content (accessed on 21 May 2024).
- Fama, Eugene, and Kenneth French. n.d. Website at Dartmouth University. Available online: https://mba.Tuck.Dartmouth.edu/pages/faculty/Ken.French/data_library.html (accessed on 21 May 2024).
- Francis, Jack C., and Roger G. Ibbotson. 2009. Contrasting Real Estate with Comparable Investments, 1978 to 2008. Journal of Portfolio Management 36: 141–55. [Google Scholar] [CrossRef]
- Gutierrez Garzon, Alba Rocio, Pete Bettinger, Jacek Siry, Jesse Abrams, Chris V. Cieszewski, Kevin Boston, Bin Mei, Hayati Zengin, and Ahmet Yesil. 2020. A Comparative Analysis of Five Forest Certification Programs. Forests 11: 863. [Google Scholar] [CrossRef]
- Ibbotson, Roger G. 2023. Stocks, Bonds, Bills, And Inflation. New York: CFA Institute Research Foundation Books. [Google Scholar] [CrossRef]
- Ingenhousz, Jan. 1779. Experiments upon Vegetables, Discovering Their Great Power of Purifying the Common Air in Sunshine, and of Injuring It in the Shade and at Night; Washington, DC: Library of Congress. Available online: https://www.loc.gov/item/18000763/ (accessed on 21 May 2024).
- Markowitz, Harry. 1952. Portfolio Selection. Journal of Finance 7: 77–91. [Google Scholar]
- Markowitz, Harry. 1959. Portfolio Selection: Efficient Diversification of Investments. New York: John Wiley and Sons Inc. Available online: https://www.jstor.org/stable/j.ctt1bh4c8h (accessed on 21 May 2024).
- National Association of Real Estate Investment Trusts (NAREIT). 2023. Organization’s Website. Available online: https://www.reit.com/nareit (accessed on 21 May 2024).
- Securities and Exchange Commission (SEC). n.d. Use EDGAR Software to Find Numerous REIT Filings. Washington, DC: Securities and Exchange Commission (SEC).
- Sharpe, William F. 1963. A Simplified Model for Portfolio Analysis. Management Science 9: 277–93. [Google Scholar] [CrossRef]
- Sharpe, William F. 1964. Capital Asset Prices. Journal of Finance 19: 425–42. [Google Scholar] [CrossRef]
- Sharpe, William F. 1966. Mutual fund performance. Journal of Business 39: 119–38. Available online: https://www.jstor.org/stable/2351741 (accessed on 21 May 2024).
- Sherif, Muzafer, Daniel Taub, and Carl I. Hovland. 1958. Assimilation and contrast effects of anchoring stimuli on judgments. Journal of Experimental Psychology 55: 150–55. [Google Scholar] [CrossRef] [PubMed]
- Smith, Rich. 2016. International Paper Buys Weyerhaeuser, But Not All of It. The Motley Fool. May 9. Available online: https://www.fool.com/investing/general/2016/05/09/international-paper-buys-weyerhauser-but-not-all-o.aspx (accessed on 21 May 2024).
- Swensen, David F. 2009. Pioneering Portfolio Management. New York: Free Press. Available online: https://www.academia.edu/49732730/Pioneering_Portfolio_Management_2009_ (accessed on 21 May 2024).
- Tobin, J. 1958. Liquidity preference as behavior toward risk. The Review of Economic Studies 25: 65–86. [Google Scholar] [CrossRef]
- Treynor, Jack L. 1965. How to Rate Management of Investment Funds. Harvard Business Review 43: 63–75. [Google Scholar] [CrossRef]
- Treynor, Jack, and Fischer Black. 1973. How to Use Security Analysis to Improve Portfolio Selection. Journal of Business 46: 66–86. [Google Scholar] [CrossRef]
- Walker, Anthony P., Martin G. De Kauwe, Ana Bastos, Soumaya Belmecheri, Katerina Georgiou, Ralph F. Keeling, Sean M. McMahon, Belinda E. Medlyn, David J. P. Moore, Richard J. Norby, and et al. 2021. Integrating the evidence for a terrestrial carbon sink caused by increasing atmospheric CO2. New Phytologist 229: 2413–45. [Google Scholar] [CrossRef] [PubMed]
- World Resources Institute. 2024. Forest Loss Leader. Global Forest Review, April 4. [Google Scholar]
- Young, William E., and Robert H. Trent. 1969. Geometric mean approximations of individual security and portfolio performance. Journal of Financial and Quantitative Analysis 4: 179–200. [Google Scholar] [CrossRef]
- Zhang, Daowei. 2021. From Backwoods to Boardrooms: The Rise of Institutional Investment in Timberland. [CrossRef]

| Year | 1987 | 2022 |
|---|---|---|
| Number of NCREIF properties | 5 properties | 464 properties |
| Aggregate NCREIF acreage | 39,452 acres | 12,431,918 acres |
| Average NCREIF property size | 7890 acres | 26,973 acres |
| Corporation | Listed | Ticker Symbol | HQ Location | Website | Acres Owned |
|---|---|---|---|---|---|
| Weyerhaeuser Co. | NYSE | WY | Seattle, WA, USA | www.weyerhaeuser.com (accessed on 21 May 2024) | 10–12 million |
| Rayonier, Inc. | NYSE | RYN | Wildlight, FL, USA | www.rayonier.com (accessed on 21 May 2024) | 2.4 million |
| PotLatchDeltic Corp. | NYSE | PCH | Spokane, WA, USA | www.potlatchdeltic.com (accessed on 21 May 2024) | 1.8 million |
| Statistic | Ibbotson Stock Market Index | WY REIT | RYN REIT | PCH REIT | 3-REIT Portf. * | 10-Stock Portf. * | NCREIF |
|---|---|---|---|---|---|---|---|
| Arithmetic annual total return,% | 10.99% | 10.89% | 14.65% | 15.10% | 12.24% | 12.40% | 7.01% |
| Annual geometric mean total return,% | 9.80% | 5.99% | 11.54% | 11.17% | 9.15% | 9.06% | 6.98% |
| Mean monthly total return | 0.0087 | 0.0086 | 0.0114 | 0.0118 | 0.0096 | 0.0098 | 0.0056 |
| Standard deviation | 0.0426 | 0.0860 | 0.0676 | 0.0768 | 0.0680 | 0.0714 | 0.4261 |
| Skewness | −0.596 | −0.293 | −0.362 | 0.061 | −0.268 | 0.169 | 1.643 |
| Beta, | NA | 1.427 | 0.949 | 1.171 | 1.185 | 1.382 | −0.007 |
| Sharpe ratio | 0.1880 | 0.0814 | NA | NA | 0.1177 | 0.1139 | NA |
| Treynor ratio | 0.0071 | 0.0070 | NA | NA | 0.0080 | 0.0059 | NA |
| Corporation | Listing Exchange | Ticker Symbol | HQ Location |
|---|---|---|---|
| American Woodmark | NASDAQ | AMWD | Winchester, VA, USA |
| Glatfelter Corporation | NYSE | GLT | Charlotte, NC, USA |
| International Paper Co. | NYSE | IP | Memphis, TN, USA |
| Kimberly-Clark Corp. | NYSE | KMB | Dallas, TX, USA |
| Louisiana-Pacific Corp. | NYSE | LPX | Nashville, TN, USA |
| Mohawk Industries, Inc. | NYSE | MHK | Calhoun, GA, USA |
| Masco Corporation | NYSE | MAS | Livonia, MI, USA |
| Packaging Corp. of America | NYSE | PKG | Lake Forest, IL, USA |
| Sonoco Products Company | NYSE | SON | Hartsville, SC, USA |
| UFP Industries, Inc. | NASDAQ | UFPI | Grand Rapids, MI, USA |
| Statistic | AMWD | KMB | IP | MAS | LPX | Stock Market Index |
|---|---|---|---|---|---|---|
| Arithmetic annual total return, % | 14.06% | 10.60% | 9.5655% | 13.76% | 27.04% | 10.99% |
| Annual geometric mean return, % | 4.15% | 9.27% | 3.85% | 7.09% | 11.60% | 9.80% |
| Mean monthly total return | 0.0110 | 0.0084 | 0.0076 | 0.01080 | 0.0201 | 0.0087 |
| Geometric mean mon. total return | 0.0034 | 0.0074 | 0.0031 | 0.0057 | 0.0092 | 0.0078 |
| Standard deviation | 0.1227 | 0.0454 | 0.0976 | 0.1003 | 0.1500 | 0.0426 |
| Skewness | −0.015 | 0.119 | 1.794 | 0.135 | 0.8426 | −0.596 |
| Beta, | 1.485 | 0.437 | 1.533 | 1.667 | 2.029 | NA |
| Statistic | GLT | SON | MHK | UFPI | PKG | 10-Stock Port. * |
| Arithmetic annual total return,% | 2.00% | 10.66% | 10.84% | 22.39% | 17.87% | 12.39% |
| Annual geometric mean return,% | 0.083% | 9.39% | 9.57% | 13.76% | 13.82% | 9.07% |
| Mean monthly total return | 0.0016 | 0.0085 | 0.0086 | 0.0169 | 0.0138 | 0.0098 |
| Geometric mean total return | −0.0042 | 0.0068 | 0.0024 | 0.0108 | 0.010844 | 0.0072 |
| Standard deviation | 0.1072 | 0.0577 | 0.1120 | 0.1125 | 0.0767 | 0.0715 |
| Skewness | 0.033 | −0.186 | 0.552 | 0.260 | −0.198 | 0.169 |
| Beta, | 1.442 | 0.875 | 1.626 | 1.496 | 1.201 | 1.382 |
Disclaimer/Publisher’s Note: The statements, opinions and data contained in all publications are solely those of the individual author(s) and contributor(s) and not of MDPI and/or the editor(s). MDPI and/or the editor(s) disclaim responsibility for any injury to people or property resulting from any ideas, methods, instructions or products referred to in the content. |
© 2024 by the authors. Licensee MDPI, Basel, Switzerland. This article is an open access article distributed under the terms and conditions of the Creative Commons Attribution (CC BY) license (https://creativecommons.org/licenses/by/4.0/).
Share and Cite
Francis, J.C.; Zhang, G. Investing in US Timberland Companies. J. Risk Financial Manag. 2024, 17, 220. https://doi.org/10.3390/jrfm17060220
Francis JC, Zhang G. Investing in US Timberland Companies. Journal of Risk and Financial Management. 2024; 17(6):220. https://doi.org/10.3390/jrfm17060220
Chicago/Turabian StyleFrancis, Jack Clark, and Ge Zhang. 2024. "Investing in US Timberland Companies" Journal of Risk and Financial Management 17, no. 6: 220. https://doi.org/10.3390/jrfm17060220
APA StyleFrancis, J. C., & Zhang, G. (2024). Investing in US Timberland Companies. Journal of Risk and Financial Management, 17(6), 220. https://doi.org/10.3390/jrfm17060220