
A Mathematical Formulation of the Valuation of Ether and Ether Derivatives as a Function of Investor Sentiment and Price Jumps


Abstract
:1. Introduction
2. Review of Literature
3. Findings and Analysis
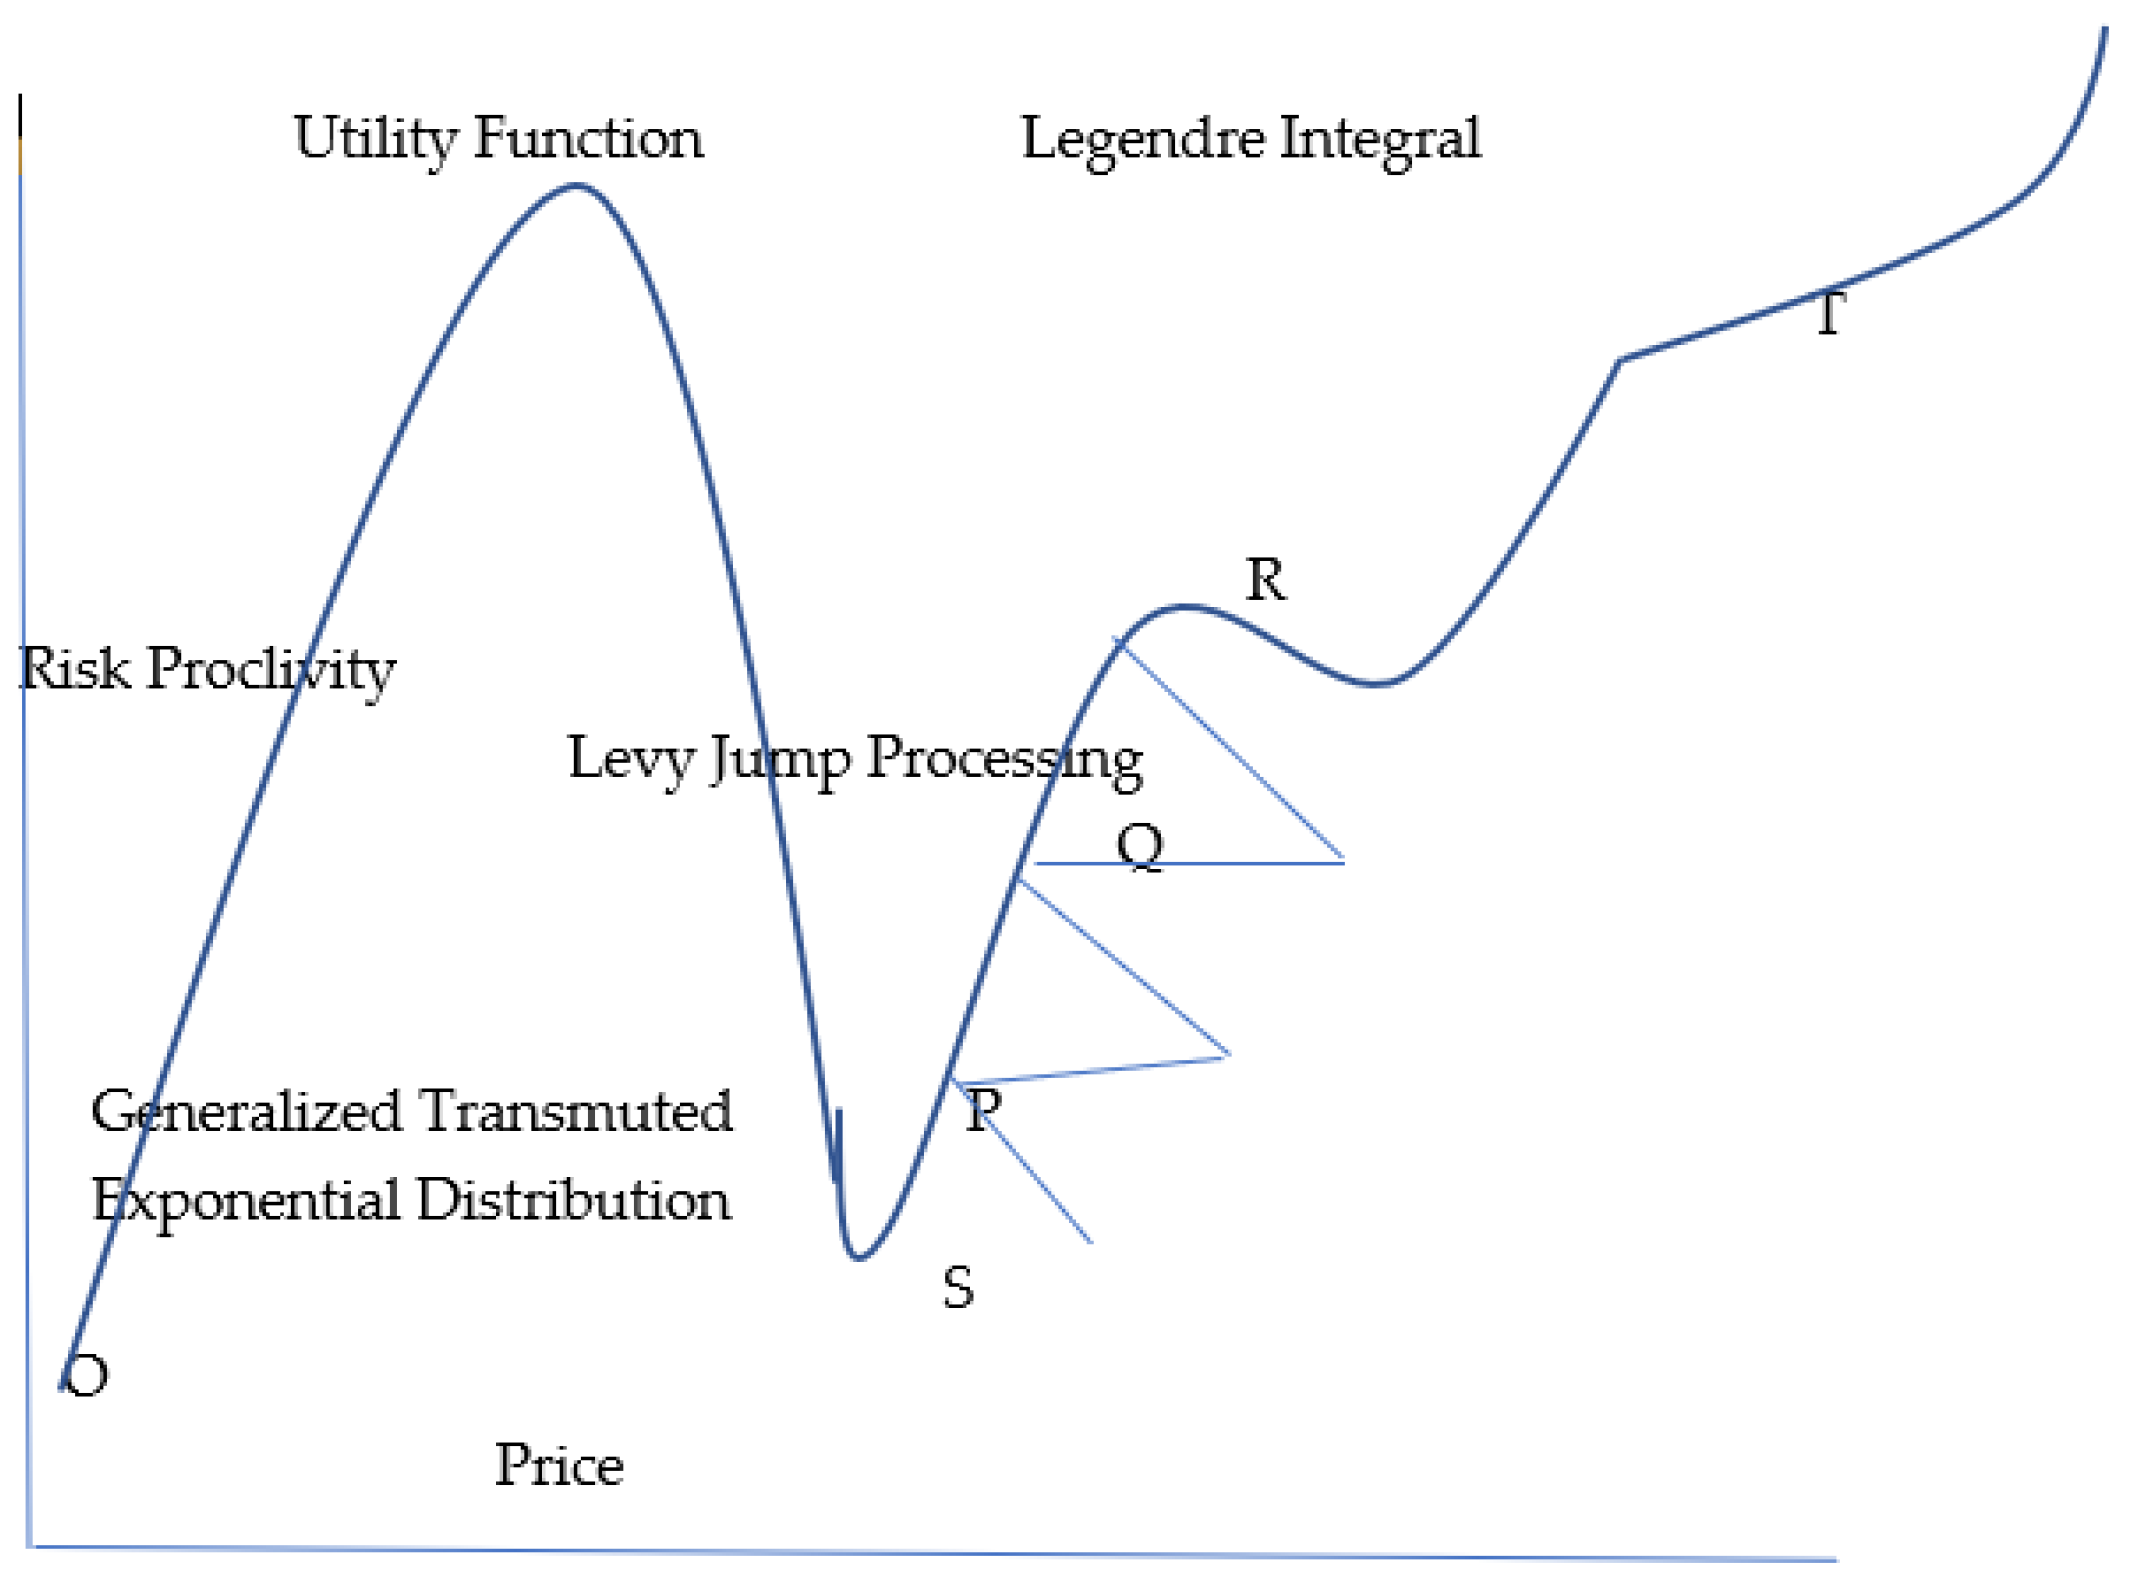
3.1. Valuation of Ether by the Risk-Averse Investor
- λ = the exponents of the exponential distribution, or the amount by which ether prices increase,
- α, γ = constants in the generalized transmuted exponential distribution,
- x = the price of ether in the generalized transmuted exponential distribution.
- x1 = price of ether,
- k = constant in the gamma distribution,
- θ = step function of the gamma distribution,
- x = price of ether,
- d = constant,
- w = expectation of ether superseding bitcoin in price.
- z = z is a real number in the interval −1 ≤ x ≤ 1.
- v = gradient vector in a leptokurtic distribution of ether prices,
- X = price of ether in the leptokurtic distribution,
- = mean of a leptokurtic distribution,
- w = investor expectations of tail risk,
- = variance of ether prices in the tails, or actual tail risk.
Objective Function and Constraints
- s = arc length of the secant line,
- ρ = radius of curvature of the line of aberrancy at the point of tangency,
- xt = expectation of ether valuation,
- yt = risk aversion towards ether investment (Schot 1978).
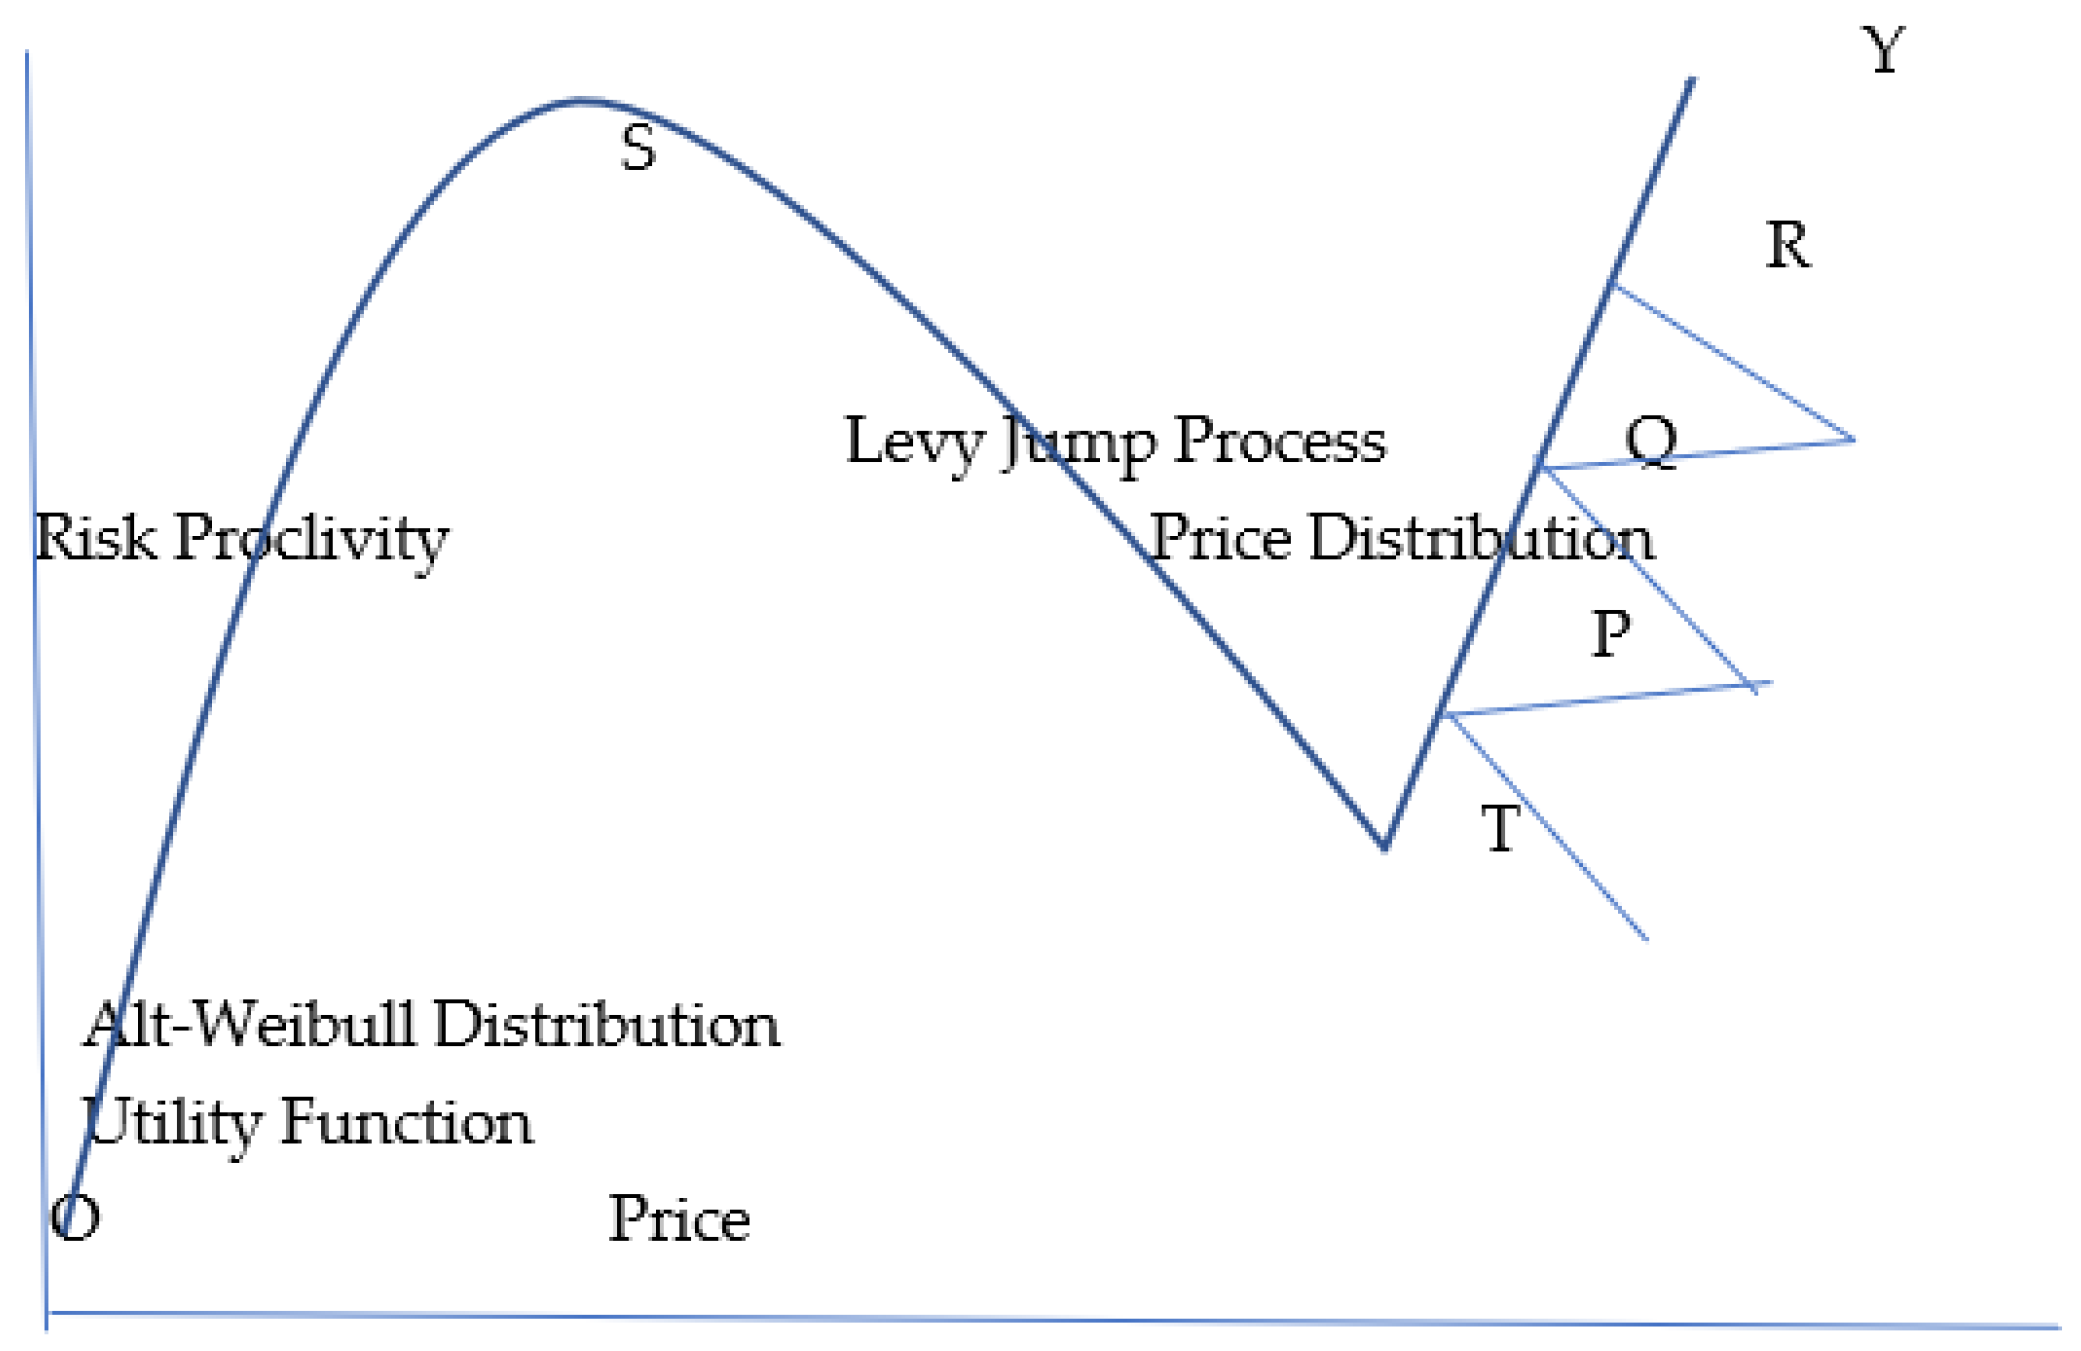
3.2. Valuation of Ether by the Moderate Risk-Taker
Objective Function and Constraints
- = attributes of ether,
- = attributes of bitcoin.
- γ = constant increase in ether prices,
- B = constant increase in ether prices,
- X = jump in ether prices,
- S = change in stock prices of stocks, and ether in the portfolio,
- r1, r2, r3 = returns of stocks and ether in the portfolio.
- = probability of a gamble,
- m1/m2 = coefficient of risk aversion for a gamble,
- θ = return from a gamble
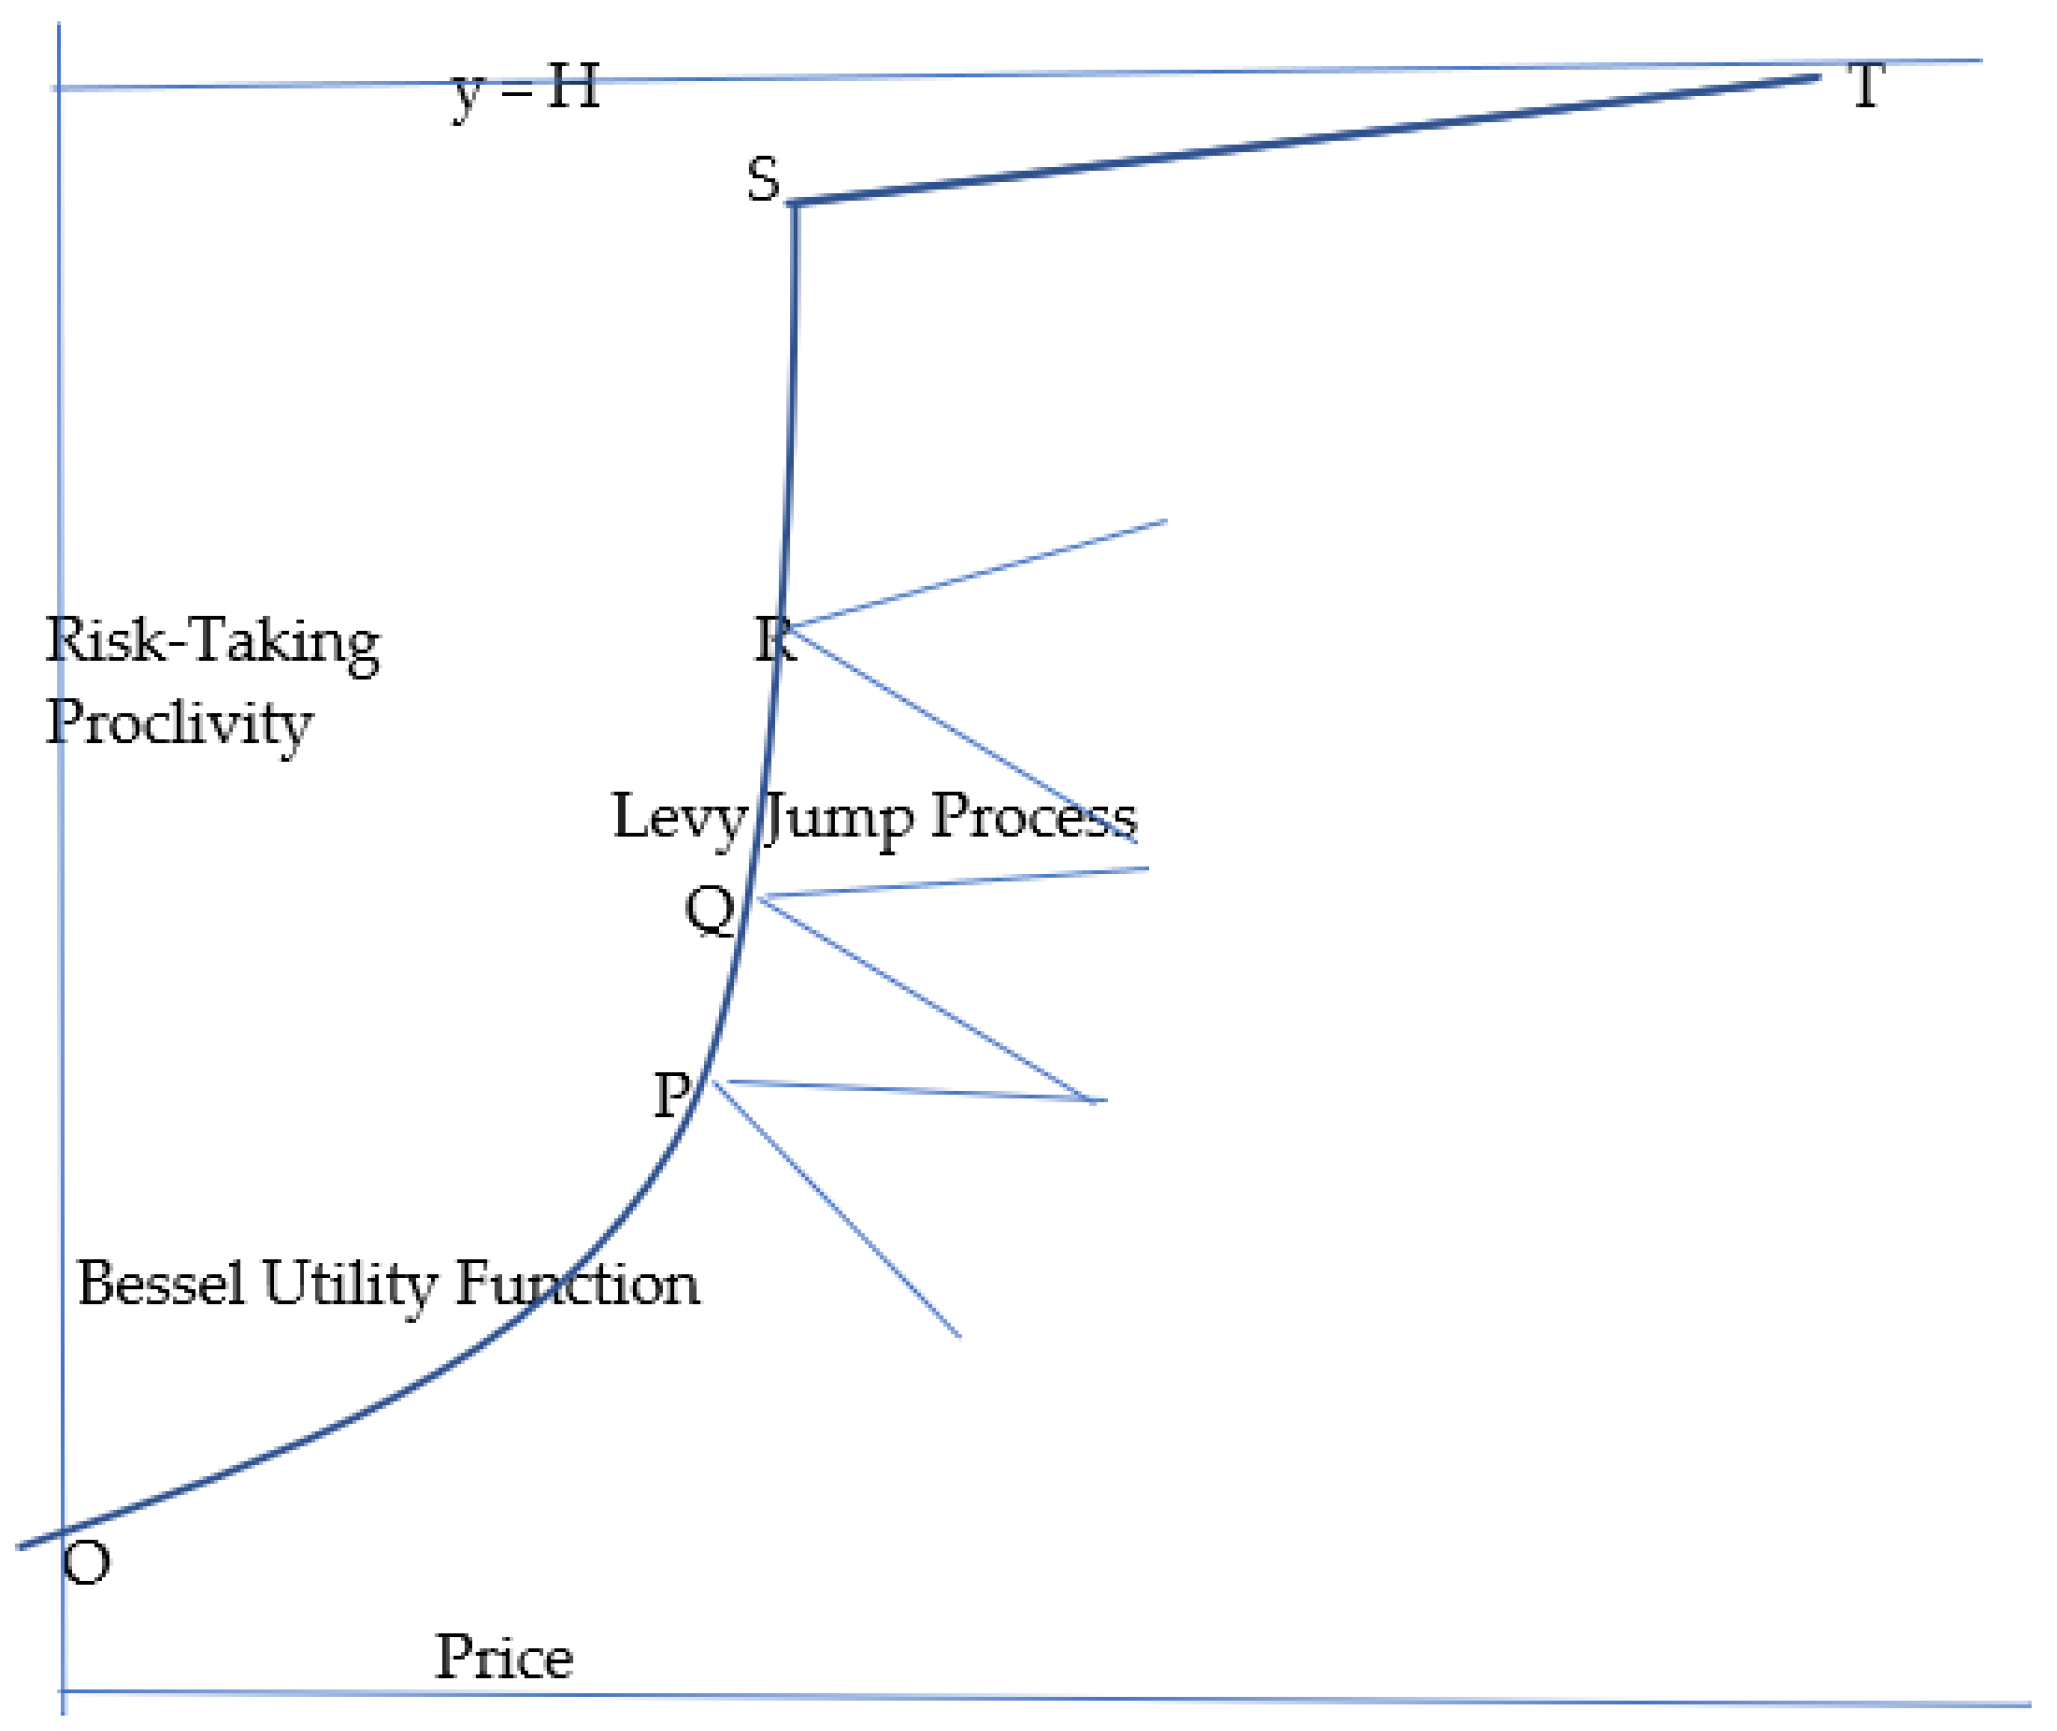
3.3. Valuation of Ether by the Risk-Taker
The Objective Function and Constraints
- t = time,
- x = the price of ether,
- z = x + iy, x, y, v real numbers;
- k = shape parameter,
- θ = scale parameter;
- v = degree of the Legendre integral, usually 1, or 2,
- μ = order of the Legendre integral, usually 1,
- z = a real number in the interval, −1 ≦ x ≦ 1,
- = gradient vector, to reduce ether’s risk as late mover.
- Tt = trade price,
- B1 = buying price,
- A = selling price,
- H = highest purchase price,
- x = price of ether,
- n = news that enters prices,
- H = highest purchase price.

4. The Valuation of Ether Derivatives
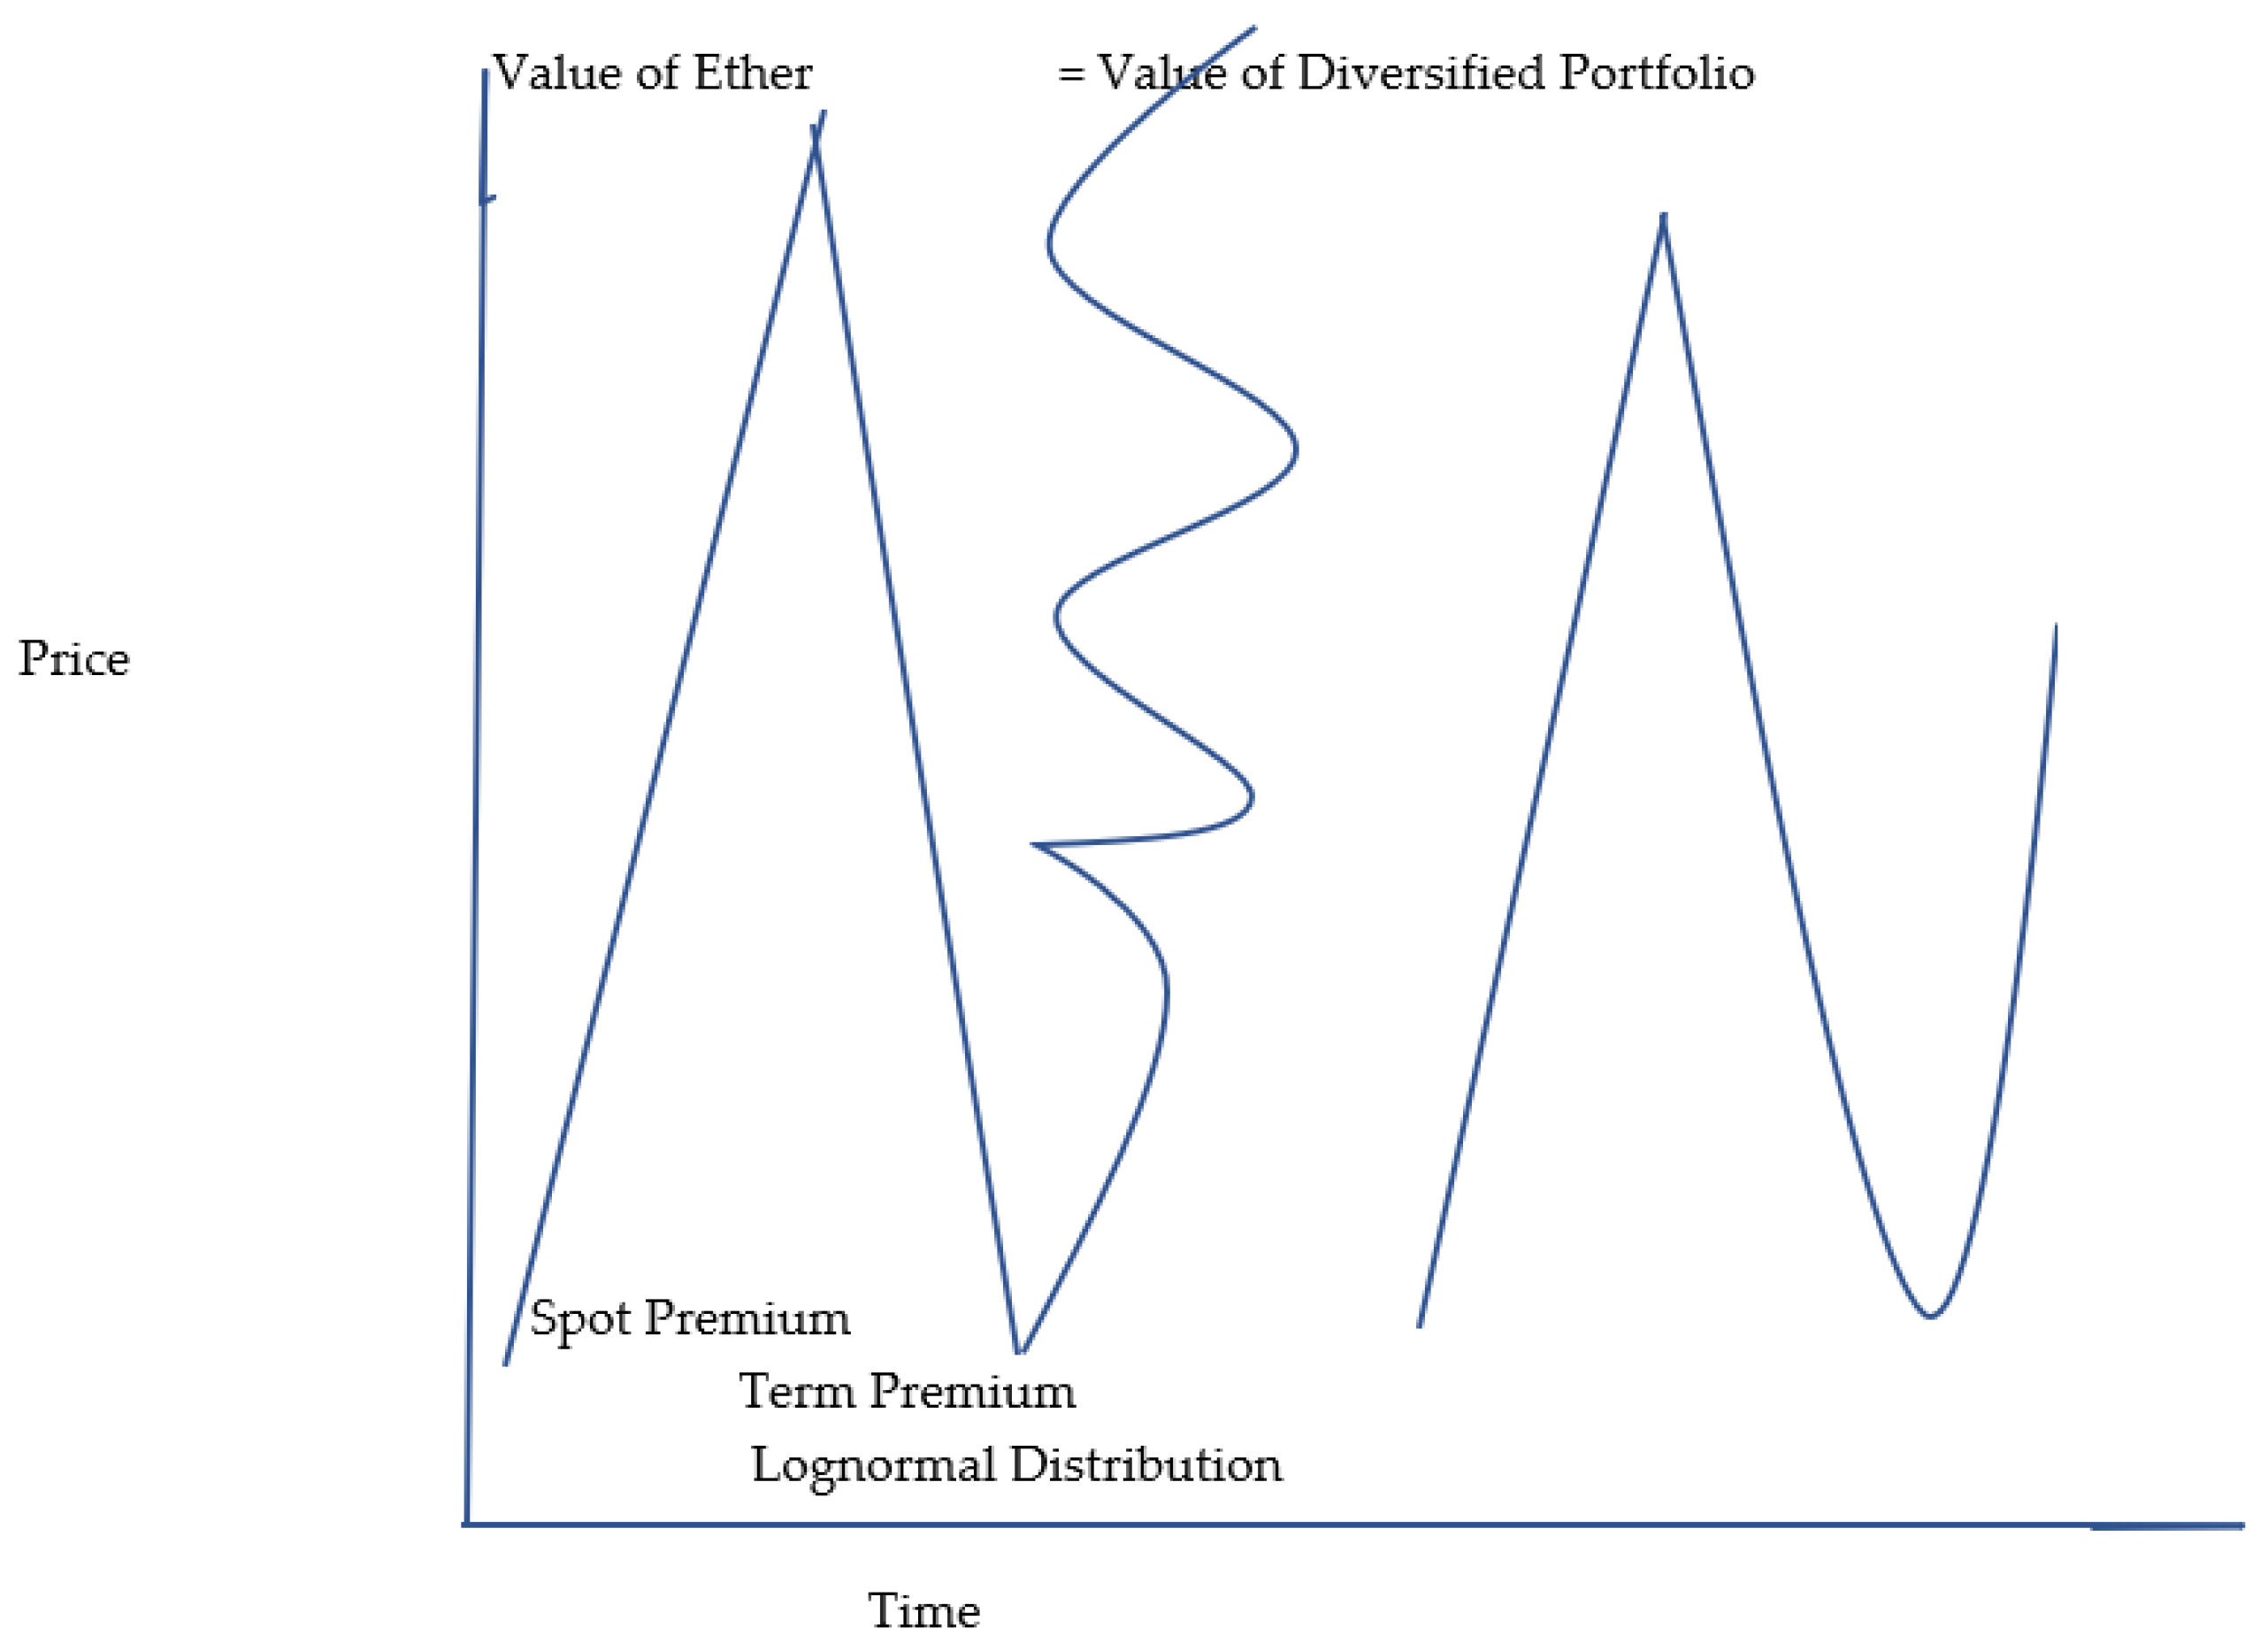
4.1. Futures
Objective Function and Constraints
- Spot Premium = price on the date of contract,
- t1 = time-period 1, the day of entering into the contract,
- μ = mean of the lognormal distribution,
- σ = standard deviation of a lognormal distribution,
- k = spot price of ether futures,
- φ = constant.
- Term Premium = the price paid for the fluctuation in ether futures prices during the three-month delivery period,
- = Levy jump process, or a series of sharp increases in ether futures prices during the delivery period,
- x = price of ether futures,
- s = change in ether futures price,
- γ = size of jump,
- B = constant,
- = skewness,
- x = price of ether futures,
- t = time, during the delivery period,
- s = change in ether futures price,
- x = price of ether futures,
- t = time, during the delivery period,
- s = change in ether futures price,
- = kurtosis of ether futures prices.
- V1 = number of ether futures units at the spot price,
- V2 = number of ether futures units at the delivery period price.
5. Findings and Analysis: The Valuation of Ether Options
Value of a Call Option on Ether
- (Price of Ether Call×Fokker–Planck Equation of Upside Ether Call Trajectory) +
- (Price of Ether Put×Fokker–Planck Equation of Downside Ether Put Trajectory) +
- (Short Sale Price – Purchase Price on Bond 1) × Bond Price Path +
- (Sales Price − Purchase Price on Bond 2) × Bond Price Path
- = price trajectory of a call option,
- C = price of a call option,
- x1 = random variable of call prices,
- x1′ − x1 = change in call values along the path,
- D1(x,t) = diffusion coefficients of call values along the path in time periods, t1 and t2,
- = a Fourier integral of incremental changes in call values,
- P = price of a put option,
- x2 = random variable of put prices,
- x2′ − x2 = change in put values along the path,
- D2(x,t) = diffusion coefficients of put values along the path in time periods, t1 and t2,
- = a Fourier integral of incremental
- changes in put values,
- trajectory of bond prices for short-term bonds, (Short Sale Price − Purchase Price on Bond 1) on Bond 1,
- = Trajectory of bond prices for long term bonds, (Sales Price − Purchase Price on Bond 2) on Bond 2.
- x values on the left of Equation (19) = ether prices, if ether prices increase,
- x values on the right of Equation (19) = ether prices, if ether prices decrease.
- x = range of bitcoin prices,
- p = probability of ether displacing bitcoin,
- q = probability of bitcoin displacing ether,
- Y = is the range of ether prices, given bitcoin prices, with the second derivative of the probability of ether displacing bitcoin, p at the maximum benefit of ether, so that the right side of Equation (20) = the incremental positive benefit from bitcoin’s continued use,
- is less than the benefit from using ether,
- = positive benefit from bitcoin’s continued use,
- = benefit from using ether,
- ε = the incremental time interval over which the Fokker–Planck equation describing the path of call options holds.

6. Empirical Validation
7. Conclusions
Author Contributions
Funding
Data Availability Statement
Conflicts of Interest
Appendix A
Appendix B
Appendix C
Appendix D
Appendix E
References
- Abraham, Rebecca. 2018. Pricing currency call options. Theoretical Economics Letters 8: 2569–93. [Google Scholar] [CrossRef] [Green Version]
- Abraham, Rebecca. 2019. Hedge fund investing or mutual fund investing: An application of multi-attribute utility theory. Theoretical Economics Letters 9: 605–32. [Google Scholar] [CrossRef] [Green Version]
- Bain, Benjamin. 2018. Ether Futures Likely Stalled as CFTC Launches Review of Token. Available online: https://www.bloomberg.com/news/articles/2018-12-11/ether-futures-likely-stalled-as-cftc-launches-review-of-token (accessed on 1 June 2020).
- Brunnermeir, Markus K., and Stefan Nagel. 2004. Hedge funds and the technology bubble. Journal of Finance 59: 2013–40. [Google Scholar] [CrossRef] [Green Version]
- Burgrraf, Tobias, Toan Luu Duc Huynh, Markus Rudolf, and Mei Wang. 2020. Do FEARS drive bitcoin? Review of Behavioral Finance 13: 239–58. [Google Scholar] [CrossRef]
- Burnside, Craig, Isaac Kleshchelski, and Sergio Robelo. 2006. The Returns to Currency Speculation. Working Paper, No. 12489. Cambridge: National Bureau of Economic Research. [Google Scholar]
- Cespa, Giovanni, and Xavier Vives. 2012. Dynamic trading and asset prices. The Review of Economic Studies 79: 539–80. [Google Scholar] [CrossRef] [Green Version]
- Chen, Joseph, Harrison Hong, and Jeremy C. Stein. 2002. Breadth of ownership and stock returns. Journal of Financial Economics 66: 171–205. [Google Scholar] [CrossRef] [Green Version]
- Cox, John C., Jonathan E. Ingersoll, and Stephen A. Ross. 1981. A reexamination about traditional hypotheses about the term structure of interest rates. Journal of Finance 36: 769–99. [Google Scholar] [CrossRef]
- Doob, Joseph L. 1940. Regularity properties of certain families of chance variables. Transactions of the American Mathematical Society 47: 455–86. [Google Scholar] [CrossRef]
- Easley, David O., Maureen O’Hara, and Pulle Subrahmanya Srinivas. 1998. Option volume and stock prices: Evidence on where informed traders trade. Journal of Finance 53: 431–65. [Google Scholar] [CrossRef]
- Eom, Cheolijun, Taisei Kaizoji, Sang Hoon Kang, and Lukas Pichl. 2019. Bitcoin and investor sentiment: Statistical characteristics and predictability. Physica A: Statistical Mechanics and Its Applications 514: 511–21. [Google Scholar] [CrossRef]
- Fama, Eugene F. 1984. Forward and spot exchange rates. Journal of Monetary Economics 4: 319–38. [Google Scholar] [CrossRef]
- Garcia, David, and Frank Schweitzer. 2015. Social signals and algorithmic trading of bitcoin. Royal Society Open Science 2: 1–13. [Google Scholar] [CrossRef] [PubMed] [Green Version]
- Garcia, David, Claudio J. Tessone, Pavlin Mevrodiev, and Nicholas Perony. 2014. The digital traces of bubbles: Feedback cycles between socio-economic signals in the Bitcoin economy. Journal of Royal Society Interface 11: 20140623. [Google Scholar] [CrossRef] [PubMed]
- Gorton, Gary B., Fumio Hayashi, and K. Geert Rouwenhorst. 2012. The Fundamentals of Commodity Futures Returns. Working Paper. New Haven: Yale University. [Google Scholar]
- Harrison, John Michael, and David C. Kreps. 1978. Speculative investor behavior in a stock market with heterogeneous expectations. Journal of Economics 92: 323–36. [Google Scholar] [CrossRef] [Green Version]
- Hayes, Adam S. 2017. Cryptocurrency value formation: An empirical study leading to a cost of production model for valuing bitcoin. Telematics and Informatics 34: 1308–21. [Google Scholar] [CrossRef]
- Ishanti, Marco, and Karim R. Lakhani. 2017. The truth about blockchain. Harvard Business Review 95: 118–27. [Google Scholar]
- Kent, Damiel, and David Hirshleifer. 2015. Overconfident investors, predictable returns, and excessive trading. The Journal of Economic Perspectives 29: 61–87. [Google Scholar]
- Keynes, John Maynard. 1936. The General Theory of Employment, Interest, and Money. London: Palgrave MacMillan. [Google Scholar]
- Kristoufek, Ladislav. 2013. Bitcoin meets Google Trends and Wikipedia: Quantifying the relationship between phenomena of the Internet era. Scientific Reports 3: 3415–20. [Google Scholar] [CrossRef] [Green Version]
- Lam, Eric, and David Wee. 2017. Bitcoin prices bubble-like after rally: Blackrock. Bloomberg Wire Services, December 1–2, 1–3. [Google Scholar]
- Leiberman, Marvin B., and David B. Montgomery. 1988. First-mover advantages. Strategic Management Journal 9: 44–58. [Google Scholar] [CrossRef]
- Levy, Ari, and Mackenzie Sigalos. 2022. Crypto Peaked a Year Ago-Investors Have Lost More Than $2 Trillion Since. Available online: cnbc.com/2022/11/11/crypto-peaked-in-nov-2021-investors-lost-more-than-2trillion-since.html (accessed on 12 December 2021).
- Malwa, Sri. 2018. Ethereum: Cashing out Fears Drive Falling Ether Prices, Protocol Co-Founder Refutes Worries. Available online: https://crytoslate.com/ethereum-cashing-out-fears-drive-falling-ether-prices-protocol-co-founder-refutes-worries (accessed on 12 December 2021).
- Merovci, Faton, Morad Alizadeh, and Gholamhossein Hamedani. 2016. Another generalized transmuted family of distributions: Properties and applications. Austrian Journal of Statistics 45: 71–93. [Google Scholar] [CrossRef] [Green Version]
- Mian, Mujtaba G., and Srinivasan Sankaraguruswamy. 2012. Investor sentiment and stock market response to earnings news. The Accounting Review 87: 1357–84. [Google Scholar] [CrossRef]
- Miller, Edwin. 1977. Risk, uncertainty, and divergence of opinion. Journal of Finance 32: 1151–68. [Google Scholar] [CrossRef]
- Nasir, Mohammad A., Toan Luu Duc Huynh, Sang Phu Nguyen, and Day Duong. 2019. Forecasting cryptocurrency returns and volume using search engines. Financial Innovation 5: 25. [Google Scholar] [CrossRef]
- Oxford Analytics Daily Brief Services. 2018. China: Firms Expect Bright Future for Blockchain. Available online: https://search-proquest.com/ezproxylocallibrary.nova.edu (accessed on 12 December 2021).
- Park, Andreas, and Hamid Sabourian. 2011. Herding and contrarian behavior in financial markets. Econometrica 79: 973–1026. [Google Scholar] [CrossRef] [Green Version]
- Prakash, Arun, Chun-Hao Chang, Shahid Hamid, and Michael Smyser. 1996. Why a decision maker may prefer a seemingly unfair gamble. Decision Sciences 17: 239–53. [Google Scholar] [CrossRef]
- Schot, Steven. 1978. Aberrancy: Geometry of the third derivative. Mathematics Magazine 51: 259–75. [Google Scholar] [CrossRef]
- Shleifer, Andrei, and Robert W. Vishny. 1977. The limits of arbitrage. Journal of Finance 52: 35–55. [Google Scholar] [CrossRef]
- Spence, Michael. 1984. Cost reduction, competition, and industry performance. Econometrica 52: 101–21. [Google Scholar] [CrossRef]
- Wong, Alan, and Brian Carducci. 1991. Sensation seeking and financial risk-taking in everyday money matters. Journal of Business and Psychology 5: 525–530. [Google Scholar] [CrossRef]
- Wood, Charlie. 2017. The rise of bitcoin, why bytes are worth more than gold for now. Christian Science Monitor 50: 1–5. [Google Scholar]
- Yip, George. 1982. Barriers to Entry. Lexington: Lexington Books. [Google Scholar]


| Panel A: The Risk-Averse Investor | |||
| Variable | Coefficient | T Value | Significance |
| Constant | 16.90 | 1.45 | 0.14 |
| Risk-Aversion | 1.00 | 247.2 | 0.00 *** |
| Jumps | 0.58 | 27.14 | 0.00 *** |
| Panel B: The Moderate Risk-Taker | |||
| Variable | Coefficient | T Value | Significance |
| Constant | 1.35 | −0.13 | 0.89 |
| Moderate Risk Sentiment | 0.99 | 291.59 | 0.00 *** |
| Jumps | 0.66 | 37.85 | 0.00 *** |
| Panel C: The Risk-Taker | |||
| Variable | Coefficient | T Value | Significance |
| Constant | 0.22 | 0.02 | 0.98 |
| Risk-Taker | 0.98 | 271.66 | 0.00 *** |
| Jumps | 0.58 | 30.91 | 0.00 *** |
| Panel D: Ether Futures | |||
| Variable | Coefficient | T Value | Significance |
| Constant | 18.48 | 13.12 | 0.00 *** |
| Volume | −0.02 | −2.87 | 0.004 ** |
| Jumps | 0.0008 | 0.18 | 0.85 |
| Panel E: Ether Options | |||
| Variable | Coefficient | T-Value | Significance |
| Constant | 27.23 | 3.04 | 0.002 ** |
| Volume | −5.28 | −2.70 | 0.006 ** |
| Jumps | 2.05 | 2.15 | 0.03 * |
| Time | 1.43 | 0.30 | 0.76 |
Publisher’s Note: MDPI stays neutral with regard to jurisdictional claims in published maps and institutional affiliations. |
© 2022 by the authors. Licensee MDPI, Basel, Switzerland. This article is an open access article distributed under the terms and conditions of the Creative Commons Attribution (CC BY) license (https://creativecommons.org/licenses/by/4.0/).
Share and Cite
Abraham, R.; El-Chaarani, H. A Mathematical Formulation of the Valuation of Ether and Ether Derivatives as a Function of Investor Sentiment and Price Jumps. J. Risk Financial Manag. 2022, 15, 591. https://doi.org/10.3390/jrfm15120591
Abraham R, El-Chaarani H. A Mathematical Formulation of the Valuation of Ether and Ether Derivatives as a Function of Investor Sentiment and Price Jumps. Journal of Risk and Financial Management. 2022; 15(12):591. https://doi.org/10.3390/jrfm15120591
Chicago/Turabian StyleAbraham, Rebecca, and Hani El-Chaarani. 2022. "A Mathematical Formulation of the Valuation of Ether and Ether Derivatives as a Function of Investor Sentiment and Price Jumps" Journal of Risk and Financial Management 15, no. 12: 591. https://doi.org/10.3390/jrfm15120591
APA StyleAbraham, R., & El-Chaarani, H. (2022). A Mathematical Formulation of the Valuation of Ether and Ether Derivatives as a Function of Investor Sentiment and Price Jumps. Journal of Risk and Financial Management, 15(12), 591. https://doi.org/10.3390/jrfm15120591