Article

Integrated Intellectual Investment Portfolio as an Efficient Instrument to Manage Personal Financial Investment

by
Aleksandras Vytautas Rutkauskas
1 and
Viktorija Stasytytė
2,*
1
Education Academy, Vytautas Magnus University, T. Ševčenkos Str. 31, 03111 Vilnius, Lithuania
2
Institute of Dynamic Management, Vilnius Gediminas Technical University, Saulėtekio Ave. 11, 10223 Vilnius, Lithuania
*
Author to whom correspondence should be addressed.
J. Risk Financial Manag. 2022, 15(1), 30; https://doi.org/10.3390/jrfm15010030
Submission received: 19 November 2021 / Revised: 4 January 2022 / Accepted: 7 January 2022 / Published: 11 January 2022
(This article belongs to the Special Issue Household Finance)

Abstract

:
The redistribution of resources in global stock markets is prevalent: the capital is transferred from one investor to another. Sometimes, earning a substantial return in the stock market seems complicated to implement for an individual investor. Investing contributes to the welfare of society and the wealth of citizens. This is why people should look for efficient ways to invest. Investment should become a natural part of personal finance management in the majority of households. For this reason, an investment model is developed where stocks are selected based only on market intelligence using historical data. The model helps find one or several stocks that generate the highest return on a separate step. Applying this model, experiments were performed with daily data from German, US, and UK stock markets. The possibility of obtaining higher than average returns in these markets has been noticed. In the German market, during the 97-day period, the authors obtained a 1.46 return, which implies a 2.31 annual return: in the USA market, a 2.37 return (7.93 annual return), and in the UK market, a 1.90 return (4.09 annual return). Thus, the proposed investment decision-making system could be an efficient tool for forming a sustainable individual or household portfolio. It can generate higher investment returns for an investor and, moreover, make the market more efficient by applying market intelligence and related historical data.

1. Introduction

In many cases, the allocation of investment returns among financial investors can be treated as a repetitive process. A portion of the funds invested by one investor is transferred to other investors. The recurrence of a situation close to the one mentioned undoubtedly disturbs the enthusiasm of investors. It is claimed that the financial system is inefficient in fostering the creative power of the used financial resources. It is well-established that insightful investment in a perspective permeated by the sustainability of development is a significant, if not the key, means of nurturing the intellect of people and civilization itself and in preserving humanity. Understandably, the purpose of this paper is not an analytical study of a global perspective vision. However, a local look at the investment markets that surround us and help or hinder our daily goals could also make sense.
No attempt will be made here to consider which area of activity is most clearly focused on enhancing the well-being of entities or improving processes. A vision of how to structure and concentrate insight is presented so that, by having some monetary purchasing power, people can preserve this and use it in other areas of activity to generate significantly higher returns for investors. At the same time, solutions will be developed using the basics of market forecasting. The optimal ratio of portfolio return growth and riskiness will be obtained, using operational risk mitigation measures. This pursuit of effective returns and adequate risk management could also be an appropriate tool for individuals or households to build their own investment portfolios.
In this work, analytical insight focuses on three phenomena related to the results of this realization, the possibilities of achievement and the related entities. The first is the investor, who has the means to guarantee his goals and security. The second is the market that can provide sufficient resources to meet investors’ aspirations and the methods to achieve this. The third is the investment portfolio, which integrates the first two phenomena to develop market powers, coordinate and implement the aspirations of investors, and actively use market intelligence.
To achieve these objectives, the portfolio should have a stock that allows for the highest return in the selected period at each step of the investment decision. At the same time, unacceptably risky decisions should be avoided through a stop-loss order feature. This tool should also focus on optimizing risk management capabilities. Furthermore, it should be noted that the historical data of the analysed markets are used for the targeted concretization of all the planned actions, which allows the market-generated perspective to be quantified.
Given the objectives described above, the aim of this work is identified as the creation of an integrating intelligent investment portfolio. It can be understood as an investment portfolio that seeks to integrate the needs and abilities of the investor with the powers available to the market, using information generated by historical market data.
It should also be noted that some of the principles and methods used to analyse the situations are not compatible with the most popular methods and principles at present. Still, these methods and principles have a real opportunity to objectively reveal the relevance of the situations under consideration and replicate the unsurpassed effectiveness of the most commonly used decision methods in finding optimal solutions. The goals of the portfolio itself and the presentation of the unambiguity of ways to achieve them are not fully linked to principles that are often treated in the literature as indisputably necessary.
These reasons explain why the paper does not contain many citations of the best works or criticisms of their failures, nor is there a separate Discussion section. Despite this, the authors do not in any way see or emphasize the inferiority of the works or situations mentioned. The acceptability of the proposed model is evidenced by the practical relevance of the obtained results and the possibilities of the methods used to solve investment problems. Here, the market data and various complex historical processes are used, which generate the foundations of an intelligence that otherwise could not have been created.
It should be noted that the investment principle discussed here is focused on the pursuit of significantly higher return opportunities, with due regard to operational risk management. The appropriate harmonization of these principles is sought at each investment step with a focus on maximum return. For this purpose, the investment portfolio uses only a single share or a minimal number of shares and constantly tries to find the shares with higher return opportunities. At the same time, stop-loss orders prevent them from losing their already accumulated returns. This is a rather unconventional portfolio management problem, focused on the suitability of the shares to achieve the objectives and compatibility of the information structure of the stop order with the probability distribution systems of the portfolio shares’ return.
Another essential element is the continuous ranking of stocks according to their ability to generate the highest return on a particular investment step. Thus, the period covered by the investment process is seen as a chain of shorter periods—steps—forming that period. It is understood that the step should be of a duration for which historical statistics naturally exist or can simply be estimated. In this paper, the results of daily investment decisions will be discussed.
Thus, the data stored in historical sources, which usually represent a given period, are transformed into daily data. The focus on step duration is because experimental evaluations have shown a positive effect of a shorter step in both the achievement of higher rates of return and focusing on the reliability of possibilities. Historical stock price data are understood and examined as stochastic processes. Here, they will be seen and used as indicators integrating the daily return results as distributions of random variables that often accumulate crucial information about the behaviour of and changes in those distributions. The study is fully compliant with stochastic evaluation manner: the value and reliability of the possibility under consideration will also be taken into account to assess the expected utility or negative return of the possibility. In many cases, to achieve a concise presentation, instead of examining the detailed change in the stochastic process, it is limited to its essential indicators—average, mode, median, etc. Of course, there is no doubt about the possibility of monitoring the change in the analysed process in detail.
The above arguments, the principles of information provision, and the solution methods used explain why the concept of investment portfolio that was used in the title of the paper is given the attributes of an integrating and intelligent instrument.
Thus, it is worth recalling that an intelligent integrating investment portfolio aims for the highest possible return on investment at each step, balanced with the investor’s resilience to risk. The management possibilities of this portfolio in the financial markets will be presented using the following scheme, and the return growth rates of the selected daily step will be used in the following:
  • Disclosure of the logic and compatibility of the selected actions;
  • Presentation of harmonized analytical solutions;
  • Presentation of practical examples of the obtained solution.
All portfolio return growth values are presented in a confidence interval format. It should be noted that the measurement is performed in conditional units, or natural numbers, rather than percentages. The initial investment capital is assumed to be 1 (1 thousand EUR, 1 million EUR). The return growth figures illustrate how this value changes over time.
The structure of the paper is as follows. Section 2 presents the literature review of the topics of investment and portfolio formation. The Methodology is described in Section 3. Section 4 graphically presents and discusses the obtained results. The paper ends with Conclusions and suggestions.

2. Literature Review

Investing in the stock market is one of the most important financial decisions made by the individuals who make up a household (Zhang 2017). As a result, the topic of household, family, or personal portfolio management has received increasing attention among researchers and practitioners in recent years (Temel Nalin 2013; Yao and Lei 2018). Household investment is influenced by family income, risk attitudes, and the return–risk ratio of investment assets (Li et al. 2020). Household income volatility can discourage investment (Cardak and Wilkins 2009). Conversely, confidence in the stock market may, in turn, encourage investment (Balloch et al. 2015). In addition, Li et al. (2020) indicate that financial literacy has a significant positive impact on the individuals’ participation in stock markets. They also found that younger and more educated people earn more in financial markets. Another factor that increases the efficiency of a personal investment portfolio is digital financial inclusion (Lu et al. 2021). Digital financial inclusion involves using financial technologies, i.e., the Internet, computer information processing, data mining, big data analytics, and cloud computing. Thus, digital technologies can help household participants create and manage their own investment portfolios.
Investment science is increasingly focused on managing the coexistence and interoperability of multidimensional, multifactorial and multicriteria processes (Boussaidi 2017; Basilio et al. 2018) to ensure the availability of the resources needed for sustainable development worldwide. It should be noted that investment research has recently become increasingly active in the field of addressing personal investment problems. Investment can also help to design sustainable human capital in the broadest sense, using the investment portfolio formation and management techniques (Blanchett and Straehl 2017; Thakurata 2021; Yu et al. 2021).
Portfolio formation has attracted interest since Markowitz (1952). Portfolio decisions are influenced not only by expected return and risk but also by socio-demographic factors (age, gender) and investor behaviour (degree of risk aversion, financial literacy), as well as risk-free returns and market sentiments (Frijns et al. 2008). The investment portfolio is perceived as a tool for managing the value created by a group of financial assets that belong to one entity or person. In a relatively very short period of time, the portfolio has expanded its abilities to interact with complex multidimensional, multifactorial, and multicriteria processes and manage overall development opportunities. A rather informative presentation of such a reality can be seen in recent works (Gambrah and Pirvu 2014; Allen and Luciano 2019). Algorithmic portfolio selection has become more prevalent in recent years. There are automated asset management systems that select a person’s investment portfolio based on his or her age, income, and level of risk aversion. Using such techniques can reduce transaction fees (Gao et al. 2016; Ha and Zhang 2020), increase portfolio efficiency, better manage risk, and use market information and technology for successful decision-making (Wang et al. 2009a). However, these algorithmic solutions also have drawbacks: they do not consider human capital, available financial assets, liabilities, and real estate (Scherer 2017).
Portfolio optimization is the process of making investment decisions in order to obtain high returns with acceptable risk. In addition to return and risk, researchers used and investigated other portfolio selection parameters such as reliability (Rutkauskas and Stasytytė 2020), liquidity (Li and Zhang 2021), skewness (Bhattacharyya et al. 2011), and kurtosis (Naqvi et al. 2017). One of the first steps in the portfolio management process is the selection of assets. Asset selection is essential because it influences the allocation of funds between assets and, ultimately, portfolio returns (Jothimani et al. 2017). Various methods were used to select assets in the portfolio: fundamental analysis (Shen and Tzeng 2015), machine learning (Sun and Zhao 2015; Fu et al. 2020), Fuzzy Analytical Hierarchy Process (Jain et al. 2021), as well as various combinations of methods. However, the authors have not found any methods or examples of selecting the best stock at every decision-making step in the literature.
Studies of market and investor behaviour during and after the crisis have been conducted in previous research works. It was found that after the stock market crisis, investors stronger considered the investment environment before making financial decisions. They assess stock market behaviour, the situation in neighbouring countries, political issues, government decisions, and economic indicators (Khan et al. 2021). Wang et al. (2009b) found that stocks with higher betas, higher capitalization, lower levels of illiquidity, and higher volatility in pre-crisis returns experienced a more considerable fall during the market crash itself. Wang et al. (2009b) add that company performance also affects the profitability of their stocks. Higher debt ratios in the company, higher levels of liquid assets, lower cash flows per share, and lower profitability of the company resulted in lower profitability (higher loss) during the crisis. Researching stock markets during the crisis, various authors examined the above-average volatility of stock prices, liquidity shocks, and the sharp rise in stock returns pre-crisis. Nevertheless, in previous research, the authors were unable to find more explicit evidence of high returns from equities during the financial crisis. Therefore, in the practical part of this paper, an example will be provided of the return that the proposed investment system achieved during the 2007–2008 financial crisis.
One of the main ways to avoid losses in the stock market is a stop-loss order (Han et al. 2016). It is widely used in practice by institutional and individual investors, and researchers are grounding its potential to increase returns on investment (Yang and Zhang 2021). The rule of this order provides for the sale of a share when its price falls below a certain level and for the purchase of a share when its price increases above a certain level. The literature also examines the trailing stop loss, which raises the selling price limit in order to maintain profit as the share price increases. Toit (2015) argues that trailing stop loss works better than traditional stop loss and better protects the profits that have already been earned. Dai et al. (2020) found that the trailing stop loss strategy reduces overall risk and downside risk, especially during periods of market decline. Transaction costs reduce the benefits of stop-loss orders but setting higher stop-loss thresholds still yields sufficient returns, even when considering transaction costs. In the study presented in this article, the stop loss function will be used to avoid substantial losses.

3. Methodology

In this section, the authors will act as completely “illegal intruders“ in the financial market: what is developed by the market makers, managers, regulators, issuers, intermediaries, and consultants will not be presented, but the harmonized analytical management solutions for different aspects of the investment portfolio will be explained to help the investor. These solutions will be presented in the order in which they were used in the practical evaluations:
  • Development and use of a stop-loss order system for operational risk management;
  • Ranking of shares according to their suitability for the portfolio to achieve the intended objectives;
  • Selection of the most suitable shares or a small group of them for each specific investment step.
It is true that, before introducing the mentioned solutions, it is necessary to note that the market’s historical data are usually understood as the realization of stochastic processes. It was already mentioned that this is an advantage because the achievements of the theory of stochastic processes and their variety of applications allow them to be seen as natural, visible, continuous and discrete stochastic processes in a multi-step chain. In the analysed case, the authors will examine discrete stochastic processes, treating the daily growth steps in historical data as stochastic values. Thus, in presenting the above points, it should be noted that the historical information is available on the change in return on shares measured in one-day increments.

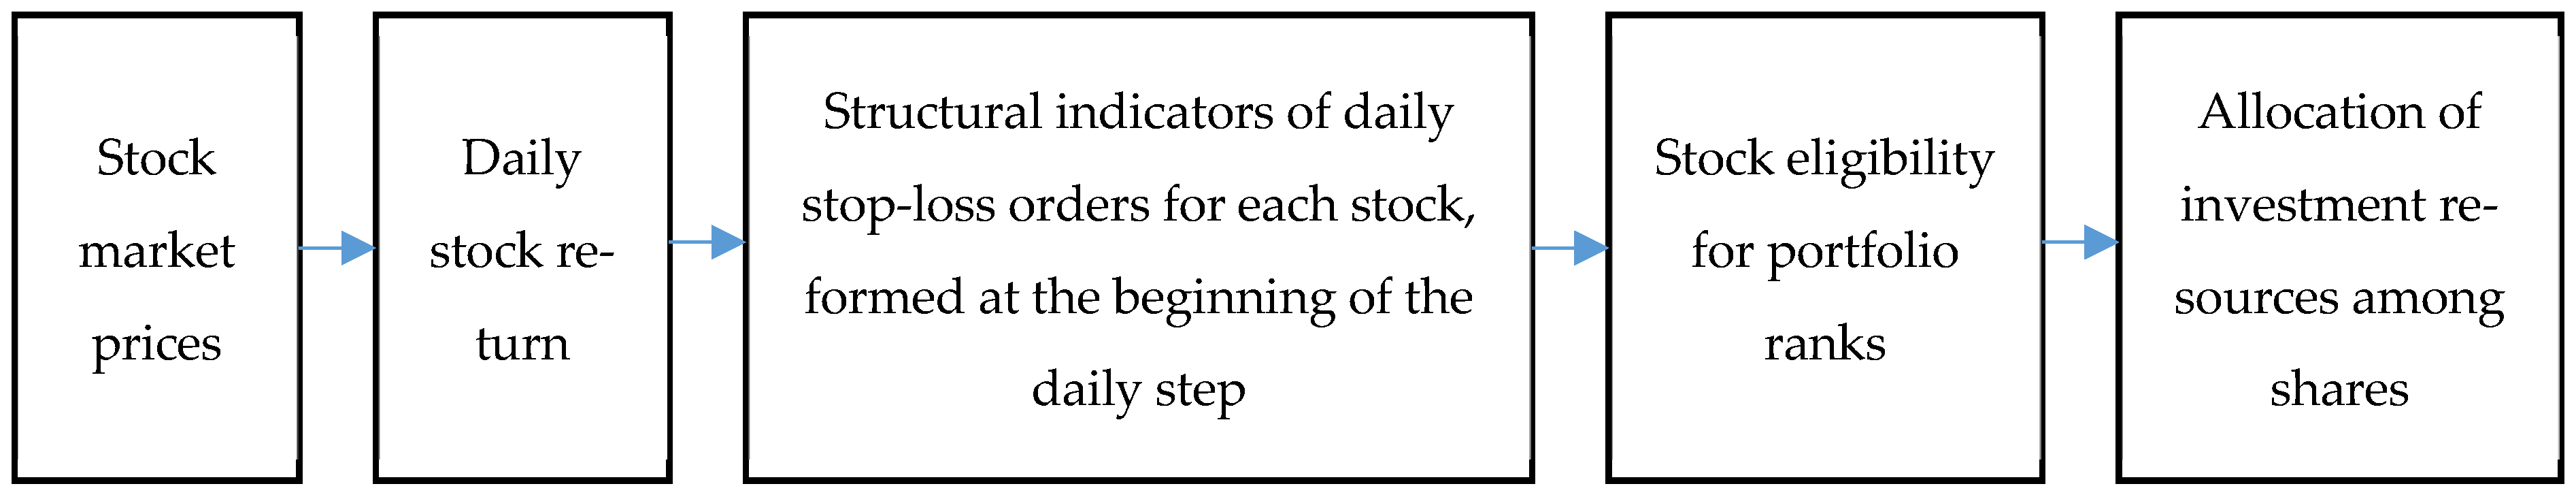
3.1. Development and Use of a Stop-Loss Order System for Operational Risk Management

In this paper, the adaptation of the stop-loss order, using a logical–statistical analysis of historical stepwise data, becomes the primary means of preventing the negative impact of risk. This section will disclose the potential of stop-loss orders to avoid greater declines in the return on equities included in the portfolio. This is not a traditional moment in risk management, but the promptness and effectiveness of the measure in question testify to the real potential for strengthening risk management. It should be emphasized that historical data were used in full to form the stop-loss order system. The study found analytically that ranking stocks according to their suitability for portfolio purposes reveals a significantly higher-ranking efficiency when the functions of different types of stop orders are taken into account. The function of the stop trade order, which is most easily understood by its content and application technique, is as follows:
IF (Ai approaches the unfavourable state Si, then the trade is stopped)
Here:
Ai—the return on stock A in step i,
Si—the value of stopping the return of a stock.
Let us use a relatively simple quadrilateral of the available shares A, ..., Z and their return steps 1, ..., n and compare it with the transformation performed by the stop trade order. Additionally, the following questions could be answered by performing a statistical analysis of the comparison of vector-based and targeted vector sets:
  • How an effectively designed system of coordinated stop-loss orders can successfully change the performance of the portfolio, understanding and informing about the incurred costs;
  • How deeply the emerging patterns in the market are revealed, even if the market is subject to limited interventions;
  • How a moving array of historical data inform about remaining and emerging regularities.
It must be acknowledged that this observation and recording of the historical development of the market has become a way and means of active intervention in the market perspective. The practical presentation of investment portfolio management will cover the statistical monitoring and analysis methods used, as well as market-generated data signals on potentially more efficient future steps.
To reveal and implement the above-mentioned possibilities, special attention was paid to the statistical analysis of historical market data. It should be recalled that this is a one-step update of one-day period decisions. However, the studied problems and the obtained results obtained were quite broadly specified based on both monthly and weekly, as well as shorter than hourly, steps. Experiments were also performed in different markets with quite different portfolio investment instruments. Additionally, with the necessary caution, it can be argued that a shorter investment step indicates expanding opportunities for efficient returns on investment.
A stop-loss order allows us to stop trading a monitored share if its price falls below a specific set price, which becomes unacceptable to the investor or trading broker. The share is sold, and another is bought for the amount of currency received. It is stated that the use of the order itself is not taxable. Still, it is understood that the investor incurs the costs of buying and selling the shares.
It is necessary to pay attention to the analytical capabilities of algorithm (1) because it is a stop-loss order effect capability management algorithm. Indeed, in the selection of Ai, each stock involved in the portfolio formation process must be considered separately. Notably, the emergence of a stop-loss function is inappropriate, with a growing trend in stock-generated returns. Furthermore, given that the use of that order is inevitably linked to an increase in portfolio management costs, it is necessary to examine the need to apply that order in detail. However, if an investor has more than one stock in a portfolio, he has to think about the compatibility of the already different stop-loss orders that apply to them. Thus, the complexity of managing this problem is fully understood, as is the investor’s significant amount of brokerage, advisory, and regulatory costs.
The historical data of daily return growth form an intriguing set of random variables. The knowledge of mathematical statistics and probability theory, which has deepened the ingenuity and objectivity of solutions, was used to analyse emerging regularities for centuries. Relatively superficial glances at the aforementioned set of random values, i.e., market-generated sets of historical data for specific periods, allow certain situations that do not change over time (here—during days) to be observed, and for quantitatively measurable regularities to be noted. All this can be called market intelligence, which helps more beneficial solutions for the investor to be chosen.
However, these regularities are probably most evident when the daily historical data on the growth in returns on all stocks are transformed on the basis of algorithm (1) into images close to the possibilities of a stop-loss order. Here, one can almost see the stocks that should fit into the final composition of the portfolio, which will even generate a primary return on the portfolio.
This may be a bit emotional, but it can be explained by the fact that the daily change in returns, even in the case of very distant days, retains some similarities. In other words, in selected groups of near and far days, we can find certain regularities that combine these days into the totality of the returns generated by shares that are similar in form. Of course, these similarities may not be strictly defined or related. Moreover, identifying the most appropriate stop-loss order is not a problem that can be unambiguously, theoretically solved, but rather requires the expert selection of various options.
In sum, before discussing the suitability of stocks to meet the goals of the portfolio, it is necessary to pay attention to the possible impact of a stop-loss order. As there may be enough candidates to be included in the portfolio, it is essential to note the importance of this issue, recalling that the option named in (1) can be beneficial for direct and actual ranking.

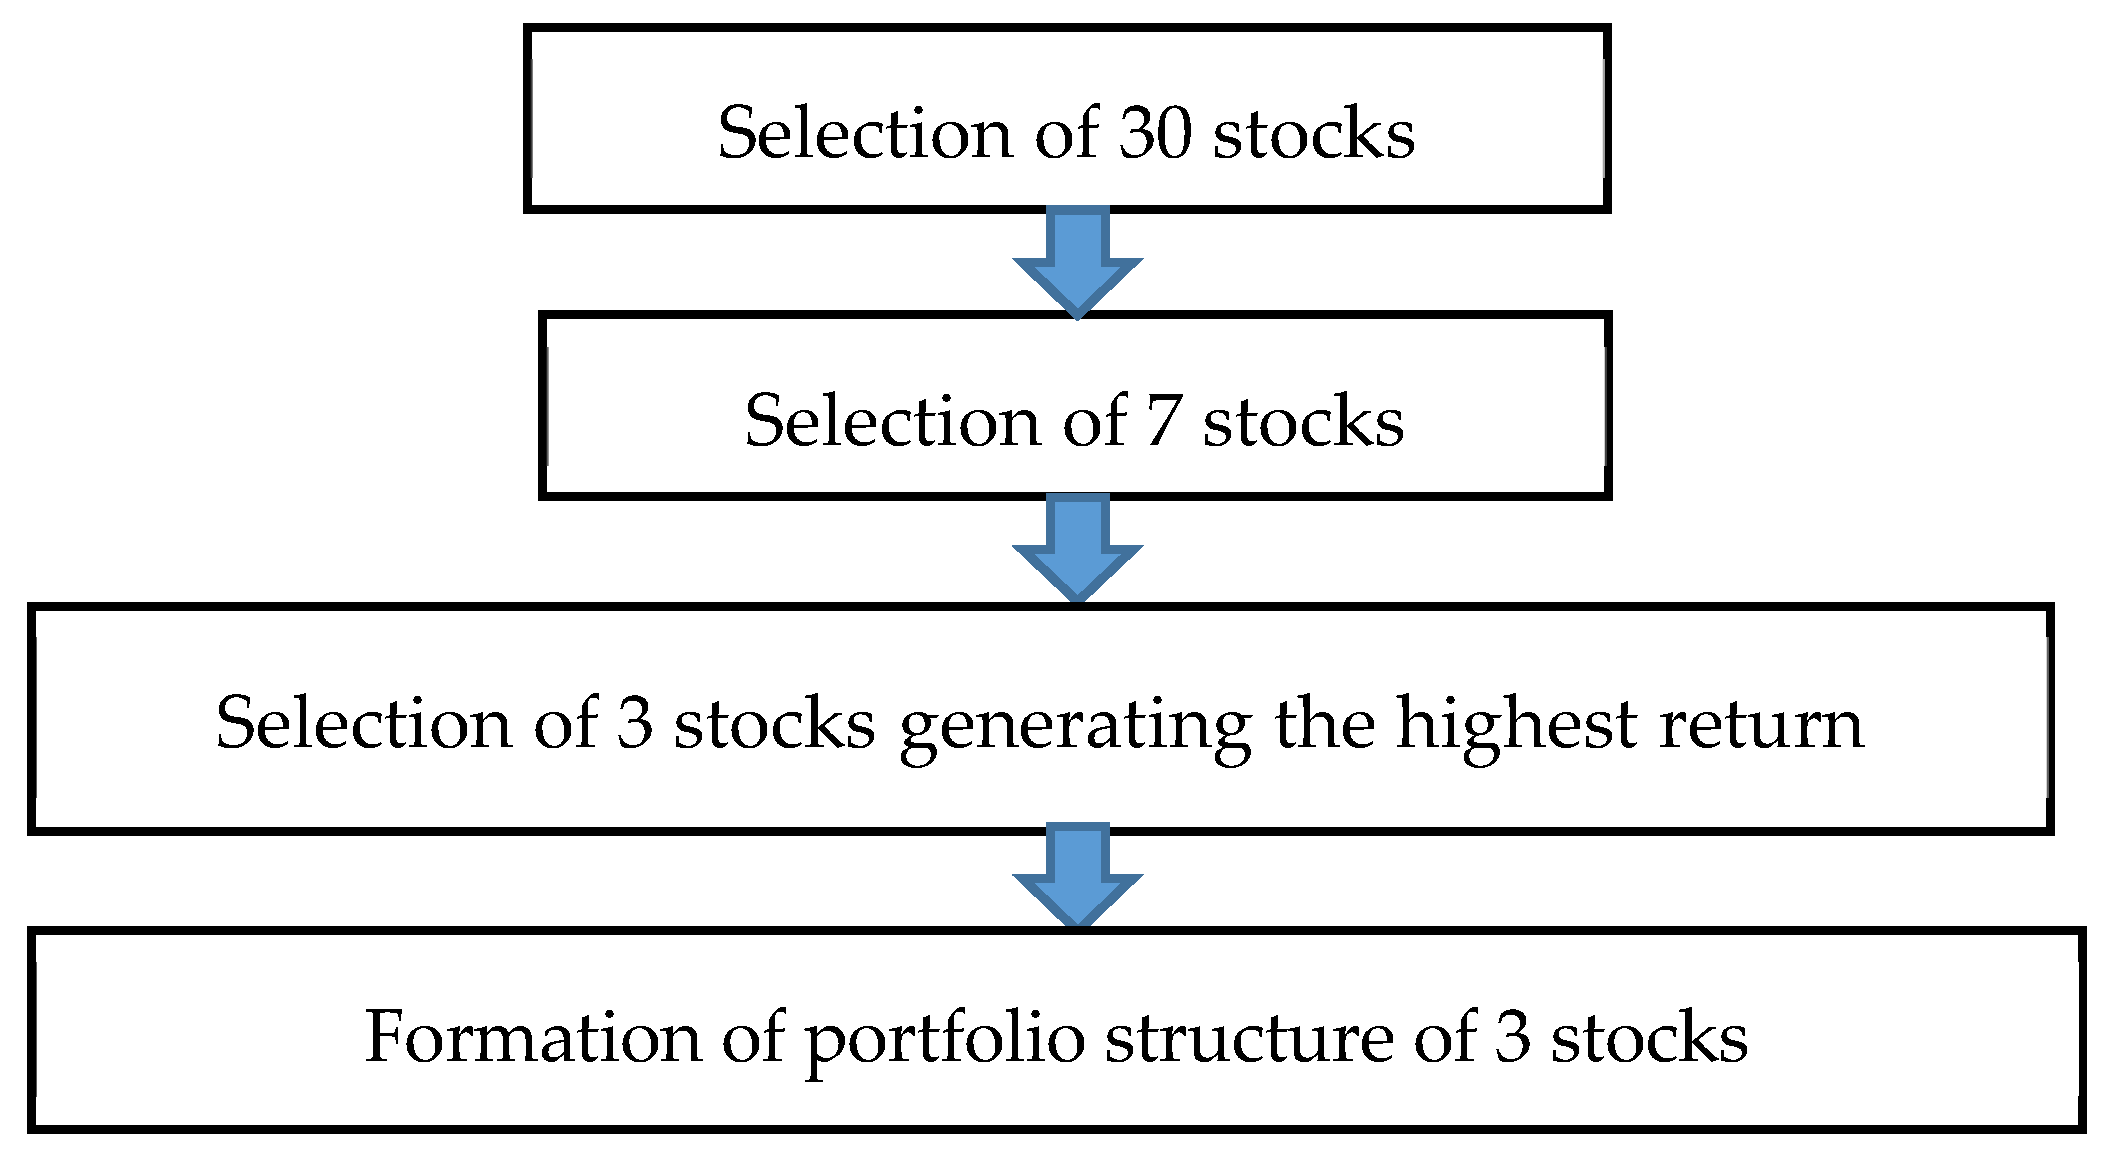
3.2. Ranking of Equities According to Their Suitability for Portfolio Purposes

While ranking stocks, there is a need to consider and assess the impact of stop-loss type orders. However, this is a very favourable analytical situation, where the knowledge of the return potential of the daily step is associated with the behaviour of the stock price as a stochastic process. This leads to a desirable situation: when an investment system has not yet achieved an objective disclosure of its potential, it is possible to use such an analysis scheme. Undoubtedly, it is understood that research into the cognition and management of the behaviour of stochastic processes had reached such a level that those processes are understood to exist. Furthermore, theoretical models of their management can be said to be directly applicable to the description and prediction of actual events or processes. Thus, it is possible that stock prices, as information generated by the stochastic process, are used to reveal random variables’ potential and form successful portfolio functions.
In this research, the suitability of stock for the purposes of the portfolio is disclosed according to the usual utility functions, the factors of which are the most informative characteristics of stocks as stochastic processes: overall stock price growth, growth risk, skewness and kurtosis, percentiles of various level and their mutual positions. Specific sources of information were historical stock data. The ranking process itself was carried out using the abilities of the Excel program.
At the same time, the authors need to remind the reader that the stock price’s daily return function, which has become a direct object of knowledge and management, is an integral part of the stock as a stochastic process and can enable the management of stochastic processes.
However, when specifying the ranking process, questions may arise as to whether the chosen variety of options does not shape the market’s unresolved issues. Do the chosen solutions contain opportunities that are incompatible with the mission of the market or the interests of its creators? The resolution of these tasks is often left to experts in such fields. Experts also participated in the study.
In addition, an analytical scheme was developed, where the suitability of stock for the portfolio is assessed using historical market data on the values of historical stock parameters: price increase, stock risk, skewness, kurtosis, median to average ratio, mode (or its substitute in case of complexity). This information is used to evaluate the perspective of certain parameters of that stock. Different parameters, amounts of those parameters, and the numerical values of those parameters were used in different situations, which became the object, means, and result of the discussion.
We would also like to present a co-measurement scale based on the randomness of the portfolio, which seems to disagree with the literature. Its formation in the case of n selected features can be presented as follows:
Suppose there are n indicators proposed by experts or otherwise generated to assess the quality of a stock:
(b1, b2, b3, ....., bn)
N positive realization units of one family of the random variable are generated:
rand()1, rand()2, rand()3, ............, rand()n
The sum is obtained
sum(rand()1: rand()n)
Dividing each rand ()i by the sum(rand()1: rand()n), one can obtain n structural indicators:
s1, s2, s3, ......, sn
and
sum(s1:sn) = 1
Finally,
R = sumproduct(s1:sn,b1:bn)
According to the chosen structural scheme, this is the value of the utility of the stock that was selected for the portfolio.
By multiple repeats of the steps described in (2) as independent tests e.g., (1000 times), the authors form a network of structural schemes, including a scheme close to the one that indicates the highest utility, or other features under study, for the analysed share.
Practice shows that, with a sufficient number of structures for close-proximity stocks, e.g., for shares in the same market, the structures in question only marginally differ in practice. Once the situation is confirmed, this ranking procedure can also be used to select stocks, with an increasing focus on the possibility of choosing stocks for investment that may qualify for the highest return in the current step.
Note: In case of deviations from the stated possibility, it is expedient to focus on the portfolio structure that generates the lowest utility scatter.

3.3. Selection of the Most Suitable Shares for Each Investment Step
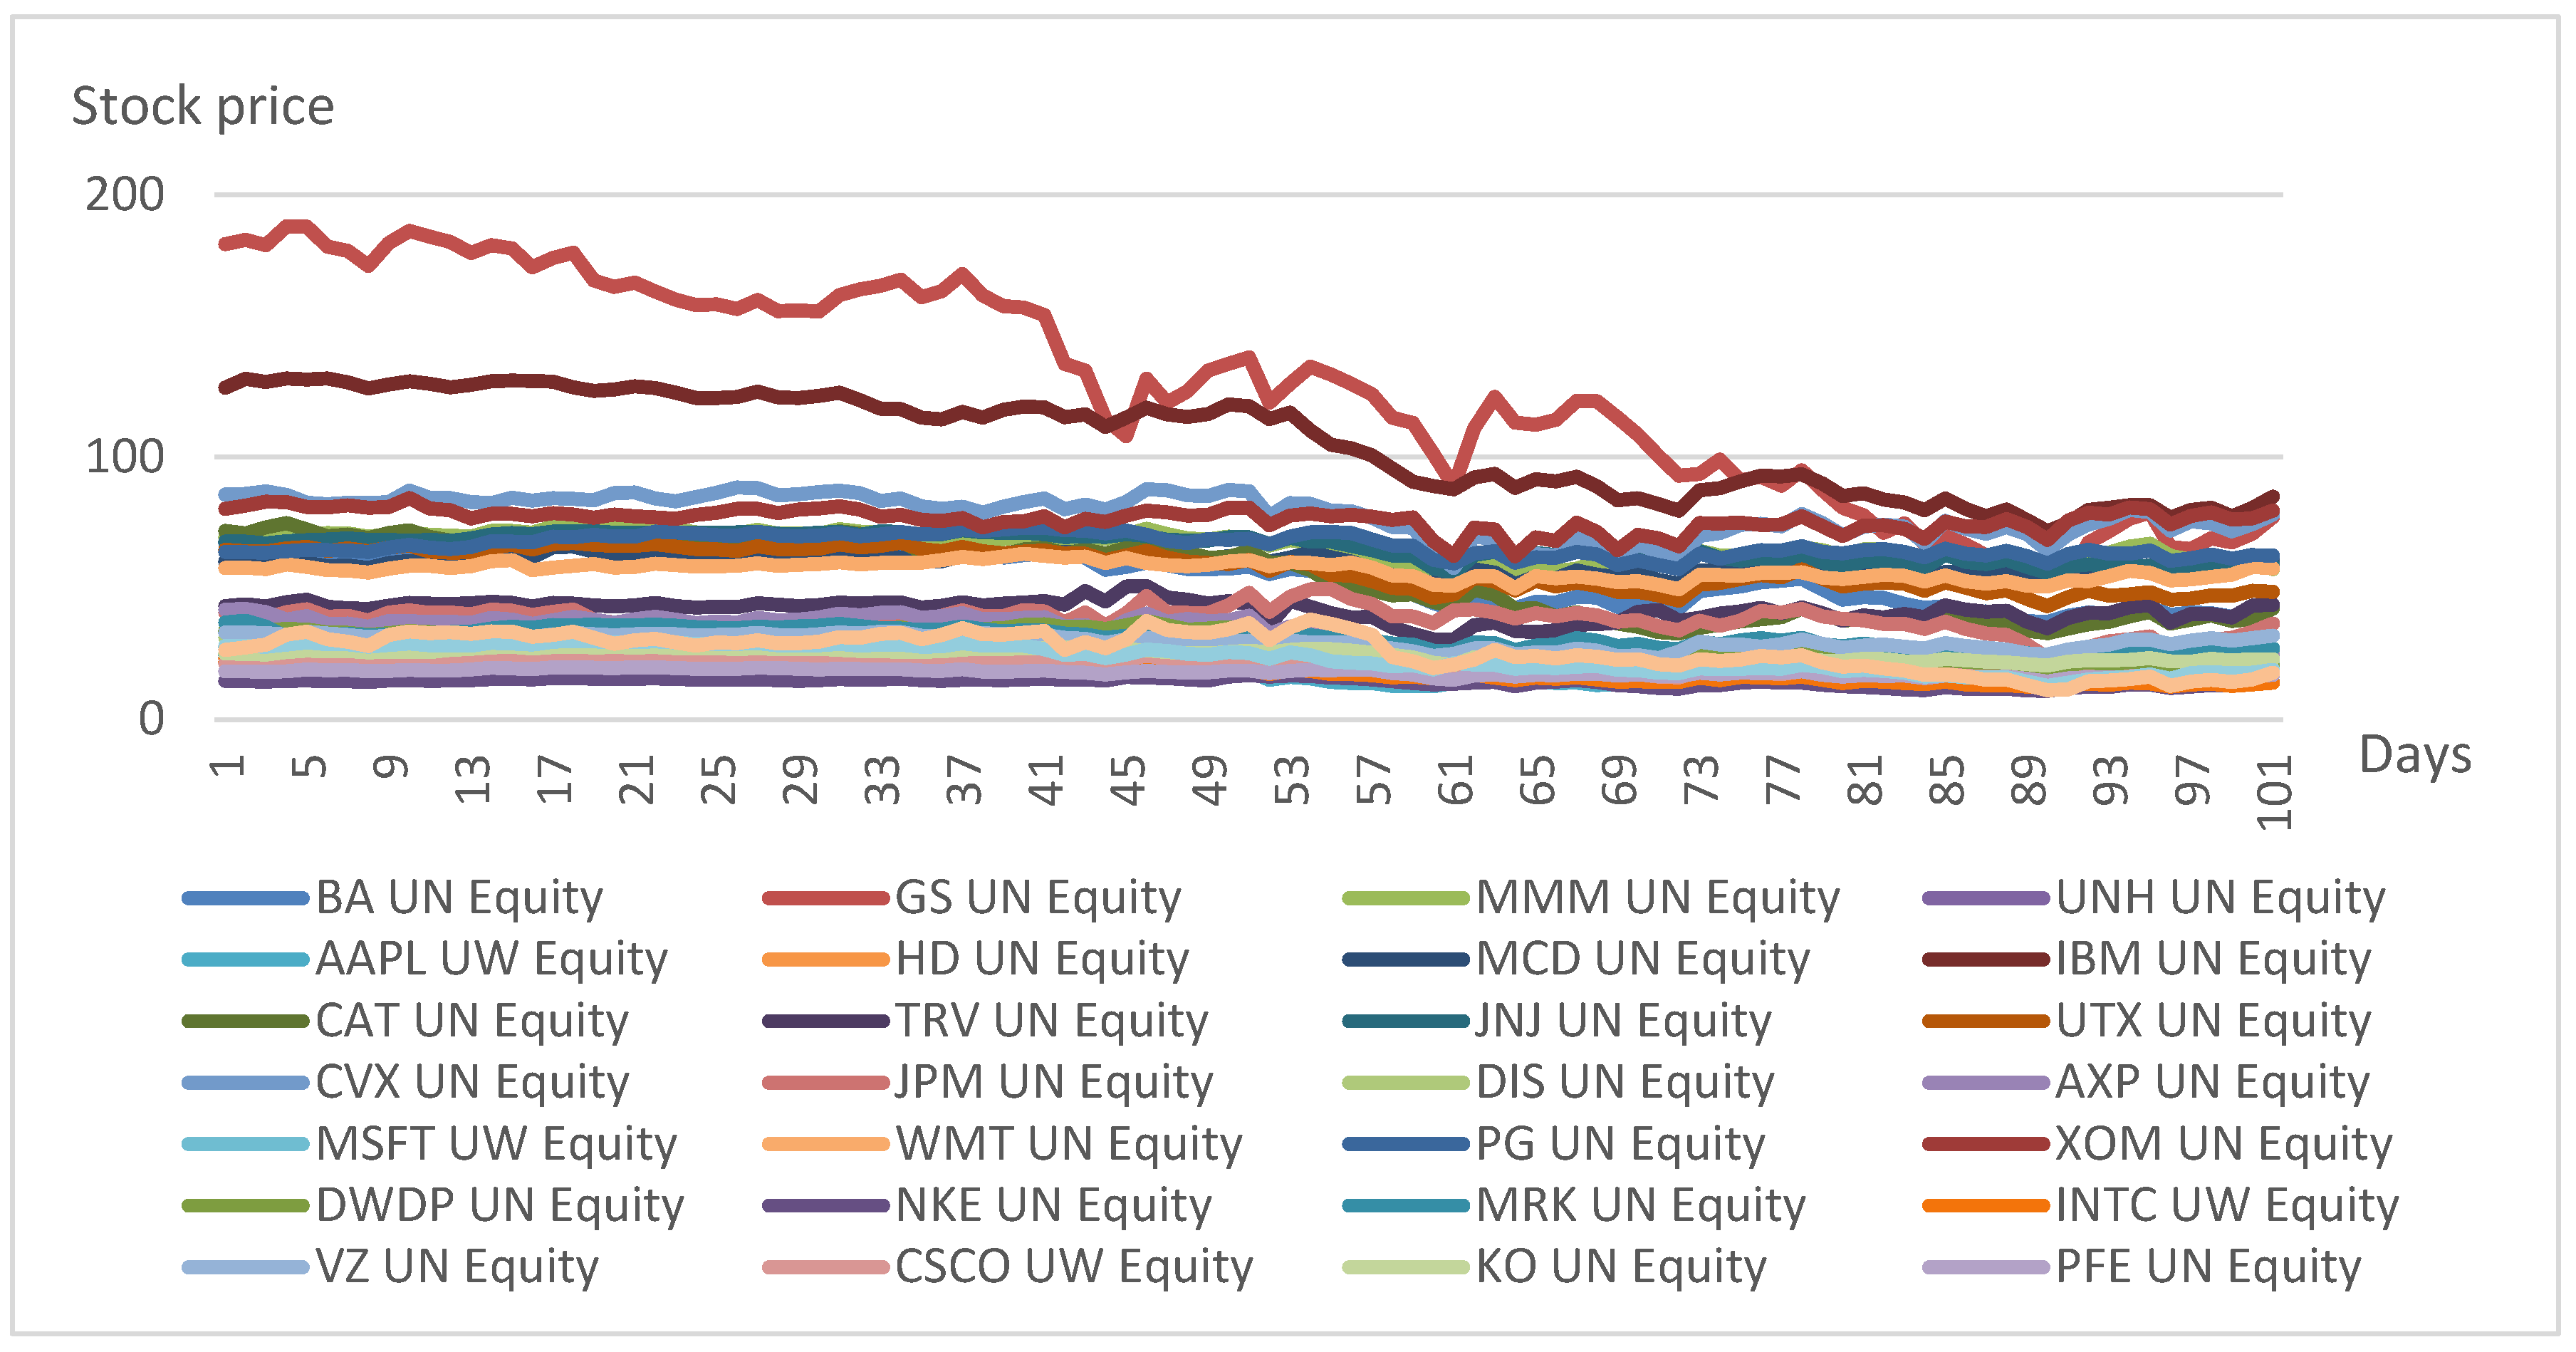
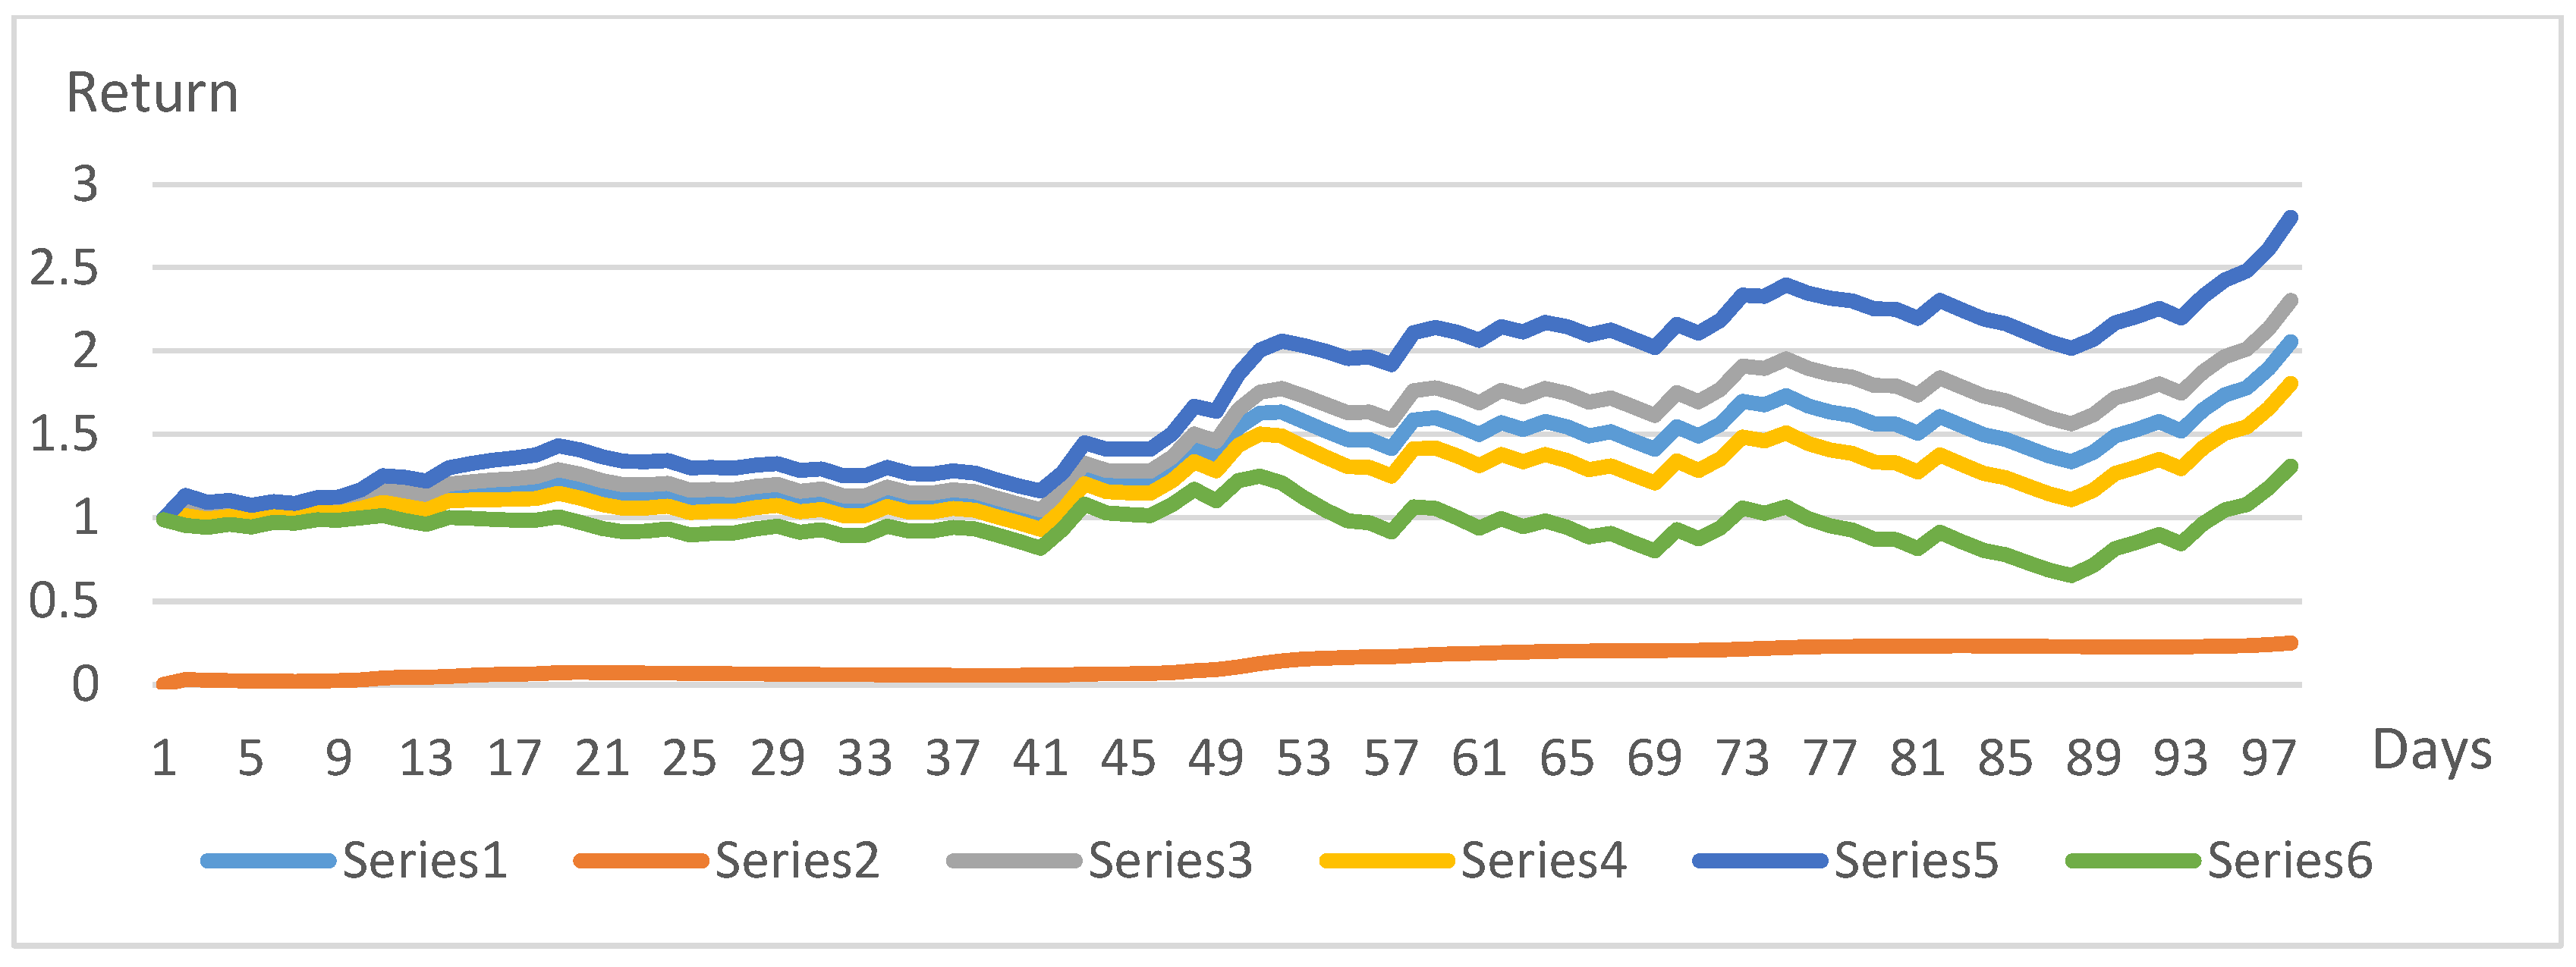
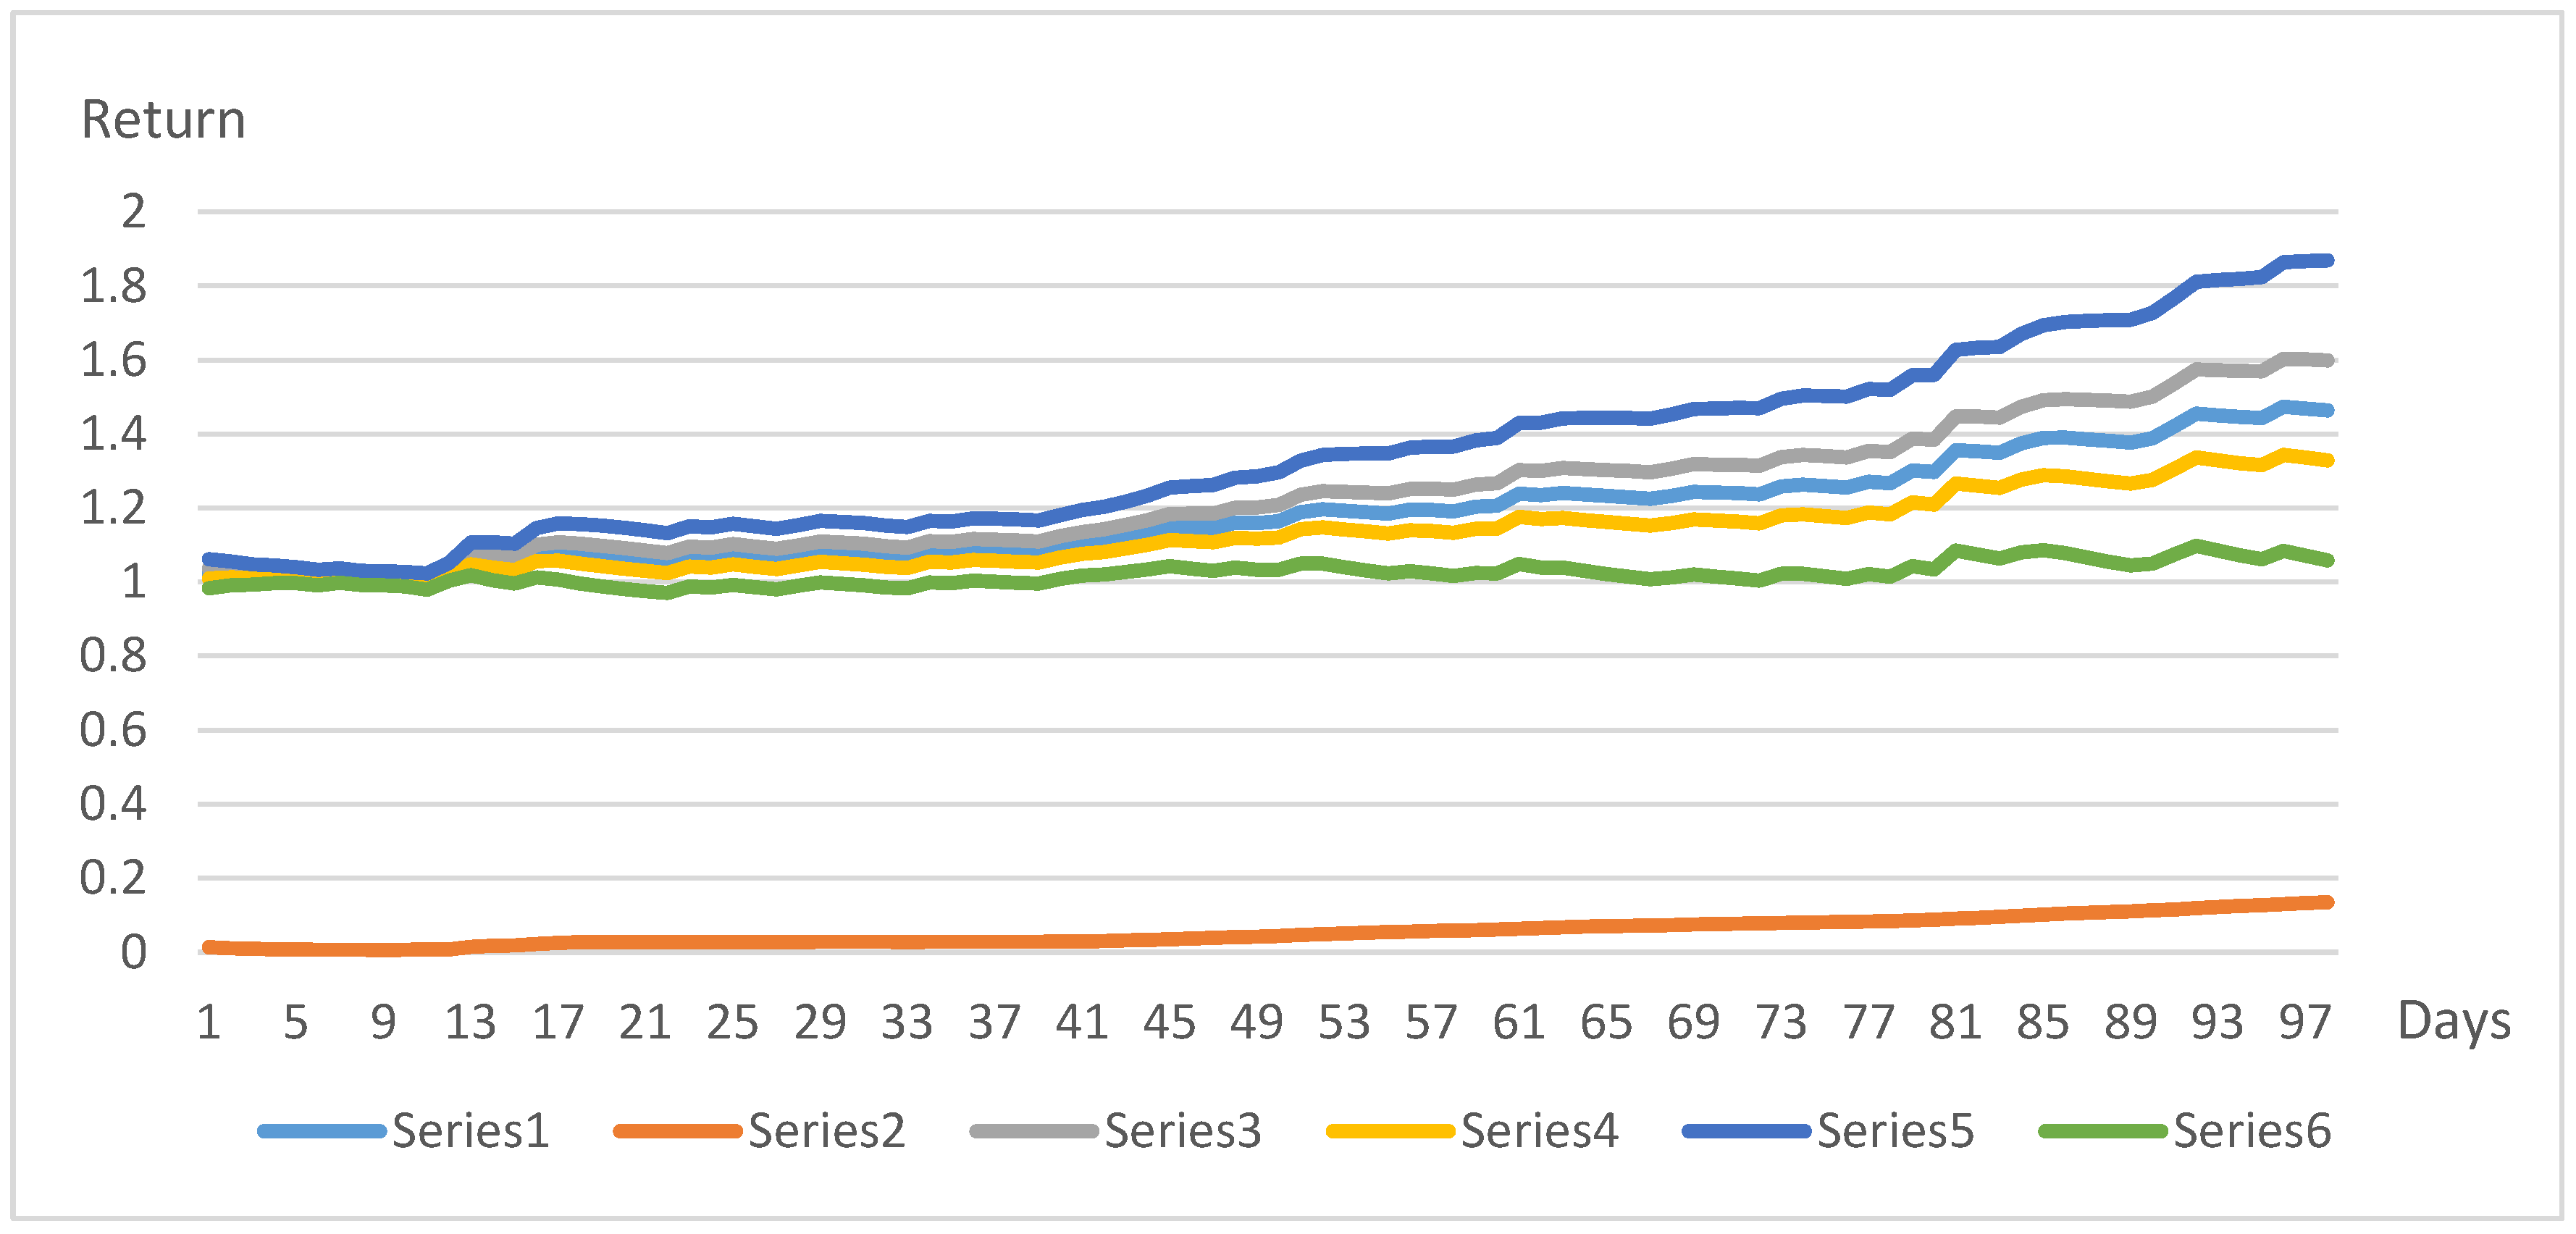
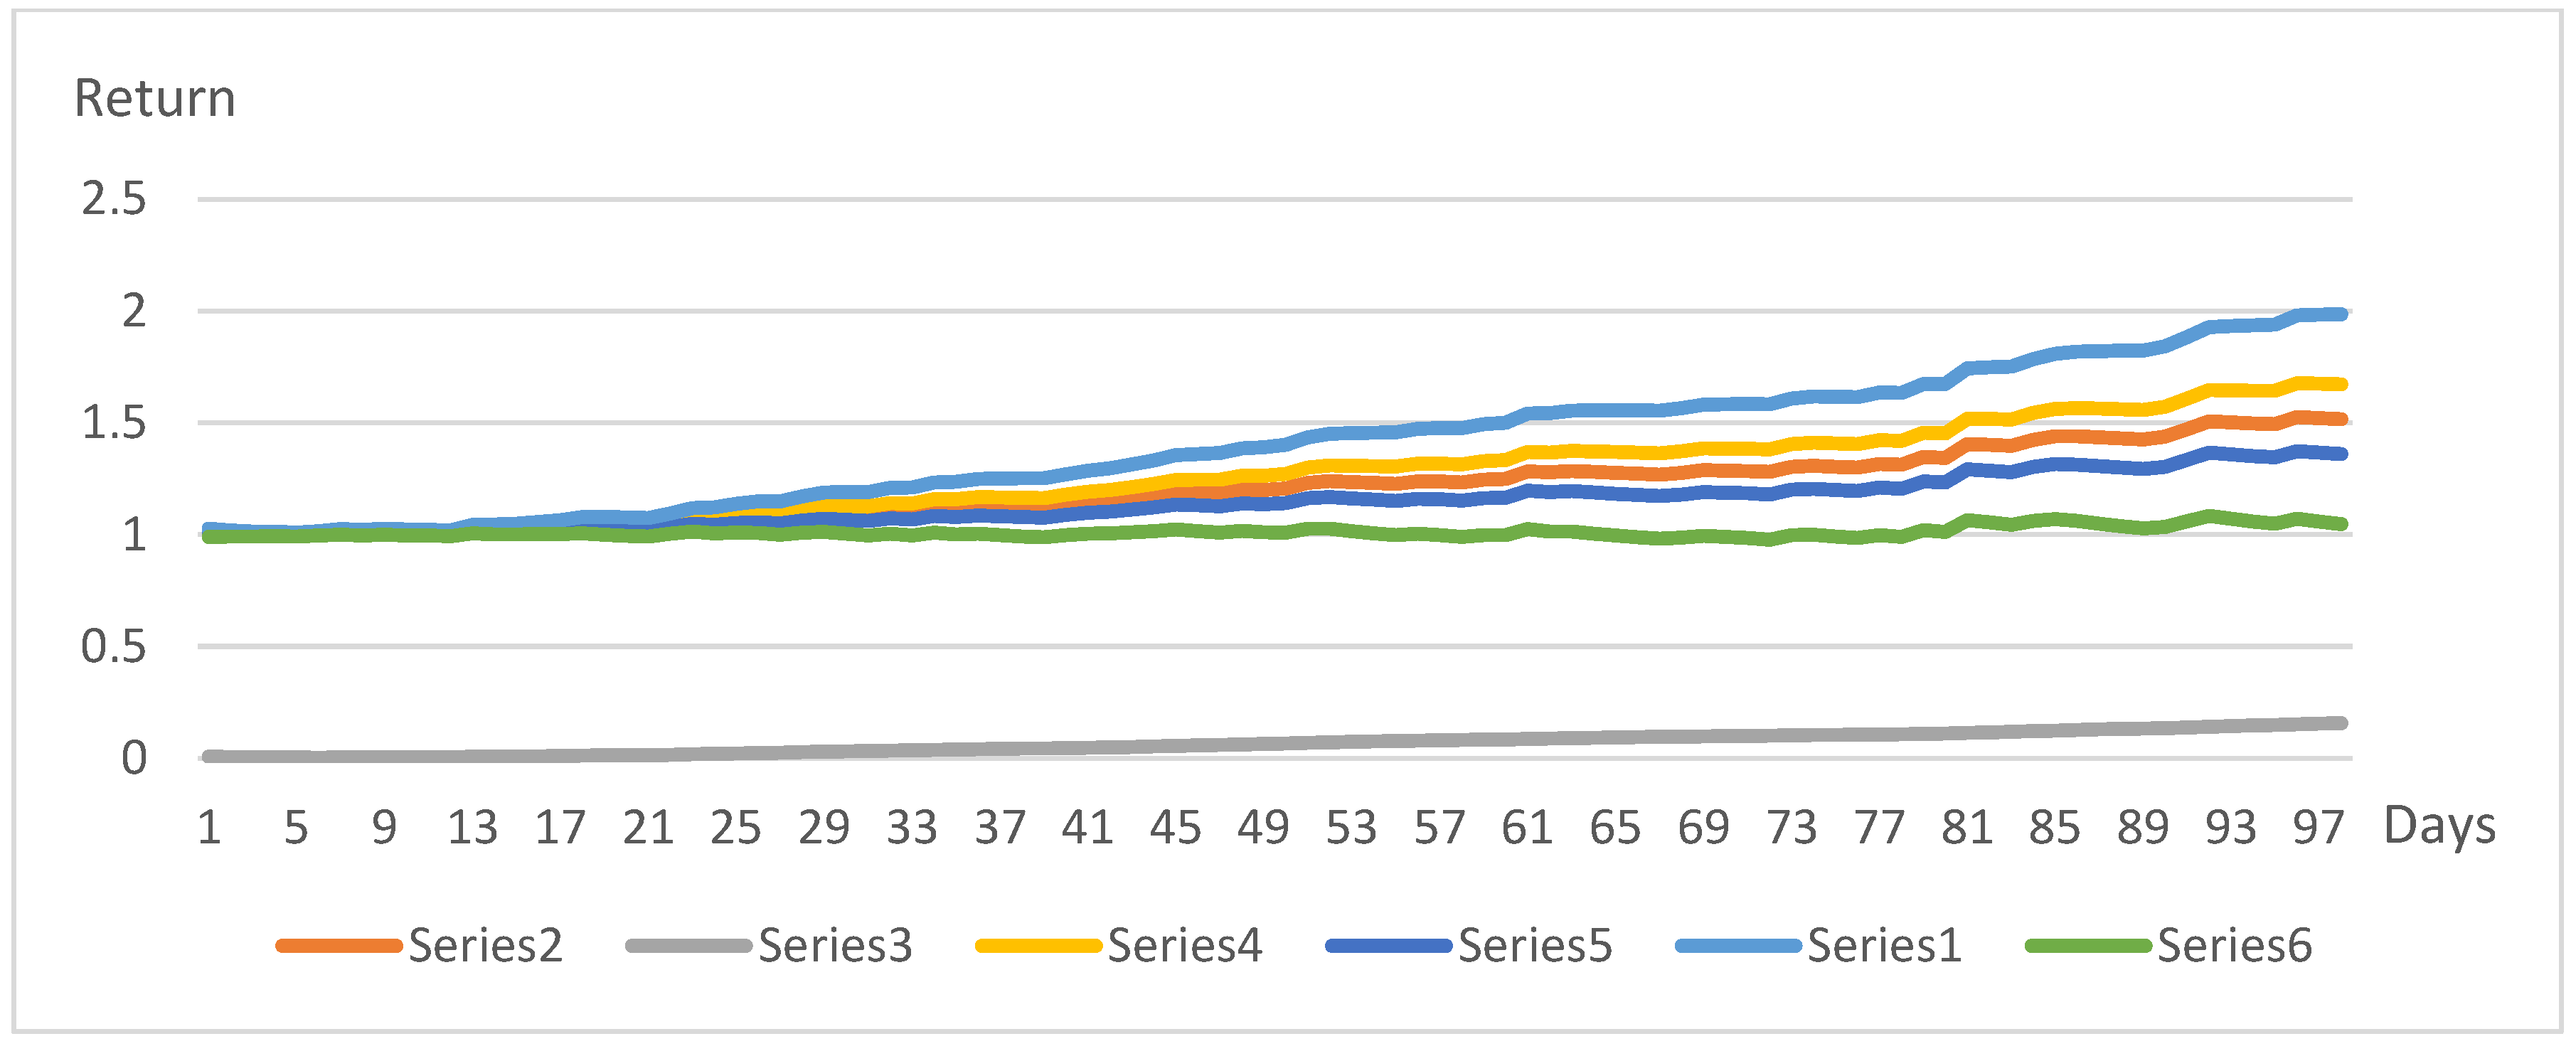
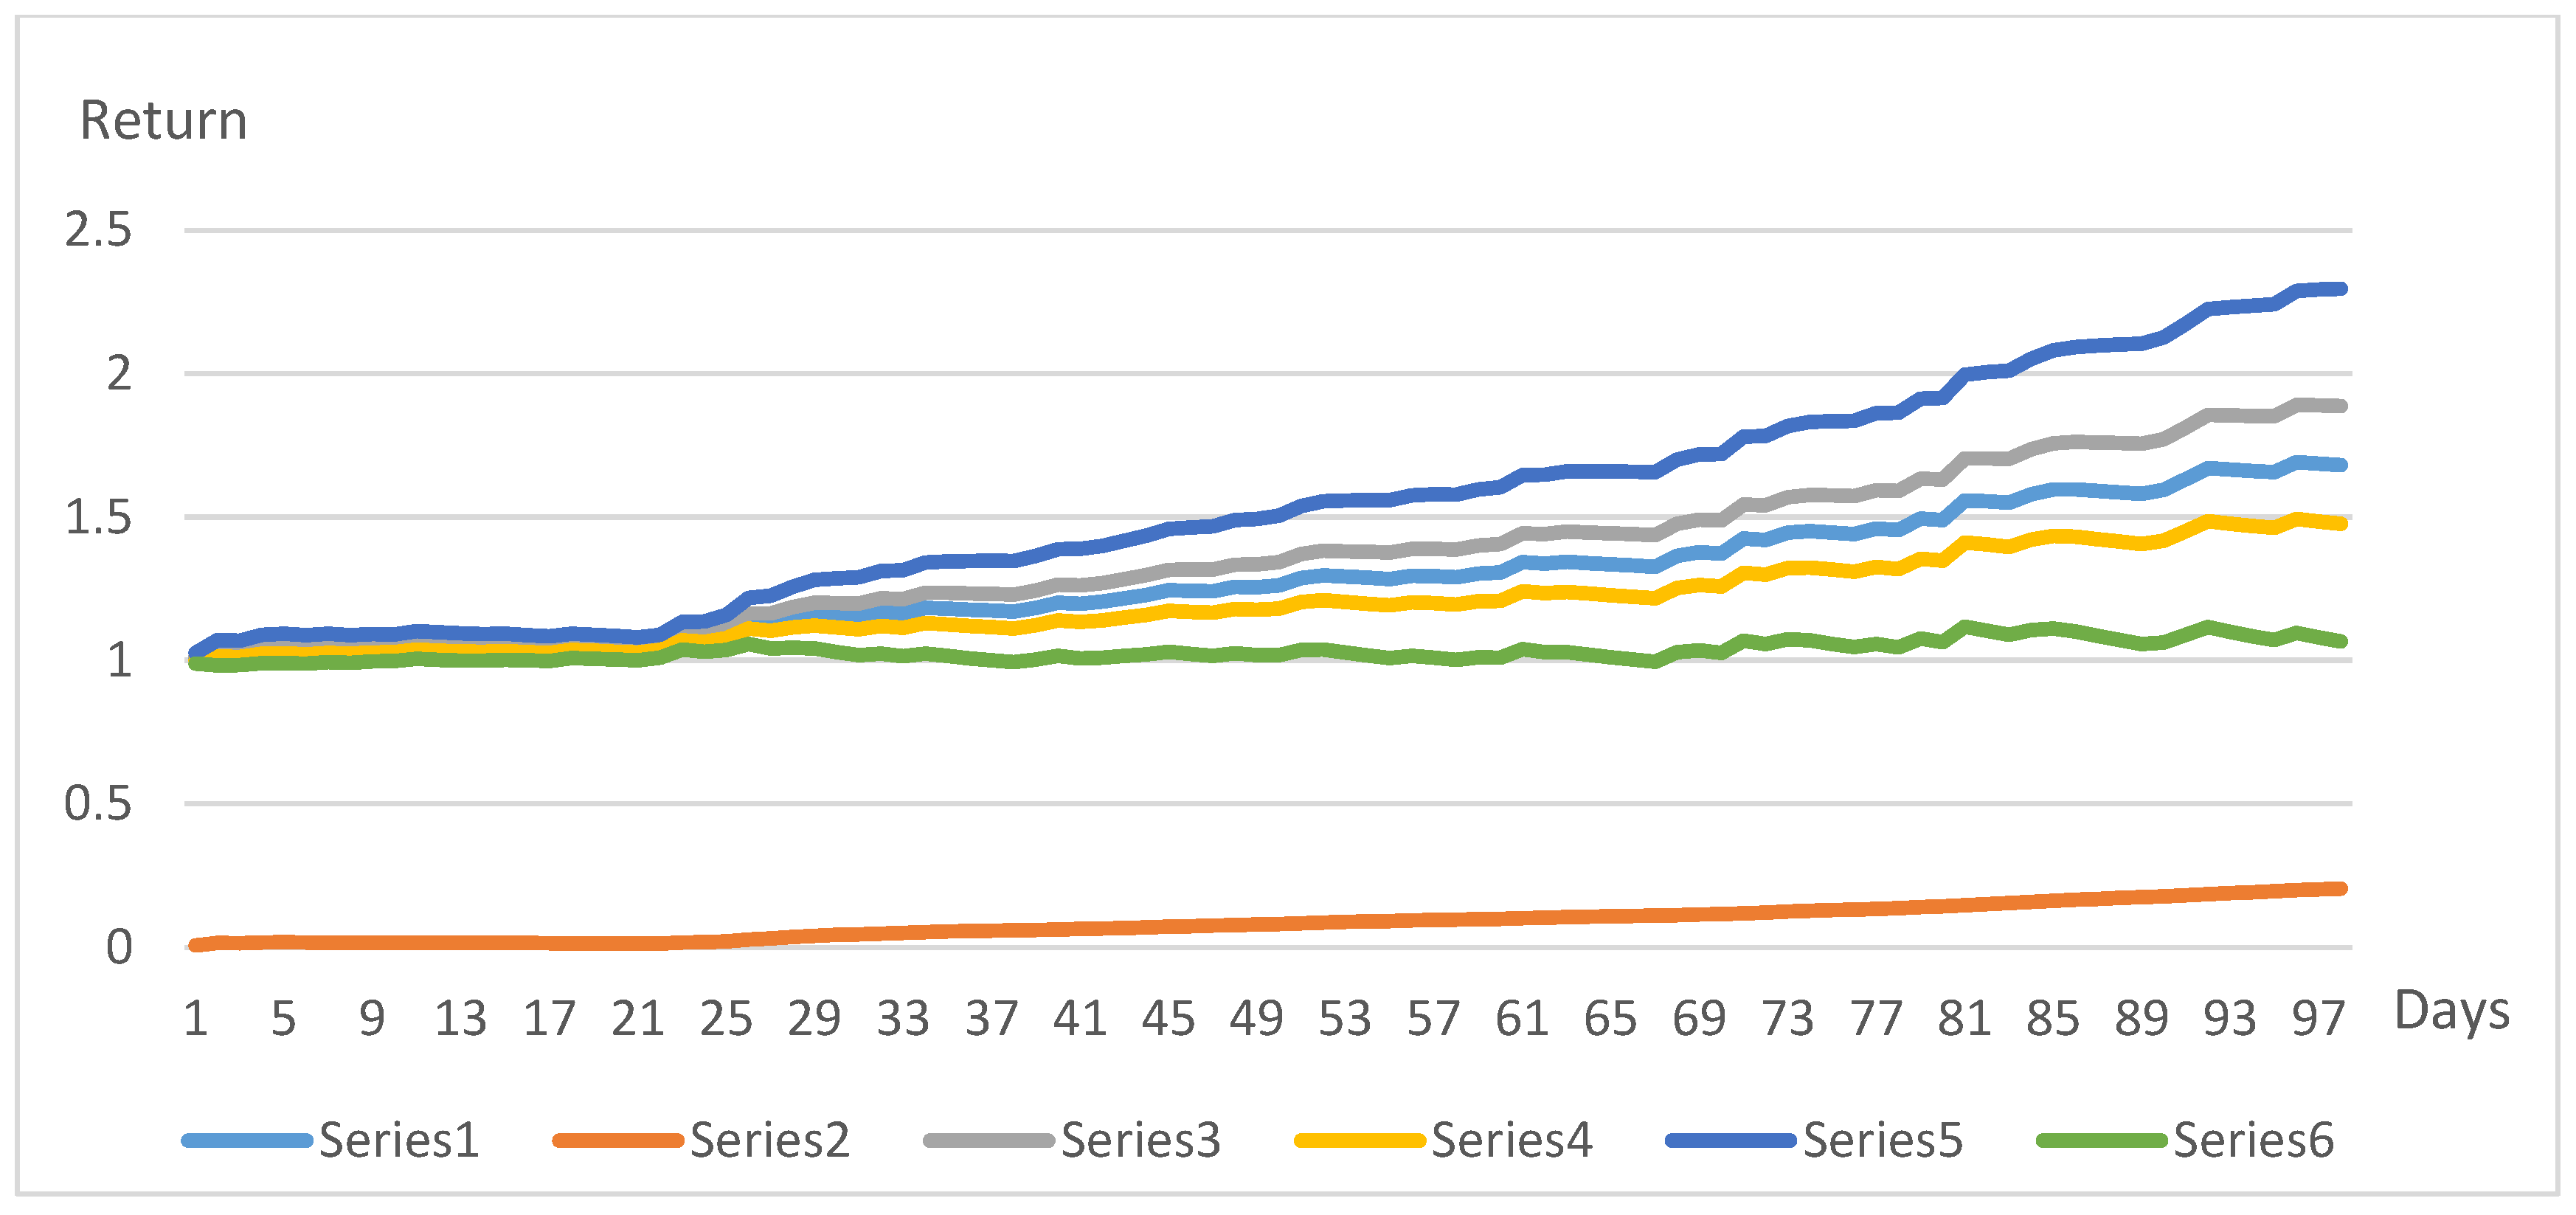
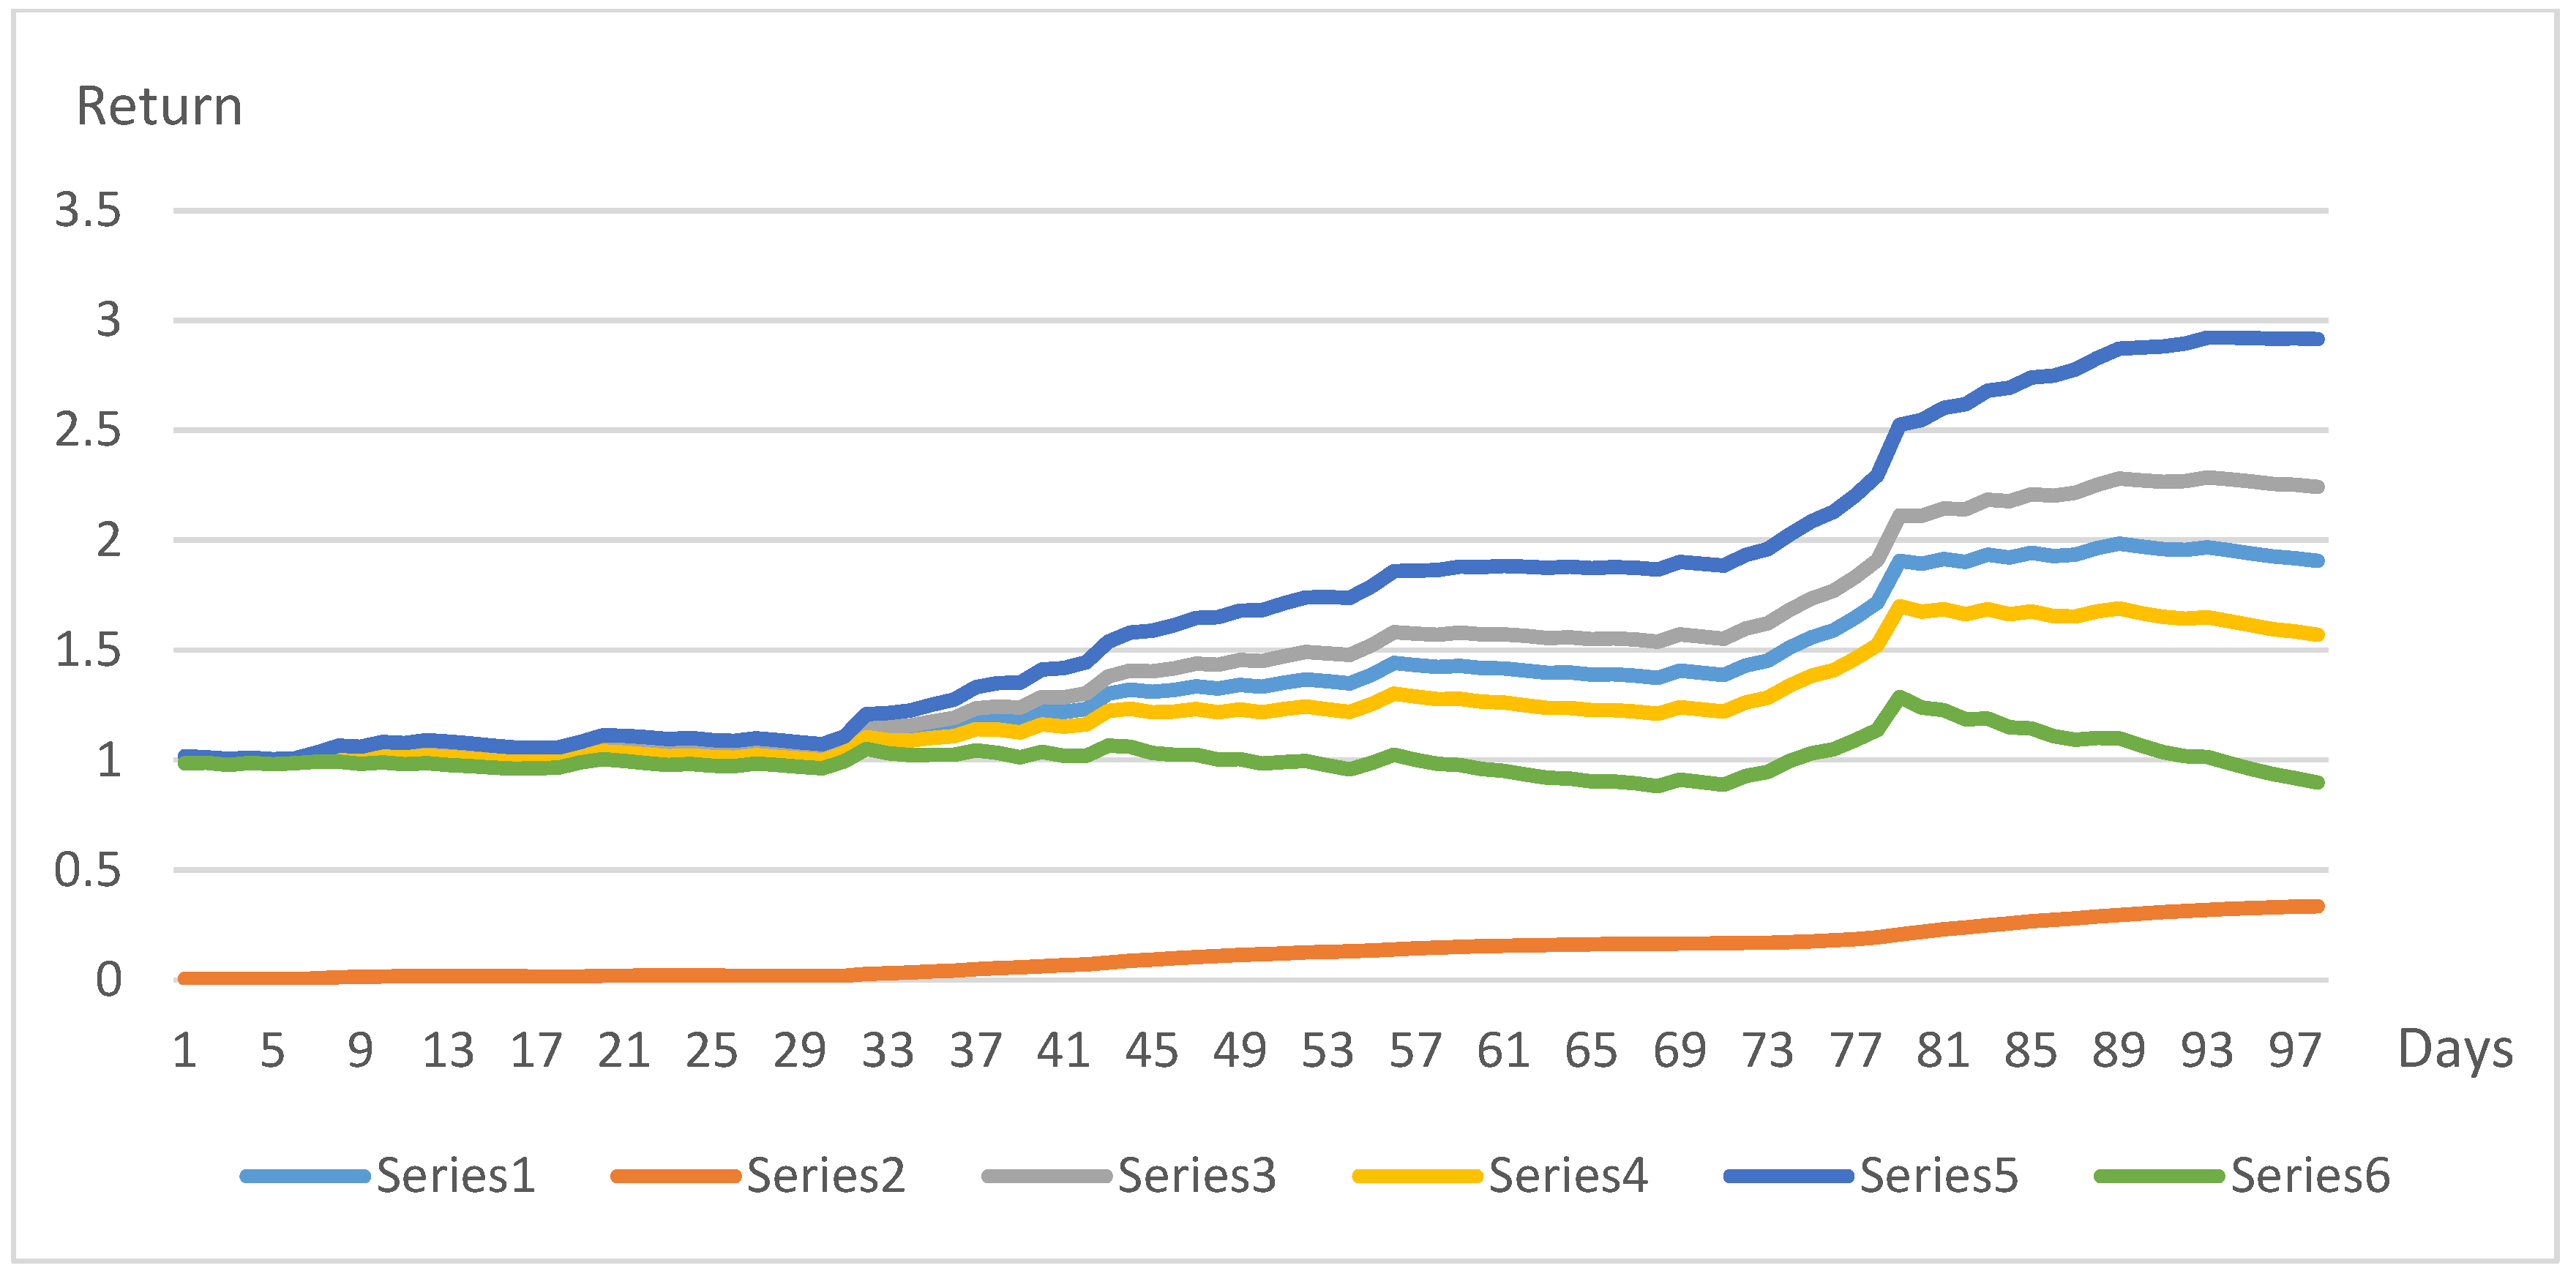
Again, a scheme based on a particular theoretical vision was not chosen here either. Efforts were made to use options conducive to pursuing potentially higher returns and avoiding the risk of losses. In what follows, the choice will be explained. The investment decision-making procedure consists of five steps and is as follows.
After selecting a specific market, the first step was to use the 30 most actively used or otherwise positively valued stocks, and calculate their daily return. Next, a scheme was developed for matching return and risk using a specially designed stop-loss order and historical data on trends in return opportunities. Further, using this scheme and stock prices as a management system for stochastic processes, stocks were ranked according to their suitability for the portfolio. Finally, using perhaps the most important information provided by market intelligence (information on the ability to find the names of the stocks generating the required return on every investment step), a specific investment address was selected while allocating the resources available for investment. The precise scheme of this decision-making process is presented in Figure 1.
The selection of stocks for the portfolio demands separate attention. In specific cases, the authors could take a direct step to a single or multiple stocks, or, if there is a need, take another intermediate step, choosing, for example, seven stocks for an additional search for the best option. Thus, the “best seven” were selected using the historical market data and the general vision of the stock best suited to the portfolio formed in the previous paragraph. Next, by focusing on the highest return-generating stock into the portfolio, a stock triad was developed. Lastly, a final assessment was made, distributing the amount available for investment between the three shares previously selected for the portfolio (Figure 2).
When constructing a portfolio, a risky stock that may still generate the right level of return for the portfolio by the end of the day should not be eliminated. This share should not be included in the list of shares to be sold and repurchased, which would protect the investor from unwanted costs. However, that, jokingly, requires direct contact with the changing stock price. This contact can be made with a properly formed trailing stop-loss order. It is true that, in the case of a daily step, and even more so by significantly shortening the investment step, the possibilities of stop loss and trailing stop-loss orders converge.
Understandably, the problem is further complicated by the need to reduce daily portfolio rebalancing. In the experimental calculations, principles close to the trailing stop loss order were used to solve this problem. Although the article continues to assume that, formally, the use of a stop-loss order may be free, the actual costs of using it are obvious and significant. It is the cost of selling and repurchasing or replacing a share. By repeating this situation, the level of cumulative returns may become insufficient.
In summary, it is worth emphasizing that the authors are solving a rather complex problem: in the described process, more and more attention is paid to the possibility of selecting the stocks that may qualify for higher returns in the current step for the final composition of the portfolio. The aim is to reduce the constant turnover of shares in the portfolio.

4. Results

4.1. The Search for the Highest Return during the Financial Crisis

Continuing the discussion about the integrity and intelligence of the portfolio, it should be noted that the process, which objectively exists somewhere, will not be examined. After revealing the consistent pattern of its behaviour, it is possible to analyse its type of behaviour and some of its integrative functions. Here, the system being formed will be investigated—an investment portfolio that can select the only one of the abundant available market shares that generate a sufficiently high level of return in the investment step in question and are protected from possible risk attacks. In addition, the portfolio will operate in a functioning market, and its intended share needs to align with the market-driven solution.
It must be acknowledged that in both the academic and practical literature, efforts to take advantage of the highest-yielding stock or multiple stocks at each investment step are very rare in practice. The reasons for this are understood. Indeed, research on the possibility of numerous appearances of the highest return in specific situations does not receive much attention. Moreover, the fact that such a phenomenon would last for at least a little longer would arouse understandable interest from investors.
This paper gradually focuses on the only stock that indicates a high return at that step. In doing so, it is considered that market intelligence, understood as information generated by historical market data, reliably informs us about the interaction of different return options on the same market. Most importantly, the traditional statistical analysis of step-by-step return arrays helps to reveal the types of trailing stop-loss orders that are most appropriate for situations that combine return and risk.
Indeed, this type of analytical evaluation is rarely found in the empirical literature. This is simply the material used for a rapid examination of the possibilities, in order to see the reality and invest efficiently. Perceptions of state change dominate such assessments, and less emphasis is given to the long-term regularity. The above-mentioned moments of investment portfolio formation will be explained in detail by presenting investment simulation results.
However, before presenting the results, attention should be paid to the situation, analysed on the basis of historical data. It is demonstrated that even in crashed markets, with the provision to invest in a stock that can generate the highest possible return at every investment step, investors can obtain exceptional return accumulation possibilities. To prove this, the proposed highest return search algorithm will be tested with a rather provocative task, i.e., an attempt will be made to verify whether its assistance could have been used to mitigate the effects of the 2007–2008 financial crisis.
Figure 3 shows the part of the financial crisis period (17 July 2008–10 December 2008) with the most popular market stocks in the US financial market. In Figure 4, we see, of course, very conditionally, the situation that the principles of intelligent integrative investment portfolio management discussed here may have helped to maintain. The proposed portfolio model allows the investor to choose the stock that will generate the highest or a close return on each step. This portfolio has made it possible to monitor the possibility of significantly mitigating the effects of the 2007–2008 financial crisis.
Notably, even a market in a rather difficult situation can inform us about the highest-yielding stocks at each future step. These possibilities are fixed in Figure 4, using the confidence intervals of the most expected possibility. Thus, one can see that the investment unit held at the beginning of the period in question could have increased 2.05 times if the market-generated information on the highest-yielding stocks was adhered to. It is understood that the market itself must be prepared to continue functioning in the event of a significant change in investor behaviour.
Understandably, it is often thought that this is not possible. However, a similar possibility of cumulative return can be seen by forecasting the highest return only in every second or third step, and perhaps even less frequently. Thus, by relying on one’s own ability and the possibilities of the scheme in question, and with the help of market intelligence, it is already possible to observe the signs of a scheme’s effectiveness by identifying stocks with a return close that is to the highest step-by-step return. It is understandable that the implementation of the portfolio strategy requires a set of rather complex solutions, and perhaps the most important thing to realize is that a universal composition of the three complex actions is necessary for the effectiveness of the integrating intelligent portfolio stepwise strategy. First, the ability to identify the stocks that are best suited to the objectives of the portfolio. Second, ability to quickly address the issue of reconciling return growth and risk aversion. Third, the ability to concentrate on as few shares as possible.

4.2. Preconditions for the Practical Experiment

Assume that investors, issuers, and markets are interest groups that are constantly improving the processes, implementing their interaction to achieve their own goals. Perhaps, without going into too much detail on the formation of the aforementioned interest groups, one can still agree that the key indicator of the mentioned interaction in finance is the volume of realized investments, which also expresses the primary goal of the market and issuers. The size of the return on investment generated by the mentioned interaction is the most critical indicator of the expression of the investors’ interests.
In turn, not only should the information that is gathered and purposefully structured in the market be fully used, the presented portfolio objectives and the proposed measures for their implementation should also be discovered. At the same time, the aim was to reveal the functions of the financial markets and increase their efficiency. The functions themselves are directly understood to be pricing, fundraising, risk-sharing, availability, liquidity, capital formation, a reduction in transaction costs, and the provision of the necessary information.
There is no doubt that there is a real need to understand what the interest of an investment portfolio should be. More specifically, the question can be formulated as which of the three interest groups mentioned above should be represented by the portfolio ideology? It must be assumed that this is not a completely pointless or easy-to-understand question. Therefore, it can be assumed that the purpose of the portfolio is to optimize the return generated by the market to the investor by offering the necessary knowledge to the market and issuers. This will form a positive message regarding the interests of the market and issuers. Nonetheless, the need to uncover the sustainability of returns on investment should not diminish.
This should be performed by combining the three actions needed to achieve the stated goals. The first is the selection of stocks that match their return options and their dynamics. The second is the prompt suppression of risks to avoid unwanted loss of returns. The third is the formation of a group of shares that would allow the above-mentioned goals to be achieved for a longer, uninterrupted period of portfolio operation.
A group of solutions of this type, which could confirm the achievement of the above objectives will be presented below, while emphasizing that the proposed method only diagnoses the prospects of the expected return on the shares in the portfolio. This is performed before the expected investment day begins in the market.

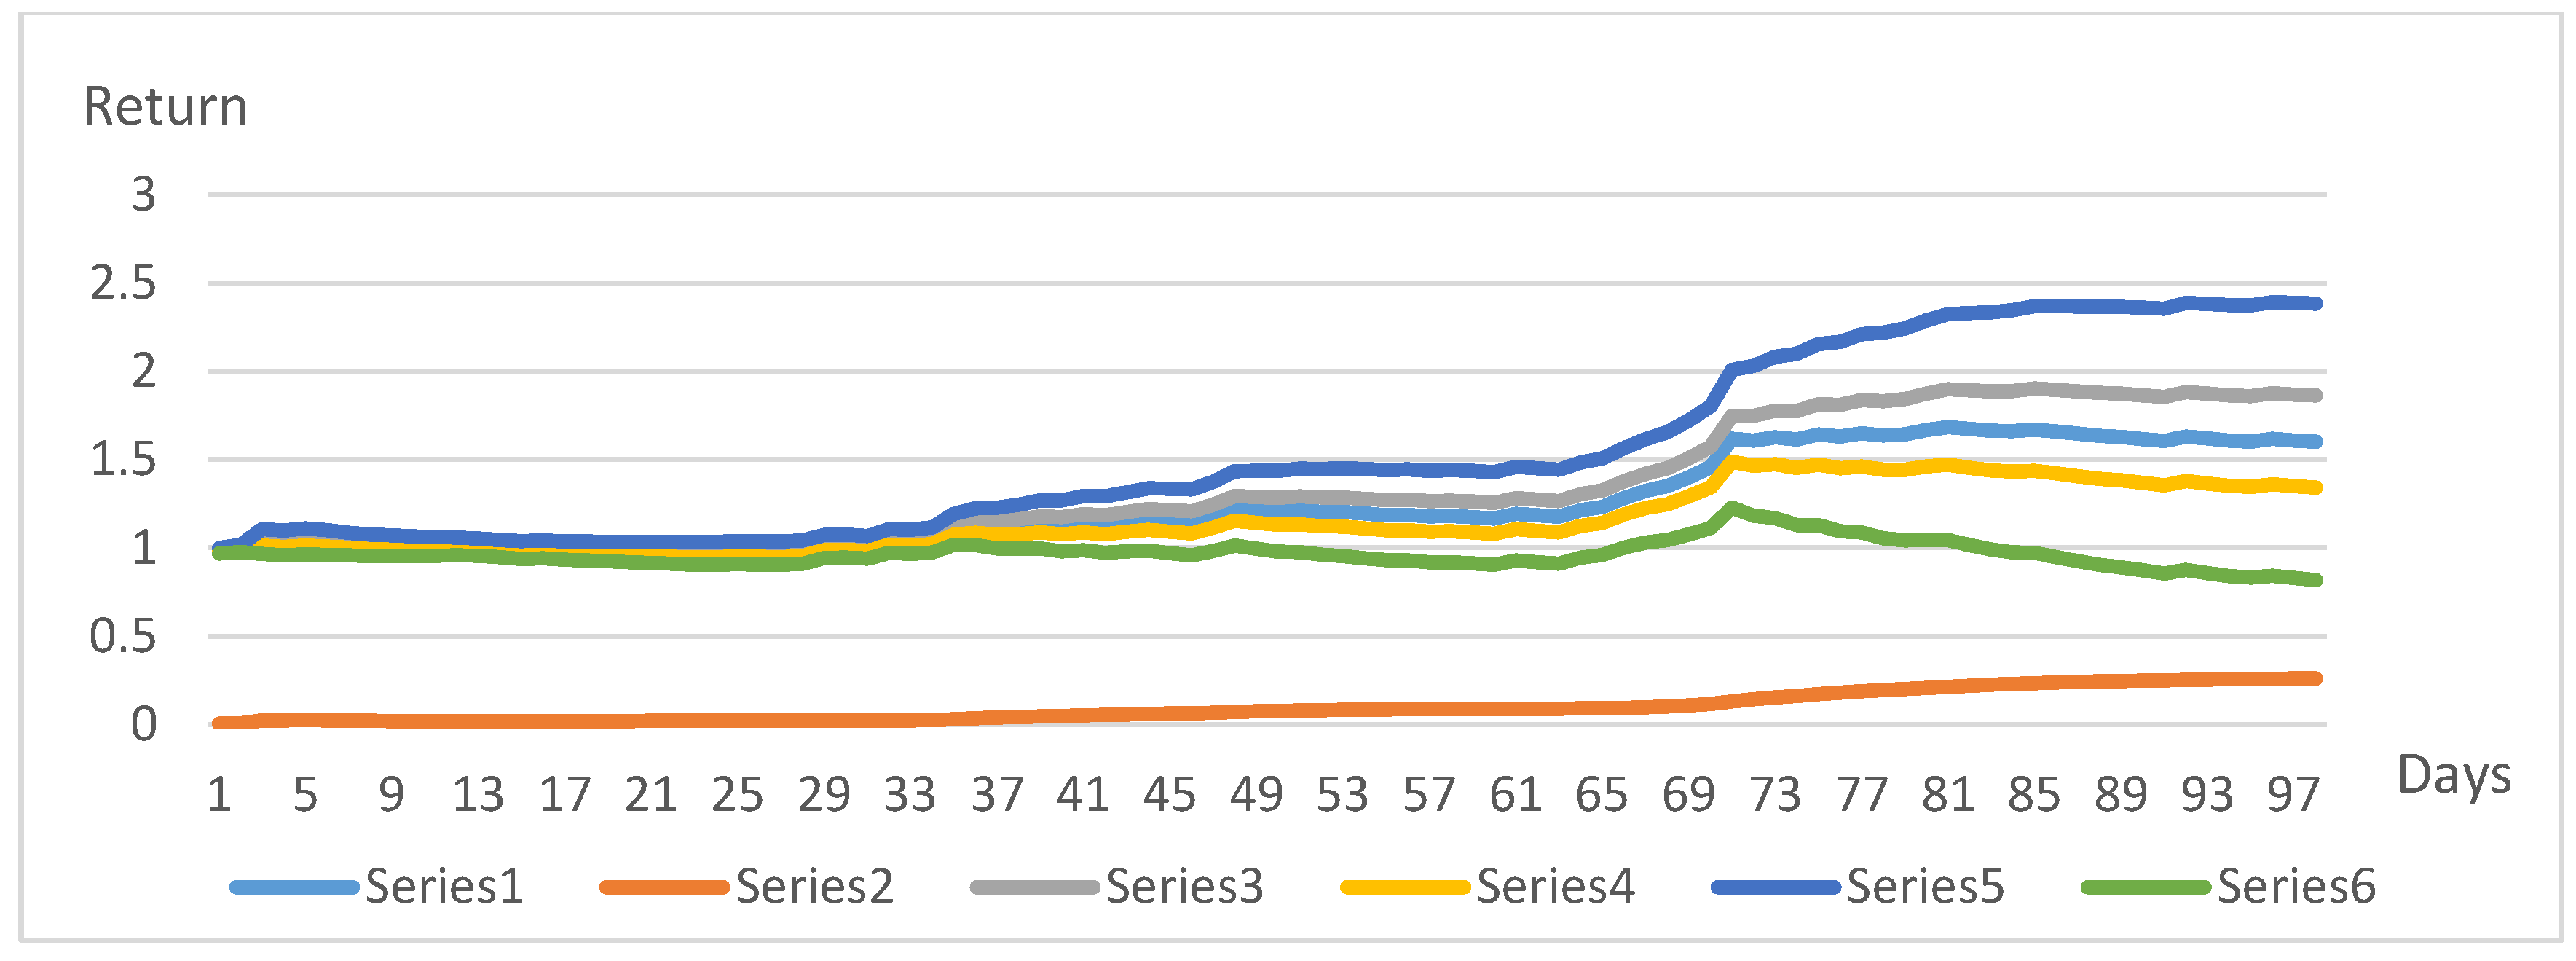
4.3. Presentation of Performed Experimental Solutions

Earlier in the paper, the three principles concerning the structuring of the investment decision are presented, considering the following three points: the suitability of the shares for the portfolio, the risk management abilities, and the required number of active shares required in the portfolio. Therefore, only geometric images of the solutions—the portfolios—will be presented. Their presentation should help to pragmatically reveal the work’s objectives, as well as the use of the three selected goals and principles of analysis, and the suitability of the results for various effective investment objectives. Additionally, it should facilitate understanding and assessment of these circumstances.
The three portfolios delivered for the “100-day trip” were not driven by their own market regulations and intermediaries but focused on different markets—the US market (Figure 5, Figure 6 and Figure 7), the German market (Figure 8, Figure 9 and Figure 10), and the UK market (Figure 11, Figure 12 and Figure 13)—according to a uniform strategy designed for them. The strategic behaviour regulation for all portfolios was fairly consistent. As a first step, using historical data from the markets, a study was conducted on the formation of compounds that shape the growth rates of daily stock returns, treated as stochastic values. The nature of the overnight growth rates of stock returns was revealed. This assumption was further confirmed by the fact that the structures of these compounds resonated with the distribution functions of widely used stochastic values. Thus, preconditions were revealed for the targeted selection of stop-loss order formats for individual stocks or even markets. In turn, the mere disclosure and preservation of such characteristics could significantly increase the suitability of the stock for the successful implementation of the portfolio objectives. Therefore, the disclosure of the potential of the adaptive stop-loss order system has become a crucial moment in assessing the suitability of equities for the portfolio objectives.
Using the emerging daily stock return growth rate system, the selection of the most suitable stocks for the portfolio naturally aligns with the previously presented information: the selection of the most suitable stocks for the portfolio is based on a well-developed theory of stock prices as of stochastic processes. This is evidenced by the generation of high returns or the possibility of operational efficiency to avoid losses due to the risk or costs used to manage it.
In order to achieve the minimum number of active shares in the portfolio, let us follow one of the most important goals in investment—to focus on the highest return-giving share at each step of the portfolio. This is the most vital moment of the interaction between the portfolio and the market. At each stage, the market informs the investor about the potential return that could be generated for each stock participating in the market. Meanwhile, the portfolio strategy declares its intention to invest in the stock that will yield the highest returns in the move. Thus, in the analysed case, the efficiency of the portfolio depends entirely on the accuracy and reliability of the information provided by the market.
First, the results of the US market over a period of 100 days (the figures show 97 days, as several days’ data were used for the technical calculations) (Figure 5, Figure 6 and Figure 7) will be presented. The experiment was performed from 21 June 2021 to 7 November 2021. The following 30 stocks were selected: BA, TSLA, MMM, UNH, AAPL, HD, MCD, WBA, CAT, TRV, JNJ, HON, IBM, CVX, JPM, DIS, AXP, MSFT, WMT, PG, XOM, V, NKE, MRK, INTC, VZ, CSCO, KO, PFE, GE. Over a period of 100 investment days, the most expected return on the portfolio was 2.37 (Figure 5). Transaction costs of 0.003 were applied. The most expected value ±1 sigma (a 68% confidence interval) and the most expected value ±3 sigma (99.7% confidence interval) return confidence intervals are also presented. It is worth noting that sigma is the magnitude of the confidence interval at a particular point, in this case the value of the return on the investment curve at a particular point. This is measured in variance. By investing according to the presented strategy and looking for the stock with the highest return at each step, the annual return would be 7.93. Here, and further in the paper, the portfolio return and transaction cost values are expressed in conditional units, or natural numbers, rather than percentages. The initial investment capital is assumed to be 1. In all figures in the manuscript, these return values are presented on Y axis (vertical axis).
The most expected return on the portfolio of 7 stocks over a 100-day period was 2.54 (Figure 6), and the annual return was 9.37.
The most expected return on the portfolio of three shares over a 100-day period was 2.68 (Figure 7), and the annual return was 10.65. It is worth noticing that, often, the search for the highest return required minimizing the number of stocks in a portfolio.
The German market was further examined (Figure 8, Figure 9 and Figure 10). The experiment was performed in the period from 31 May 2021 to 15 October 2021. The following 30 stocks were selected: RWE, VNA, LHA, MRK, EOAN, DBK, DTE, BEI, MUV2, FME, DHER, DB1, FRE, HEN3, VOW3, SIE, CON, DAI, SAP, ALV, DPW, HEI, BAYN, LIN, BAS, BMW, 1COV, TKA, ADS, IFX. Over a period of 100 investment days, the most expected return on the portfolio was 1.46. Transaction costs of 0.003 were applied. The most expected value ±1 sigma and the most expected value ±3 sigma return confidence intervals are also presented. According to the investment scheme, the annual return would be 2.31.
The most likely return on the portfolio of seven stocks over a 100-day period was 1.51 (Figure 9), and the annual return was 2.44. The most likely return on the portfolio of three shares over a 100-day period was 1.68 (Figure 10), and the annual return was 3.18.
Finally, the UK market was examined (Figure 11, Figure 12 and Figure 13). The experiment was performed in the period from May 31, 2021, to October 15, 2021. The following 30 stocks were selected: BATS, STJ, PRU, JET, RMV, SSE, ABDN, RSW, CCH, PSN, 888, AUTO, RTO, MNG, RR, EXPN, CPG, ABF, RDSB, VOD, TSCO, SDR, AHT, SMT, RDSA, WTB, SPX, SMIN, BA, ANTO. Over a period of 100 investment days, the most expected return on the portfolio was 1.90. Transaction costs of 0.003 were applied. The most expected value ±1 sigma and most expected value ±3 sigma return confidence intervals are also presented. According to the investment scheme, the annual return would be 4.09.
The most expected return on the portfolio of seven stocks over a 100-day period was 1.60 (Figure 12), and the annual return was 4.61. The most expected return on the portfolio of three shares over a 100-day period was 1.86 (Figure 13), and the annual return was 5.83. The portfolio structures for all three markets with three shares are presented in Table 1.
Another experiment with half-hourly US market data from 3 November 2020; 15:00 until 11 November 2020; 19:30 was performed. There were 200 decision-making steps in total. The following three shares were selected for the portfolio: NIO, Inc.; Boeing, Co; and Pfizer, Inc. Transaction costs of 0.003 were applied. The portfolio structure is presented in Table 2.
The most expected return on a portfolio of three stocks over 200 half-hours was 1.20 (Figure 14), with an annual return of 15.89.
By orienting the investment portfolio in the markets in question, the growth in the return on the invested unit over a period of 1 year (251 market days in our case), forming a portfolio of three stocks, accounted for 10.65 in the US stock market, 3.18 in the UK market and 5.83 in the UK. And this happened after the everyday deduction of 0.003 transaction costs of the return that was already available on the portfolio for that day.
Understandably, discussions on the ability to develop a return on an invested unit seem optimistic. However, it is imperative to talk about the possibility of moving away from just exchanging resources in investment markets. The functioning of the markets themselves is a very resource-intensive process. Indeed, the infrastructural, human, financial, and other resources mobilized in virtually any country in the financial-investment market environment are unlikely to be comparable to any other activities. Still, there is a particularly active debate about the higher and more focused commitment to preserving earth civilization. Indeed, discussions about the challenges of innovation or the decline in inefficiency in different countries and economies are not very informative here either.
Further, it is necessary to unambiguously acknowledge the reality that, with the return opportunities in question, it is possible to appear on the market only for a very short time or with an almost imperceptible amount of investment. Otherwise, the market will not accept this. Thus, in order to preserve the meaning of talking about such possibilities, a couple of examples will be given. The first example is presented in Figure 14, which provides a similar solution to the three portfolios discussed earlier, expressed in the confidence interval. Here, half-hourly US financial market data are used, instead of daily data. The result leads to the second example, which would show something like this in reality.
Therefore, we present the opportunities that could have emerged in the examined markets if, over a period of 100 market business days, someone had been able to estimate a stock that would provide returns that were least close to the highest daily return. The growth in the invested unit during the last hundred days before 6 November 2021, if any deductions are waived, would have been 19.05 in the US market, 15.16 in the German market, and 24.65 in the UK market. At present, the information owners, including those operating in the investment corridors, claim that they can monitor the price formation process tens of minutes before the prices are approved. Thus, selecting the stock that will generate the highest return is a real problem to be solved.
In the following, the authors will present the knowledge that was found to be acceptable for improving the management of investment processes as the conclusion of the proposed article.

5. Conclusions and Discussion

The aim of this work was to achieve the highest possible generated return in the market. To achieve this goal, a smart investment portfolio model is being developed that enables the market to generate a relatively high return for the investor. This work does not yet demonstrate how a specific market could react positively to the revealed opportunities, so it did not discuss prominent works of other researchers in which the presented results have already become market instruments. Nevertheless, the results of the multiple return growth obtained in the study testify to the significance of the ongoing research and the potential for significant changes in return on investment. Therefore, the desire to form a concrete vision of the exploitation of these opportunities in the markets dictates the need for future discussion.
Particular attention was paid to the return on daily step assets as a stochastic value, which becomes a natural component of the stock price as a stochastic process. The paper proposes an algorithm that could form stock eligibility priorities for inclusion in a portfolio using improved stochastic process management principles. The work was largely based on the stochastic way of seeing and managing a perspective. Responses to the outcome of the decision are presented using a confidence interval. Daily steps are emphasized, focusing on the effectiveness of the continuous process. The system operates normally for both medium and long steps.
The analysed works usually present a general procedure of stop-loss order application (Han et al. 2016; Yang and Zhang 2021). Alternatively, the authors incorporate this into the practical decision-making process, and present the return results. Therefore, the abilities of trailing stop-loss orders made it possible to reconcile the size and risk of returns and use them to find a solution. This harmonization can be a particularly effective tool in finding optimal solutions, as historical data provide sufficiently reliable information on the regularities of change and sustainability of daily steps as stochastic value distributions and, most importantly, information on the possibility of change in these dependencies.
The investment system presented in the paper was experimentally tested with the data of various markets, various countries (US, Germany, United Kingdom, China, Russia, and other countries). Shares, bonds, currencies, and derivative securities were used extensively. The calculations are based on both current data and deep historical data. The experiment was performed with 2007–2008 data from the global financial crisis; data and indicators for the half-hourly investment step were also used.
The usual return, obtained with the help of declared in the literature portfolio models, varies from 1.04 to 1.61 (De la Torre-Torres et al. 2021; Pan and Long 2021). As a result, the first observation of the listener, reader or evaluator are that it is impossible to achieve the annual portfolio return of 3–9 times, as demonstrated by the authors in this paper. It is also often stated that there are practically no ways of identifying the shares that will give the highest return at each specific step and that this goal cannot be achieved. Nonetheless, the study shows that the market selects this stock at each step, and the return values are determined using historical data for each return value. In addition, by forecasting not the highest return, but only, for instance, a share from the top five in that step, the investor would already have a value that exceeds the result generated by the portfolio.
In turn, the portfolio, which forms market investment solution and is able to function using the data of the last market step, shows growth rates that provoke some intrigue. If the volume available to a particular investor is insignificant compared to the amount available to all investors, the market process may not be disrupted.
The prevailing opinion in the literature is that the investors should select from 7 to 60 stocks for an optimal portfolio (Bradfield and Munro 2017; Oyenubi 2019; Zaimovic et al. 2021). However, in the current research, the need for high returns requires concentrating the amount of investment available on the market in a small number of stocks. Thus, without developing opportunities for portfolio and market interaction, a significant proportion of investors should exit the market, thus destroying market powers and opportunities. Only by looking analytically at the situation can a redirection of the amounts of the receivable return be projected while maintaining the prevailing return trends. Still, given that the investment created by investors is far from being fully involved in shaping the return for the investor, it is necessary to fully understand how the volumes of market management and the generated revenue are distributed between the interests of the market makers and managers. It is, therefore, necessary to consult market players.
The study has some limitations. The paper offers a smart investment portfolio, which allows 3–9 times the growth in the invested capital during the year to be achieved, with a sufficiently high guarantee in the daily step mode, focusing on the stock that can give the highest return at each step. Although the formation strategy of the proposed portfolio is based only on commonly used indicators and actions, the specified strategy often requires a fairly broad harmonization of circumstances. This requires a special framework for matching aspirations, opportunities and emerging trends, which is not yet in place.
Regarding further research, it can be said that the concept and realization of the principles of a smart investment market portfolio have already been developed. The main objective of a market portfolio is to extend the search for high-return opportunities by integrating the potential of multiple portfolios or multiple markets to achieve that goal. Experimental calculations in a virtual environment indicate extremely high potential for a smart portfolio of investment markets. However, a very broad, in-depth consultation with specialists in the field of market formation and functioning is still needed. Additionally, further research is required to carry out a more thorough comparison of the obtained results with previously published findings in the fields of return magnitude, the number of stocks in a portfolio, and the stop loss practical application.

Author Contributions

Conceptualization, A.V.R.; methodology, A.V.R.; validation, A.V.R. and V.S.; investigation, A.V.R. and V.S.; writing—original draft preparation, V.S.; writing—review and editing, V.S.; visualization, V.S.; supervision, A.V.R. All authors have read and agreed to the published version of the manuscript.

Funding

This research received no external funding.

Institutional Review Board Statement

Not applicable.

Informed Consent Statement

Not applicable.

Data Availability Statement

The stock price data used for calculations are publicly available in Yahoo Finance.

Conflicts of Interest

The authors declare no conflict of interest.

References

  1. Allen, David Edmund, and Elisa Luciano. 2019. Risk Analysis and Portfolio Modelling. Journal of Risk and Financial Management 12: 154. [Google Scholar] [CrossRef] [Green Version]
  2. Balloch, Adnan, Anamaria Nicolae, and Dennis Philip. 2015. Stock market literacy, trust, and participation. Review of Finance 19: 1925–63. [Google Scholar] [CrossRef]
  3. Basilio, Marcio Pereira, Jessica Galdino de Freitas, Milton George Fonseca Kmpffe, and Ricardo Bordeaux Rego. 2018. Investment portfolio formation via multicriteria decision aid: A Brazilian stock market study. Journal of Modelling in Management 13: 394–417. [Google Scholar] [CrossRef]
  4. Bhattacharyya, Rupak, Samarjit Kar, and Dwijesh Dutta Majumder. 2011. Fuzzy mean-variance-skewness portfolio selection models by interval analysis. Computers & Mathematics with Applications 61: 126–37. [Google Scholar] [CrossRef] [Green Version]
  5. Blanchett, David, and Philip Straehl. 2017. Portfolio implications of job-specific human capital risk. Journal of Asset Management 18: 1–15. [Google Scholar] [CrossRef]
  6. Boussaidi, Ramzi. 2017. The winner-loser effect in the Tunisian stock market: A multidimensional risk-based explanation. Borsa Istanbul Review 17: 178–89. [Google Scholar] [CrossRef]
  7. Bradfield, David, and Brian Munro. 2017. The number of stocks required for effective portfolio diversification: The South African case. South African Journal of Accounting Research 31: 44–59. [Google Scholar] [CrossRef]
  8. Cardak, Buly A., and Roger Wilkins. 2009. The determinants of household risky asset holding: Australian evidence on background risk and other factors. Journal of Banking and Finance 33: 830–60. [Google Scholar] [CrossRef] [Green Version]
  9. Dai, Bochuan, Ben R. Marshall, Nhut H. Nguyen, and Nuttawat Visaltanachoti. 2020. Risk reduction using trailing stop-loss rules. International Review of Finance 21: 1334–52. [Google Scholar] [CrossRef]
  10. De la Torre-Torres, Oscar V., Rvaristo Galeana-Figueroa, and José Álvarez-García. 2021. A Markov-Switching VSTOXX Trading Algorithm for Enhancing EUR Stock Portfolio Performance. Mathematics 9: 1030. [Google Scholar] [CrossRef]
  11. Frijns, Bart, Esther Koellen, and Thorsten Lehnert. 2008. On the determinants of portfolio choice. Journal of Economic Behavior & Organization 66: 373–86. [Google Scholar] [CrossRef]
  12. Fu, Yi, Shuai Cao, and Tao Pang. 2020. A Sustainable Quantitative Stock Selection Strategy Based on Dynamic Factor Adjustment. Sustainability 12: 3978. [Google Scholar] [CrossRef]
  13. Gambrah, Priscilla Serwaa Nkyira, and Traian Adrian Pirvu. 2014. Risk measures and portfolio optimization. Journal of Risk and Financial Management 7: 113–29. [Google Scholar] [CrossRef] [Green Version]
  14. Gao, Wei, Ruzhen Yan, and Xu Wu. 2016. Research Progress of Algorithmic Trading at Home and Abroad. Proceedings of the First International Conference on Economic and Business Management (FEBM 2016) 16: 40–45. [Google Scholar]
  15. Ha, Youngmin, and Hai Zhang. 2020. Algorithmic trading for online portfolio selection under limited market liquidity. European Journal of Operational Research 286: 1033–51. [Google Scholar] [CrossRef]
  16. Han, Yufeng, Guofu Zhou, and Yingzi Zhu. 2016. Taming momentum crashes: A simple stop-loss strategy. SSRN Working Paper. September 24. Available online: https://papers.ssrn.com/sol3/papers.cfm?abstract_id=2407199 (accessed on 5 November 2021).
  17. Jain, Jinesh, Nidhi Walia, Sanjay Gupta, Kriti Aggarwal, and Simarjeet Singh. 2021. A fuzzy analytical hierarchy process framework for stock selection in the Indian stock market. Journal of Public Affairs, e2710. [Google Scholar] [CrossRef]
  18. Jothimani, Dhanya, Ravi Shankar, and Surendra S. Yadav. 2017. A PCA-DEA framework for stock selection in Indian stock market. Journal of Modelling in Management 12: 386–403. [Google Scholar] [CrossRef]
  19. Khan, Mohammad Tariqul Islam, Siow-Hooi Tan, Lee-Lee Chong, and Gerald Guan Gan Goh. 2021. Investment environment, stock market perception and stock investments after stock market crash. International Journal of Emerging Markets. Ahead of print. [Google Scholar] [CrossRef]
  20. Li, Bo, and Ranran Zhang. 2021. A new mean-variance-entropy model for uncertain portfolio optimization with liquidity and diversification. Chaos, Solitons & Fractals 146: 110842. [Google Scholar] [CrossRef]
  21. Li, Jianjun, Qize Li, and Xu Wei. 2020. Financial literacy, household portfolio choice and investment return. Pacific-Basin Finance Journal 62: 101370. [Google Scholar] [CrossRef]
  22. Lu, Xiaomeng, Jiaojiao Guo, and Hailing Zhou. 2021. Digital financial inclusion development, investment diversification, and household extreme portfolio risk. Accounting and Finance 61: 6225–61. [Google Scholar] [CrossRef]
  23. Markowitz, Harry. 1952. Portfolio selection. The Journal of Finance 7: 77–91. [Google Scholar]
  24. Naqvi, Bushra, Nawazish Mirza, Waqar Azeem Naqvi, and S. K. A. Rizvi. 2017. Portfolio optimisation with higher moments of risk at the Pakistan Stock Exchange. Economic Research Ekonomska Istrazivanja 30: 1594–610. [Google Scholar] [CrossRef] [Green Version]
  25. Oyenubi, Adeola. 2019. Diversification Measures and the Optimal Number of Stocks in a Portfolio: An Information Theoretic Explanation. Computational Economics 54: 1443–71. [Google Scholar] [CrossRef] [Green Version]
  26. Pan, Heping, and Manxiao Long. 2021. Intelligent Portfolio Theory and Application in Stock Investment with Multi-Factor Models and Trend Following Trading Strategies. Procedia Computer Science 187: 414–19. [Google Scholar] [CrossRef]
  27. Rutkauskas, Aleksandras Vytautas, and Viktorija Stasytytė. 2020. Stochastic informative expert system for investment. Journal of Business Economics and Management 21: 136–56. [Google Scholar] [CrossRef] [Green Version]
  28. Scherer, Bernd. 2017. Algorithmic portfolio choice: Lessons from panel survey data. Financial Markets and Portfolio Management 31: 49–67. [Google Scholar] [CrossRef]
  29. Shen, Kao-Yi, and Gwo-Hshiung Tzeng. 2015. Combined soft computing model for value stock selection based on fundamental analysis. Applied Soft Computing 37: 142–55. [Google Scholar] [CrossRef]
  30. Sun, Yutong, and Hanqing Zhao. 2015. Stock Selection Model Based on Advanced AdaBoost Algorithm. Paper presented at 7th International Conference on Modelling,Identification and Control (ICMIC), Sousse, Tunisia, December 18–20; pp. 290–96. [Google Scholar]
  31. Temel Nalin, Halime. 2013. Determinants of household saving and portfolio choice behaviour in Turkey. Acta Oeconomia 63: 309–31. [Google Scholar] [CrossRef]
  32. Thakurata, Indrajit. 2021. Optimal portfolio choice with stock market entry costs and human capital investments: A developing country model. International Review of Economics & Finance 73: 175–95. [Google Scholar] [CrossRef]
  33. Toit, Tim. 2015. Truths about Stop-Losses That Nobody Wants to Believe. Hamburg: Serendipity Ventures UG, Available online: https://www.quant-investing.com/blogs/general/2015/02/16/truths-about-stop-losses-that-nobody-wants-to-believe (accessed on 10 November 2021).
  34. Wang, Feng, Keren Dong, and Xiaotie Deng. 2009a. Algorithmic trading system: Design and applications. Frontiers of Computer Science in China 3: 235–46. [Google Scholar] [CrossRef]
  35. Wang, Jia, Gulser Meric, Zugang Liu, and Ilhan Meric. 2009b. Stock market crashes, firm characteristics, and stock returns. Journal of Banking and Finance 33: 1563–74. [Google Scholar] [CrossRef]
  36. Yang, Chunpeng, and Zhanpei Zhang. 2021. Realization utility with stop-loss strategy. Quarterly Review of Economics and Finance 81: 261–75. [Google Scholar] [CrossRef]
  37. Yao, Rui, and Shan Lei. 2018. Source of Information and Projected Household Investment Portfolio Performance. Family & Consumer Sciences Research Journal 46: 219–37. [Google Scholar] [CrossRef] [Green Version]
  38. Yu, Jaeyong, Gunyoung Lee, and Jang Ho Kim. 2021. Towards Personal Financial Sustainability Based on Human Capital Analysis in Korea. Sustainability 13: 2700. [Google Scholar] [CrossRef]
  39. Zaimovic, Azra, Adna Omanovic, and Almira Arnaut-Berilo. 2021. How Many Stocks Are Sufficient for Equity Portfolio Diversification? A Review of the Literature. Journal of Risk and Financial Management 14: 551. [Google Scholar] [CrossRef]
  40. Zhang, Weiwei. 2017. Household risk aversion and portfolio choices. Mathematics and Financial Economics 11: 369–81. [Google Scholar] [CrossRef]
Figure 1. Decision-making scheme (source: compiled by the authors).
Jrfm 15 00030 g001
Figure 2. Stock selection scheme for the portfolio (source: compiled by the authors).
Jrfm 15 00030 g002
Figure 3. US stock price growth during the 2007–2008 financial crisis (source: compiled by the authors based on Yahoo Finance data).
Jrfm 15 00030 g003
Figure 4. Experimental portfolio return confidence intervals in the US during the 2007–2008 financial crisis (source: compiled by the authors based on Yahoo Finance data and own calculations).
Jrfm 15 00030 g004
Figure 5. Confidence intervals of return on 30 stocks’ portfolio (US market) (source: compiled by the authors based on Yahoo Finance data and own calculations).
Jrfm 15 00030 g005
Figure 6. Confidence intervals of return on 7 stocks’ portfolio (US market) (source: compiled by the authors based on Yahoo Finance data and own calculations).
Jrfm 15 00030 g006
Figure 7. Confidence intervals of return on 3 stocks’ portfolio (US market) (source: compiled by the authors based on Yahoo Finance data and own calculations).
Jrfm 15 00030 g007
Figure 8. Confidence intervals of return on 30 stocks’ portfolio (German market) (source: compiled by the authors based on Yahoo Finance data and own calculations).
Jrfm 15 00030 g008
Figure 9. Confidence intervals of return on 7 stocks’ portfolio (German market) (source: compiled by the authors based on Yahoo Finance data and own calculations).
Jrfm 15 00030 g009
Figure 10. Confidence intervals of return on 3 stocks’ portfolio (German market) (source: compiled by the authors based on Yahoo Finance data and own calculations).
Jrfm 15 00030 g010
Figure 11. Confidence intervals of return on 30 stocks’ portfolio (UK market) (source: compiled by the authors based on Yahoo Finance data and own calculations).
Jrfm 15 00030 g011
Figure 12. Confidence intervals of return on 7 stocks’ portfolio (UK market) (source: compiled by the authors based on Yahoo Finance data and own calculations).
Jrfm 15 00030 g012
Figure 13. Confidence intervals of return on 3 stocks’ portfolio (UK market) (source: compiled by the authors based on Yahoo Finance data and own calculations).
Jrfm 15 00030 g013
Figure 14. Confidence intervals of return on 3 stocks’ portfolio (UK market, half-hourly data) (source: compiled by the authors based on Yahoo Finance data and own calculations).
Jrfm 15 00030 g014
Table 1. Portfolio structures with 3 shares.
DaysUSGermanyUK
TSLAPFEWBATKAMRKIFXRRRSWTSCO
1001010010
2001010010
3100010100
4100010100
5100010100
..............................
96100010100
97100010100
98100010100
99100010100
100100010100
Source: compiled by the authors based on own calculations.
Table 2. Portfolio structure of half-hourly step.
StepsNIO, IncBoeing, CoPfizer, Inc
1100
2100
3010
4010
5010
............
196100
197100
198100
199100
200100
Source: compiled by the authors based on own calculations.
Publisher’s Note: MDPI stays neutral with regard to jurisdictional claims in published maps and institutional affiliations.

