1. Introduction
The pension system in Poland is subject to constant changes aimed at improving its functioning (
Bińczycka-Majewska 2014). Anticipating demographic trends and noticing the shortcomings of the existing solutions, a comprehensive reform of the pay-as-you-go system was introduced in 1999. It consisted mainly of limiting the pay-as-you-go element, individualizing the accumulated pension capital (by creating a separate account in the Social Insurance Institution for each participant), and introducing a voluntary savings component.
pillar I—an account in the Social Insurance Institution (SII),
pillar II—sub-account at the SII or sub-account at the SII and Open Pension Fund (OPF) account,
pillar III—Individual Pension Account, Individual Pension Assurance Account, Employee Pension Scheme, Employee Capital Scheme—voluntary saving accounts.
The first and second pillar of the pension system are compulsory and financed from the pension contributions of employed people (calculated and collected on remuneration). In the mandatory part of the pension system, a pension contribution of 19.52% of the so-called basis of calculation, i.e., gross salary, is transferred. Part of this contribution, 12.22%, goes to the first pillar to the participant’s individual account at the Social Insurance Institution. The funds accumulated in the SII are allocated to the current payment of pensions (pay-as-you-go system). The remaining 7.3% of the premium goes to the 2nd pillar—either entirely to the participant’s sub-account at the SII, or 4.38% to the sub-account at the SII, and 2.92% to the account in the Open Pension Fund (
Jaworska 2016). The funds accumulated in the SII sub-account in the 2nd pillar are subject to valorization as in the 1st pillar, while the funds accumulated in the OPF are adjusted by the rate of return on investment on the capital market (capital system). Last reforms have not improved the situation of the system at all because the element of the capital system introduced in 1998 was severely limited as part of the reform in 2015.
The third pillar of the pension system is voluntary. The purpose of this part is to collect additional and private savings for the period of professional inactivity. The third pillar of the pension system in Poland includes (
Kostrzewa 2019):
Employee Pension Schemes, which are a voluntary form of group saving for retirement, organized by the employer with the participation of employees.
Individual Pension Accounts maintained on the basis of an agreement concluded by the saver with an investment fund, brokerage entity, insurance company, bank, or voluntary pension fund.
Individual Pension Assurance Accounts, similarly to IPA, are maintained on the basis of an agreement concluded by the saver with an investment fund, an entity conducting brokerage activities, an insurance company, a bank, or a voluntary pension fund. The main difference between IPA and IPAA concerns the possibility of using a tax relief while collecting sources.
Employee Capital Schemes are the newest form of saving of the pension system, financed from three sources: Contributions from participants, contributions from employing entities, and state subsidies.
Another reform of the pension system is planned in the near future, consisting in the complete liquidation of open pension funds. As a result of this reform, the holders of funds in OPF will be forced to decide on the further fate of this capital. There will probably be two options to choose from:
Basic and automatic—staying in OPF, which will be transformed into a special IPA or
Variant requiring a written declaration—transferring funds to an account at SII.
This reform has been announced for a year, and the next date of its introduction is January 2022, which seems to be very unlikely. It is currently expected to be introduced in mid to late 2022 (Liczne zmiany do ustawy o systemie ubezpieczeń społecznych).
The structure of the Polish pension insurance system, despite many reforms carried out in recent years, is still mainly based on the pay-as-you-go pillar. In this part, the constant inflow of participants who pay contributions, thanks to which it is possible to pay benefits to current beneficiaries, i.e., pensioners, plays a crucial role in the functioning of the system. At the same time, a negative demographic trend is observed, which—in the context of the pension system—poses a threat that there are going to be more and more pensioners and fewer contributors in the system. Therefore, the question arises: How much time is there left for repartition-based pension insurance system to last? What is the main threat to its existence? This article is an attempt to answer such questions using the example of the Polish pension insurance system (PIS). To answer such questions and verify hypotheses, linear trend models were used in the analysis. The adjustment of these models to reality was high, and on their basis, the forecasts for the following years were estimated. The variables adopted for the analysis are time, number of people, and the value of contributions and withdrawals.
The Polish pension system has been transformed a few times since 1989, but still, the most important part of it is the repartition one (pay-as-you-go). This means that the money for current pensions is delivered by people who are active in the labor market and pay insurance contributions. As a result, funds for pensions are collected as long as people want and are able to pay these contributions (
Kapoor et al. 2007, p. 586).
2. Materials and Methods
The hypotheses stated at the beginning of this article are:
Hypothesis 1 (H1): The Polish pension insurance system has about 50 years to last according to the current conditions.
Hypothesis 2 (H2): Reforms of the Polish pension insurance system are necessary to improve its efficiency.
Analyses were based on statistical data published by the Central Statistical Office of Poland and the Social Insurance Institution. Linear and nonlinear trend models were used in the analysis because the adjustment of these models to reality was high, and on their basis, the forecasts for the following years were estimated. The variables adopted for the analysis are time, number of people, and the value of contributions or withdrawals.
The linear trend model formula is:
where:
Forecasts based on linear trend were calculated on the basis of the formula:
The nonlinear trend model formula is:
where:
Forecasts based on nonlinear trend were calculated on the basis of the formula:
The coefficient of determination formula is:
Linear trend models are useful for such economic considerations because the trend analysis can be modeled for any data and can be updated or validated whenever required. Unfortunately, they also have some disadvantages as historical data may not provide the true scenario, and new variables can appear in time, which can even increase the probability of error in the predicted pattern for the previous data (
Nau 2020). In fact, there are no methods that provide predictions with 100% certainty as the reality is dynamic, and the future can bring phenomena that were never described before.
3. Results
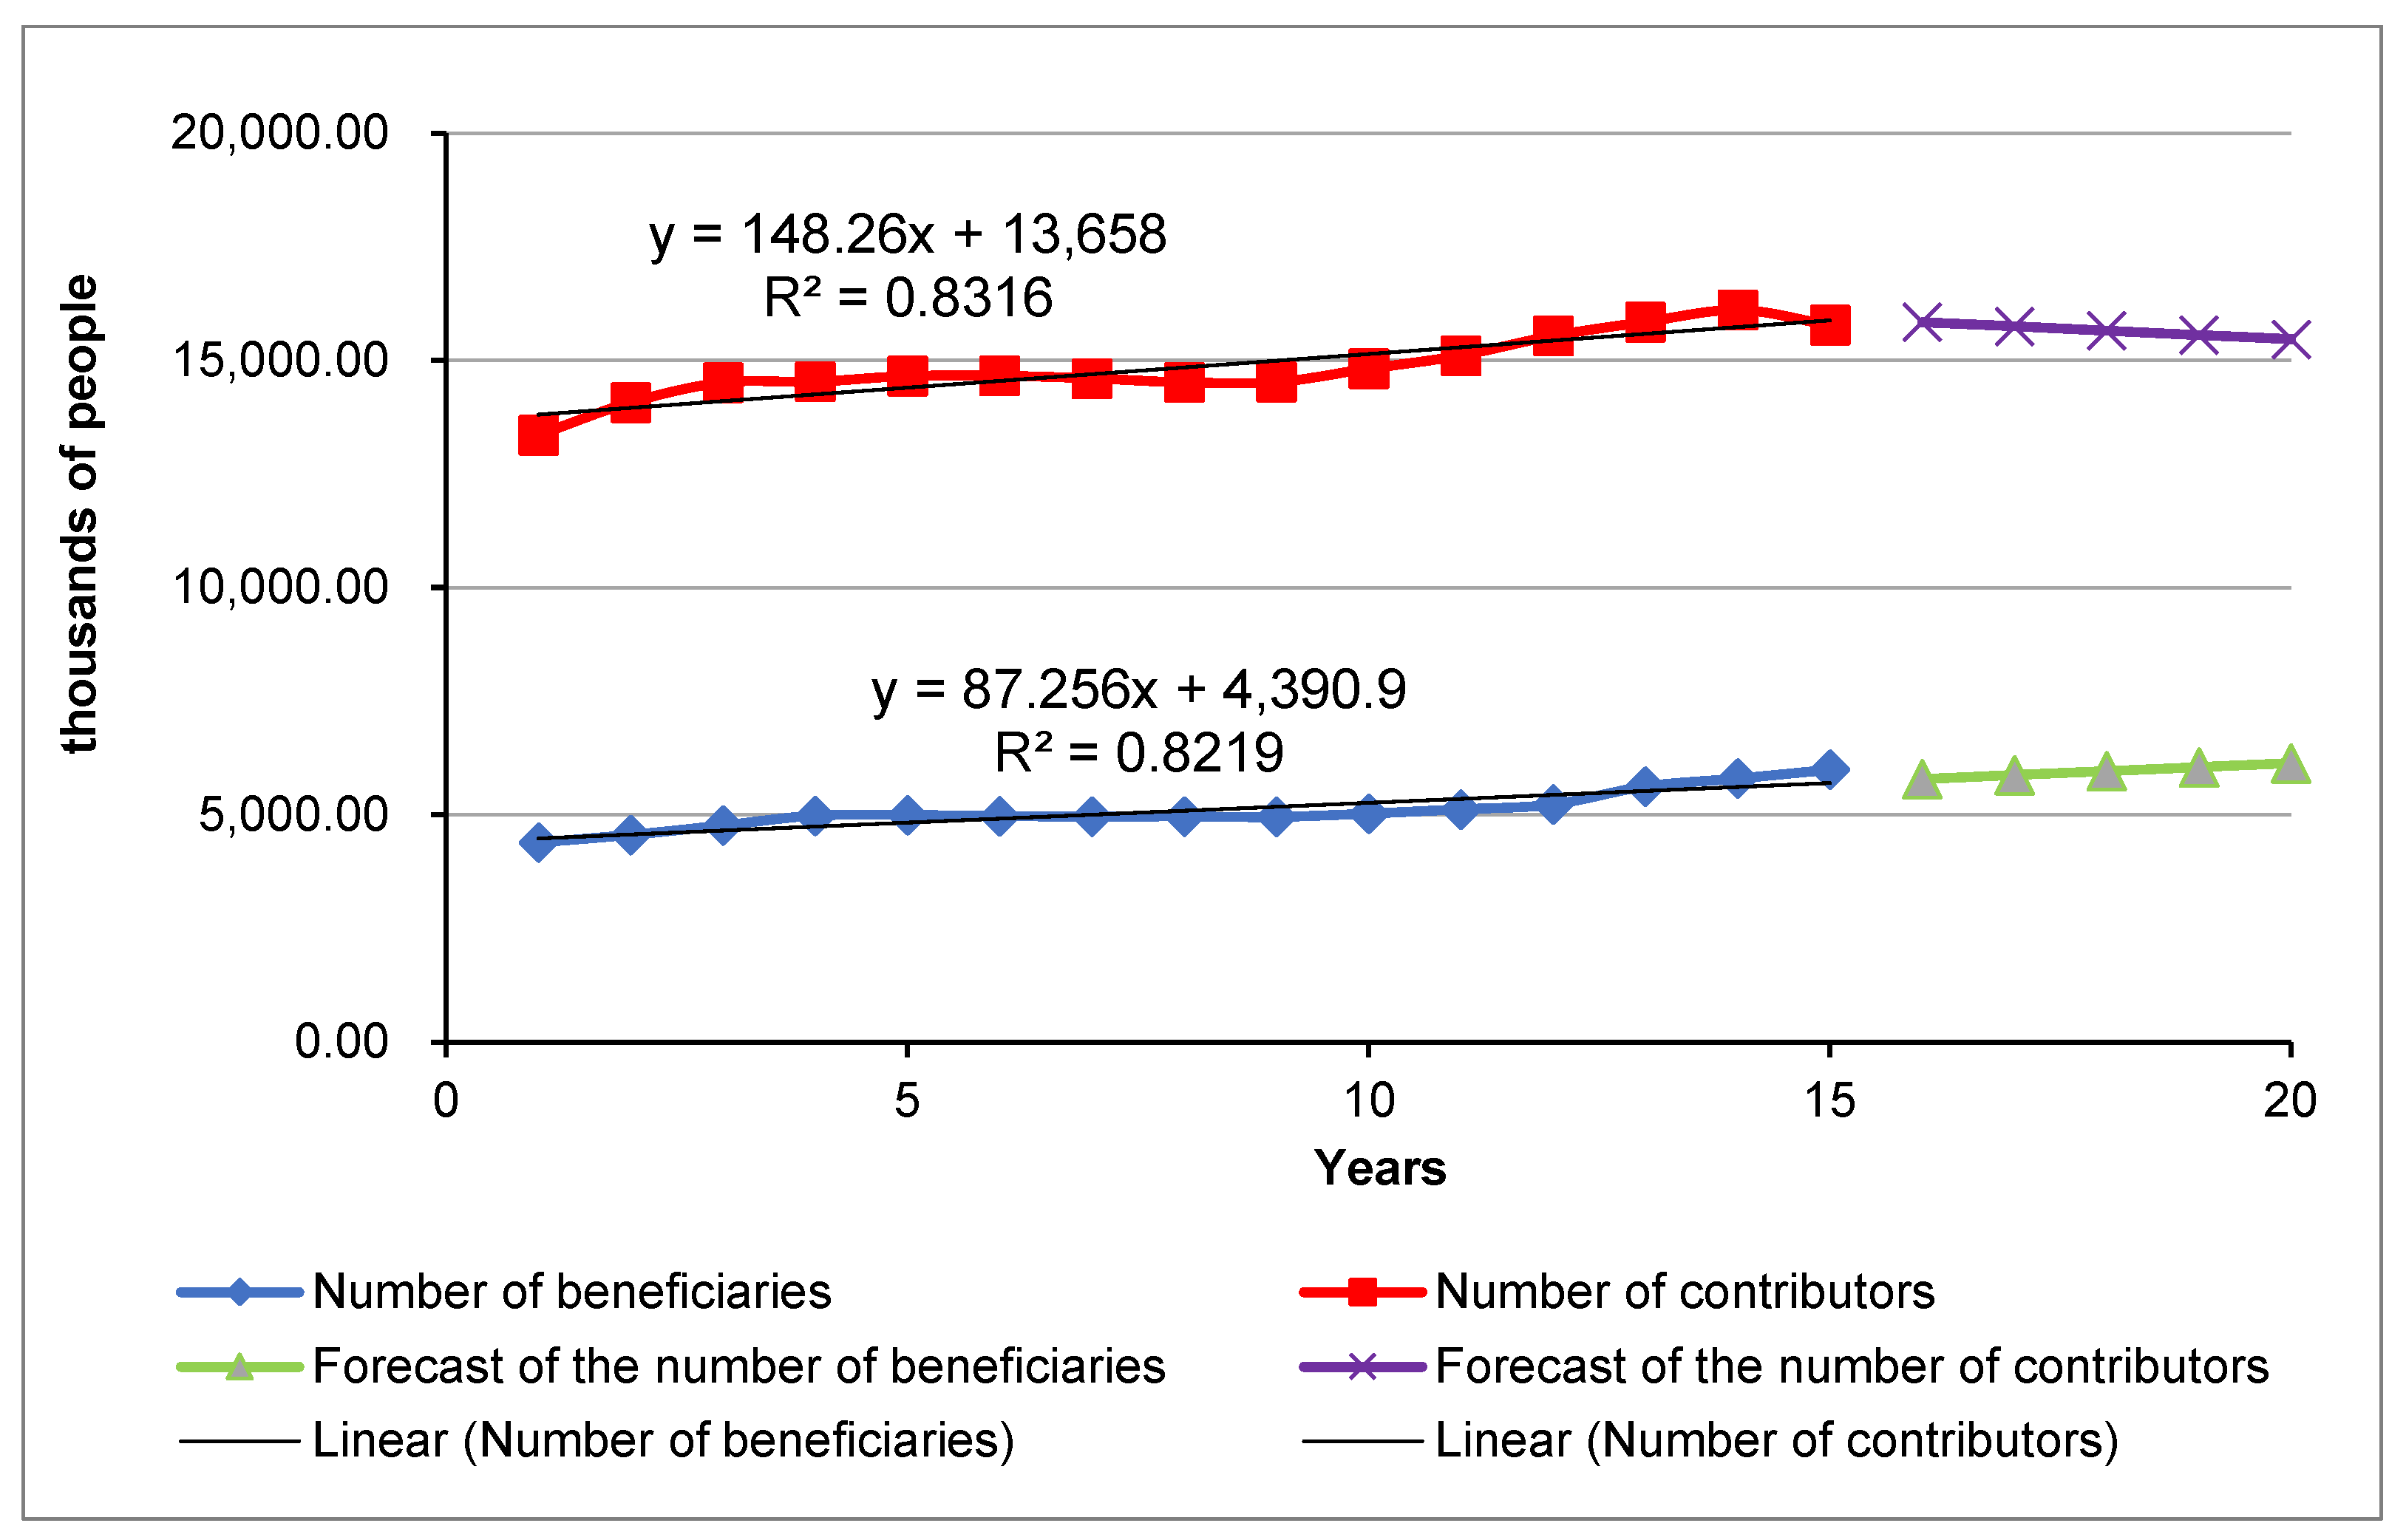
Analyzing the number of people paying contributions and beneficiaries of the system, it is seen that although the number of contributors and beneficiaries increases, the number of beneficiaries increases faster than contributors. Thus, the relation between the number of people providing funds and people who receive them is getting unfavorable (see
Table 1).
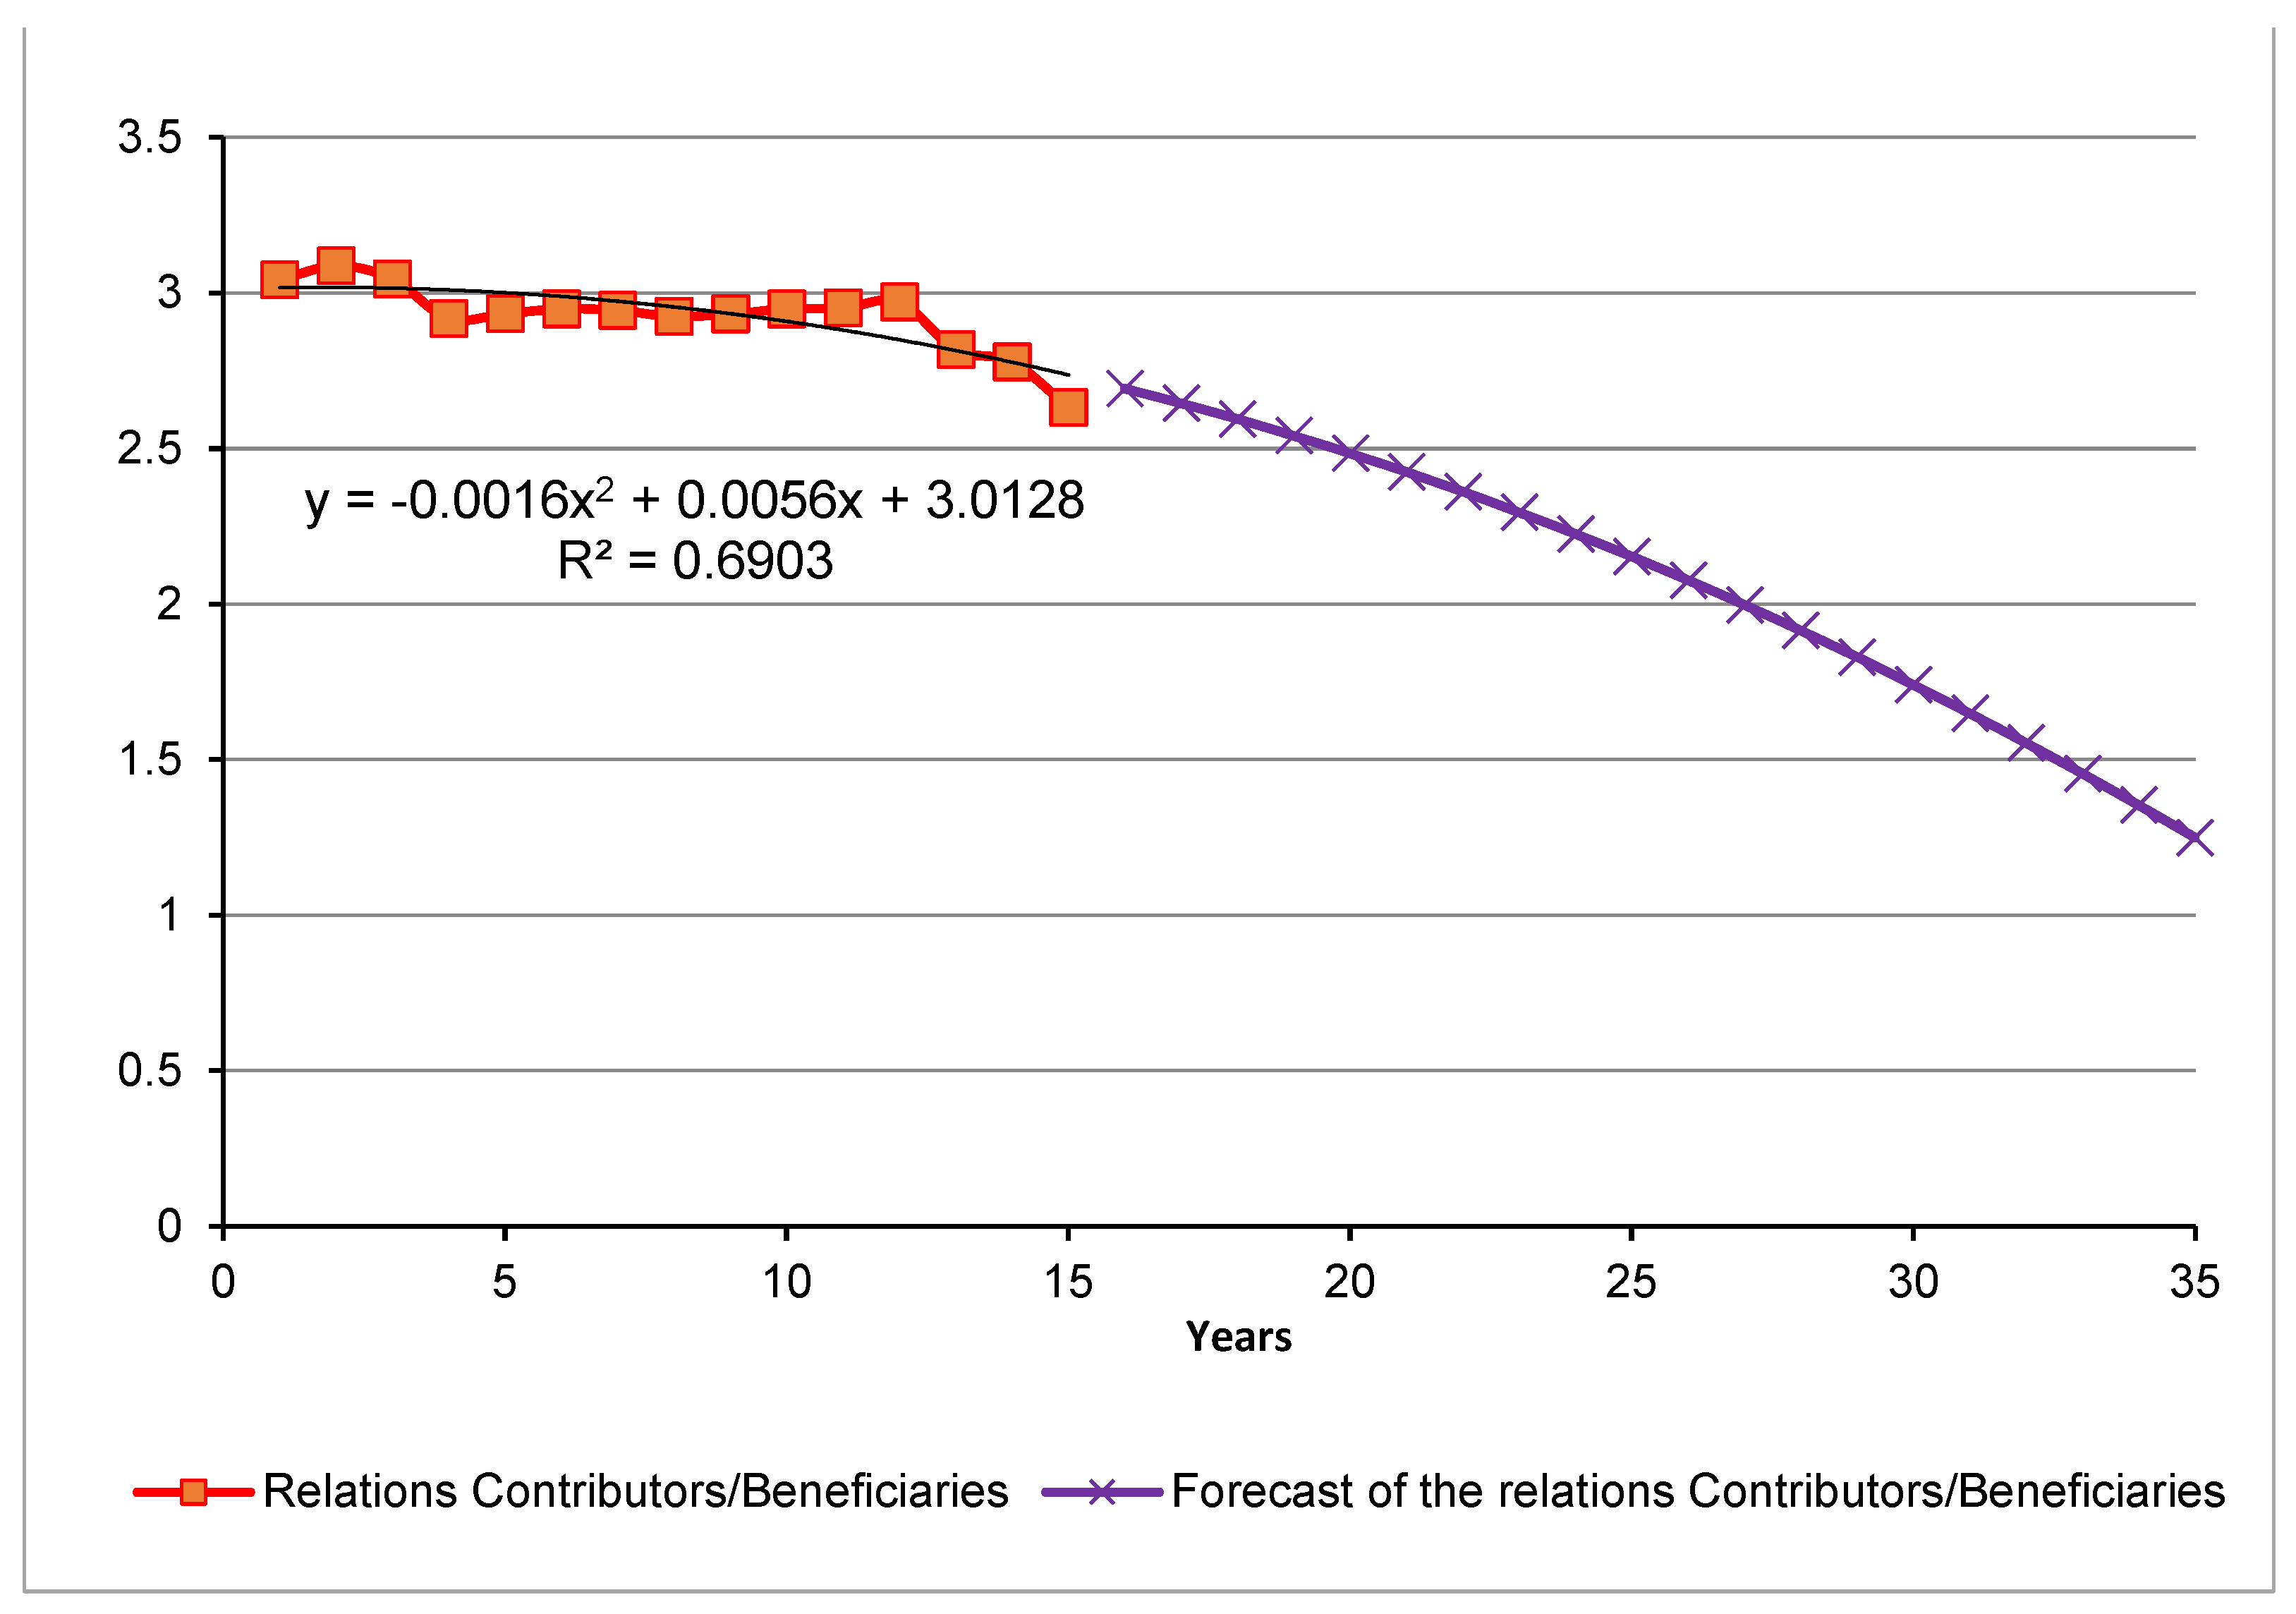
This negative relation is well visible in column 5 of
Table 1. It shows that nowadays, less than three people are working for one beneficiary, while 15 years ago this was more than three. People who are working have to work more and provide more money to the system to sustain the increasing number of pensioners. This relation is getting even worse while estimated for next years (see
Figure 1 and
Figure 2).
Respectively, this negative relation corresponds with the balance of payments of the Pension Fund, which is a part of the Social Insurance Fund
1 (see
Table 2). Incoming payments are smaller than withdrawals. This negative balance must be compensated with money from the state budget. This money is collected mainly from taxes, which means that people pay twice for pensions: First, via insurance contributions, and second, via taxes.
In 2006–2010, it can be seen that the trend of increasing negative balance of payments was deeper and deeper, in 2011–2014 it was sustained at quite similar—but still negative—level, but starting from 2015, this relation diverted, and till 2019, it was getting better. In 2020, it turned back to the state from 2015. This was connected with the reform of the system (
Ustawa z dnia 5 marca 2015 r…) according to which money from open pension funds (OPFs) was transferred to the Social Pension Fund and the majority of people resigned from collecting money in OPFs. In many cases, full contributions are now paid to the Social Pension Fund. This reform was introduced to reduce the current system deficit and, in fact, thanks to this change, the prognosis for the next few years became slightly optimistic. However, it must be remembered that such a change can cause an even deeper deficit in the future. It is just an ad hoc action.
Figure 3 shows the current situation together with the models for the considered period of 2006–2020. However, what would have happened if this reform had not been introduced? The prognosis would be much worse.
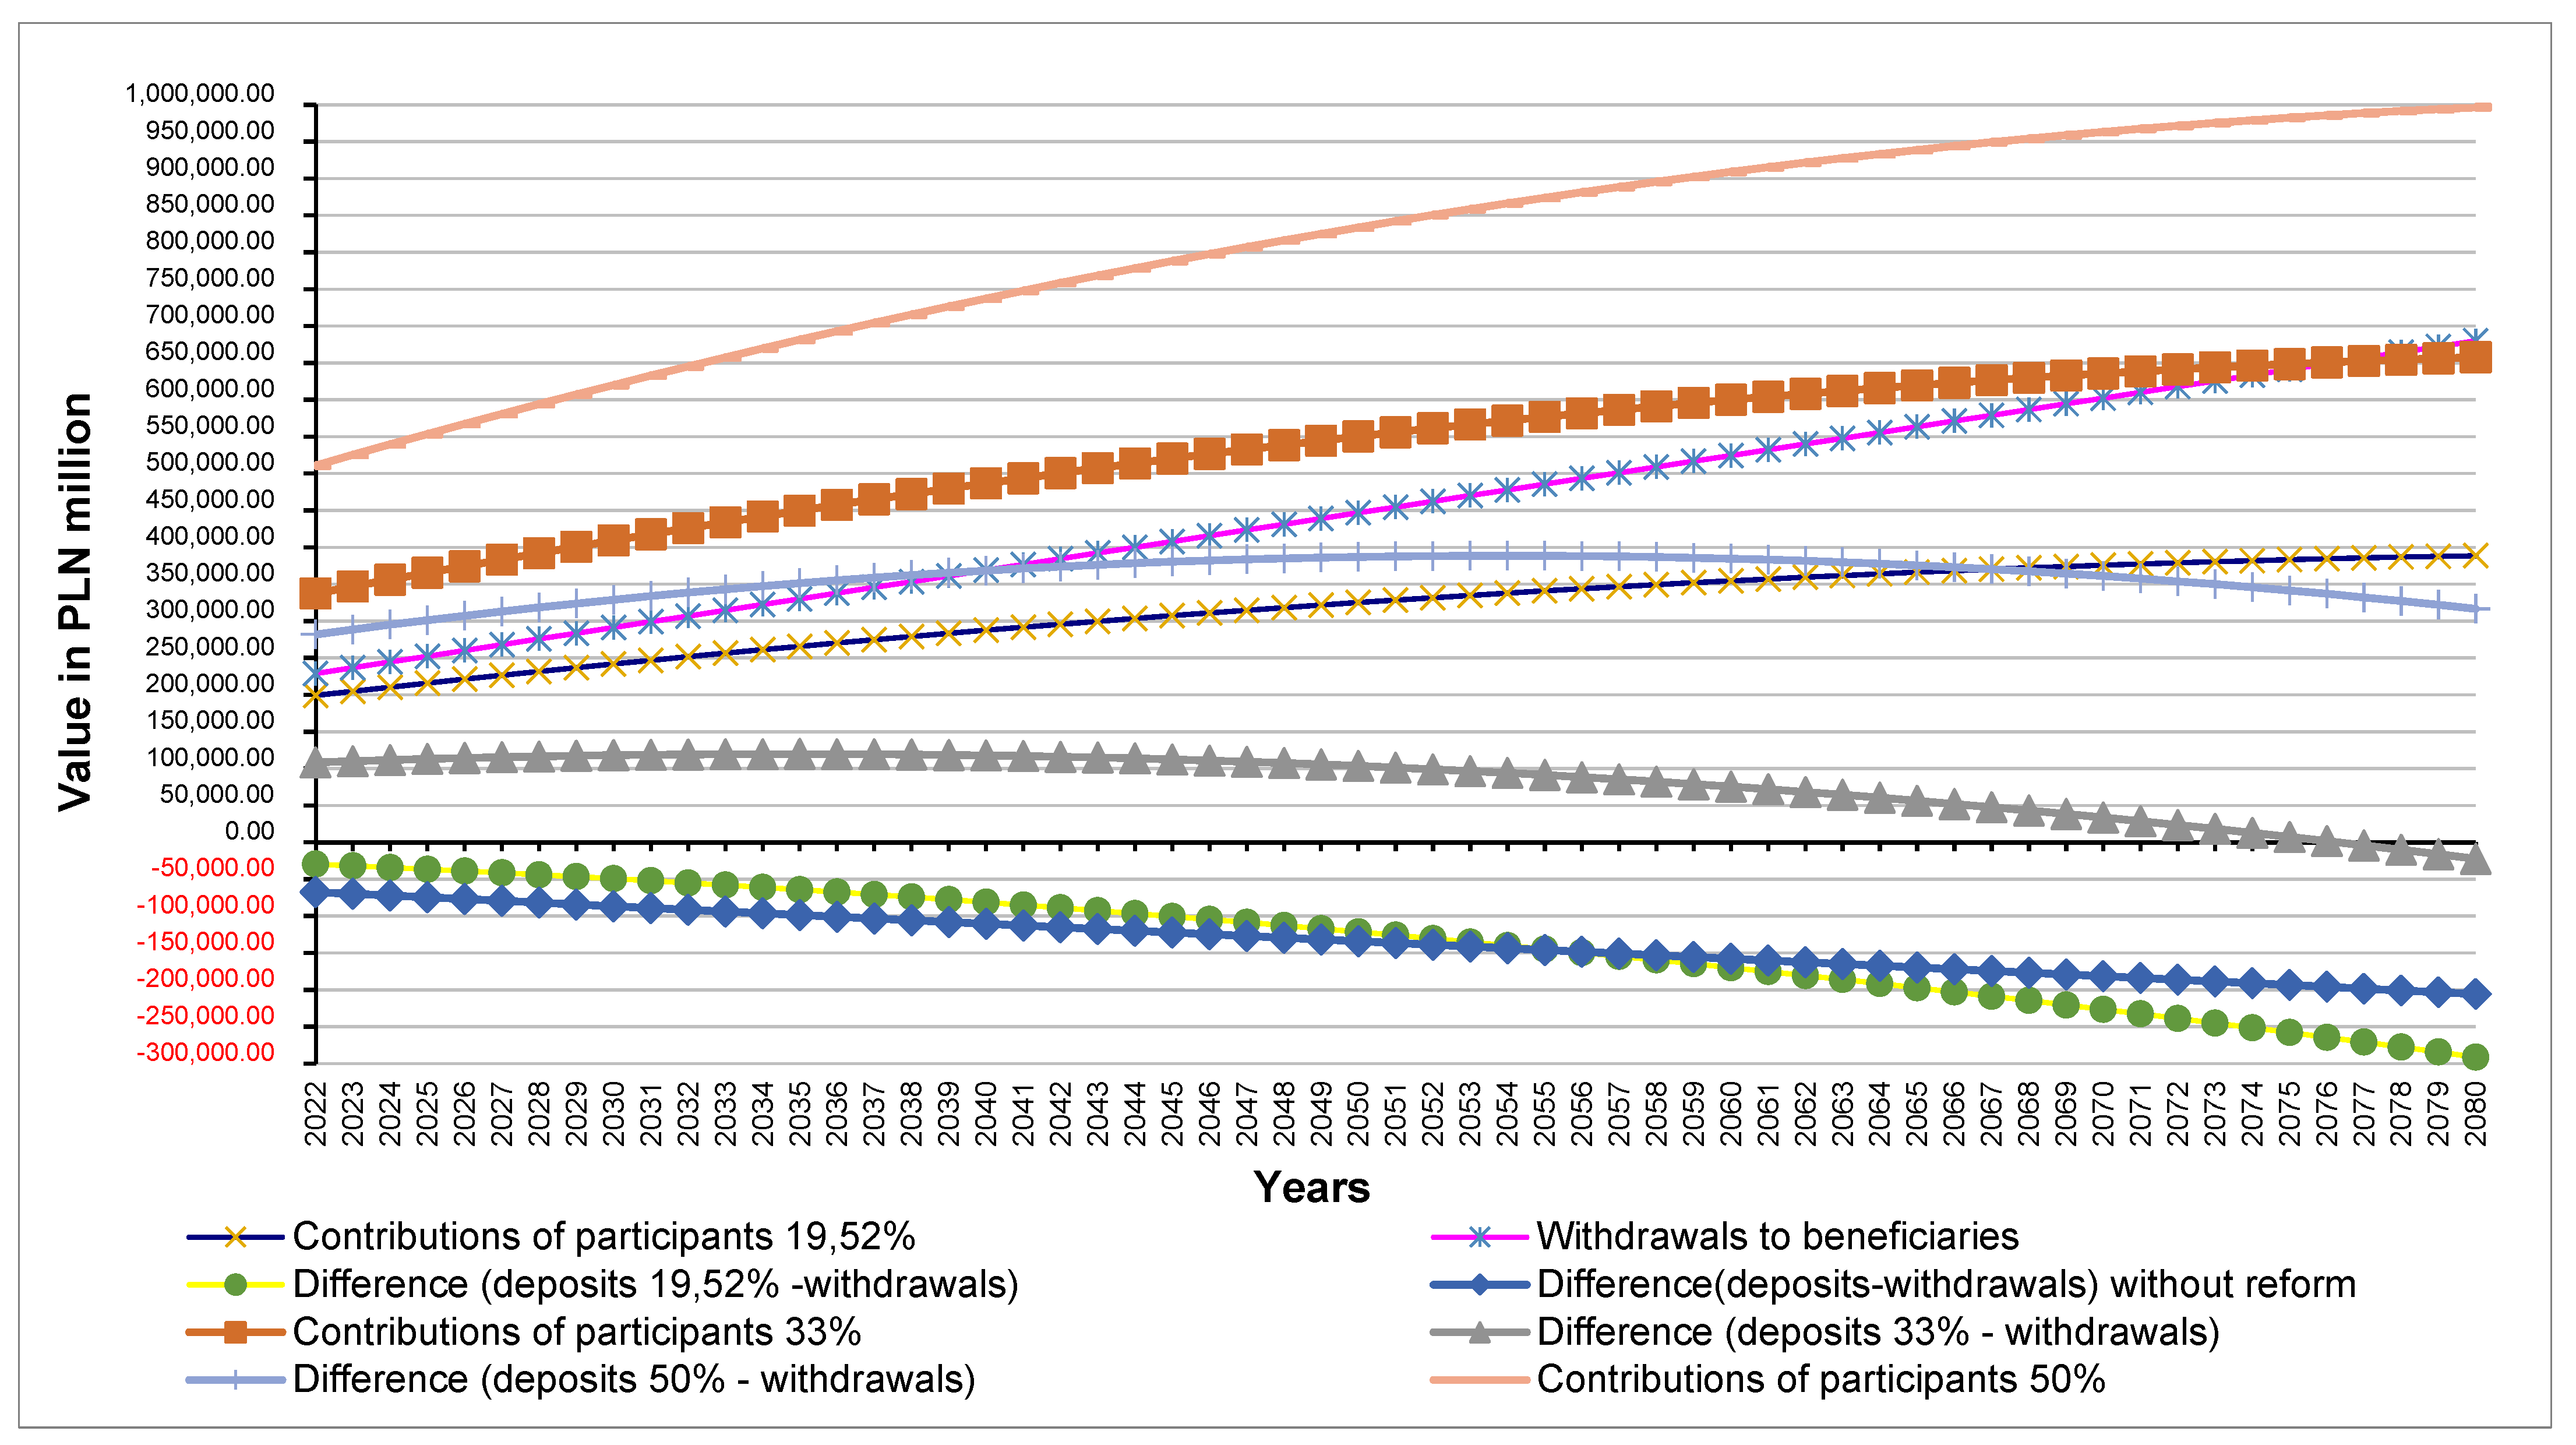
Figure 4 shows the contributions, withdrawal forecasts, and their balance. The simulation shows that, as a result of the last reform, contributions will exceed withdrawals in 2040, assuming that the current trends will be maintained. If the reform were not to take place, expenses would exceed the revenues by over 110 billion PLN (see
Figure 4).
In
Figure 4, simulations also include a situation when contributions are higher than currently (33% or 50% of the average salary in the economy instead of current 19.52%). Moreover, the number of beneficiaries was adjusted according to demographic trends. In this case, conclusions are different than before because, in such conditions, the system will become inefficient in 2056 (for 33%) due to the unfavorable demographic situation. For the contribution of 50% of the average salary, the system’s capacity increases until around 2055. In the following years, it begins to slowly decrease, but this tendency is very slight. According to these results, it seems indispensable to increase the contributions to the level of 33% of the average salary, which will ensure the effectiveness of the system by 2077 when the revenues to the system will become lower than the expenses.
4. Discussion
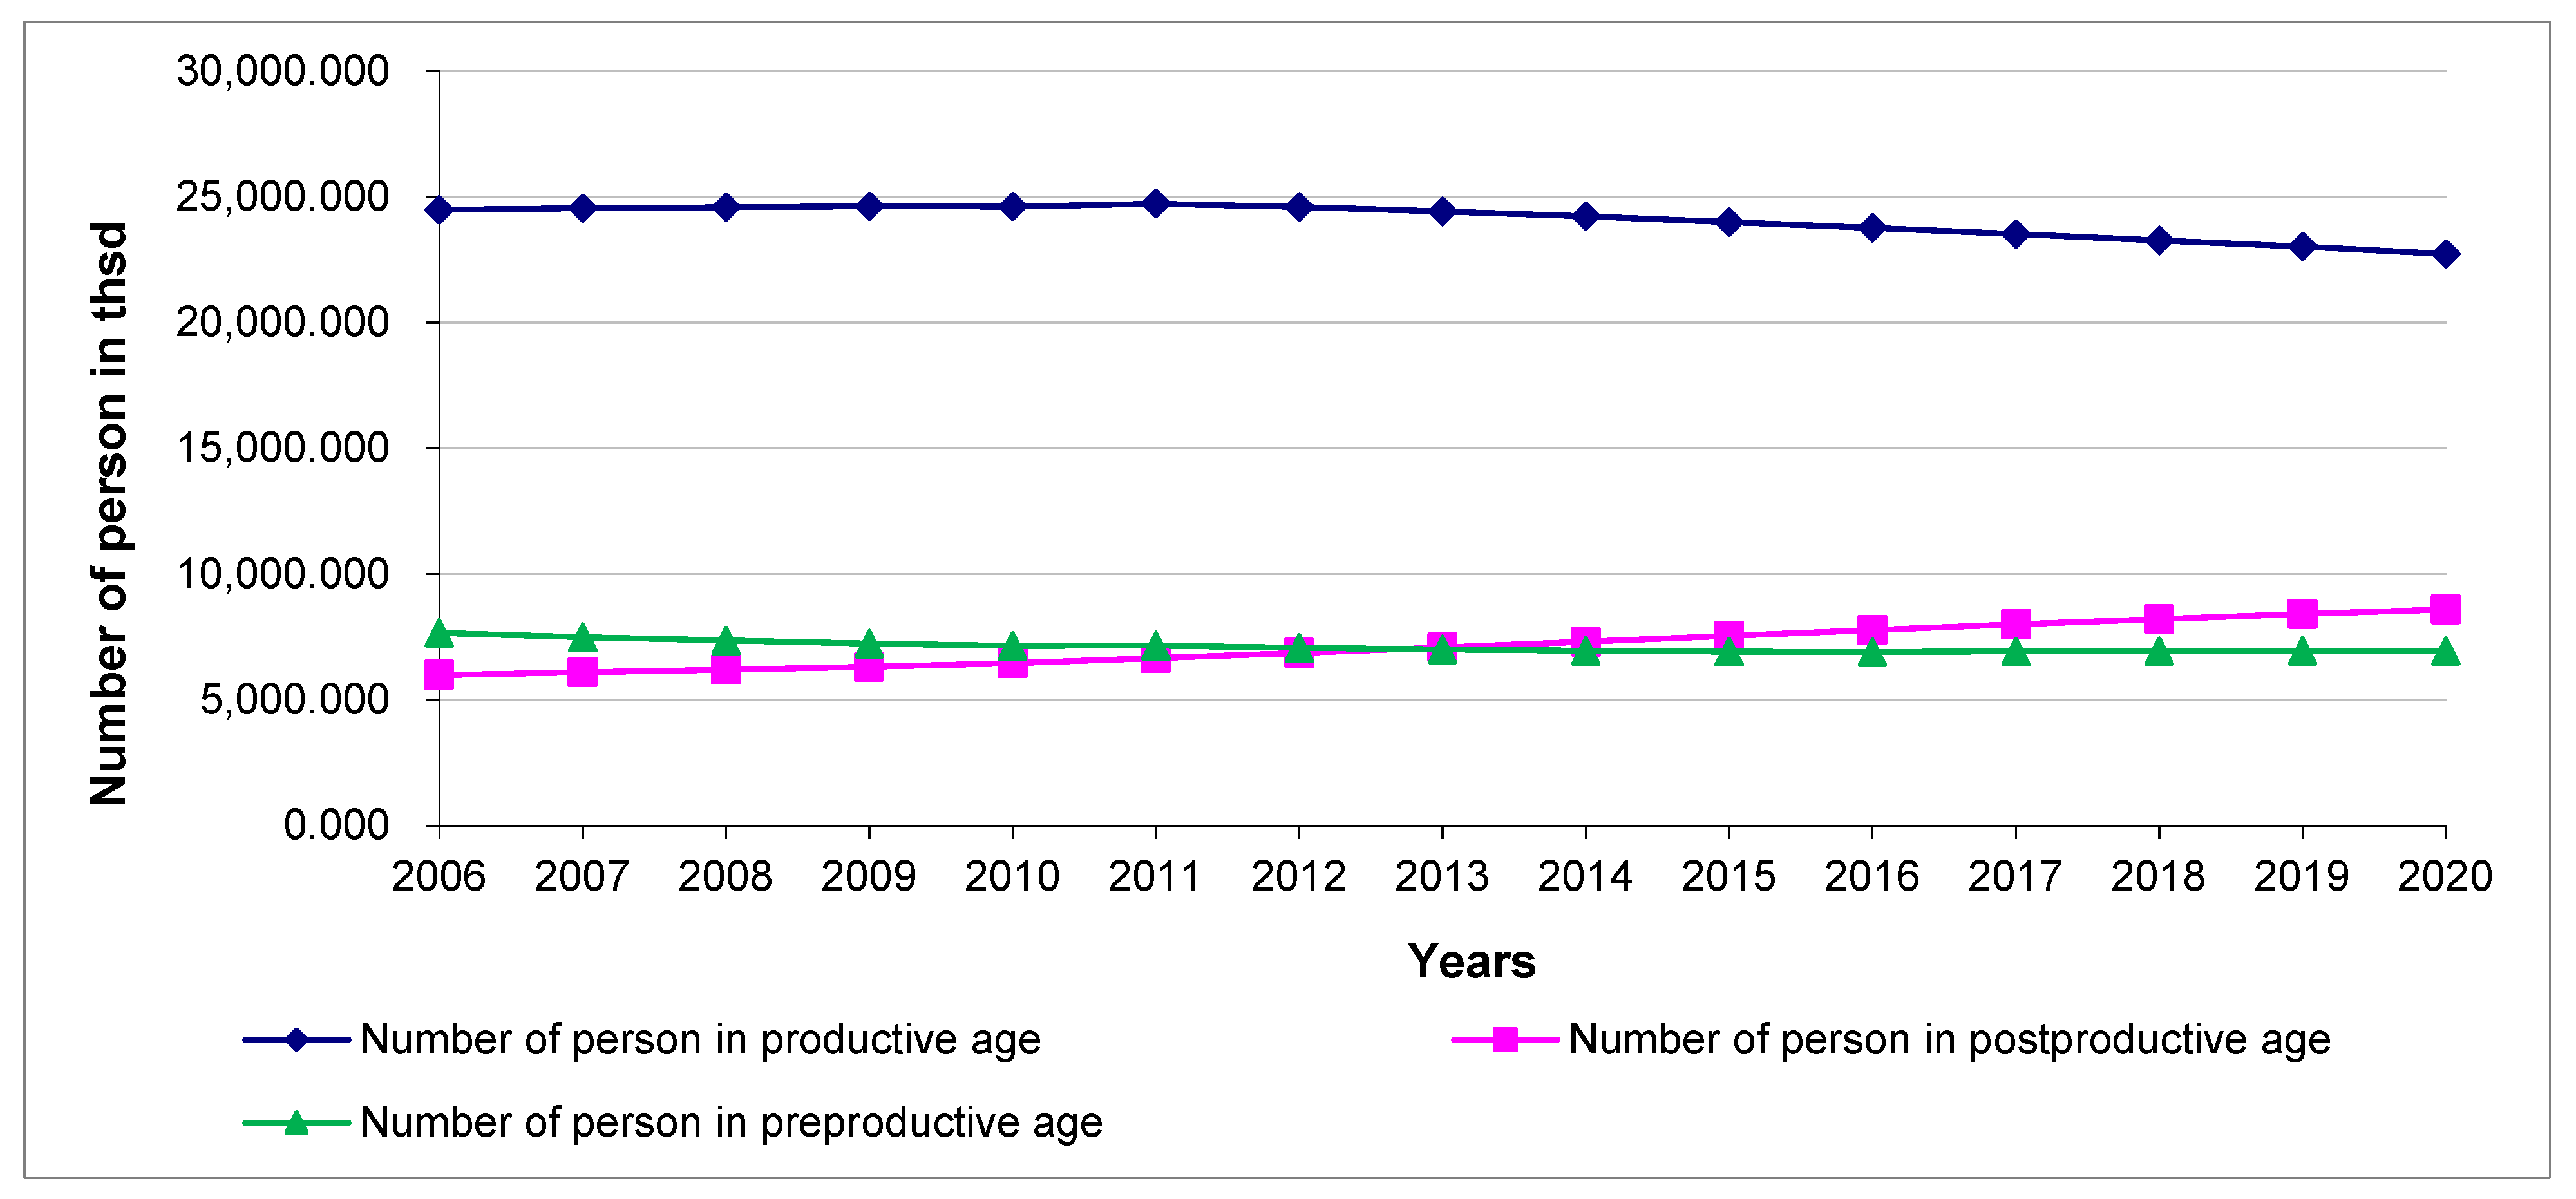
It is clear that the development of the repartition (pay-as-you-go) system demands a constant inflow of people who can pay higher contributions for the pensions paid at the same time. The demographic situation in Poland seems not to be very optimistic in this area. The number of people of pre- and productive age decreases, while the number of people of post-productive age constantly increases (see
Figure 5).
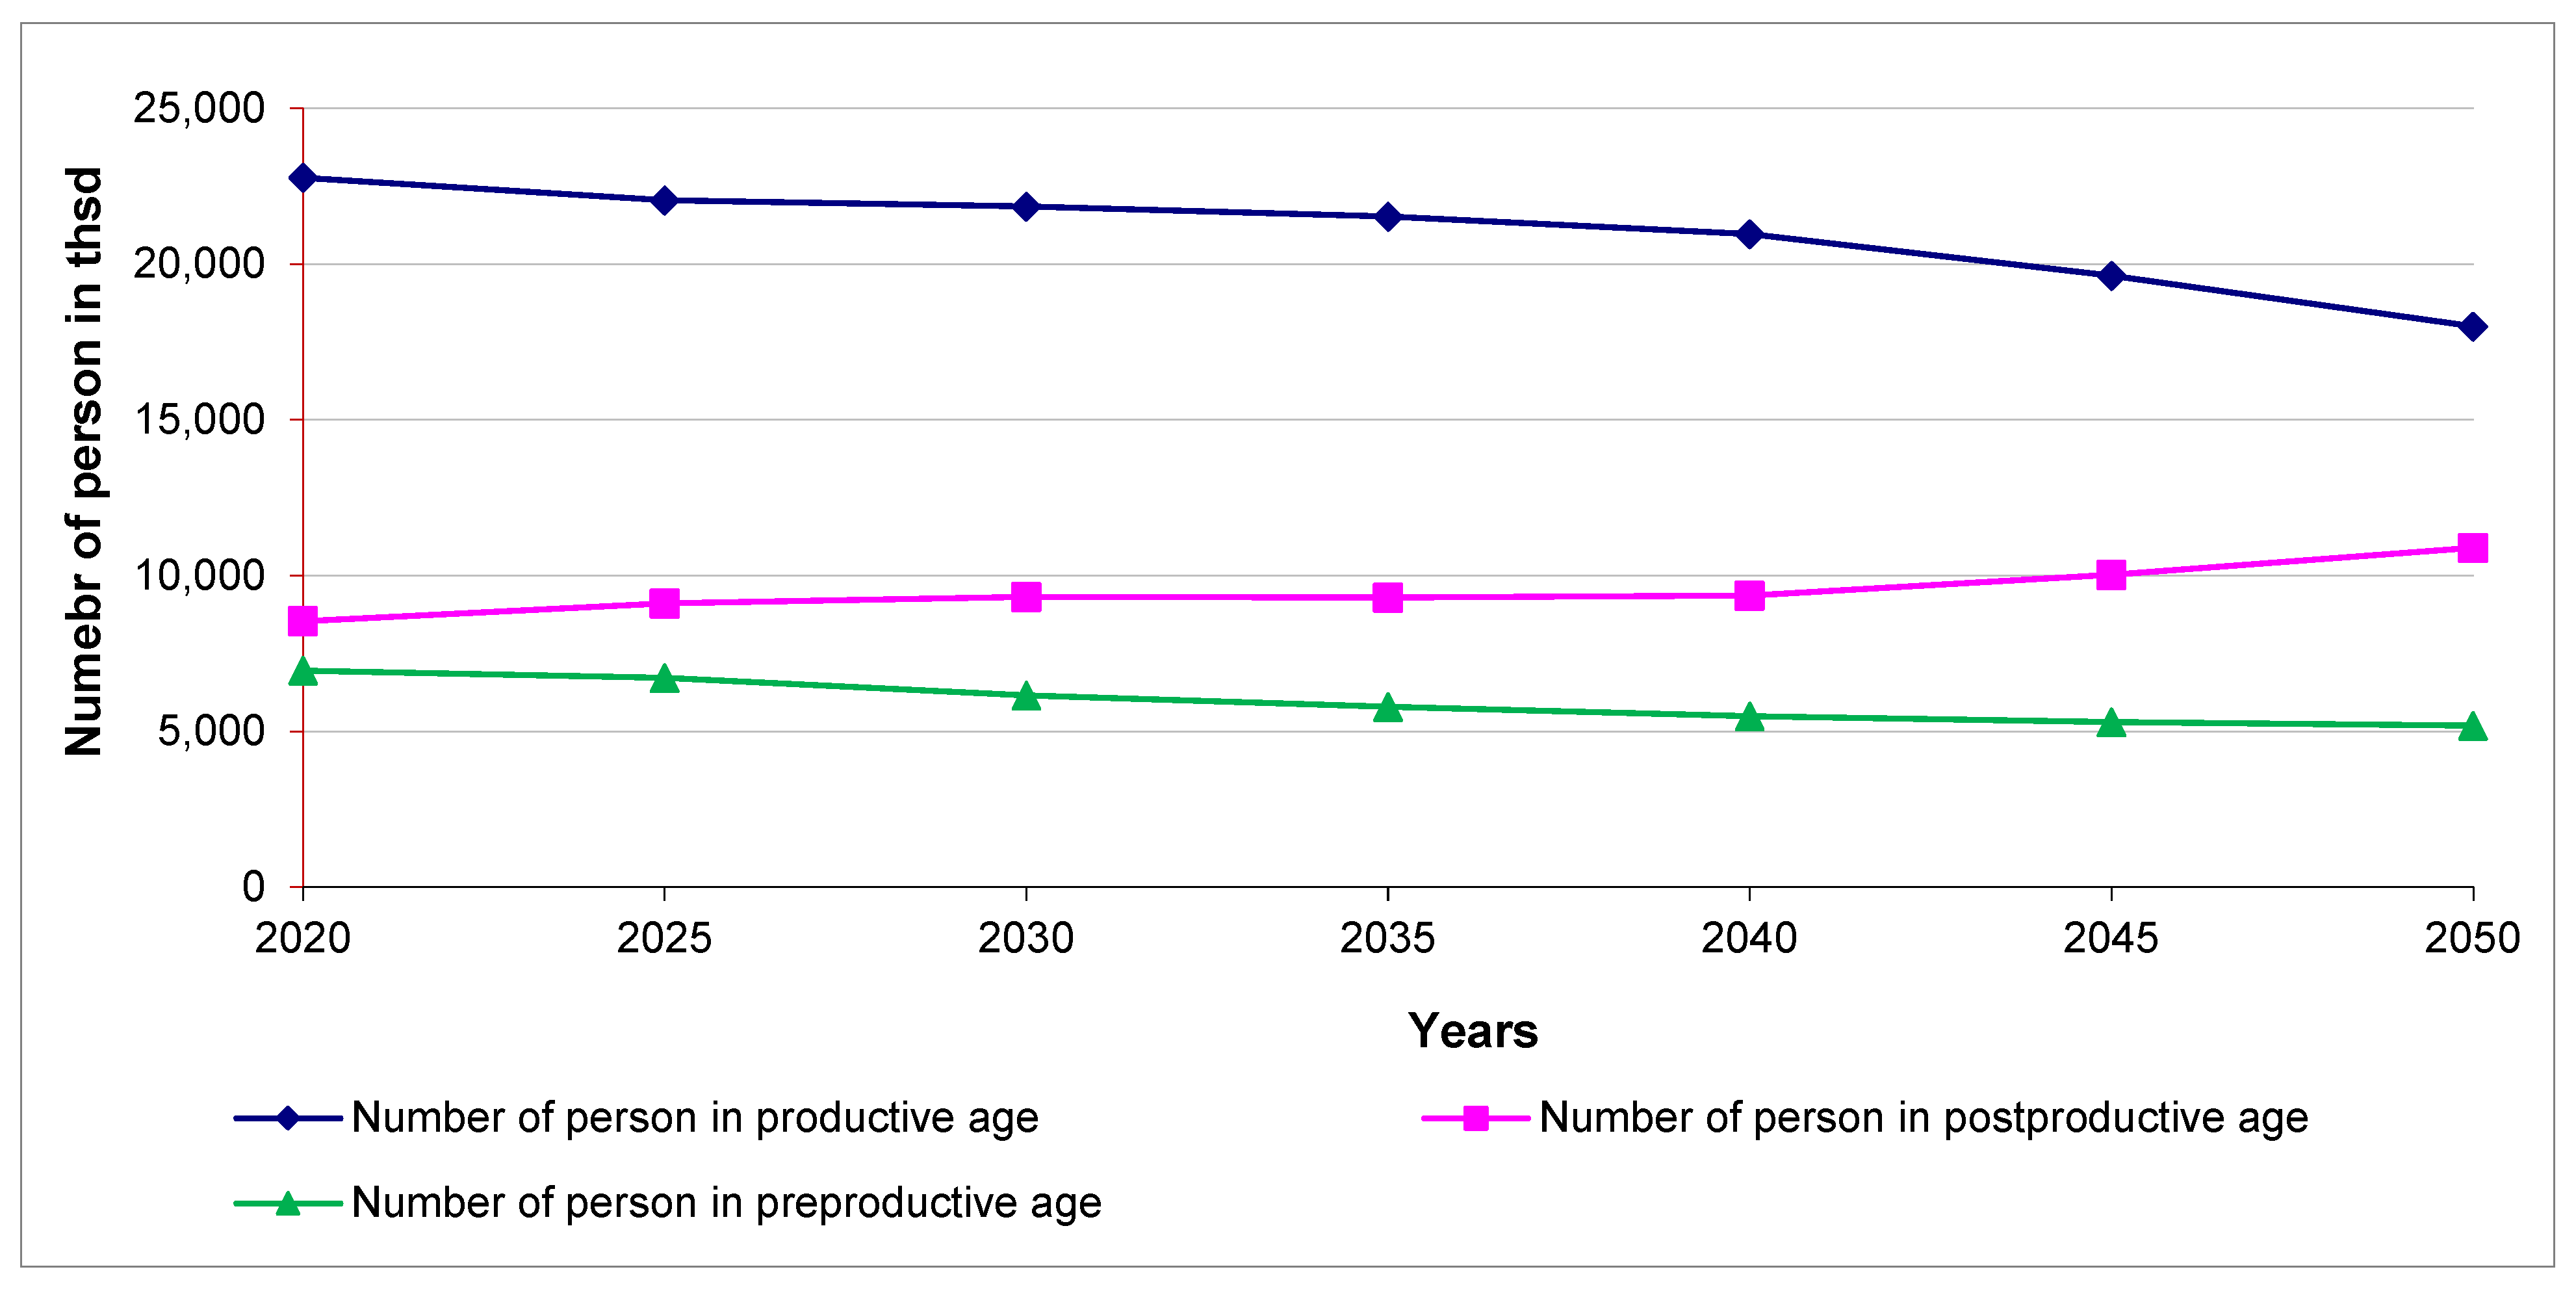
The Central Statistical Office forecast of changes in the population status by economic age groups for 2014–2050 years confirms this very disturbing trend (see
Figure 6). According to the forecasts of the Central Statistical Office, by 2050, the total population in Poland will decrease by approximately 11% and will amount to approximately 34 million. This unfavorable tendency will be accompanied by changes in the population structure due to economic age groups. By 2050, the working-age population will decrease by approximately 20%. A similar situation will take place in the case of people of pre-productive age (a decrease by about 25%). On the other hand, a significant increase will take place in the group of people of post-productive age (an increase by 28%).
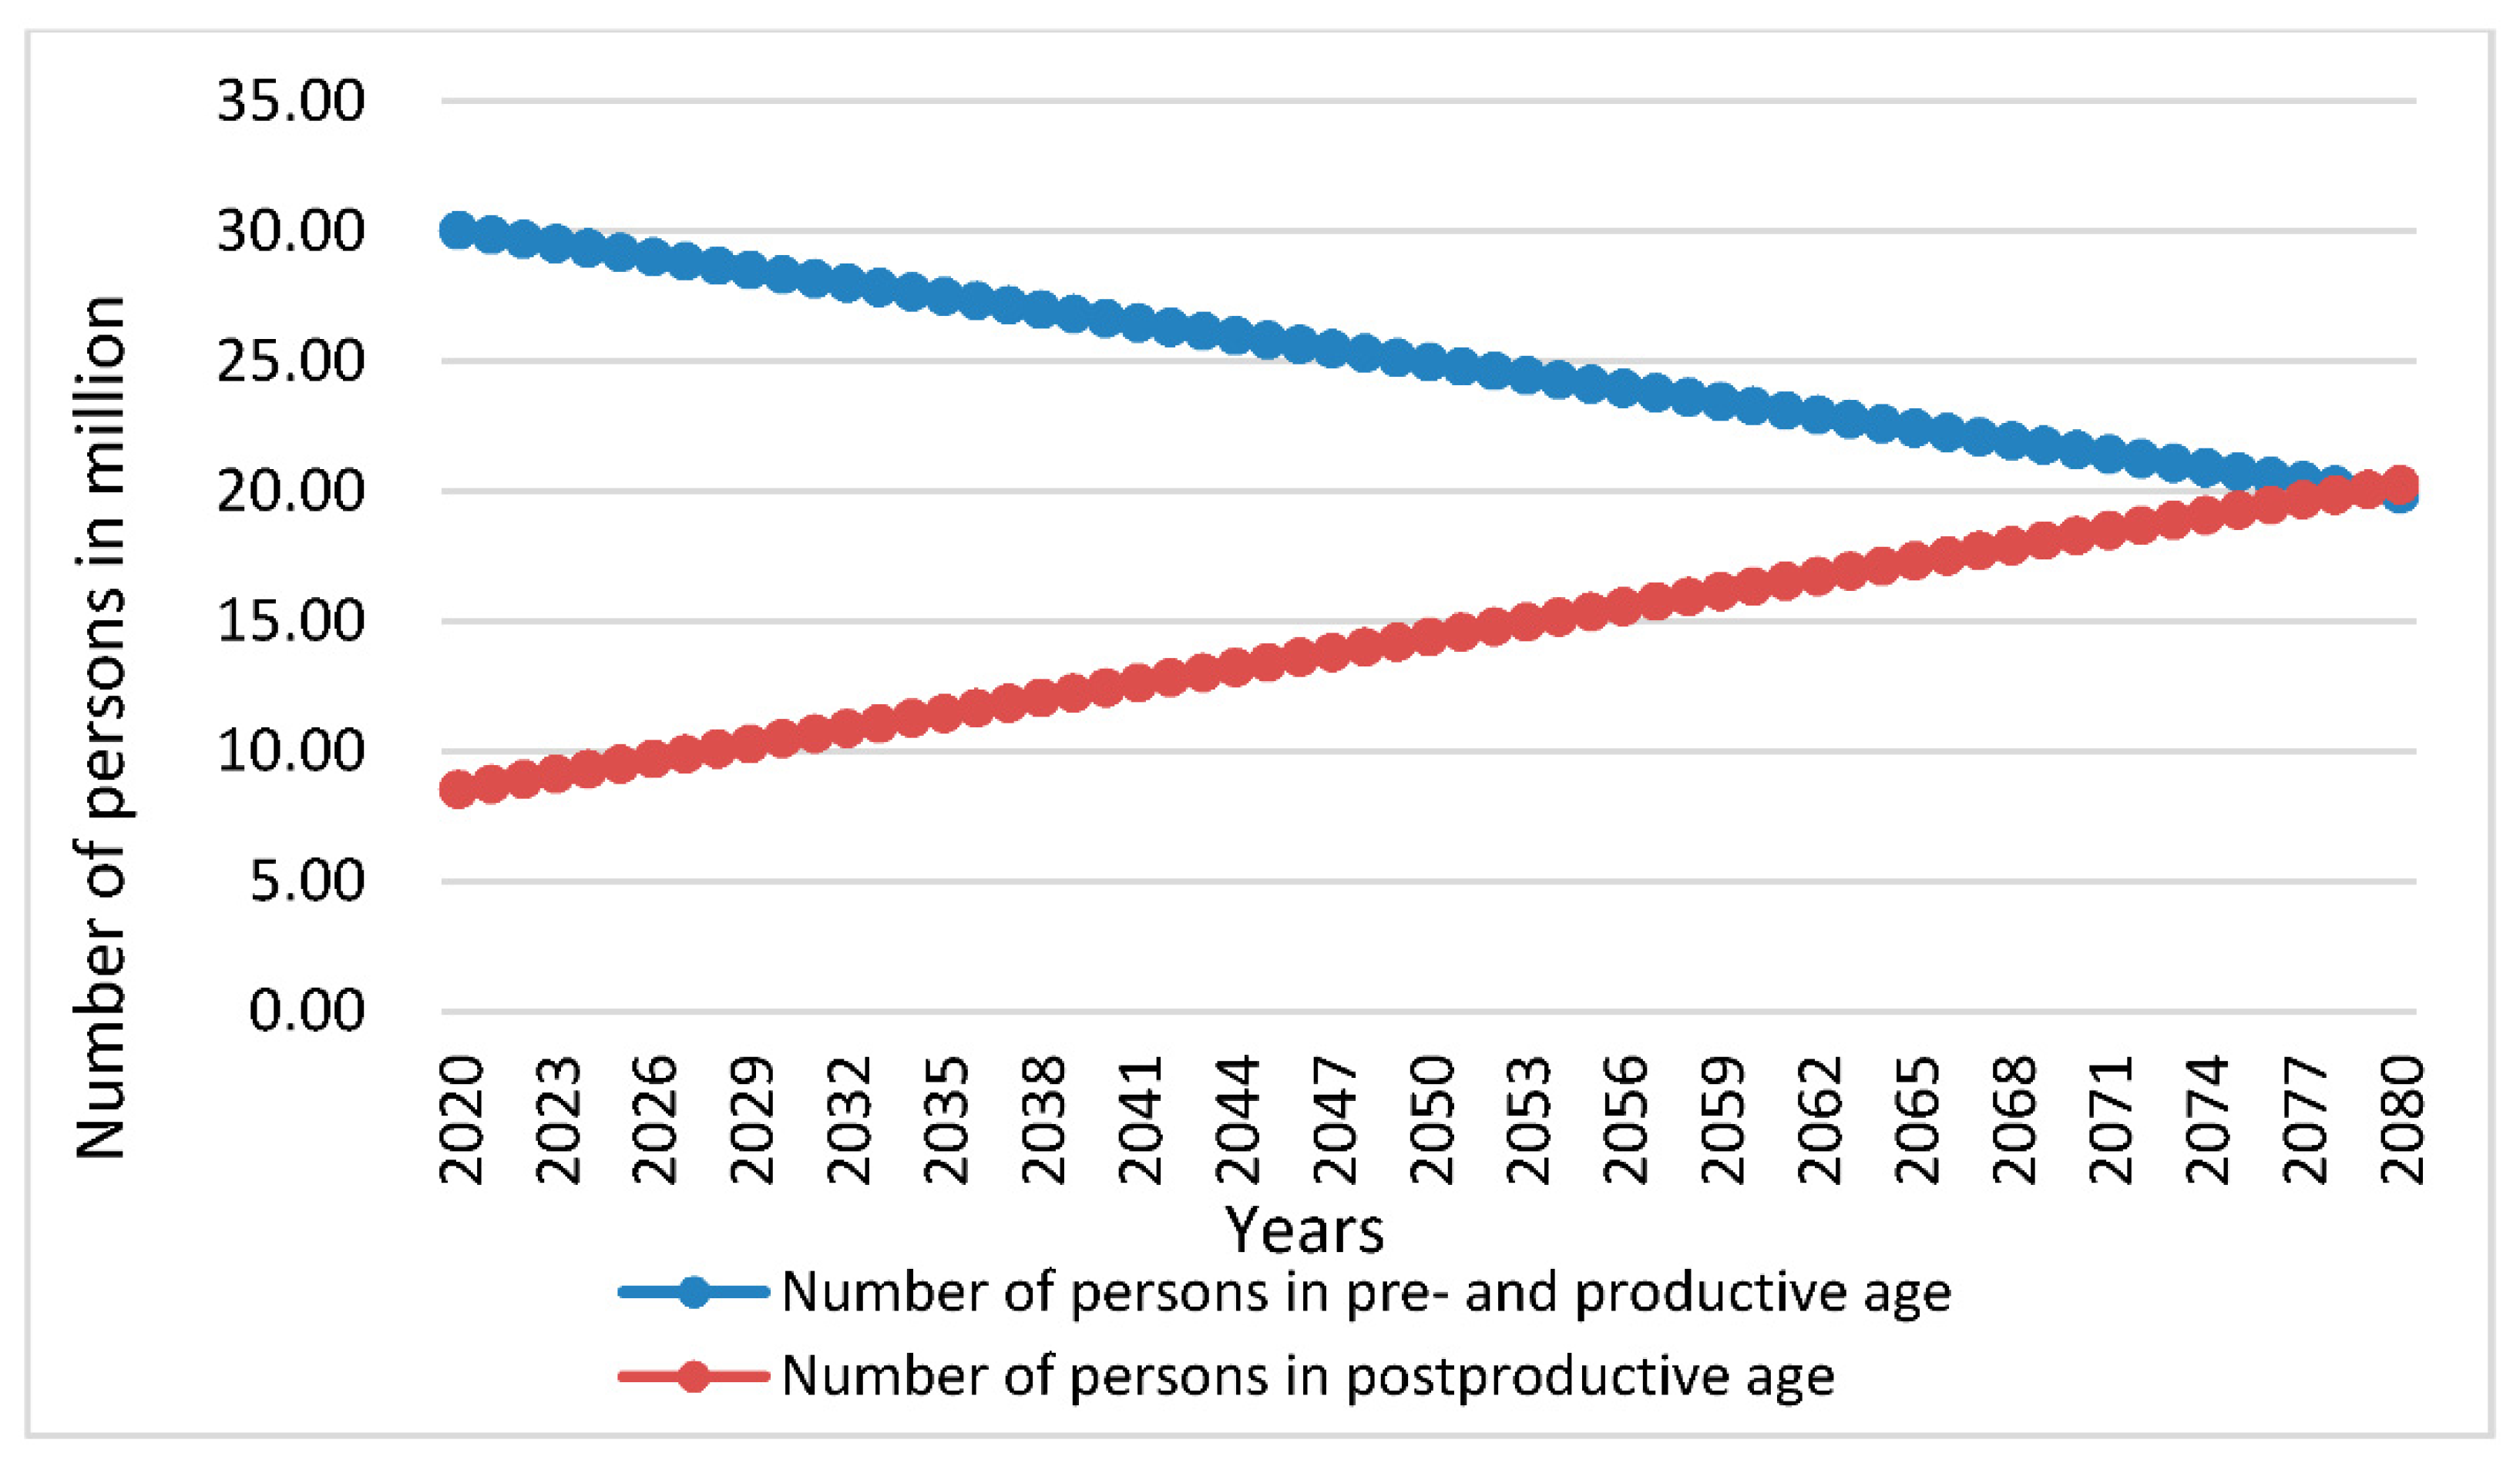
According to the prepared forecasts (see
Figure 7), it seems that an age (generation) gap
2 is growing (see
Table 3). It seems that the number of people of pre- and in productive age will become equal to the number of people of post-productive age about 2080 year. This prognosis is similar to the one of contributions and withdrawals from the pension system.
It must be stressed that the COVID-19 situation was not included in this calculation, which potentially can have an impact on predictions. Moreover, life expectancy can have an impact, but in fact, this factor can cause an even deeper age gap.
5. Conclusions
Like it was described in previous chapters, Polish pensioners receive their pensions only thanks to the inflows from people who are currently working. Including demographic tendencies observed in the last few years, it is impossible to sustain an undisturbed flow of payments in a long period of time. Within the pay-as-you-go system, money is collected from regular payments from working individuals to pay off liabilities to pensioners. These people are participants while the state is the initiator. It is only its permission that guarantees the functioning of the pension insurance system and law obligation that forces people to pay contributions. Otherwise, people probably would resign from participating in such system and chose more profitable ways of collecting money for retirement. In fact, only this element—obligatory participation—sustains the system active. Probably, if workers could choose, they would not be interested in paying money for other’s benefits with a very dubious promise of being paid in the future by younger participants of the society.
Going back to the hypotheses stated at the beginning, it can be concluded that the Polish pension insurance system has not 50, but about 60 years to last in such form. Statistical analysis confirmed that the Polish pension insurance system’s existence is endangered by the demographic situation, and thus, the state reforms it to sustain its functioning. However, it cannot be done indefinitely. At some point, the number of people who are able to pay will become smaller than those that should receive money from such a system. In the Polish case, it would be about 2080. Changing the contributions ratio can improve the effectiveness of the system. According to the predictions, an increase of the contributions to the level of 33% of average salary can ensure the effectiveness of the system by 2077.
Maybe the issue of social security systems is not very original and revealing, but in times of negative demographic trends (mainly within developed countries), it becomes more and more pressing to make these systems sustainable. The provided conclusions are very important for the development of the overall pension insurance system, which should be less focused on the repartition pillar and more on the capital one, within which people are more responsible for their own future pension. All the more when it is confirmed (
Chorkowy and Maciejasz-Świątkiewicz 2018) that future Polish pensioners rely mainly on potential public pensions, believing that “someone else (“state” as an incarnation of the Santa Clause) will be responsible for the consumption of pensioners” (
Czapiński and Góra 2016). This makes the whole issue even more pernicious. To answer the starting question, if this system is really a vehicle of economic and social development or rather retrograde, it can be concluded that in its current form, it is rather the second. Finally, it must be stressed that this is a very important topic, and still, it is necessary to conduct a deeper, continuous, and more comprehensive analysis in the near future.
Author Contributions
Conceptualization, M.M. and B.C.; methodology, B.C.; software, B.C.; validation, M.M. and B.C.; formal analysis, M.M. and B.C.; investigation, M.M. and B.C.; resources, M.M. and B.C.; data curation, M.M. and B.C.; writing—original draft preparation, M.M. and B.C.; writing—review and editing, M.M.; visualization, M.M. and B.C. All authors have read and agreed to the published version of the manuscript.
Funding
This research received no external funding.
Institutional Review Board Statement
Not applicable.
Informed Consent Statement
Not applicable.
Data Availability Statement
Not applicable.
Conflicts of Interest
The authors declare no conflict of interest.
Notes
| 1 | Social Insurance Fund consists of: Pension Fund, Disability Fund, Sickness Fund and Accident Fund. |
| 2 | Age (generation) gap—the ratio consists of people of pre- age and working age to the number of people of post-working age. It shows the potential of replacing people of post-working age by people of working and pre-working age, and thus the possibility of generating income and contributions to cover pensions (withdrawals). |
References
Primary Source
Ustawa z Dnia 5 marca 2015 r. o Zmianie Ustawy o Emeryturach i Rentach z Funduszu Ubezpieczeń Społecznych (Dz. U. 2015, pos. 552).
Secondary Source
- Bińczycka-Majewska, Teresa. 2014. Powszechność System Ubezpieczeń Społecznych—Teoria i Praktyka. In Systemy Ubezpieczeń Społecznych—Między Solidaryzmem a Indywidualizmem. Lublin: KUL, Warszawa: ZUS. [Google Scholar]
- Central Statistical Office. 2014. Population Projection 2014–2050. Warszawa: Central Statistical Office. [Google Scholar]
- Central Statistical Office. 2021. Demographic Situation of Poland. Warszawa: Central Statistical Office. [Google Scholar]
- Chorkowy, Bartosz, and Marta Maciejasz-Świątkiewicz. 2018. Retirement awareness as a determinant of the choice of tools for collecting pension capital. In Contemporary Problems of Intergenerational Relations and Pension Systems: A Theoretical and Empirical Perspective. Edited by Filip Chybalski and Edyta Marcinkiewicz. Łódź: Uniwersytet Łódzki. [Google Scholar]
- Czapiński, Janusz, and Marek Góra. 2016. Świadomość „Emerytalna” Polaków. Raport z Badania Ilościowego. Warsaw: Publikacje Europejskiego Kongresu Finansowego. [Google Scholar]
- Jaworska, Katarzyna. 2016. Główne cechy ubezpieczeń społecznych. In Prawo Ubezpieczeń Społecznych. Wybrane Problemy. Edited by Małgorzata Czuryk and Kamila Naumowicz. Olsztyn: UWM. [Google Scholar]
- Kapoor, Jack R., Les R. Dlabay, and Robert J. Hughes. 2007. Personal Finance. Boston: McGraw-Hill/Irwin. [Google Scholar]
- Kostrzewa, Piotr. 2019. Ubezpieczenia Społeczne w Praktyce. Warszawa: Wolters Kluwer. [Google Scholar]
- Nau, Robert. 2020. Statistical Forecasting: Notes on Regression and Time Series Analysis. Durham: Duke University. [Google Scholar]
- Szpor, Grażyna, and Wydawnictwo Prawnicze LexisNexis. 2013. System Ubezpieczeń Społecznych: Zagadnienia Podstawowe. Warszawa: Lexis Nexis. [Google Scholar]
| Publisher’s Note: MDPI stays neutral with regard to jurisdictional claims in published maps and institutional affiliations. |
© 2022 by the authors. Licensee MDPI, Basel, Switzerland. This article is an open access article distributed under the terms and conditions of the Creative Commons Attribution (CC BY) license (https://creativecommons.org/licenses/by/4.0/).


