
Stress Spillovers among Financial Markets: Evidence from Spain


Abstract
:1. Introduction
2. Econometric Methodology
2.1. Diebold and Yilmaz’s Connectedness
- Fit a reduced-form vector autoregressive (VAR) model to the series:where represents an N × 1 series vector at time t, is an N × Np dimensional coefficient matrix, and is an N × 1 dimensional error disturbance vector with an N × N variance–covariance matrix,
- Using series data up to and including time t, establish an H period-ahead forecast (up to time t + H).
- Decompose the error variance of the forecast for each component with respect to shocks from the same or other components at time t.
2.2. Dynamic Connectedness Based on TVP-VAR
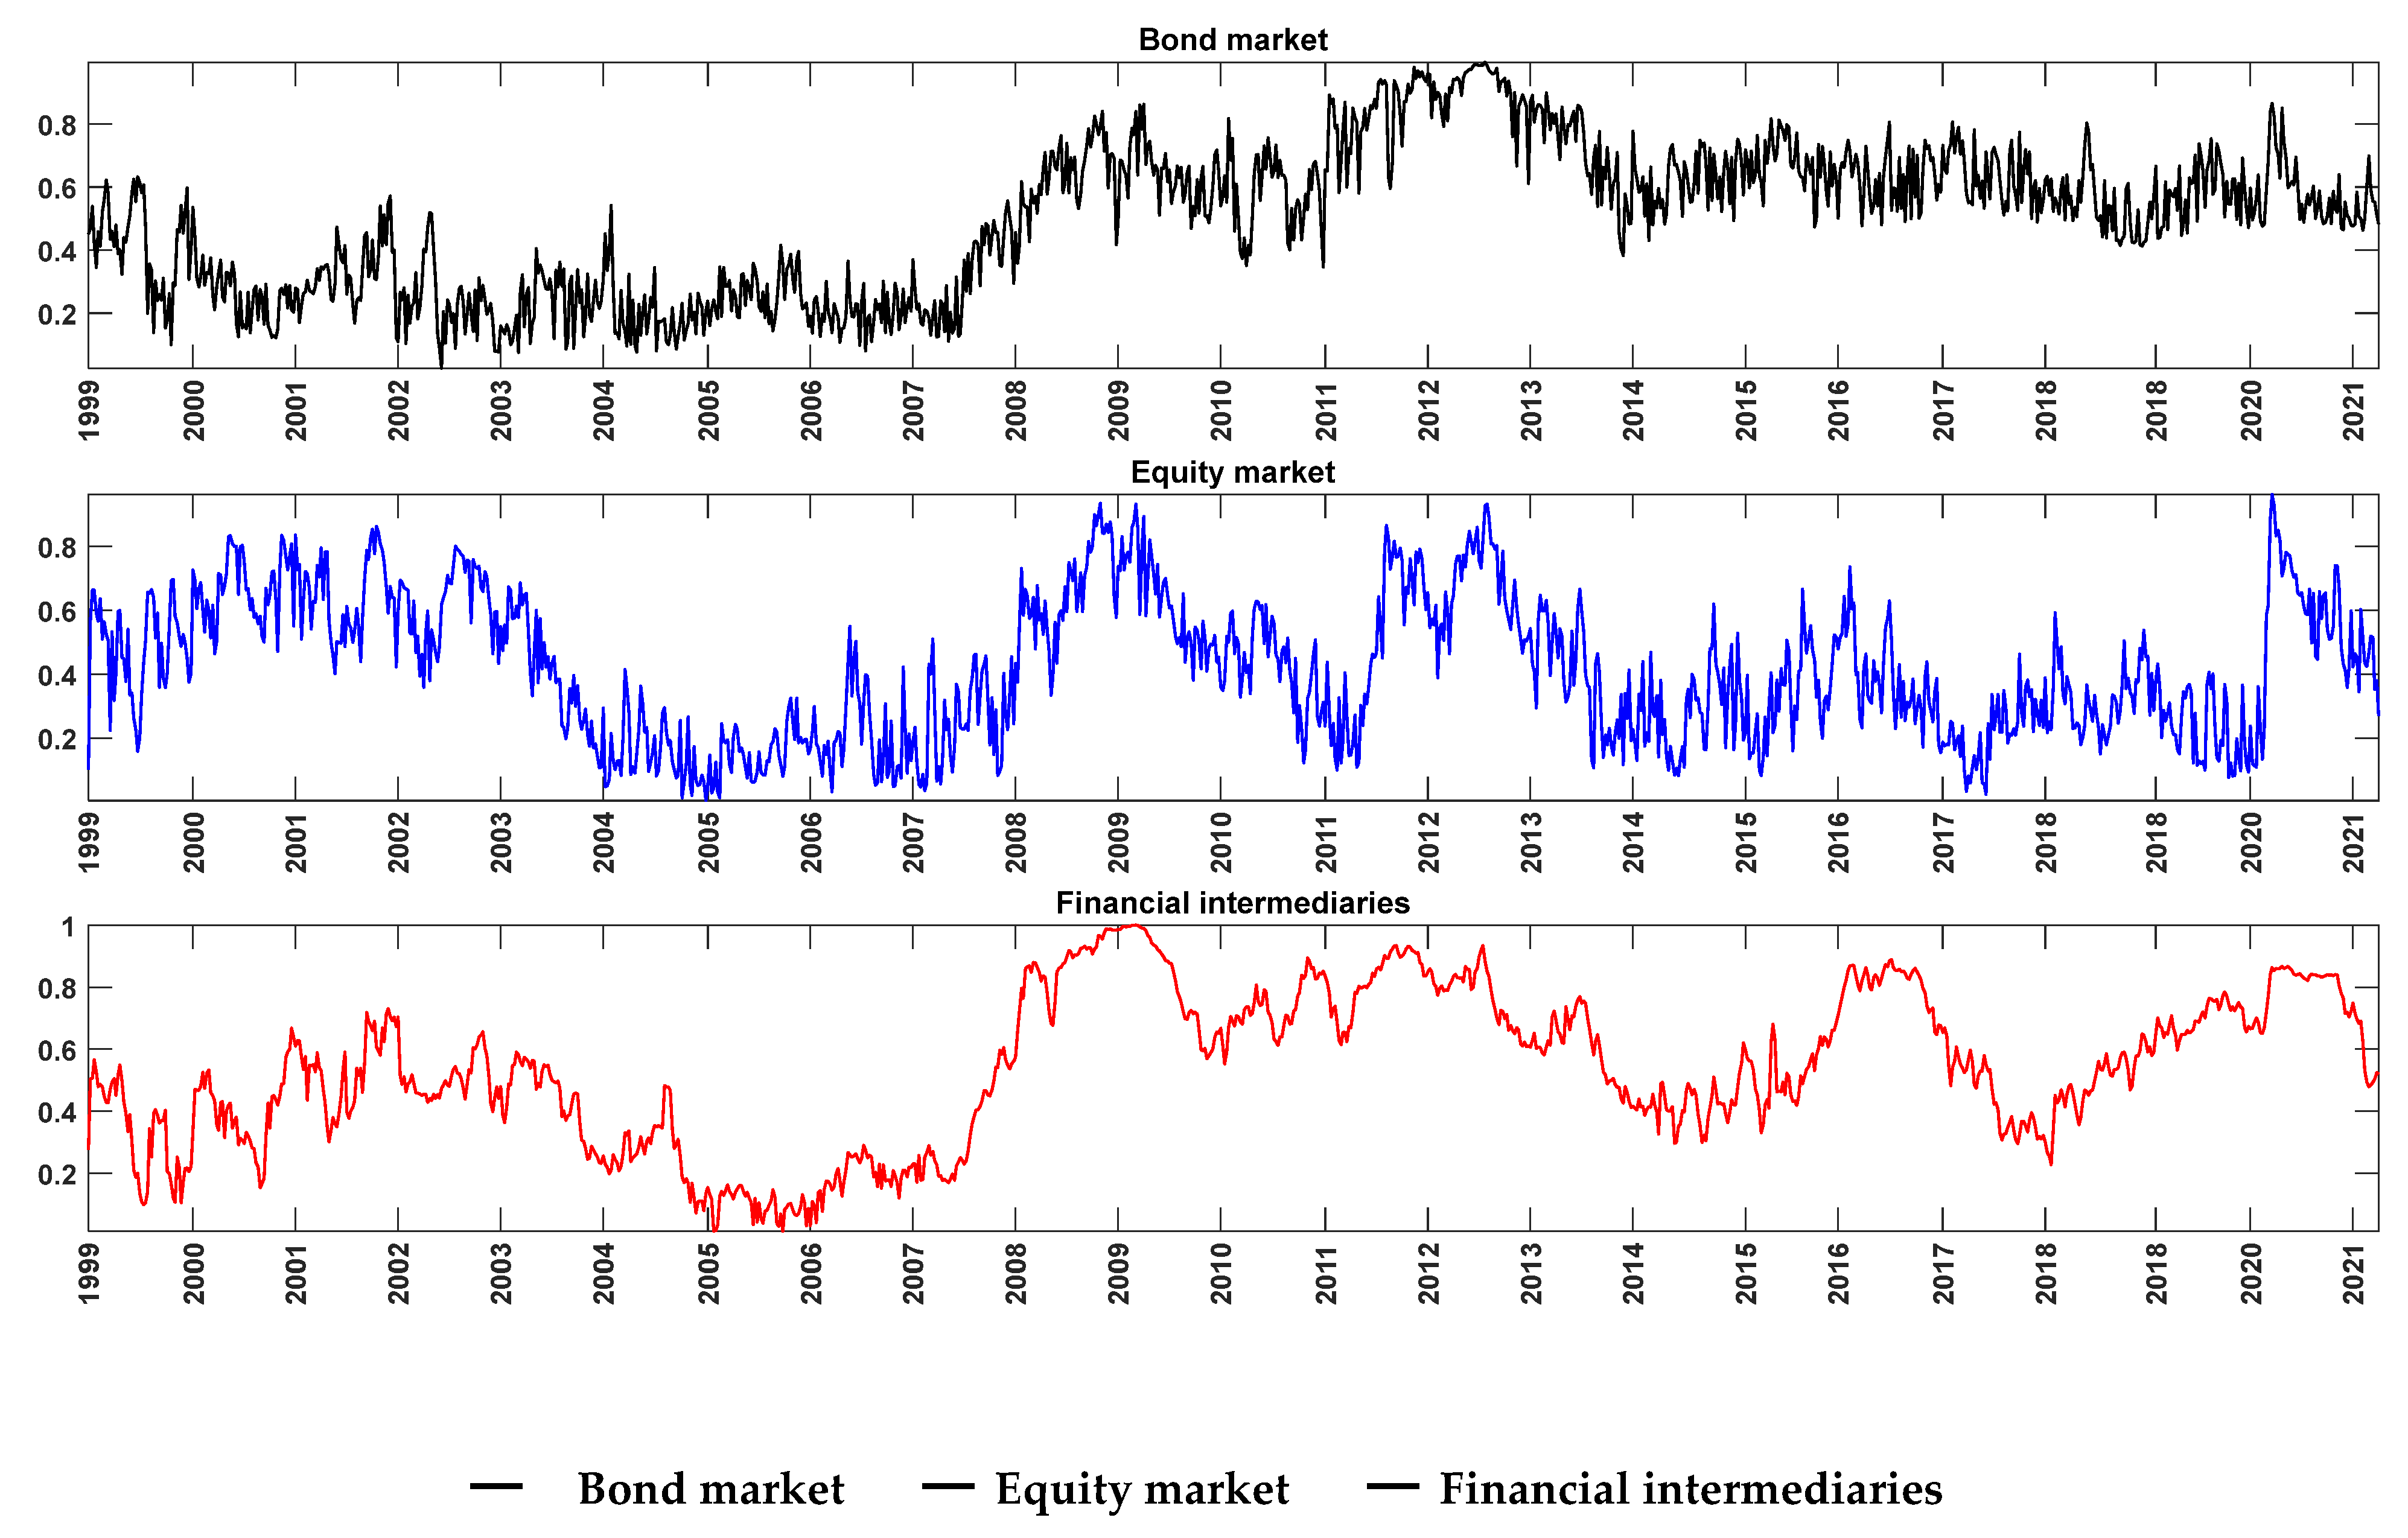
3. Data and Preliminary Analysis
- (i.)
- The introduction of euro changeover in the first months of 2002;
- (ii.)
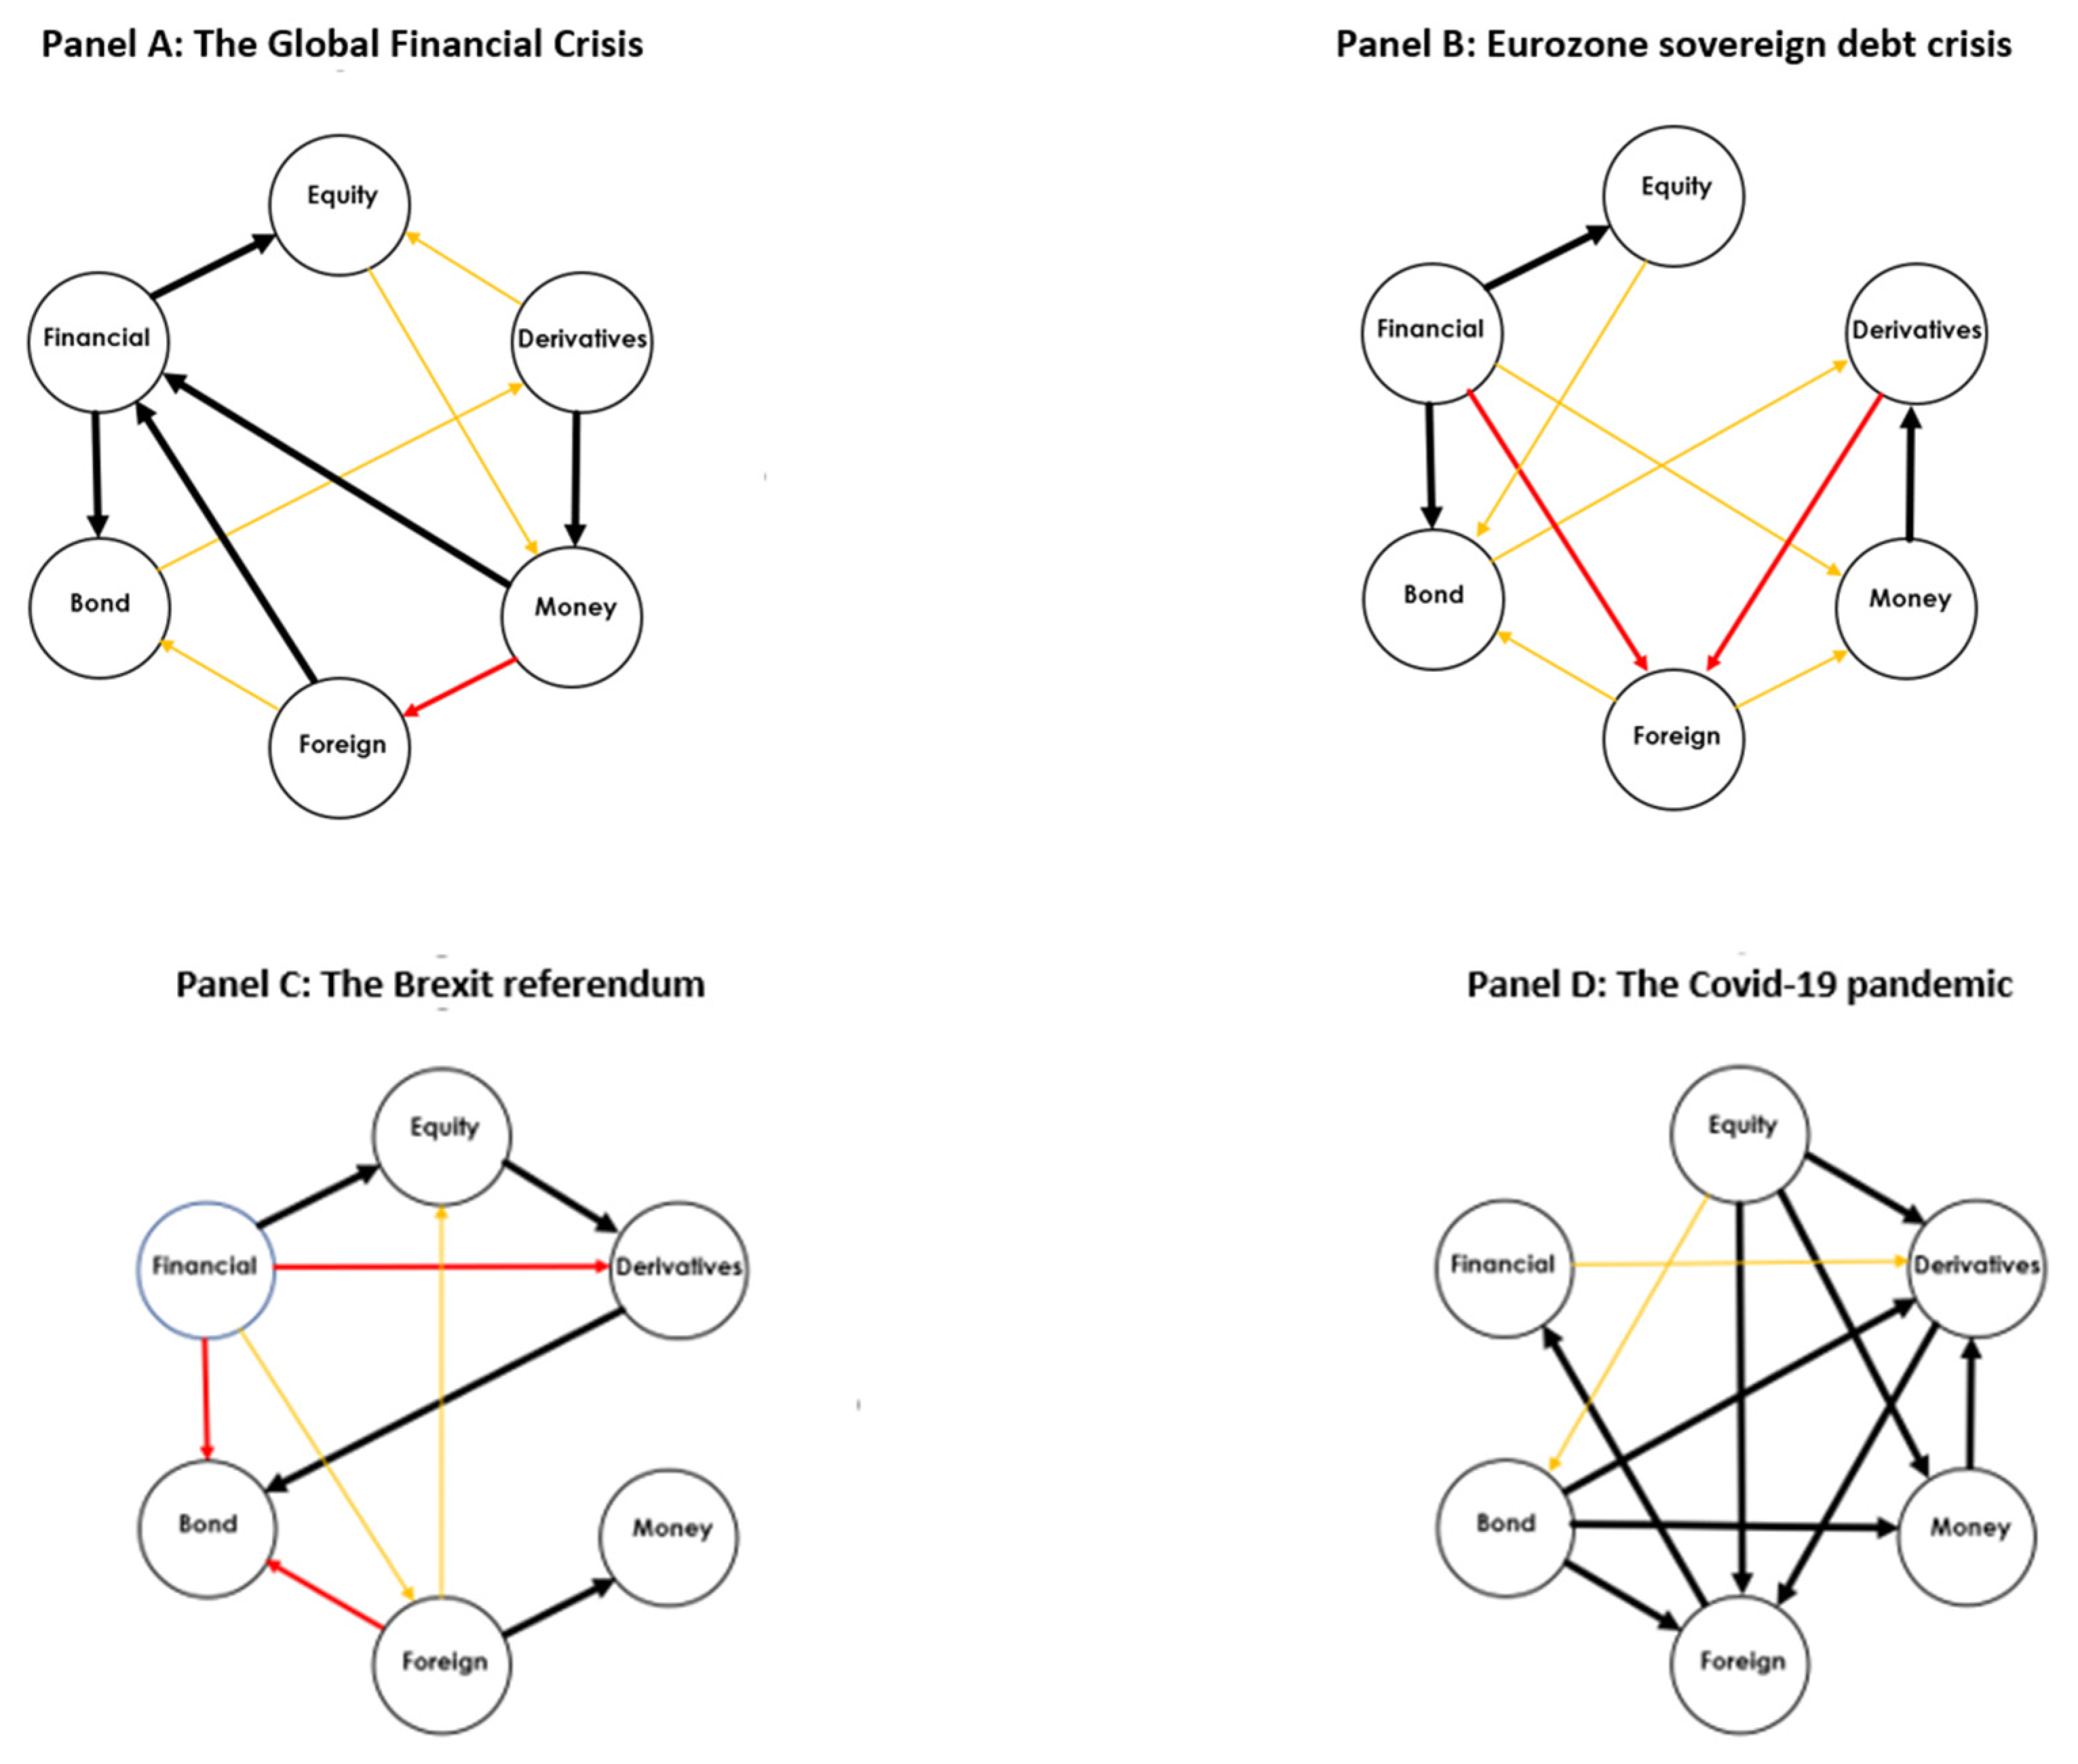
- The GFC of 2007–2008;
- (iii.)
- The EA sovereign debt crisis and signing of the EA fiscal compact in March 2012;
- (iv.)
- The global financial turmoil after the UK voted to leave the European Union (a.k.a. Brexit) in June 2016;
- (v.)
- The outbreak of the COVID-19 pandemic in 2020, requiring many countries to introduce measures restricting activity and movements.
4. Empirical Results
4.1. Static (Full-Sample, Unconditional) Analysis
4.2. Dynamic Total Connectedness Analysis
4.3. Determinants of the Dynamic Total Connectedness
4.4. Robustness
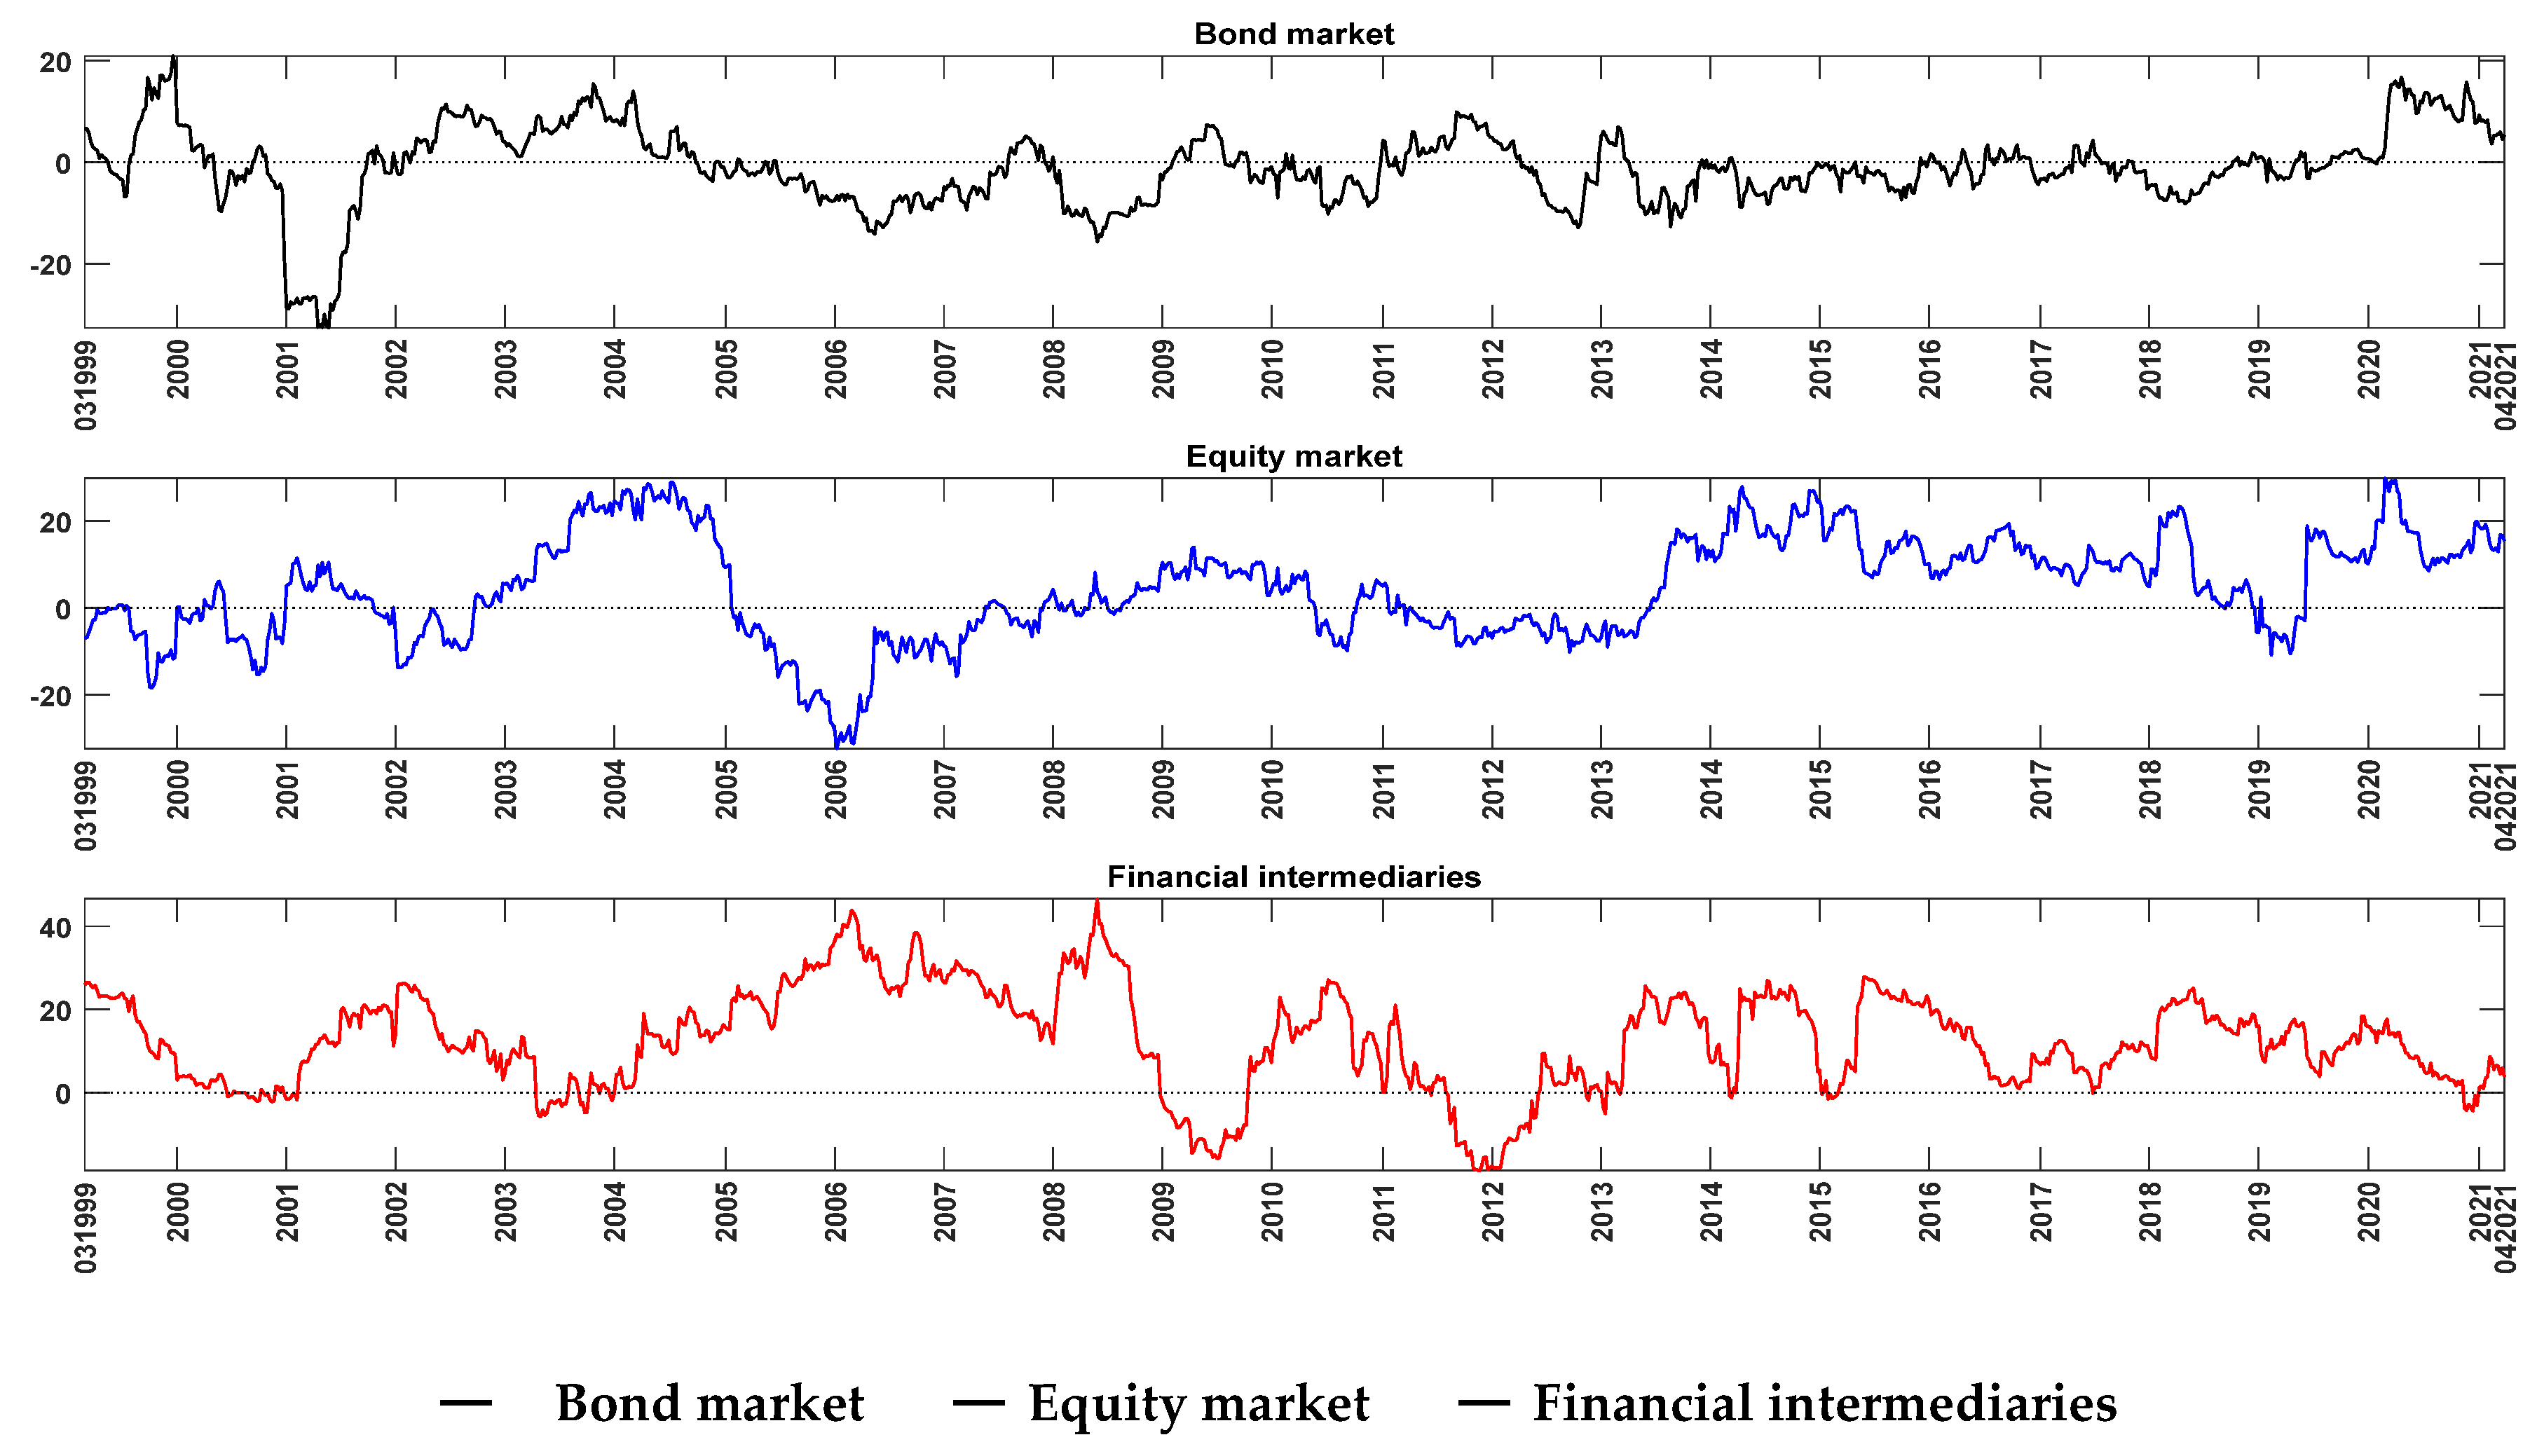
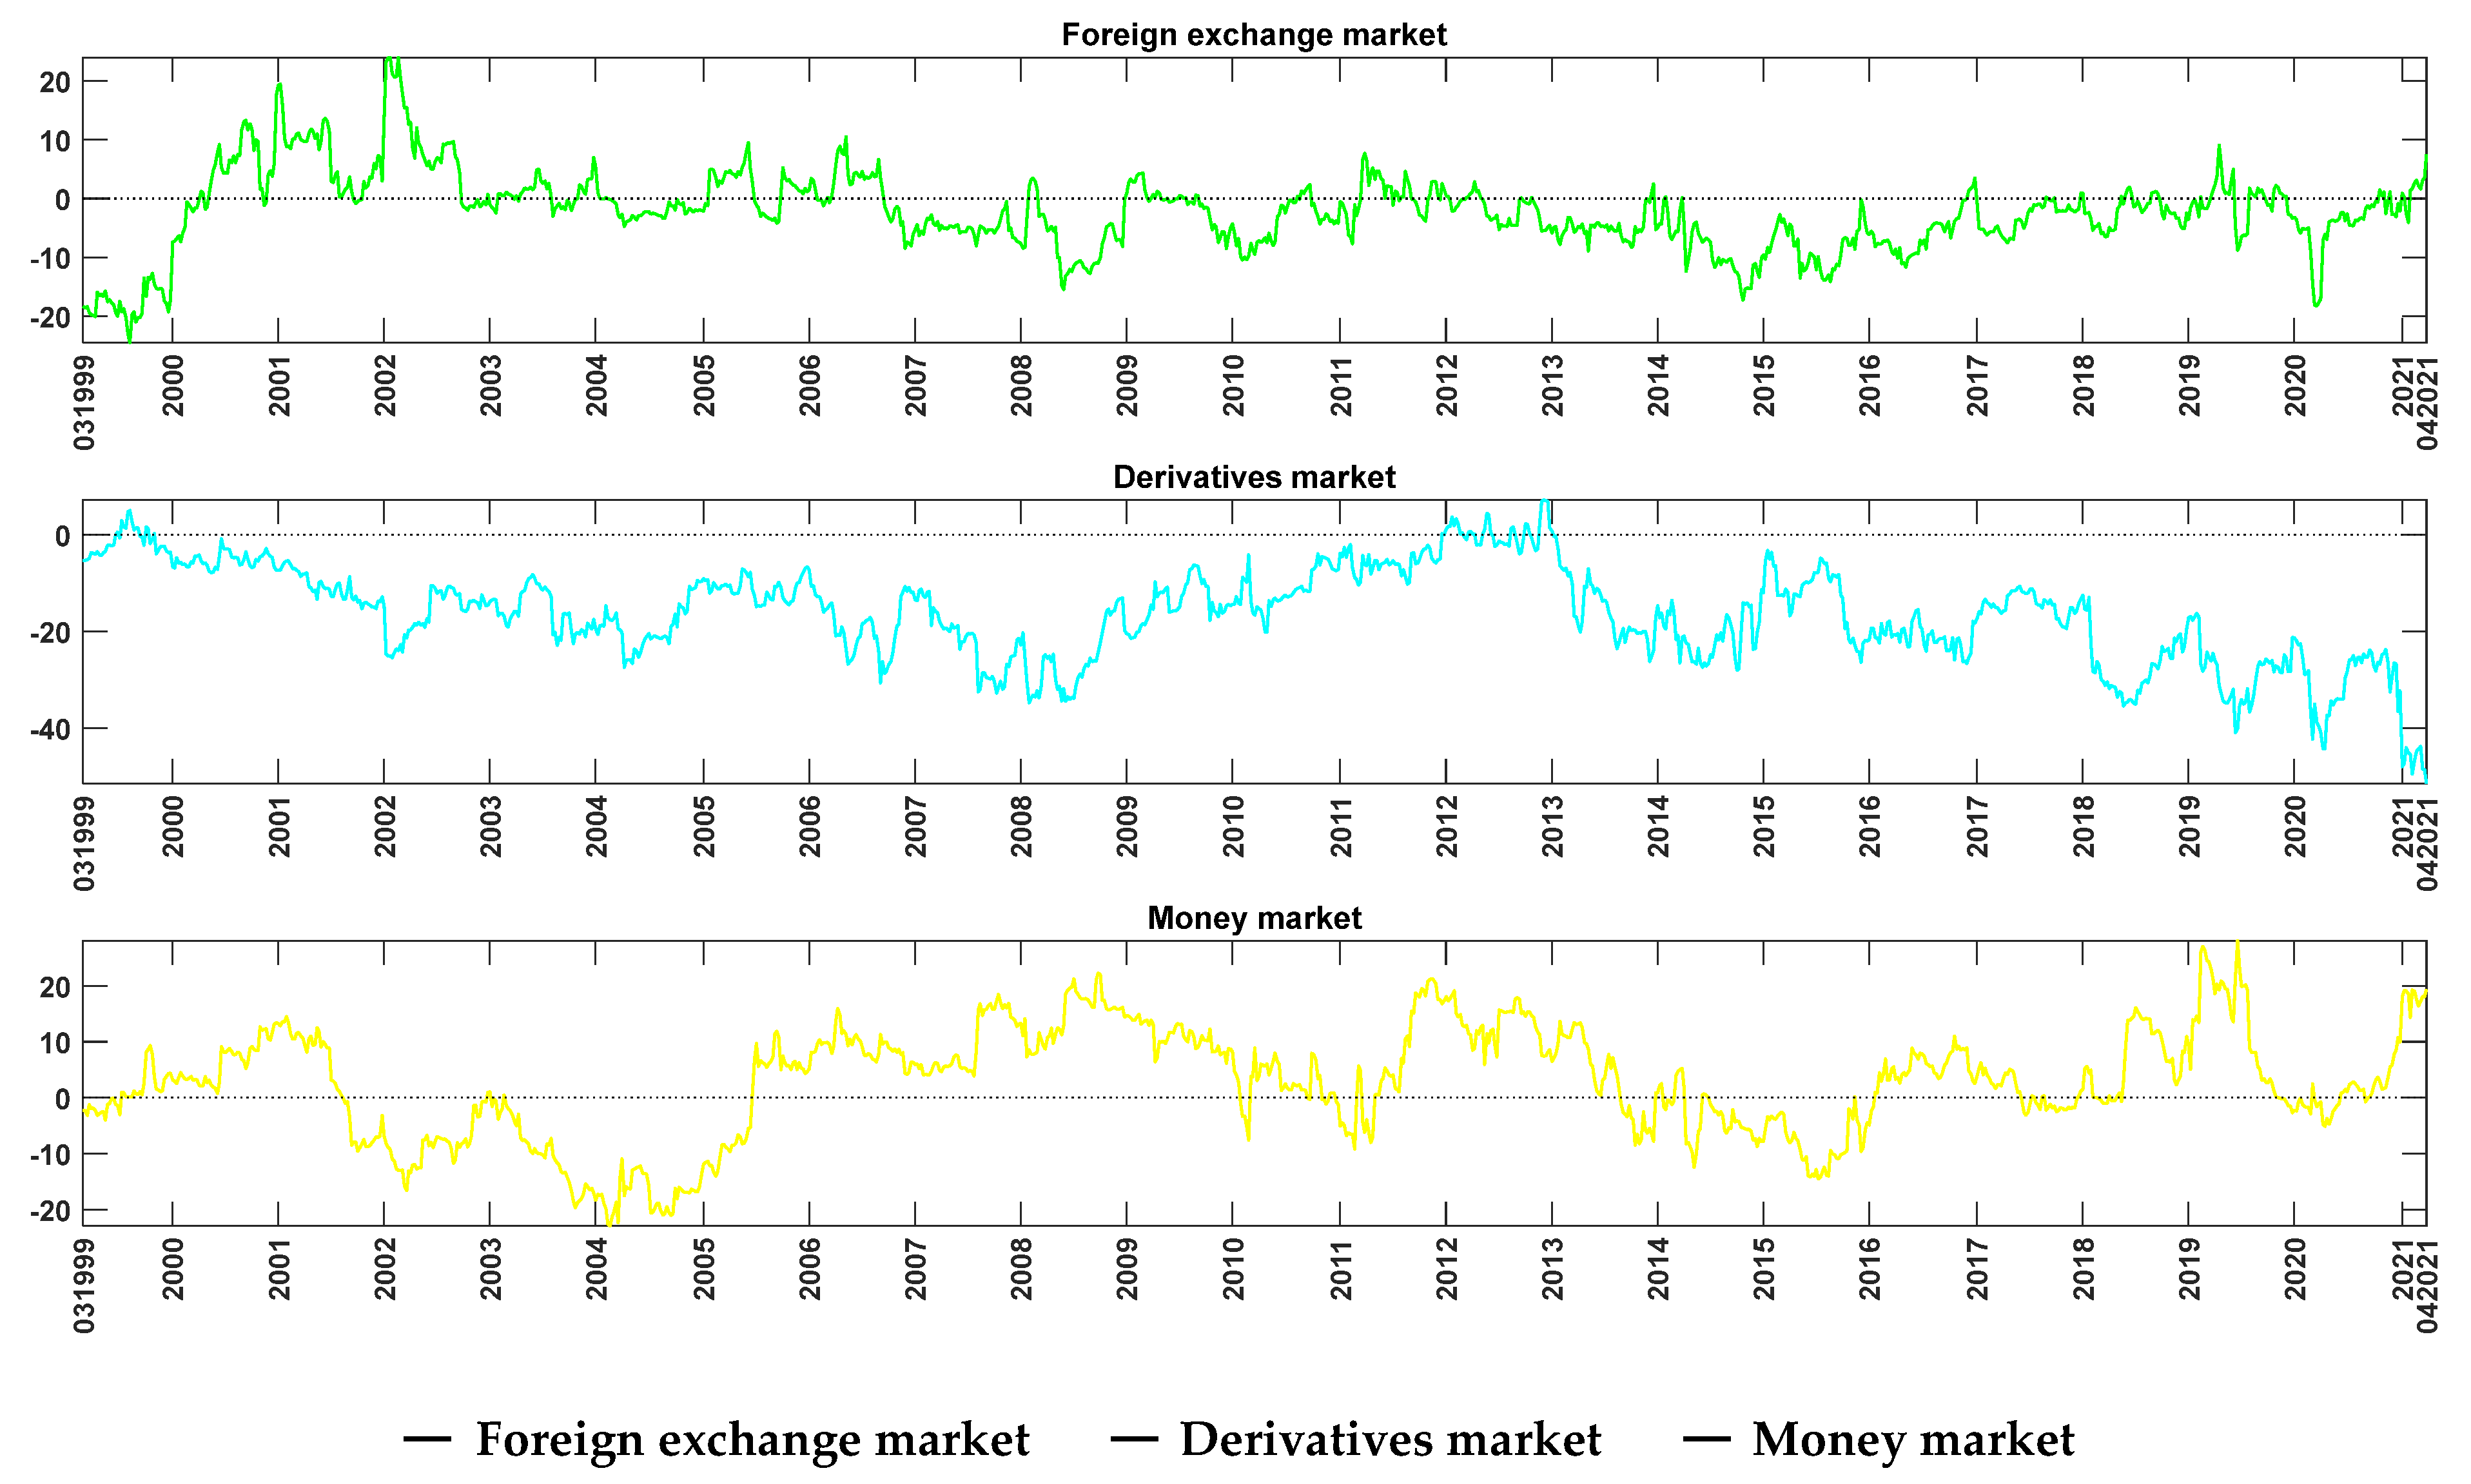
5. Net Directional Connectedness
5.1. Net Directional Stress Connectedness Plots
5.2. Dynamic Net Pairwise Directional Stress Connectedness Plots
6. Concluding Remarks
Author Contributions
Funding
Data Availability Statement
Acknowledgments
Conflicts of Interest
| 1 | |
| 2 | Note that the Diebold and Yilmaz (2014)’s approach assumes a linear relationship between the variables under study. An alternative approach would be to consider non-linear relationships, but Granger (2008) argues that economic interpretations of non-linear models are difficult. Furthermore, based on the White’s theorem, Granger (2008) shows that any non-linear model can be approximated by a time-varying parameter (TVP) linear model. In the spirit of the family of models described in Granger (2008), we complement our analysis by applying the dynamic connectedness procedure based on the TVP-VAR proposed by Antonakakis et al. (2018) that renders both an optimal approximation of general non-linear processes and more readily interpretable results. |
| 3 | Following Koop and Korobilis (2014), we use the same non-informative initial conditions in the Kalman filter, a decay factor of 0.96, and a forgetting factor of 0.99 (see online Appendix in Koop and Korobilis 2014, for the technical details). Without loss of generality, we normalise the series to get a faster and smoother convergence in the Kalman filter. This normalisation does not have any effect on the connectedness matrix. |
| 4 | All results are based on a VAR model of order 2 and generalised variance decompositions of 10-week-ahead forecast error. To check for the sensitivity of the results to the choice of the order of VAR, we also calculate the spillover index for orders 2 through 4, as well as for forecast horizons ranging from 4 weeks to 10 weeks. The main results of our paper are not affected by these choices. Detailed results are available from the authors upon request. |
| 5 | We are grateful to two anonymous referees for suggesting this exploratory analysis. |
| 6 | The WUI is computed by counting the percent of word “uncertain” (or its variant) in the Economist Intelligence Unit country reports [see https://worlduncertaintyindex.com/data/] (accessed on 14 October 2021). |
| 7 | The World Pandemic Uncertainty Index (WPUI) measures uncertainty related to pandemics across the globe [see https://worlduncertaintyindex.com/data/] (accessed on 14 October 2021). The Pearson correlation between the WPUI Global and the WPUI-Spain is high (0.93), and therefore, we decide to use only the Spain’s component to avoid multicollinearity issues in the regressions. We also consider the number of COVID-19 cases in Spain, Europe and worldwide using data from European Centre for Disease Prevention and Control, but these series were highly correlated with WPUI-Spain. |
| 8 | This measure is constructed by counting the number of U.S. newspaper articles achieved by the NewsBank Access World News database with at least one term from each of the following three categories: (i) “economic” or “economy”; (ii) “uncertain” or “uncertainty”; and (iii) “legislation,” “deficit,” “regulation,” “congress,” “Federal Reserve,” or “White House.” Baker et al. (2016) provide evidence that EPU captures perceived economic policy uncertainty. Ghirelli et al. (2019) replicate their results for Spain. See https://www.policyuncertainty.com/spain.html (accessed on 14 October 2021). |
| 9 | |
| 10 | A cubic spline curve is a mathematical representation of piecewise third-order polynomials passing through a set of k control points and subject to boundary conditions (De Boor 1978). This has been extensively used in the literature when the frequency of series do not match (see e.g., Bauwens and Hautsch 2009). |
| 11 | To that end we perform a variety of unit root tests. The results, which are not shown here in order to save space, are available from the authors upon request. |
| 12 | We are grateful to an anonymous referee for suggesting this robustness analysis. |
| 13 | See https://sdw.ecb.europa.eu/browseExplanation.do?node=9693347 (accessed on 14 October 2021). |
| 14 | The static connectedness table between the peripheral EA financial stress indices suggests that the stress of the Spanish financial markets is highly connected to those of the peripheral EA financial markets. Specifically, there are high gross pairwise directional connectedness from Spain to Italy (25.37%) and vice versa (20.36%), and from Spain to Portugal (19.41%) and vice versa (28.08%). These additional results are not shown here to save space, but they are available from the authors upon request. |
| 15 | To save space, the results of the decomposition of the dynamic net directional connectedness into their pairwise directional connectedness for each stress are not shown here, but they are available from the authors upon request. |
| 16 | We consider the period between the announcement by the French investment bank BNP Paribas that it was suspending three investment funds (9 August 2007) to the coordinated Central Bank actions taken to address pressures in global money markets (8 October 2008). |
| 17 | We consider the period of maximum turbulence in the Eurozone sovereign debt markets, covering the rescue packages not only in Greece (May 2010), but also in Ireland (November 2010) and Portugal (April 2011); Additionally, the ECB announced in August 2011 its second covered bond purchase programme. |
| 18 | We consider the period from the United Kingdom’s decision by referendum to leave the European Union (23 June 2016) to the announcement by Prime Minister Theresa May to trigger the EU’s Article 50—the mechanism to set the formal exit process in motion (2 October 2016). |
| 19 | By 13 March 2020, COVID-19 cases had been confirmed in all 50 Spanish provinces, and the next day the government declared a state of emergency, which ended on 21 June 2020, after three months of lockdown. The lockdown measures in Spain were among the strictest in Europe. |
| 20 | After severe pressure in European sovereign debt markets, in July 2012 Spain turned to the European Union for help to ensure the solvency of its banking sector, signing a Memorandum of Understanding that led to the implementation of a series of corrective, preventive, and proactive measures that were supervised and monitored until the end of 2015. |
References
- Antonakakis, Nikolaos, David Gabauer, Rangan Gupta, and Vasilios Plakandaras. 2018. Dynamic connectedness of uncertainty across developed economies: A time-varying approach. Economics Letters 166: 63–75. [Google Scholar] [CrossRef] [Green Version]
- Arsov, Ivalio, Elie Canetti, Laura Kodres, and Srobona Mitra. 2013. ‘Near-Coincident’ Indicators of Systemic Stress. Working Paper 13/115. Washington, DC: International Monetary Fund. [Google Scholar]
- Baele, Lieven, Geert Bekaert, Koen Ingelbrecth, and Min Wei. 2020. Flights to Safety. Review of Financial Studies 33: 689–746. [Google Scholar] [CrossRef]
- Baker, Scott, Nicholas Bloom, and Steven Davis. 2016. Measuring economic policy uncertainty. Quarterly Journal of Economics 131: 1593–636. [Google Scholar] [CrossRef]
- Bauwens, Luc, and Nikolaus Hautsch. 2009. Modelling Financial High Frequency Data Using Point Processes. Edited by Thomas Mikosch, Jens-Peter Kreiß, Richard Davis and Torben Gustav Andersen. Handbook of Financial Time Series; Berlin: Springer. [Google Scholar]
- Beirne, John, and Marcel Fratzscher. 2013. The pricing of sovereign risk and contagion during the European sovereign debt crisis. Journal of International Money and Finance 34: 60–82. [Google Scholar] [CrossRef] [Green Version]
- Belke, Ansgar, Irina Dubova, and Thomas Osowski. 2018. Policy uncertainty and international financial markets: The case of Brexit. Applied Economics 50: 3752–70. [Google Scholar] [CrossRef] [Green Version]
- Bloom, Nicholas, Philip Bunn, Scarlet Chen, Paul Mizen, Pawel Smietanka, Greg Thwaites, and Garry Young. 2018. Brexit and uncertainty: Insights fom the Decision Maker Panel. Fiscal Studies 39: 555–80. [Google Scholar] [CrossRef]
- Caldarelli, Roberto, Selim Elekdag, and Subir Lall. 2011. Financial stress and economic contractions. Journal of Financial Stability 7: 78–97. [Google Scholar] [CrossRef]
- Carbó-Valverde, Santiago, and Francisco Rodríguez-Fernández. 2017. Outlook for the Spanish financial sector ahead of Brexit. Spanish and International Economic and Financial Outlook 6: 53–61. [Google Scholar]
- Chen, Xiaoyu, and Thomas Chiang. 2020. Empirical investigation of changes in policy uncertainty on stock returns: Evidence from China’s market. Research in International Business and Finance 53: 101183. [Google Scholar] [CrossRef]
- Cogley, Thimoty, and Thomas Sargent. 2005. Drifts and volatilities: Monetary policies and outcomes in the post WWII US. Review of Economic Dynamics 8: 262–302. [Google Scholar] [CrossRef] [Green Version]
- De Boor, Carl. 1978. A Practical Guide to Splines. New York: Springer. [Google Scholar]
- Diebold, Francis Xavier, and Kamil Yilmaz. 2012. Better to give than to receive: Predictive directional measurement of volatility spillovers. International Journal of Forecasting 28: 57–66. [Google Scholar] [CrossRef] [Green Version]
- Diebold, Francis Xavier, and Kamil Yilmaz. 2014. On the network topology of variance decompositions: Measuring the connectedness of financial firms. Journal of Econometrics 182: 119–34. [Google Scholar] [CrossRef] [Green Version]
- Gabauer, David, and Rangan Gupta. 2018. On the transmission mechanism of country specific and international economic uncertainty spillovers: Evidence from TVP-VAR connectedness decomposition approach. Economics Letters 171: 63–71. [Google Scholar] [CrossRef] [Green Version]
- Ghirelli, Corinna, Javier Perez, and Alberto Urtasun. 2019. A new economic policy uncertainty index for Spain. Economic Letters 182: 64–67. [Google Scholar] [CrossRef] [Green Version]
- Gomes, Francisco, Laurence Kotlikoff, and Luis Viceira. 2012. The excess burden of government indecision. Tax Policy and the Economy 26: 125–64. [Google Scholar] [CrossRef] [Green Version]
- Gomez-Puig, Marta, Manish Singh, and Simón Sosvilla-Rivero. 2019. The sovereign-bank nexus in peripheral euro area: Further evidence from contingent claims analysis. North American Journal of Economics and Finance 49: 1–46. [Google Scholar] [CrossRef]
- Granger, Clive William John. 2008. Non-linear models: Where do we go next—Time varying parameter models? Studies in Nonlinear Dynamics and Econometric 12: 1639. [Google Scholar] [CrossRef]
- Hernández de Cos, Pablo. 2019. The Spanish banking system: Transformations and challenges. Paper presented at Sustainable Finances and Their Importance in the Future of the Economy, Madrid, Spain, Universidad Internacional Menéndez Pelayo, Spanish Association of Economics Journalists. June 17. [Google Scholar]
- Holló, Danial, Mamfred Kremer, and Marco Lo Duca. 2012. CISS—A Composite Indicator of Systemic Stress in the Financial System. Working Paper 1426. Frankfurt upon Main: European Central Bank. [Google Scholar]
- Illing, Mark, and Ying Liu. 2006. Measuring financial stress in a developed country: An application to Canada. Journal of Financial Stability 2: 243–65. [Google Scholar] [CrossRef]
- International Monetary Fund. 2017. Financial System Stability Assessment. Washington, DC: Spain International Monetary Fund. [Google Scholar]
- Kolb, Robert. 2011. Financial Contagion: The Viral Threat to the Wealth of Nations. Hoboken: John Wiley & Sons. [Google Scholar]
- Koop, Gary, and Dimitris Korobilis. 2014. A new index of financial conditions. European Economic Review 71: 101–16. [Google Scholar] [CrossRef] [Green Version]
- Koop, Gary, Mohammad Hashem Pesaran, and Simon Potter. 1996. Impulse response analysis in non-linear multivariate models. Journal of Econometrics 74: 119–47. [Google Scholar] [CrossRef]
- Kremer, Manfred. 2016. Macroeconomic effects of financial stress and the role of monetary policy: A VAR analysis for the euro area. International Economics and Economic Policy 13: 105–38. [Google Scholar] [CrossRef]
- Krippner, Leo. 2013. Measuring the stance of monetary policy in zero lower bound environments. Economics Letters 11: 135–38. [Google Scholar] [CrossRef] [Green Version]
- Kritzman, Mark, Yaunzhen Li, Mark Kritzman, and Roberto Rigobon. 2011. Principal components as a measure of systemic risk. Journal of Portfolio Management 37: 112–26. [Google Scholar] [CrossRef] [Green Version]
- Li, Xiaoming, Bing Zhang, and Ruzhao Gao. 2015. Economic policy uncertainty shocks and stock–bond correlations: Evidence from the US market. Economics Letters 132: 91–96. [Google Scholar] [CrossRef]
- Malo de Molina, José Luis, and Pablo Martín-Aceña. 2012. The Spanish Financial System. Basingstoke: Palgrave Macmillan. [Google Scholar]
- Mei, Dexiang, Qing Zeng, Yaojie Zhang, and Wenjing Hou. 2018. Does US Economic Policy Uncertainty matter for European stock markets volatility? Physica A: Statistical Mechanics and Its Applications 512: 215–21. [Google Scholar] [CrossRef]
- Nelson, William, and Roberto Perli. 2007. Selected indicators of financial stability. Irving Fisher Committee’s Bulletin on Central Bank Statistics 23: 92–105. [Google Scholar]
- Pástor, Lubios, and Pietro Veronesi. 2012. Uncertainty about government policy and stock prices. Journal of Finance 67: 1219–64. [Google Scholar] [CrossRef]
- Pástor, Lubios, and Pietro Veronesi. 2013. Political uncertainty and risk premia. Journal of Financial Economics 110: 520–45. [Google Scholar] [CrossRef] [Green Version]
- Pesaran, Mohammad Hashem, and Yongcheol Shin. 1998. Generalized impulse response analysis in linear multivariate models. Economics Letters 58: 17–29. [Google Scholar] [CrossRef]
- Philippon, Thomas. 2016. Brexit and the End of the Great Policy Moderation. Brookings Papers on Economic Activity 2: 385–93. [Google Scholar] [CrossRef]
- Wisniewski, Tomasz Piotr, and Brendan John Lambe. 2015. Does economic policy uncertainty drive CDS spreads? International Review of Financial Analysis 42: 447–58. [Google Scholar] [CrossRef] [Green Version]


| … | Connectedness FROM Others | ||||
|---|---|---|---|---|---|
| … | |||||
| … | |||||
| … | |||||
| Connectedness to Others | … | Total connectedness |
| Panel A: Descriptive Statistics | ||||||
| Bond Market | Equity Market | Financial Intermediaries | Foreign Exchange Market | Derivatives Market | Money Market | |
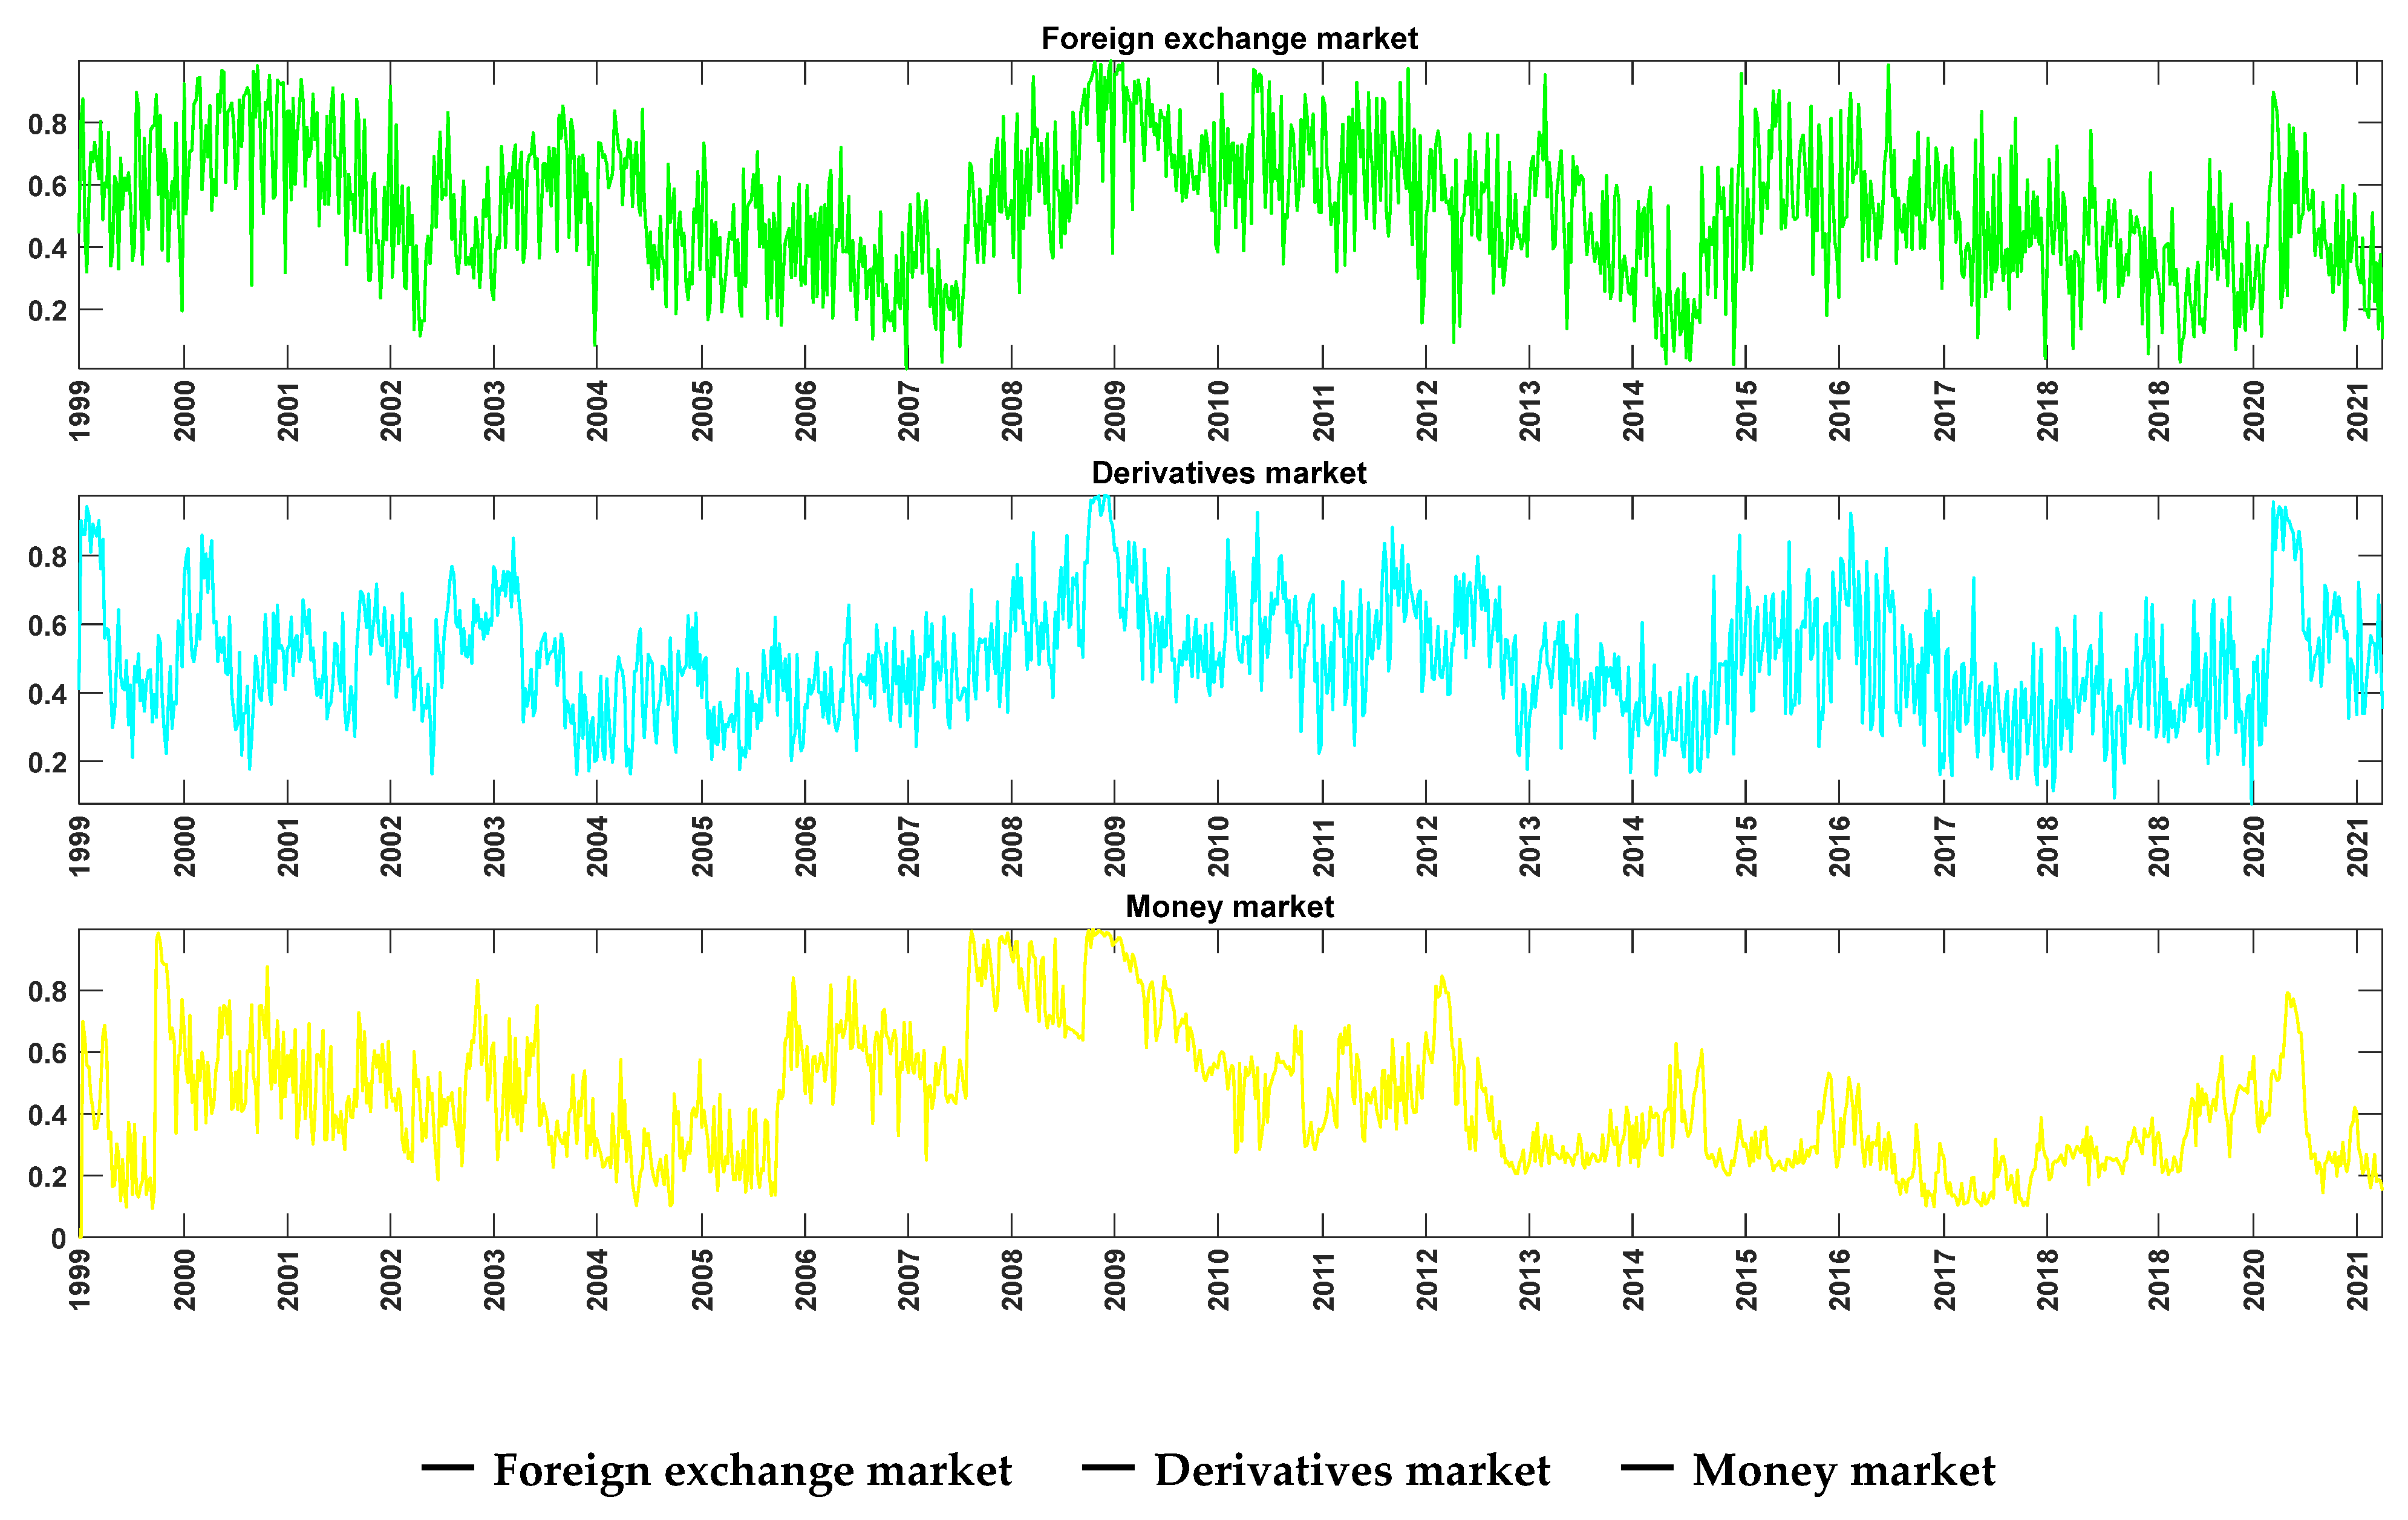
| Mean | 0.5006 | 0.4170 | 0.5416 | 0.5251 | 0.4935 | 0.4383 |
| Median | 0.5280 | 0.4025 | 0.5395 | 0.5225 | 0.4830 | 0.4020 |
| Minimum | 0.0250 | 0.0040 | 0.0120 | 0.0090 | 0.0760 | 0.0000 |
| Maximum | 0.9960 | 0.9620 | 1.0000 | 0.9990 | 0.9740 | 0.9980 |
| Std. Dev. | 0.2316 | 0.2226 | 0.2408 | 0.2152 | 0.1708 | 0.2115 |
| Skewness | 0.0068 | 0.2070 | −0.1397 | 0.0561 | 0.3595 | 0.6760 |
| Excess kurtosis | −0.9376 | −0.9468 | −0.8733 | −0.6481 | −0.1161 | −0.1995 |
| Jarque-Bera | 42.58 a | 51.70 a | 40.71 a | 20.95 a | 25.69 a | 90.41 a |
| p-value | (0.0010) | (0.0010) | (0.0010) | (0.0010) | (0.0010) | (0.0010) |
| Observations | 1162 | 1162 | 1162 | 1162 | 1162 | 1162 |
| Panel B: Matrix Correlations | ||||||
| Bond Market | Equity Market | Financial Intermediaries | Foreign Exchange Market | Derivatives Market | Money Market | |
| Bond market | 1.0000 | |||||
| Equity market | 0.2385 a (0.0000) | 1.0000 | ||||
| Financial intermediaries | 0.6523 a (0.0000) | 0.5355 a (0.0000) | 1.0000 | |||
| Foreign exchange market | 0.1283 a (0.0000) | 0.4273 a (0.0000) | 0.2812 a (0.0000) | 1.0000 | ||
| Derivatives market | 0.2183 a (0.0000) | 0.5644 a (0.0000) | 0.4663 a (0.0000) | 0.3609 a (0.0000) | 1.0000 | |
| Money market | −0.0453 (0.1228) | 0.3587 a (0.0000) | 0.2028 a (0.0000) | 0.2552 a (0.0000) | 0.3529 a (0.0000) | 1.0000 |
| Bond Market | Equity Market | Financial Intermediaries | Foreign Exchange Market | Derivatives Market | Money Market | Directional From Others | |
|---|---|---|---|---|---|---|---|
| Bond market | 93.13 | 1.77 | 3.10 | 1.00 | 0.86 | 0.13 | 6.87 |
| Equity market | 2.44 | 76.87 | 9.61 | 6.18 | 2.59 | 2.31 | 23.13 |
| Financial intermediaries | 2.52 | 6.24 | 85.89 | 2.06 | 1.06 | 2.25 | 14.11 |
| Foreign exchange market | 1.63 | 6.41 | 1.94 | 85.68 | 2.58 | 1.75 | 14.32 |
| Derivatives market | 1.26 | 13.21 | 7.26 | 3.76 | 69.46 | 5.05 | 30.54 |
| Money market | 0.19 | 1.61 | 0.83 | 1.30 | 1.15 | 94.94 | 5.06 |
| Directional to others | 8.03 | 29.24 | 22.73 | 14.31 | 8.23 | 11.49 | Total connectedness = 15.67 |
| net contribution (to–from) others | 1.16 | 6.11 | 8.62 | −0.01 | −22.31 | 6.43 |
| (1) | (2) | (3) | ||||
| Constant | 0.01 | (0.38) | 0.01 | (0.41) | 0.01 | (0.41) |
| Lagged Total Connectedness | 0.85 a | (25.17) | 0.86 a | (31.10) | 0.84 a | (24.75) |
| Uncertainty indicators | ||||||
| WUI Global | −0.02 | (−0.47) | −0.03 | (−1.08) | ||
| WUI-Spain | 0.03 | (1.06) | 0.02 | (0.96) | ||
| WPUI-Spain | 0.11 b | (2.01) | 0.10 a | (2.52) | ||
| ΔEPU-Spain | 0.11 c | (1.90) | 0.10c | (1.80) | ||
| Economic activity indicators | ||||||
| ΔIPI (%) | −0.08 c | (−1.81) | −0.05 b | (−2.38) | ||
| ΔGDP (%) | −0.09 a | (−2.59) | −0.07 a | (−3.28) | ||
| ΔSSR | −0.03 | (−0.81) | −0.04 | (−1.06) | ||
| Adj-R² (%) | 79.60 | 78.79 | 80.31 | |||
Publisher’s Note: MDPI stays neutral with regard to jurisdictional claims in published maps and institutional affiliations. |
© 2021 by the authors. Licensee MDPI, Basel, Switzerland. This article is an open access article distributed under the terms and conditions of the Creative Commons Attribution (CC BY) license (https://creativecommons.org/licenses/by/4.0/).
Share and Cite
Andrada-Félix, J.; Fernandez-Perez, A.; Sosvilla-Rivero, S. Stress Spillovers among Financial Markets: Evidence from Spain. J. Risk Financial Manag. 2021, 14, 527. https://doi.org/10.3390/jrfm14110527
Andrada-Félix J, Fernandez-Perez A, Sosvilla-Rivero S. Stress Spillovers among Financial Markets: Evidence from Spain. Journal of Risk and Financial Management. 2021; 14(11):527. https://doi.org/10.3390/jrfm14110527
Chicago/Turabian StyleAndrada-Félix, Julián, Adrian Fernandez-Perez, and Simón Sosvilla-Rivero. 2021. "Stress Spillovers among Financial Markets: Evidence from Spain" Journal of Risk and Financial Management 14, no. 11: 527. https://doi.org/10.3390/jrfm14110527
APA StyleAndrada-Félix, J., Fernandez-Perez, A., & Sosvilla-Rivero, S. (2021). Stress Spillovers among Financial Markets: Evidence from Spain. Journal of Risk and Financial Management, 14(11), 527. https://doi.org/10.3390/jrfm14110527