Abstract
This study introduces a novel index based on expectations concordance for explaining stock-price volatility when novel events that are each somewhat unique cause unforeseeable change and Knightian uncertainty in the process driving outcomes. Expectations concordance measures the degree to which KU events are associated with directionally similar expectations of future returns. Narrative analytics of daily news reports allow for the assessment of bullish versus bearish views in the stock market. Increases in expectations concordance across all KU events results in reinforcing effects and an increase in stock market volatility. Lower expectations concordance produces a stabilizing effect wherein the offsetting views reduce market volatility. The empirical findings hold for ex post and ex ante measures of volatility and for OLS and GARCH estimates.
JEL Classifications:
D81; D84; G12; G14
1. Introduction
Many macro events, such as Congressional stimulus negotiations or a pandemic but also firm-level events, such as bankruptcies or legal issues, contribute to stock market volatility. Such events are not exact probabilistic replicas of previous events; each is somewhat unique in its timing and impact the economy’s outcomes. When such events occur, participants cannot assess the probability distribution of future returns based on past data. Knight (1921) characterized the change arising from such events as unforeseeable. Following Knight’s classic distinction between risk and true uncertainty, we refer to such events as KU events. Market participants, when facing a KU event, form qualitative views about whether it will have a bullish or bearish impact on stock prices.
The year 2020 witnessed many KU events. No one could have foreseen the arrival of the COVID-19 pandemic. Moreover, while one would expect the pandemic to have negative consequences for stock markets initially, how the event unfolded was also unforeseeable in at least two additional ways. First, market participants could not have foreseen the timing of COVID-19-related development, such as when new waves of cases would begin, accelerate, or peak; when the results of vaccine trials would become available and analyzed; or when vaccinations might receive governmental approval. Second, no one could have foreseen how KU events might affect stock returns and volatility. For example, it is not clear how one might interpret the impact of simultaneous events, such as accelerating COVID-19 cases or the results from vaccine trials.
Understanding the influence of such KU events on the process driving stock market volatility presents serious challenges for researchers.1 It is not clear how to identify and measure participants’ qualitative interpretations in direct response to a particular KU event or how to represent the broad market’s expectation when facing a diversity of views about concurrent events. How might researchers address whether these views are more concordant (similar) or discordant (conflicting) on the whole for returns at a given point in time?
Dynamic general equilibrium and ARCH-type models typically represent time-varying volatility in stock returns with a stochastic process and, consequently, assume away uncertainty arising from KU events.2 Other approaches focusing on news dispersion effects construct sentiment indices based on the optimistic versus pessimistic tone of textual data from financial reports.3 However, these methodologies often focus on word counts or net linguistic tone to proxy for participants’ interpretations. One reasonable hypothesis is that when the concordance of views in response to KU events is low (i.e., greater conflict), so is market volatility, and vice versa, as the bullish versus bearish views to some extent offset and stabilize price fluctuations. Studies tracking the frequency of “uncertainty” terms or sentiment would be unable to address this hypothesis.4 Papers tracking uncertainty-related word counts often find a positive relationship with volatility as measured by the VIX, but their methodology does not allow for the direct identification of relevant events and market participants’ associated interpretations.
Here, we fill this gap in the literature by constructing an index that directly relates a particular event’s bullish or bearish interpretations with respect to stock return expectations rather than relying on word counts or sentiment. We formulate an index of aggregate expectations concordance based on coding of narrative accounts from Bloomberg News’s daily U.S. stock market wrap reports for 2020. By scoring +1 s and −1 s for each relevant event’s interpreted impact on returns, we are able to measure the degree to which bullish and bearish views are more concordant or discordant on the whole for future returns. Our Expectations Concordance Index (ECI) is able to track both the interpretations of a particular KU event over time and the interpretations across all relevant events at a point in time. Time-series plots illustrate that ECI fluctuates dramatically between concordance and discordance throughout the 220 trading days in the sample period. Our analysis yields four key findings.
First, the narrative accounts provide evidence on the overall importance of non-repetitive events for driving fluctuations in daily stock returns. In fact, the Bloomberg reports indicate that such events were deemed relevant for market expectations on roughly 90% of the trading days in the sample. The greatest variance in expectations concordance involves KU events from the categories of Government, Firm-Level, Central Bank, Pandemic, President Trump, and Rest-of-World. Perhaps unsurprisingly, KU events associated with the COVID-19 pandemic, such as cases, deaths, and vaccination trials, were most often reported as driving U.S. stock prices in 2020, affecting over 57% of the total trading days. Time-series plots illustrate that when periods of high COVID-19 new cases and growth rates align with the passage of the first and second Congressional stimulus packages, aggregate ECI is low, reflecting the conflicting bearish versus bullish views, respectively.5
Second, formal empirical analysis supports our hypothesis: Increases in aggregate ECI resulted in an increase in stock market volatility. This result is robust for explaining the realized volatility of S&P 500 returns, the absolute magnitude of S&P 500 returns, and the implied volatility of the VIX. The findings suggest that greater expectations concordance, whether bullish or bearish, has a reinforcing effect that increases market volatility. Lower expectations concordance produces a stabilizing effect wherein the offsetting views reduce market volatility. Furthermore, ECI is found to Granger-cause the VIX but not the other way around. This suggests that individuals consider KU events when taking option positions for S&P 500 and that our ECI index may be a useful investment tool for managing heightened uncertainty.
The third main finding is that augmenting a simple GARCH-X model by including ECI in the variance process produces hypothesized signs on coefficients. The results are robust with respect to both realized and implied volatility and to specifications where expectations concordance is also included in the mean equation. Including ECI for realized volatility also results in improvements in residual diagnostics and reductions in overall persistence. Lastly, we explore how ECI can augment traditional notions of risk in explaining implied volatility. Empirical findings from OLS regressions suggest that information sets including both fundamental risk and KU-based ECI provide a better overall fit for modeling the VIX, potentially offering enhanced portfolio diversification tactics.
The paper is structured as follows. Section 2 describes the data and provides descriptive statistics about the frequency of KU events reported in the Bloomberg News wraps as driving daily stock returns. The scoring methodology of the expectations concordance index is then presented along with the aggregate ECI index and accompanying time-series plot. Periods are discussed where ECI is historically high or low over the 2020 sample period. The behavior of ECI is compared to KU events related to Congressional stimulus packages and COVID-19 cases. Section 3 presents the empirical results, and Section 4 provides concluding remarks and thoughts for future research.
2. Data and Methodology
Although at least one historical event during 2020 was reported as driving stock returns from categories such as Analyst Ratings, Benchmark Valuation, Commodities, Currency Markets, Financial Institutions, Geopolitical Issues, Housing, Oil, and Trade, the most important KU events come from the categories of Central Bank, Company Variables, Government (and President Trump), Pandemic, and Rest of World. Table 1 presents a non-exhaustive list of categories that might include KU events. The category Pandemic, for example, contains events related to COVID-19 cases, deaths, testing, and vaccination trials. The Government category contains events related to Congressional stimulus and President Donald Trump and so on.

Table 1.
KU factor disaggregated classification.
2.1. News Scoring
This study employs a scoring methodology for Bloomberg market wraps that is rule-based and free of subjective interpretation. The rules and scoring instructions follow Mangee (2021b, Chapter 4 and Appendix B).6
Here, we summarize the aspects of Mangee’s (2021b) approach for quantifying the narrative Bloomberg wraps for stock prices in response to KU events. First, we operationalize KU events by excluding the events that are associated with government agency releases or quarterly firm reports. This is likely to understate the frequency of KU events because some of the excluded events may also have unforeseeable consequences for stock price movements. Second, each of the identified events are scored with a +1 or −1 depending on whether it has a bullish or bearish impact on stock prices. KU event scores per category are then added each day. For example, if two bullish events in one category are reported on the same day, the score for that category would be +2.
To formalize what is meant by bullish or bearish expectations, a quantifiable measure must be applied to the sign of interpretations of KU events’ impact on returns based on the Bloomberg News market wraps. KU factors are not measured on a quantitative scale of magnitude such as, say, earnings, interest rates, CPI, or jobless claims. Here, the reported bullish (bearish) impact of KU events on expectations is objectively scored with a +1 (−1) and 0 otherwise.
Consider the following wrap excerpt, which illustrates how multiple KU events on a given trading day can result in higher expectations concordance for returns.
“U.S. stocks started December by rising to record highs as a renewal of aid talks added to optimism over progress on coronavirus vaccines…House Speaker Nancy Pelosi delivered a new proposal for a stimulus package and Senate Majority Leader Mitch McConnell said Tuesday he is circulating among Republicans his own revised plan, which has the backing of President Donald Trump.”(12/1/20)
This excerpt would receive a +1 for stimulus and a +1 for vaccine. The excerpt would also record a +2 for Government official comments since the scoring methodology objectively tracks the number of KU events in each category per day and both Pelosi’s and McConnell’s comments were reported as driving stock price movements during the day. These scores reflect a high degree of reinforcing bullish interpretations in this particular excerpt on that particular day and, thus, greater expectations concordance.
Trading days across the year witnessed many instances in which KU events within the aforementioned categories produced concordant expectations generating either a bullish or bearish overall views of future returns. Success in a vaccine trial stage may be announced on the same day that officials from Congress document progress in advancing a stimulus bill. Both of these KU events may produce bullish expectations for future returns. Alternatively, news of an outbreak of COVID cases, coupled with news of large corporate layoffs, may be interpreted by investors as reinforcing a bearish outlook for returns. In both cases, there is a higher degree of expectations concordance in response to KU events.
Interpretations of KU events’ impact on returns could also be conflicting or less concordant through concurrent news about, say, Presidential comments signaling support for an aid package coupled with a dire warning from the Fed Chair about economic growth. This form of conflict occurs across KU events at a point in time. Lower expectations concordance may also occur within a particular KU event-category over a recent stretch of time. Consider the following two wrap report excerpts from 21 October and 23 October, respectively, shows the lower expectations concordance within a particular KU factor (Congressional stimulus) for returns over a recent stretch of trading days.
U.S. stocks ended a volatile session slightly lower as the White House and Democrats neared an aid deal but signaled it’s unlikely to become law before the election. “You look at the trading today and it’s almost like watching a cat with a laser pointer,” Mark Hackett, chief of investment research at Nationwide, said by phone. “Pelosi comes out midday and says she’s excited about the deal, and then two minutes later says she doesn’t think a deal will get done, and the market’s reacting. Investors are fixated on the shiny object, which is the stimulus deal.”(10/21/20)
Most U.S. stocks rose after the Trump administration resuscitated hopes for a spending package. Investors remain focused on Washington, where lawmakers are haggling over a financial spending bill to prop up the economy before Nov. 3…(10/23/20)
These excerpts suggest that stimulus prospects were viewed bearishly (−1) on 21 October but bullishly (+1) on 23 October, which suggests a temporal conflict of interpretation attached to federal stimulus measures for future returns. Government official statements for Pelosi were also ultimately viewed as bearish on 21 October (−1).
We investigate the following hypothesis implied by expectations concordance and stock market volatility under Knightian uncertainty and unforeseeable change:
Hypothesis 1.
Greater expectations concordance regarding aggregate KU events’ impact results in greater return volatility and vice versa.
Hypothesis 1 suggests that greater expectations concordance, whether bullish or bearish on the whole, has a reinforcing effect that increases market volatility; lower expectations concordance produces a stabilizing effect wherein the offsetting views reduce market volatility.
2.2. Descriptive Evidence: KU Events in 2020
The second column of Table 2 reports the percentage of trading days that KU events were reported in Bloomberg News wraps as driving stock returns for 2020. The findings show that KU factors mattered on over 90% of the 220 total trading days. The most frequently mentioned KU factors in relation to daily price fluctuations were in the categories of Pandemic and Government, which were reported as market drivers on 57% and 55% of total trading days, respectively. Central Bank, Rest of World, and Company Variables were the next most-reported KU factors, moving prices on 29%, 28%, and 22% of the total trading days, respectively. The third column reports that when KU factors were reported as driving the market, there were 3.64 particular KU events mentioned on those days. At the category level, when Pandemic-related events, for example, mattered for the stock market, there were 1.46 events within that category on an average day.
Table 2.
Factor frequency of KU events and bullish–bearish percentiles.
The standard textual analysis of uncertainty and stock market volatility relies on word counts such as those presented in Figure 1 and Figure 2. Figure 1 presents a histogram of the KU terms most often reported in the Bloomberg wraps for 2020.7 It suggests that the most frequently relevant events in 2020 were related to “stimulus”, “virus”, “China”, “Trump”, and “Democrats”.
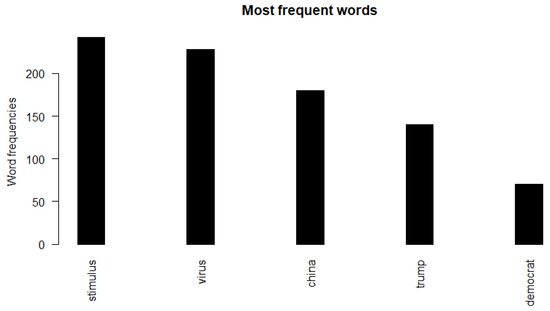
Figure 1.
Histogram of absolute frequencies of KU terms in 2020. Notes: The figure graphs the frequency of KU event terms as reported in Bloomberg News stock market wrap reports for 2020.
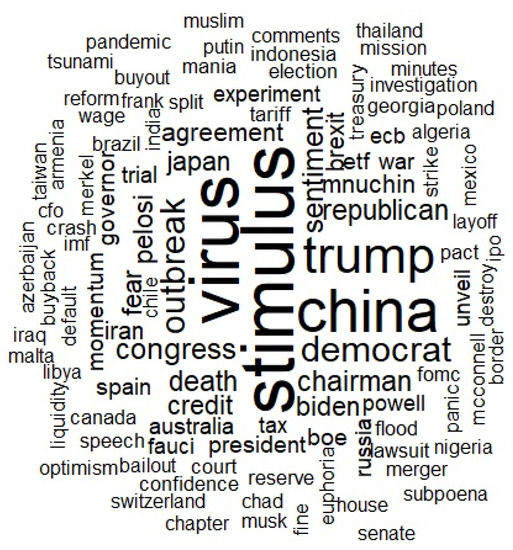
Figure 2.
Bloomberg News WordCloud of KU Factors in 2020. Notes: The WordCloud is based on the co-author’s dictionary lexicon of KU events reported in Bloomberg News stock market wrap reports for 2020.
Figure 2 presents a word cloud illustrating that, beyond the events portrayed in Figure 1, many other KU events were mentioned over the sample period. Word clouds illustrate the most-often mentioned words, either in absolute terms or based on some pre-specified lexicon, where the size of the words indicates the relative frequency of their occurrence.
2.3. Descriptive Evidence: Interpretations of KU Events in 2020
In contrast to the standard textual analysis of the word count, our approach relates volatility to market participants’ interpretations of the impact of KU events on stock prices.
The last column in Table 2 shows that, in the aggregate, KU factors were roughly split (50.7%) between bullish and bearish interpretations for the 2020 stock market. This finding suggests that there is a great diversity of views across the sample period, and that the dataset provides a fertile testing ground for the expectations concordance hypothesis for stock market volatility. At the category level, Pandemic events, for instance, yielded bearish expectations for stock prices 57% of the time. Central Bank and Government KU event expectations were bullish 65% and 61% of the time, respectively. These figures reflect the bullish expectations, on average, of stimulus programs from both the Government and the Federal Reserve and the bearish views generated by COVID-19 cases and deaths. The large diversity of views in response to KU events appears from Table 2 to be more the rule than the exception. Of the 14 categories of KU events, half of them—Company Variables, Trade, Government, Central Bank, Pandemic, Analyst Ratings, and Rest of World—generated bullish interpretations for returns between 30% and 70% of the time, implying high variation (and low within-category concordance) between bullish and bearish views.
2.4. Expectations Concordance Index
Scoring the Bloomberg News stock market reports involves tracking, first, whether a KU event(s) was reported as driving stock prices on a given day and, second, whether the occurrence was viewed as influencing returns positively (+1) or negatively (−1). The aggregate expectations concordance index (ECI) reflects the degree to which the +1s and −1s are more similar or conflicting across all events over a 10-day window. This facilitates comparison with realized 10-day volatility measures in the empirical analysis. ECI will serve as the key explanatory variable in OLS and GARCH regressions on various measures of ex ante and realized stock market volatility.
In order to calculate ECI, we suppose that there are n KU events during the 10 trading days between t − 9 and t. We denote the interpretations of these events with , i = 1 …, n, where takes on the value of +1 or −1, depending on whether market participants interpret the impact of the events as bullish or bearish. We denote the sum of absolute values of ’s with , which is defined as follows.
We also denote the sum of ’s, with , which is defined as follows.
Definitions (1) and (2) imply that the number of positive (i.e., bullish) entries, P, is , and the number of negative (i.e., bearish) entries, N, is . Therefore, the aggregate expectations concordance index is defined as follows.
The ECI values are bounded between 0.5 and 1, where higher values indicate greater concordance of expectations, whether bullish or bearish. We provide two examples producing ECI describing the excerpts from Section 2.1.
Example 1.
The excerpt from 1 December 2020 implied a + 1 for stimulus, +1 for vaccine, and +2 for Government comments. Therefore, based on definitions (1)–(3), ; ; ; ; and , reflecting a complete concordance of bullish views regarding the impact of stimulus, vaccine, and government official comments on the stock market.
Example 2.
The two excerpts from 21 October 2020 and 23 October 2020 implied −1 for stimulus, −1 for Government comments, and +1 for stimulus. Therefore, based on definitions (1)–(3), ; ; ; ; and , reflecting a lower degree of expectations’ concordance compared to the excerpts in Example 1.
2.5. The ECI Index
Figure 3 plots aggregate ECI over the sample period.
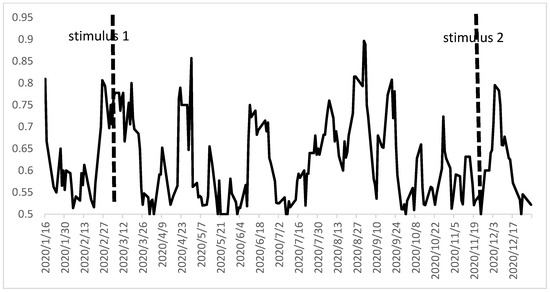
Figure 3.
Aggregate KU event ECI. Notes: The figure plots the expectations concordance index (ECI) for an aggregate of KU events as reported in the Bloomberg News stock market wraps for 2020. The left vertical dashed line corresponds to the passage of the $2T Congressional stimulus package on 26 March 2020. The right dashed line corresponds to the second stimulus package signed into law on 27 December 2020.
There is considerable variation in the degree of concordance, with (min,max) = (0.5,0.9). High index values above 0.7 were obtained from mid-February to mid-March, late April to early May, June, from August to September, and early December. These are periods during which the degree of bullishness or bearishness was more uniform and very high. Low ECI values, which represent conflicting expectations for returns, are found from late March to early April, late May to early June, July, October–November, and late December. Interestingly, several of the low values for aggregate ECI aligned with the confluence of conflicting views in response to major macro KU events.
For instance, ECI decreases from 0.8 on 18 March to 0.5 on 31 March, which aligns perfectly with the passage of the first Congressional stimulus package, the Coronavirus Aid, Relief, and Economic Security (CARES) Act on 26 March. This was also the period during which the growth rate in new COVID-19 cases was relatively high during 2020. The average daily growth rate of new cases in the US from 18 March to 31 March was 18%. The average daily growth rate for all of 2020 was 4%.8 Figure 4 plots ECI against the growth rate of new COVID-19 cases from February 4 through 31 March. The two series display strong positive co-movement producing a significant correlation coefficient of 0.49 (p-value = 0.000).9
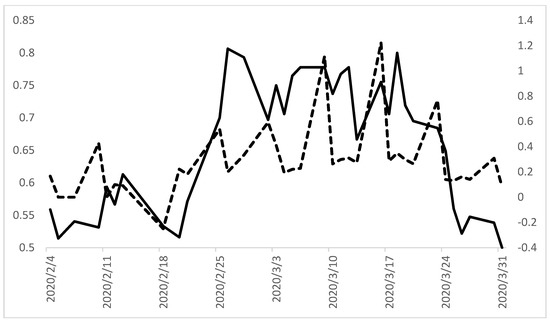
Figure 4.
Aggregate ECI and COVID-19 growth in new cases. Notes: The figure plots the ECI (left axis, solid line) against the growth rate of the 7-day moving average of new COVID-19 cases (right axis, dashed line) for the period 4 February 2020 to 31 March 2020. COVID-19 case data are collected from the CDC website.
That is, two very important events for the broad economy (and stock market) involved conflicting interpretations and produced low expectations concordance: the Congressional stimulus produced bullish views for expected returns while the high growth rate in new COVID-19 cases produced bearish views. The end of December also exhibits very low values of ECI, which align with two major conflicting events: the passage of the second stimulus package, signed into law by President Trump on 27 December, and the year’s highest daily total of new US cases, 276,025 and 280,030 on 30 and 31 December, respectively. Figure 3 plots the timing of the two stimulus packages with vertical dashed bars.
3. Results
Empirical analysis focuses on the explanatory power of aggregate ECI for three measures of stock market volatility. The first measure is equal to the absolute value of daily returns for the S&P 500 Composite Index (p), where . The second measure is the 10-day realized volatility, where . The third measure is equal to the VIX S&P 500 options-implied volatility index.10 Regression results involving OLS and GARCH estimations are reported. The standard errors for all estimates are corrected for heteroskedasticity and autocorrelation (HAC).
The first OLS regression takes the following form:
where for each of the three volatility equations. Table 3 reports the estimation results for the full sample and for the first half of 2020. Although all coefficients on ECI are positive for the full sample, only the estimation of absolute returns displays statistical significance (90% level). However, if the regressions are run over the first half of the sample during the period when Knightian uncertainty was widely considered to be the greatest, the coefficients on aggregate ECI all become statistically significant (95% for both measures of realized volatility and 90% for implied volatility) with the predicted positive sign.
Table 3.
OLS Regressions of ECI on Stock Market Volatility.
The overall fit of the ECI-based volatility regressions more than doubles for absolute returns and more than triples for realized and implied volatility during the first-half of 2020. We also find that aggregate ECI Granger causes the VIX over both the full sample (p-value = 0.021) and the first-half of 2020 (p-value = 0.092), but the VIX does not Granger cause aggregate ECI across either sample period (p-value = 0.622 and 0.695, respectively). This suggests that individuals take into account KU events when taking option positions for the SP500 and that our ECI index may be a useful investment tool for dealing with periods of heightened uncertainty.
The second set of OLS regressions uses the ECI variable to back-out a proxy for fundamental risk and then investigate whether ECI offers explanatory power for the VIX above that of traditional risk. To isolate a fundamental risk proxy, we first regress the aggregate ECI variable on the realized 10-day volatility of S&P 500 returns .
We then capture the residual from Equation (5), which represents the explanatory power of information orthogonal to KU-based ECI on realized volatility such that the VIX regression then takes the form.
Equation (6) represents the VIX implied-volatility index as a function of both a fundamental risk component and a Knightian uncertainty component for which its importance for explaining ex ante volatility is captured by the significance of and , respectively. Table 4 reports the results for estimating Equation (6). The coefficient on fundamental risk is highly significant and positive. The coefficient on ECI is also highly significant and positive. If ECI is excluded from the VIX regression, the coefficient on fundamental risk remains positive and significant, but the adj-R2 falls from 0.69 to 0.65. These results add to those reported in Table 3 and provide further support for the expectations concordance hypothesis in explaining return volatility under KU.
Table 4.
OLS regressions of risk and uncertainty on implied volatility.
The third set of regressions are based on GARCH-X specifications, which include an exogenous regressor in the conditional variance equation—in this case, the aggregate ECI variable. ARCH/GARCH models focus on the variance of the dependent variable as a function of past values of the dependent variable and independent or exogenous variables if included.11 The mean equation takes the following form:
where c is a constant, and . is a Gaussian IID mean-zero error term with constant variance. The conditional variance for a GARCH(q,p)-X model of realized volatility can then be expressed as follows:
where q denotes the number of first-order autoregressive forecast variance terms, p denotes the order of the moving average ARCH terms, Z denotes aggregate ECI, and is the assumed Gaussian IID error term. Given our hypothesis that greater expectations concordance drives greater market volatility, we would expect and statistical significance in explaining the conditional volatility of realized S&P 500 returns. We focus on the variance equation and find that a GARCH(1,1)-X model generates the following coefficients (with p-values in parentheses): , , , and . The results suggest that last period’s forecast variance of returns is positive and significant, news about last period’s volatility is positive and significant, and the impact from ECI is positive and significant.12
Residual diagnostics from the GARCH(1,1)-X model for conditional variance of returns also shed light on the improvements in model fit from including ECI in the specification for market volatility. First, because stock return volatility is persistent, we can look at the sum of and coefficients; if , then conditional variance is very persistent. From the GARCH(1,1)-ECI model estimates, we observe that compared to the higher values of for the baseline GARCH(1,1) model without ECI in the variance equation. This suggests that including ECI in the return variance specification reduces the degree of persistence documented throughout the volatility literature. Second, it is also a stylized fact that stock return volatility has fat-tail distributions with high levels of kurtosis.13 The GARCH(1,1)-ECI model generates a Jarque–Bera test statistic of 42.26 for normality of residuals, which, although it rejects normality with a p-value = 0.000, is much lower than the JB test statistic of 215.78 for the baseline model excluding ECI.
4. Conclusions
Events such as Congressional stimulus negotiations or a pandemic are each somewhat unique and cause unforeseeable change; thus, Knightian uncertainty in the process driving stock market prices results. Consequently, market expectations of returns in response to such events cannot be assessed with stochastic or probabilistic rules based on past data. Rather, market participants will interpret such events as being either more bullish or bearish for expected returns. The degree of similarity or conflict in views will, therefore, have differential impacts on return volatility: greater expectations concordance is hypothesized to produce reinforcing effects and greater return volatility.
We identify KU events reported as driving daily returns from Bloomberg News stock market wrap reports to assess the market’s qualitative (bullish or bearish) interpretations for expected returns over the year 2020. By quantifying the views with +1 s and −1 s, we are able to develop a novel Expectations Concordance Index, which we relate to both ex ante and realized measures of stock market volatility. ECI is low when major events such as the passage of Congressional stimulus packages and concurrent increases in COVID-19 cases produce conflicting views.
The main empirical finding of this study is that greater ECI across an aggregate of all interpretations of KU events results in greater stock market volatility. That is, when market expectations are reinforced, whether bullish or bearish on the whole, the volatility of stock returns is greater. By contrast, lower aggregate ECI results in lower return volatility as conflicting expectations somewhat offset producing a stabilizing effect. The empirical findings are robust to OLS and GARCH-X estimates and to realized and implied volatility (VIX) measures. Moreover, ECI is found to Granger cause the VIX but not vice versa, suggesting that market participants recognize KU events when considering future volatility.
This study also attests to the benefit of narrative analytics for understanding the importance of Knightian uncertainty in driving financial market outcomes more broadly. Future research is needed to investigate the role of expectations concordance in other financial markets, such as foreign exchange and bond markets, and in other narratological contexts.
Author Contributions
Conceptualization, R.F. and N.M.; Methodology, R.F. and N.M.; Formal Analysis, R.F. and N.M.; Writing, R.F. and N.M.; Project Administration, R.F. and N.M.; Funding Acquisition, R.F. and N.M. All authors have read and agreed to the published version of the manuscript.
Funding
We acknowledge funding from the Institute for New Economic Thinking program on Knightian Uncertainty Economics.
Data Availability Statement
Data for the ECI series is available at the corresponding author’s personal website.
Conflicts of Interest
The authors declare no conflict of interest.
Notes
| 1. | (Knight 1921) argues that change in the distribution characterizing outcomes is unforeseeable: structural breaks often occur contemporaneously with historical events which “are far too unique for any sort of statistical tabulation to have any value for guidance” (p. 231). The resulting uncertainty cannot “by any method…be reduced to an objectively measurable probability” (pp. 231, 321). For recent evidence in support of Knight’s views, see (Hendry and Doornik (2014); Hendry (2018); Frydman et al. (2015); Mangee and Goldberg (2020); Mangee (2021a, 2021b)). |
| 2. | For seminal stochastic volatility models based on dynamic general equilibrium, see Hull and White (1987) and Wiggins (1987). For ARCH models, see the seminal study by (Engle 1982). See also (Campbell et al. (2018); Cochrane (2005)) and references therein. |
| 3. | Models of disagreement, typically rely on probabilistic representations of heterogeneous beliefs and, thus, assume away Knightian uncertainty. See (Hong and Stein (2007); Barinov (2013); Hansen (2015); Branger et al. (2015)). |
| 4. | See (Baker et al. (2016, 2020a); Manela and Moreira (2017); Liu and Zhang (2015); Bekiros et al. (2016); Friberg and Seiler (2017); Alexopoulos and Cohen (2015); Dzielinski and Hasseltoft (2017); Loughran and McDonald (2011)). (Baker et al. 2019) take a more narratological approach based on human scoring of news after trading days with the largest changes in stock market prices. |
| 5. | (Baker et al. 2020b) use automated and manual news analytics to document the historically unprecedented influence the COVID-19 pandemic has had on the US stock market compared to previous pandemics. |
| 6. | See (Mangee 2021b, chp. 4 and Appendix B) for instructions on the KU scoring approach along with a plethora of Bloomberg News scoring examples across every category of KU events. |
| 7. | The KU dictionary lexicon has also been featured in (Mangee 2021b, chp. 4) and can be found at the co-author’s website, https://www.taskstream.com/ts/mangee/NicholasMangee (accessed on 3 September 2021). |
| 8. | These values are based on the daily growth rate of new cases from the 7-day moving average. Data is collected from the US Centers for Disease Control and Prevention (CDC) website. |
| 9. | To generate correlation statistics, new case data was stemmed to match the observations of ECI and stock market trading days. |
| 10. | Data for S&P500 daily closing prices is collected from Yahoo! Finance and is in nominal terms. |
| 11. | For GARCH (Generalized ARCH) models, see (Bollerslev 1986; Taylor 1986). |
| 12. | The results are similar for GARCH models of implied volatility and for including ECI in the mean equation. |
| 13. | For an extensive discussion see (Campbell et al. 1997) and references therein. |
References
- Alexopoulos, Michelle, and Jon Cohen. 2015. The Power of Print: Uncertainty Shocks, Markets, and the Economy. International Review of Economics and Finance 40: 8–28. [Google Scholar] [CrossRef]
- Baker, Scott R., Nicholas Bloom, and Steven J. Davis. 2016. Measuring Economic Policy Uncertainty. Quarterly Journal of Economics 131: 1593–636. [Google Scholar] [CrossRef]
- Baker, Scott R., Nicholas Bloom, Steven J. Davis, and Kyle K. Kost. 2020a. Policy News and Stock Market Volatility. NBER Working Paper, Number 25720. Cambridge: NBER. [Google Scholar]
- Baker, Scott R., Nicholas Bloom, Steven J. Davis, and Marco C. Sammon. 2019. What Triggers Stock Market Jumps? NBER Working Paper, Number 28687. Cambridge: NBER. [Google Scholar]
- Baker, Scott R., Nicholas Bloom, Steven J. Davis, Kyle K. Kost, Marco C. Sammon, and Tasaneeya Viratyosin. 2020b. The Unprecedented Stock Market Reaction to COVID-19. Review of Asset Pricing Studies 10: 742–58. [Google Scholar] [CrossRef]
- Barinov, Alexander. 2013. Analyst Disagreement and Aggregate Volatility Risk. Journal of Financial and Quantitative Analysis 48: 1877–900. [Google Scholar] [CrossRef]
- Bekiros, Stelios D., Rangan Gupta, and Clement Kyei. 2016. On Economic Uncertainty, Stock Market Predictability and Nonlinear Spillover Effects. North American Journal of Economics and Finance 36: 184–91. [Google Scholar] [CrossRef]
- Bollerslev, Tim. 1986. Generalized Autoregressive Conditional Heteroskedasticity. Journal of Econometrics 31: 307–27. [Google Scholar] [CrossRef]
- Branger, Nicole, Christian Schlag, and Lue Wu. 2015. Nobody is Perfect: Asset Pricing and Long-Run Survival when Heterogeneous Investors Exhibit Different Kinds of Filtering Errors. Journal of Economic Dynamics and Control 61: 303–33. [Google Scholar] [CrossRef][Green Version]
- Campbell, John Y., Andrew W. Lo, and A. Craig MacKinlay. 1997. The Econometrics of Financial Markets. Princeton: Princeton University Press. [Google Scholar]
- Campbell, John Y., Stefano Giglio, Christopher Polk, and Robert Turley. 2018. An Intertemporal CAPM with Stochastic Volatility. Journal of Financial Economics 128: 207–33. [Google Scholar] [CrossRef]
- Cochrane, John H. 2005. Asset Pricing. Princeton: Princeton University Press. [Google Scholar]
- Dzielinski, Michal, and Henrik Hasseltoft. 2017. News Tone Dispersion and Investor Disagreement. Working Paper. Stockholm: Stockholm Business School. [Google Scholar]
- Engle, Robert F. 1982. Autoregressive Conditional Heteroskedasticity with Estimates of Variance of UK Inflation. Econometrica 50: 987–1008. [Google Scholar] [CrossRef]
- Friberg, Richard, and Thomas Seiler. 2017. Risk and Ambiguity in 10Ks: An Examination of Cash Holding and Derivatives Use. Journal of Corporate Finance 45: 608–31. [Google Scholar] [CrossRef]
- Frydman, Roman, Michael D. Goldberg, and Nicholas Mangee. 2015. Knightian Uncertainty and Stock- Price Movements: Why the REH Present-Value Model Failed Empirically. Economics: The Open-Access, Open-Assessment E-Journal 9: 1–50. [Google Scholar] [CrossRef]
- Hansen, Simon Lysbjerg. 2015. Cross-Sectional Asset Pricing with Heterogeneous Preferences and Beliefs. Journal of Economic Dynamics and Control 58: 125–51. [Google Scholar] [CrossRef]
- Hendry, David F. 2018. Deciding Between Alternative Approaches in Macroeconomics. International Journal of Forecasting 34: 119–35. [Google Scholar] [CrossRef]
- Hendry, David F., and Jurgen A. Doornik. 2014. Empirical Model Discovery and Theory Evaluation: Automatic Selection Methods in Econometrics. Cambridge: MIT Press. [Google Scholar]
- Hong, Harrison, and Jeremy C. Stein. 2007. Disagreement and the Stock Market. Journal of Economic Perspectives 21: 109–28. [Google Scholar] [CrossRef]
- Hull, John, and Alan White. 1987. The Pricing of Options on Assets with Stochastic Volatilities. Journal of Finance 42: 281–300. [Google Scholar] [CrossRef]
- Knight, Frank H. 1921. Risk, Uncertainty, and Profit. Boston and New York: Houghton Mifflin. [Google Scholar]
- Liu, Li, and Tao Zhang. 2015. Economic Policy Uncertainty and Stock Market Volatility. Finance Research Letters 15: 99–105. [Google Scholar] [CrossRef]
- Loughran, Tim, and Bill McDonald. 2011. When is a Liability Not a Liability? Textual Analysis, Dictionaries, and 10-Ks. Journal of Finance 66: 35–65. [Google Scholar] [CrossRef]
- Manela, Asaf, and Alan Moreira. 2017. News Implied Volatility and Disaster Concerns. Journal of Financial Economics 123: 137–62. [Google Scholar] [CrossRef]
- Mangee, Nicholas. 2021a. A New Explanation for Samuelson’s Dictum and the Stock Market: Novel Events and Knightian Uncertainty. SURE Journal 3: 1–22. [Google Scholar] [CrossRef]
- Mangee, Nicholas. 2021b. How Novelty and Narratives Drive the Stock Market: Black Swans, Animal Spirits, and Scapegoat. Cambridge: Cambridge University Press. [Google Scholar]
- Mangee, Nicholas, and Michael D. Goldberg. 2020. A Cointegrated VAR Analysis of Stock Price Models: Fundamentals, Psychology and Structural Change. Journal of Behavioral Finance 21: 352–68. [Google Scholar] [CrossRef]
- Taylor, Stephen J. 1986. Modeling Financial Time Series. Chichester: John Wiley and Sons. [Google Scholar]
- Wiggins, James B. 1987. Option Values under Stochastic Volatility: Theory and Empirical Estimates. Journal of Financial Economics 19: 351–72. [Google Scholar] [CrossRef]


Publisher’s Note: MDPI stays neutral with regard to jurisdictional claims in published maps and institutional affiliations. |
© 2021 by the authors. Licensee MDPI, Basel, Switzerland. This article is an open access article distributed under the terms and conditions of the Creative Commons Attribution (CC BY) license (https://creativecommons.org/licenses/by/4.0/).