1. Introduction
In the 1960s and 1970s, organisations sought to increase their competitiveness by standardising and improving internal processes to produce better-quality products at lower costs. The prevailing thinking at the time was that solid engineering and design and coherent production operations were a prerequisite for achieving market demands and thus gaining more market shares, so designers were encouraged to incorporate customer needs into the design of their products. As a result, a product that combined the highest possible quality level with the lowest cost encompassed the characteristics desired by the customer (
Ghahremani-Nahr et al. 2021). For this reason, organisations focused all their efforts on increasing efficiency. In the 1980s, with the increase in variety in customer patterns, organisations became significantly interested in increasing flexibility in product lines, improving products, existing processes, and developing new products to meet customer needs. This phenomenon posed new challenges for them (
Taleizadeh et al. 2019).
In the 1990s, along with improvements in production processes and the application of reengineering models, managers in many industries realised that improving internal processes and flexibility in the company’s ability alone was not enough to stay in the market. Instead, parts and materials suppliers must produce materials of the highest quality and lowest cost, and distributors of products must be closely linked to the manufacturer’s market development policies. With such an attitude, many supply chain management approaches have occurred (
Ghahremani-Nahr et al. 2020). In general, the supply chain consists of two or more organisations that are separate from each other and are interconnected by material, information, and financial flows. These organisations can provide raw materials, parts, final products, or services such as distribution, warehousing, wholesale, and retail. The supply chain includes suppliers, production centres, distribution centre warehouses, and retailers, so in terms of material flows, raw materials, inventory under construction, and final products flow between facilities of different supply chain actors (
Devika et al. 2014).
The intensification of the global competition scene in an ever-changing environment has doubled the need for appropriate responses from manufacturing organisations and companies and insists on their flexibility in an uncertain external environment. Today’s national and global organisations need to use the right model and approach to achieve a competitive advantage and customer expectations (
Ghahremani-Nahr 2020). Customers in today’s organisations are accompanied and synchronised by the organisation members in the production of goods and services, procedures and processes, the development of knowledge, and competitiveness. Effective supply chain management is one of the main factors of market survival.
At the same time, the use of information technology in supply chain activities has increased the potential for value creation in the chain (
Nozari et al. 2019). In general, supply chain management emphasises increasing the flexibility of companies that can respond quickly and effectively to market changes. Supply chains have grown rapidly in recent years, and it is now widely known that focusing solely on economic performance to optimise costs or the return on investment cannot produce sustainable development in the supply chain. The effect of various activities in the supply chain on social life and environmental issues that lead to sustainable development should also be considered (
Ghahremani-Nahr et al. 2019). To this end, the concept of sustainable supply chain management has emerged to address the importance of social and environmental concerns and economic factors in supply chain planning (
Nagurney 2021).
The outbreak of the COVID-19 pandemic has caused negative supply-side and demand-side shocks and has spread to all sectors of the economy by affecting the supply chain. However, these effects are not only due to supply and demand shocks but also related to another phenomenon called “coordination failure”, which is part of the secondary effects of supply and demand shocks that lead to drastic changes in expectations and risk management patterns of economic actors and consumers (
Shahed et al. 2021). The essential elements of the chain include information exchange, logistics processes, and credit exchange (monitoring the flow of information exchange or physical input in the form of online transactions), which will be disrupted by the phenomenon of coordination failure (
Singh et al. 2021). In recent times, the importance of this issue has led most researchers to focus on providing solutions and models to reduce COVID-19 transmission and rebuild the chain network (
Golan et al. 2020;
Ivanov 2020).
Therefore, of the possible research areas, the need to design a model for medical equipment supply to hospitals under the COVID-19 pandemic conditions was of interest and appeared to be a gap in the research. In this paper, a closed-loop supply chain network model is designed under uncertain conditions. The main purpose of the model is to aid in making strategic and tactical decisions simultaneously. In strategic decisions, the goal is to locate production, distribution/collection centres, and recycling centres in the supply chain network. In tactical decisions, the goal is to optimally allocate the flow of medical equipment between supply chain network levels and routinely distribute products to and collect products from hospitals.
In detail, those decision variables are classified into two categories: Strategic and tactical decisions. Among strategic decisions, locating and selecting potential facilities are some of the most critical decision variables that can have long-term effects regarding the design of a closed-loop supply chain network. The tactical, medium-term decisions include variables on how to distribute and transfer medical equipment between levels of the supply chain network, how to use vehicles in distributing and collecting medical equipment to and from hospitals, and vehicle travel times to prevent congestion and transmission of the Sars-Cov-2 virus.
The model designed in this paper aims to reduce the transfer of COVID-19 resulting from the distribution and collection of medical equipment to and from hospitals in different time windows. It is necessary that vehicles have the least congestion in the distribution of medical equipment to hospitals. Achieving this effect will be possible by minimising the number of vehicles used in the supply chain network. In addition to the presented statistical model’s objective, goals such as minimising the total cost of supply chain network design and minimising the time for distribution and collection of products to/from hospitals were made. However, the need for hospital medical equipment and transfer costs is an uncertain parameter.
Closed-loop supply chain network models are used in various industries such as electronic components, automotive parts, etc. In this paper, the closed-loop supply chain network for the distribution and collection of medical equipment modelled and its related variables and objectives have been selected. Considering that the prevalence of the COVID-19 virus is higher due to patients visiting hospitals, people are more likely to be infected in this place. The greatest attention should be paid to the distribution and collection of medical equipment. Therefore, the developed supply chain model is considered to reduce costs, reduce time, and reduce the number of vehicles for the distribution of medical devices and equipment. These conflicting objectives simultaneously include the objectives of public closed-loop supply chain networks and the objectives of preventing the spread of COVID-19. In this paper, a fuzzy programming method is used to control uncertain parameters. Furthermore, the use of the new fuzzy neutrosophic method for the simultaneous optimisation of the above three objectives in the COVID-19 pandemic is another case discussed in this paper.
Given the issues mentioned above, as well as the current and previous waves of the COVID-9 pandemic, the main research question can be posed as follows: How does one design a closed-loop supply chain network that, in addition to reducing the cost and time of medical equipment transfer, leads to reduced vehicle traffic and transmission of the COVID-19 under uncertainty?
Considering all of the mentioned aspects of this study, the structure of the paper is as follows. The second part discusses the research background of closed-loop supply chain networks, vehicle routing, and neutrosophic fuzzy programming. In the third part, a mathematical model of the closed-loop supply chain network under uncertainty conditions and a fuzzy programming method to control uncertain parameters are presented. The fourth part of the paper deals with the description of neutrosophic and LP-metric fuzzy programming methods to solve the three-objective model. The LP metric is a multi-criteria decision making (MCDM) that solves multi-objective decision making (MODM) models. In the fifth section, the analysis of the designed model is shown in the form of a numerical example. Finally, the sixth section concludes and presents future research proposals.
2. Literature Review
In this section, the most important literature in supply chain network design and vehicle routing is reviewed. Pishvaei et al. proposed a bi-objective MIP (Mixed Integer Programming) model that aimed to maximise CLSC (closed-loop supply chain) responsiveness and minimise total costs. The model was solved by the Memetic algorithm (
Pishvaee et al. 2010). In order to integrate decision levels into an SCN (supply chain network) design problem, Keyvanshokooh et al. presented an MIP model and used a dynamic pricing method. They minimised the total cost of designing an integrated multi-level logistics network (
Keyvanshokooh et al. 2013). Zokaee et al. presented a new robust model for dealing with uncertainties in some data costs, supply parameters, or demand (
Zokaee et al. 2017). Vahdani et al. proposed a two-objective model for designing a closed-loop supply chain network in conditions of uncertainty. They implemented a multi-server system based on the concepts of queuing theory (
Vahdani and Mohammadi 2015). Lalmazloumian et al. proposed a scenario-based approach as a robust planning form for dealing with uncertainties related to a multi-cycle, multi-product, multi-level supply chain model (
Lalmazloumian et al. 2016). In turn, Hernandez et al. proposed a multi-objective and three-level model with a systematic approach to facility allocation due to disruption (
Hernandez et al. 2014).
Ghomi-Avili et al. proposed a two-objective, two-level model with price-dependent demand for a closed-loop supply chain network design. Their proposed model, outsourcing strategies, sets pricing decisions that maximise total profits in a competitive environment and minimise CO2 emissions in production processes (
Ghomi-Avili et al. 2018). Shahedet al. developed a mathematical model to mitigate disruptions in a three-stage (i.e., supplier, manufacturer, retailer) supply chain network subject to a natural disaster such as the COVID-19 pandemic. This optimisation model manages supply chain disruptions for a pandemic where disruptions can occur to both the supplier and the retailer (
Shahed et al. 2021). Singh et al. developed a simulation model of the public distribution system (PDS) network with three different scenarios to demonstrate disruptions in the food supply chain (
Singh et al. 2021). Fu et al. introduced the reverse channel in a dynamic closed-loop supply chain consisting of retailers and manufacturers. Based on the dynamic CLSC model, we investigate the decisions and benefits of CLSC members in various inverse channels that take into account the quantitative characteristics of the products (
Fu et al. 2021). Zheng et al. presented closed-loop supply chain models with two competitive sales channels and considered three inverse channel structures (
Zheng et al. 2021).
In the CLSC research, the vehicle routing problem (VRP) is one of the most important fields. The main goals of solving VRP are to reduce potential costs and to create opportunities to improve services. Li et al. developed the multi-depot green vehicle routing problem (MDGVRP) by maximising revenue and minimising costs, time, and emissions. They used an ant colony optimisation (IACO) algorithm to solve the model (
Li et al. 2019).
Nguyen et al. presented a routing problem in urban transportation. Their proposed model considers time-dependent travel time, multi-trips per vehicle, and simultaneous loading time in the warehouse. Their model minimises the total travel distance while meeting the time windows, vehicle capacity, and maximum travel length limits. To solve the model, they used a combined meta-heuristic algorithm of Adaptive Large Neighbourhood Search (ALNS) and Neighbourhood Variable Descent (VND) (
Nguyen et al. 2013). Hornstra et al. solved vehicle routing problems with the cost of pick-up, delivery, and transportation. They develop an MIP model and show how to implement it to solve related problems. To solve them, we create an extensive comparative logical search (ALNS) (
Hornstra et al. 2020). Agra et al. presented an inventory routing problem in which a vehicle is responsible for transporting goods from a set of supply locations to a set of demand locations. They considered two models, each defined differently in a developed network. The path of both models is continuous and based on time formulation (
Agra et al. 2021).
Wang et al. formulated a two-echelon collaborative multi-depot multi-period vehicle routing problem, 2E-CMDPVRP, as a multi-objective planning model. Their proposed model minimises logistics operating costs, service waiting time, and the number of vehicles in different periods. They used an innovative hybrid algorithm with three-dimensional k-means clustering and an improved point-based genetic sorting algorithm (IR-NSGA-III) (
Wang et al. 2021) to solve the model. Zhen et al. developed a multi-depot multi-trip vehicle routing problem with time windows and release dates. The objective of their proposed model is to minimise the total travel time. They used a hybrid particle swarm optimisation algorithm and a hybrid genetic algorithm (
Zhen et al. 2020).
Soeanu et al. proposed a method based on cost-effective learning to minimise routing costs as well as potential costs due to the risk of vehicle breakdown and cargo delivery failure. The innovative solution-generation method can be used to reduce the risk of vehicle routing in the planning stage and during various active and responsive program adaptation activities in response to the occurrence of events (
Soeanu et al. 2020). Bezerra et al. proposed a multi-depot vehicle routing problem (MDVRP). They used the meta-heuristic approach (GVNS) to solve the model. MDVRP includes a set of vehicle routes that serve all customers so that the maximum number of vehicles in stock and vehicle capacity is observed and the transportation total cost is minimised (
Bezerra et al. 2019). Bruni et al. proposed the problem of pick-up delivery with time windows. They used several vehicles with a specific capacity to respond to customer demands, including transporting goods from one supplier (place of delivery) to the customer (place of delivery). They presented the problem of profitable delivery and delivery with time windows with uncertain travel times. The objective is to find a solution that maximises net profit (
Bruni et al. 2021). Bektaş et al. proposed a new formulation for multi-depot warehouse routing problems. They looked at two problems, one with depot selection decisions and the other without a decision. They provided complete theoretical and practical comparisons of the formulas and suggested which formulas work best computationally (
Bektaş et al. 2020). Bertazzi et al. presented a multi-depot inventory routing problem. The objective of their proposed model is to minimise routing costs. The problem of multi-depot inventory routing optimises inventory and routing decisions. They formulated the problem as a linear programming model with mixed integers and developed three-phase mathematics (
Bertazzi et al. 2019).
Kamal et al. designed a multi-objective selective maintenance allocation problem with fuzzy parameters under a neutrosophic environment. They used a new defuzzification technique based on beta distribution to convert fuzzy parameters into crisp values (
Kamal et al. 2021). Junaid et al. studied a supply chain to identify and assess supply chain risks and develop criteria for managing these risks. They presented a neutrosophic (N) theory merged with the analytic hierarchy process (AHP) and the technique for order of preference by similarity to ideal solution (TOPSIS) to deal with complexity, uncertainty, and vagueness (
Junaid et al. 2020). Abdel-Basset et al. designed a framework to handle scheduling problems using neutrosophic activity duration times. They considered essential aspects of time–cost trade-offs while considering the projects’ actual and uncertain situation (
Abdel-Basset et al. 2020). Ahmad et al. designed a closed-loop supply chain network under fuzzy numbers. They developed a fuzzy programming model to control the demand and transportation costs and used the neutrosophic optimisation model (
Ahmad et al. 2020).
Edalatpanah designed a new model of DEA whereby the information on decision-making units is comprised of triangular neutrosophic numbers. In this paper, after comparing the conventional DEA (Data Envelopment Analysis) model and the triangular neutrosophic numbers, an algorithm for solving the new model has been used (
Edalatpanah 2020). Pratihar et al. presented a neutrosophic set to solve the transportation problem under uncertainty. They considered the supply, demand, and cell cost uncertainty parameters and used a neutrosophic set to obtain the optimum objective. The neutrosophic set generalises crisp sets, the fuzzy set, and the intuitionistic fuzzy set, which handles uncertain, unpredictable, and insufficient information in real-life problems (
Pratihar et al. 2019). Touqeer et al. solved linear programming network problems with constraints concerning interval-valued neutrosophic numbers. They used the score function and upper and lower membership functions of interval-valued neutrosophic numbers (
Touqeer et al. 2021). Then, Elfarouk et al. (
Elfarouk et al. 2021), developed a more complex model, namely a multi-objective, multi-echelon, multi-product, stochastic closed-loop supply chain network. It is a realistic mathematical model that represents and analyses the impact of uncertainty in the demand and recovery rate of products on the economic, environmental, and social sustainability aspects in the CLSC. The interesting part of the research (from a mathematical point of view) was using the COBYLA algorithm to solve the model. Sadeghi Ahangar et al. (
Sadeghi Ahangar et al. 2021) designed a model for another decision-making problem, namely the municipal solid waste management system, but similarly to our research, in an integrated sustainable closed-loop supply chain network. For this purpose, they used the fuzzy approach to control the uncertainty parameters. To investigate the problem in larger dimensions, a real case study (Tehran province) has been used.
Similar research problems were also solved in other research using different methods. The results of the literature review are presented in
Table 1.
By examining the literature and comparing the characteristics of articles in
Table 1, it can be stated that the principal decision variables in supply chain network models include decision variables of the location of potential facilities and optimal allocation of product transfer between different levels of the supply chain network. In this paper, in addition to decision variables of location and allocation, the decision variables related to vehicle routing, due to its importance in preventing congestion and transmission of the COVID-19 virus, are also considered. On the other hand, various solution methods have been used to solve supply chain network problems in the literature review. The neutrosophic fuzzy method, selected in this paper to solve the three-objective model, has been used due to its high efficiency in achieving near-optimal solutions (
Zhen et al. 2020). The efficiency of the solution method is also compared with the LP metric method as another solution method in the literature review.
According to the literature review, the main features of this paper are as follows:
Consider the location allocation and routing issues together.
Distribution and collection of medical supplies to the hospital, taking into account the COVID-19 pandemic conditions.
Using a new neutrosophic fuzzy programming method to solve a three-objective model.
3. Problem Definition and Modelling
In this paper, a sustainable closed-loop supply chain network model under the COVID-19 pandemic conditions is modelled. According to
Figure 1, the designed supply chain network is a combination of a forward supply chain network, including raw material suppliers, production centres, distribution centres, and hospitals, and a reverse supply chain network including recycling centres and disposal centres. In this network, suppliers send the parts needed to produce medical equipment to production centres, and after the production of medical equipment, they are sent to hospitals by distribution centres. In this network, the distribution of medical equipment in each period and the collection of returned medical equipment in the form of vehicle routing are included. In the reverse chain, certain recyclable medical equipment is sent to recycling centres. In this centre, part of the medical equipment is sent to the production centre for reproduction and the rest is sent to the destruction centres for destruction. The distribution and collection of medical equipment are made in a specific time window to prevent the congestion of vehicles and related persons. The main goal is to observe the time interval in the distribution and collection of medical equipment to prevent the transmission of the COVID-19 virus.
In the proposed model, two strategic and tactical decisions are considered simultaneously. In strategic decisions, the goal is to select the optimal production, distribution/collection centres, and recycling centres. In tactical decisions, the goal is to optimally allocate the flow of medical equipment between centres and determine the optimal routing of vehicles for the distribution and collection of medical equipment to hospitals at intervals to prevent the transmission of the COVID-19 virus. Therefore, in order to simultaneously achieve the stated strategic and tactical goals, the following assumptions must be considered:
Demand, rate of return of medical equipment, and transfer costs are considered uncertain and fuzzy triangular numbers.
Deficiencies are not allowed, and all hospital requests for all medical equipment must be met.
The location of hospitals is already known.
Medical equipment must be transported to hospitals in a specific time window to prevent the transmission of COVID-19.
The capacity of the facility is already known.
Distribution and collection centres are considered as dual centres.
According to the above assumptions, closed-loop supply chain network modelling under uncertainty conditions, in order to simultaneously optimise the total costs of the supply chain network design, minimise product transfer time, and minimise the number of vehicles to reduce traffic and transmission COVID-19, is modelled as presented in
Table 2.
Due to the dynamic nature of certain important parameters (including transportation costs and demand) that are beyond planning and the availability, and even unavailability, of historical data required at the design stage, these parameters are mainly based on expert opinions and experiments. Therefore, the above ambiguous parameters are formulated as uncertain data in the form of fuzzy triangular numbers as follows:
It is worth noting that estimating transportation costs and demand is difficult and sometimes even impossible for long-term decisions. Even if one can estimate a possible distribution function for these parameters, these parameters may not behave similarly to previous data. Therefore, these parameters, which change in a long-term planning horizon, are considered fuzzy data. According to the expression of the sets, parameters, and decision variables expressed, the supply chain multi-objective network design problem is modelled as a complex integer linear mathematical programming model as follows:
Equation (1) shows the first objective function of the problem and includes the minimisation of facility location costs, transmission, and operational costs of the distribution and collection of medical equipment. Equation (2) seeks to minimise the time of distribution and collection of medical equipment to/from hospitals. Equation (3) is also a function of the third objective of the problem and seeks to use at least some vehicles to reduce traffic and transmission of the COVID-19 virus. Equations (4) and (5) show the total amount of medical equipment distributed and collected by each distribution/collection centre. Constraint (6) ensures that each distribution/collection centre can only be assigned to one customer. Constraints (7) and (8) indicate the maximum transport capacity for the vehicle’s distribution and collection of preservative equipment. The restriction Constraint (9) is related to the removal of the net below. Constraint (10) guarantees that the vehicle can enter and leave each hospital only once. Constraints (11) and (12) ensure that the starting and ending points are distributing and collecting medical equipment to and from hospitals and distribution/collection centres. Equation (13) shows the amount of medical equipment transferred from the production centre to the distribution centre. Equation (14) shows the equilibrium relationship in the production centre. Equation (15) shows the total amount of medical equipment collected by each collection centre. Equations (16) and (17) calculate the percentage of recyclable and non-recyclable medical equipment, respectively. Equations (18) and (19) ensure that if a distribution/collection centre is established, its maximum capacity can be used to distribute and collect medical equipment. Equation (20) shows the possibility of using the maximum capacity of the production centre if that centre is established. Equation (21) ensures that the maximum capacity of the recycling centre can be used when that centre is already established. Equations (22) and (23) show the limitations of using the maximum capacity of suppliers and recycling centres, respectively. Equations (24) and (25) show the vehicle’s arrival time at each hospital. Equation (26) shows the time window limit for distributing and collecting medical equipment to hospitals. Equations (27) and (28) show the type and gender of decision variables.
4. Solving Method
Due to the three objective functions of the proposed closed-loop supply chain network model, in this paper, two LP metric and neutrosophic fuzzy programming methods are used to optimise the three objective functions simultaneously. Therefore, each of the problem-solving methods is described below.
4.1. Neutrosophic Fuzzy Programming Method
Multi-objective decision models are the most common type of mathematical model that have conflicting goals. In such cases, the goal is to achieve the optimal value of all conflicting goal functions simultaneously. In such problems, the decision-maker expresses the importance of their preferences by providing an optimal weight β ∈ [0, 1] to each objective function, so that with the high value of the β weight in an objective function, the decision-maker’s preferences in that objective function is higher. Zimmermann (
Zimmermann 1978) maximised decision-maker preferences while simultaneously achieving objective functions by introducing a multi-objective fuzzy programming method. With the development of Russian multi-objective fuzzy programming called intuitive fuzzy programming, Faizulkhakov (
Faizulkhakov 1986) and Angelov (
Angelov 1977) solved various mathematical problems. In these planning methods, flexibility in element membership functions was also possible. This method has been extensively studied in various real-life issues and problems. In recent years, living conditions may have neutral thoughts about an element in the collection. Neutral or uncertain thoughts about the elements fall between a degree of falsehood and truth. Thus, by developing the intuitive fuzzy programming method, Smarandache (
Smarandache 1999) examined the neutrosophic fuzzy programming method, which has three sets of memberships: Truth (degree of belonging), uncertainty (degree of belonging to some extent), and falsehood (degree of non-belonging). According to the developed method of neutrosophic fuzzy programming, this paper discusses the sustainable biomass supply chain network model with the objectives of four opposite objective functions. Hence, each objective function has three functions: Truth membership, non-determination, and falsehood. Therefore, the neutrosophic fuzzy programming method plays an important role in optimising multi-objective problems by considering neutral thoughts.
Consider a multi-objective model with contrasting objective functions in which (
) represents a set of fuzzy decisions, (
) a set of fuzzy objective functions, and (
) fuzzy constraints. Therefore, the set of fuzzy decisions is represented as
. The set of fuzzy neutrosophic decisions (
) with the set of neutrosophic fuzzy objective functions (
) and the set of neutrosophic fuzzy constraints (
) is expressed as follows:
In the above equation,
is a truth membership function;
is the membership function of non-determination and
is the function of false membership under neutrosophic fuzzy decisions
. Each of the above membership functions has a top and bottom boundary, which is obtained as the following relation for all membership functions:
Therefore, the upper and lower bounds of the neutrosophic fuzzy membership function can be calculated for truth, non-determination, and falsehood, respectively.
In the above relation
and
are predefined values between 0 and 1. According to the above materials, the linear membership function for a neutrosophic fuzzy framework is as follows.
Therefore, the controlled model of the sustainable biomass supply chain network problem with neutrosophic fuzzy programming method based on the above relations is as follows:
4.2. LP Metric Method
The metric distance in the LP method is used to measure the proximity of an existing solution to the ideal solution. This criterion will be a consistent function as follows. In this method, we minimise the sum of the relative deviations of the objectives from their optimal value. Thus, for a problem with n objective functions, the optimal value of each objective function (from the first to the nth) must be calculated independently of the rest of the other n-1 objective functions, taking into account all the constraints of the problem. Since the closer the objective functions are to their optimal values, the more desirable they are, the sum of the relative deviations of the objectives from their optimal values must be minimised.
Therefore, we define the objective function as follows.
where
represents the ideal value for optimising objective
(independent of other objective functions, taking into account constraints) and
indicates the degree of importance or weight for objective
. The
compatible function must be minimised in order to minimise deviations from the ideal.
represents the parameter identifying the
. The value of
indicates the degree of greater emphasis on the largest deviations. If
this means that the largest deviation among the existing deviations is considered for optimisation. The values
p = 1 and
p = 2 are usually used in calculations. The value of the first case means that the relative sum of deviations is minimised, and the second case means minimising the sum of the second power of relative deviations.
5. Analysis of Experiments and Its Results
This part of the article presents the results and review of the designed supply chain network model (see
Table 3).
According to
Table 3, the problem parameters are shown in both deterministic and uncertainty cases. The data considered for the parameters of demand and transfer costs have three uniform distribution functions. Hence, the first value is related to the optimistic state, the second is related to the probable state, and the third is related to the pessimistic data. Given the existence of three types of data for each parameter, the fuzzy programming method should be used to convert fuzzy numbers to an accessible value. In this section, the problem is first solved with an uncertainty rate of 0.5. That is, it is assumed that the probability of occurrence is higher. Then, by changing the uncertainty rate, the demand for medical equipment changes and additional analyses have been performed on the objective functions. Accordingly, the effect of the fuzzy programming method can be observed by changing the uncertainty rate on the values of the objective functions separately.
To solve the three-objective model, two methods of neutrosophic and LP metric fuzzy programming have been used. The developed model is solved on GAMS 24.85 software and a Cplex solver. According to the steps of the two methods used in this paper, the optimal value of each objective function must first be obtained. The optimal values of the objective functions assuming (
) are shown in
Table 4.
After obtaining the optimal values of the objective functions individually, the efficient solutions of the problem are obtained according to
Table 5.
Based on the analysis of efficient solutions by two methods, it is observed that to increase the distance and time of transfer of medical equipment to hospitals, more vehicles are needed, leading to increased transportation costs and, consequently, network design costs. On the other hand, the total transfer time decreased with the increase in the number of vehicles for the distribution and collection of medical equipment to/from hospitals. Therefore, it can be stated that in order to reduce COVID-19 transmission, fewer vehicles can be used, which leads to a reduction in the total cost of network design.
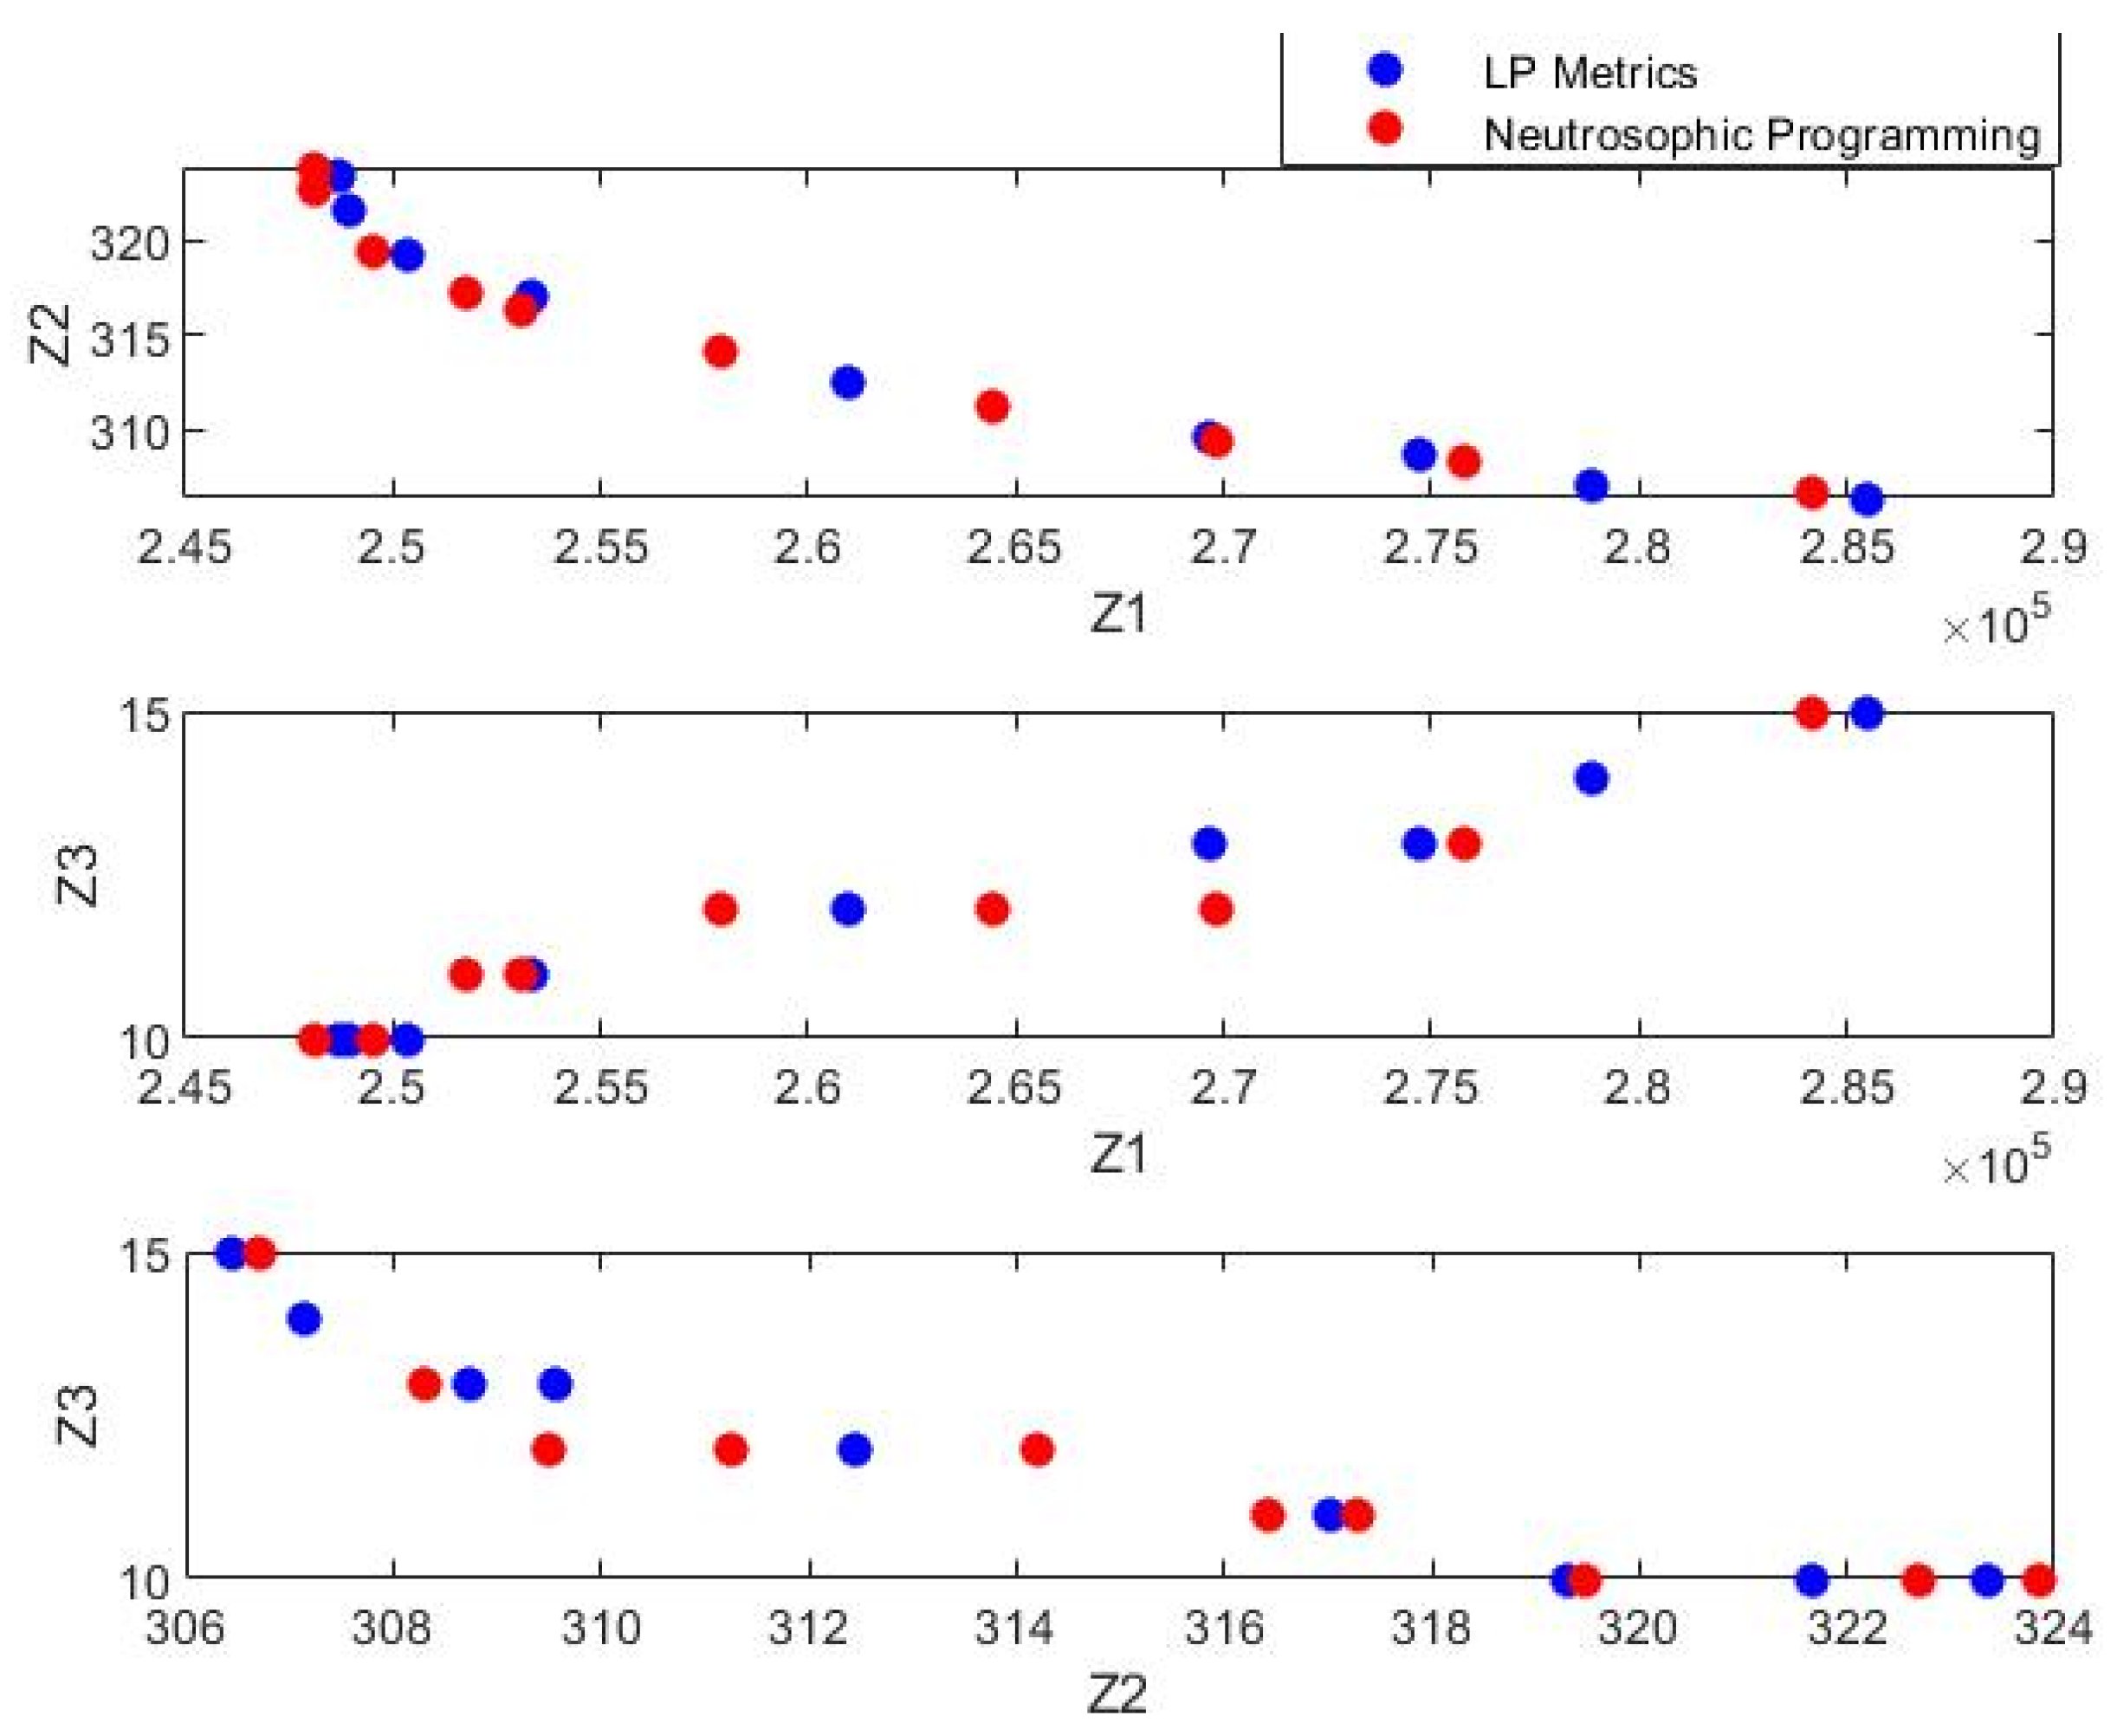
Figure 2 compares the Pareto front resulting from problem-solving with two LP metric and neutrosophic fuzzy programming methods. The findings of the Pareto front resulting from the solution of the problem show that by decreasing the transfer time of medical equipment as well as increasing the number of vehicles, the costs of the supply chain network increase due to the increasing in the number of selected facilities and the transfer route. Furthermore, with the increase in the number of vehicles, the delivery time of medical equipment to the hospital decreased.
In order to evaluate the results of the model developed in
Table 6, the locations of potential facilities, including production, distribution/collection, and recycling centres, are shown for the first efficient solution obtained from the two solution methods.
According to the location of the facilities obtained from
Table 6, it can be stated that the number of potential facilities required to supply medical equipment to hospitals is two production centres, two distribution/collection centres, and two recycling centres. Moreover, according to the operators of each of the solution methods, the optimal locations of the facilities obtained in the two solution methods are different from each other. After determining the optimal location of the facility and making strategic decisions,
Table 7 shows the optimal transportation routing for the distribution and withdrawal of medical equipment to hospitals concerning vehicle traffic to prevent the transmission of COVID-19.
By examining the routing of the obtained vehicle in all periods for the distribution of medical equipment and its collection, it is observed that 10 vehicles are needed to meet the objectives of the problem. Finally,
Table 8 shows the optimal flow allocated between all levels of the supply chain network.
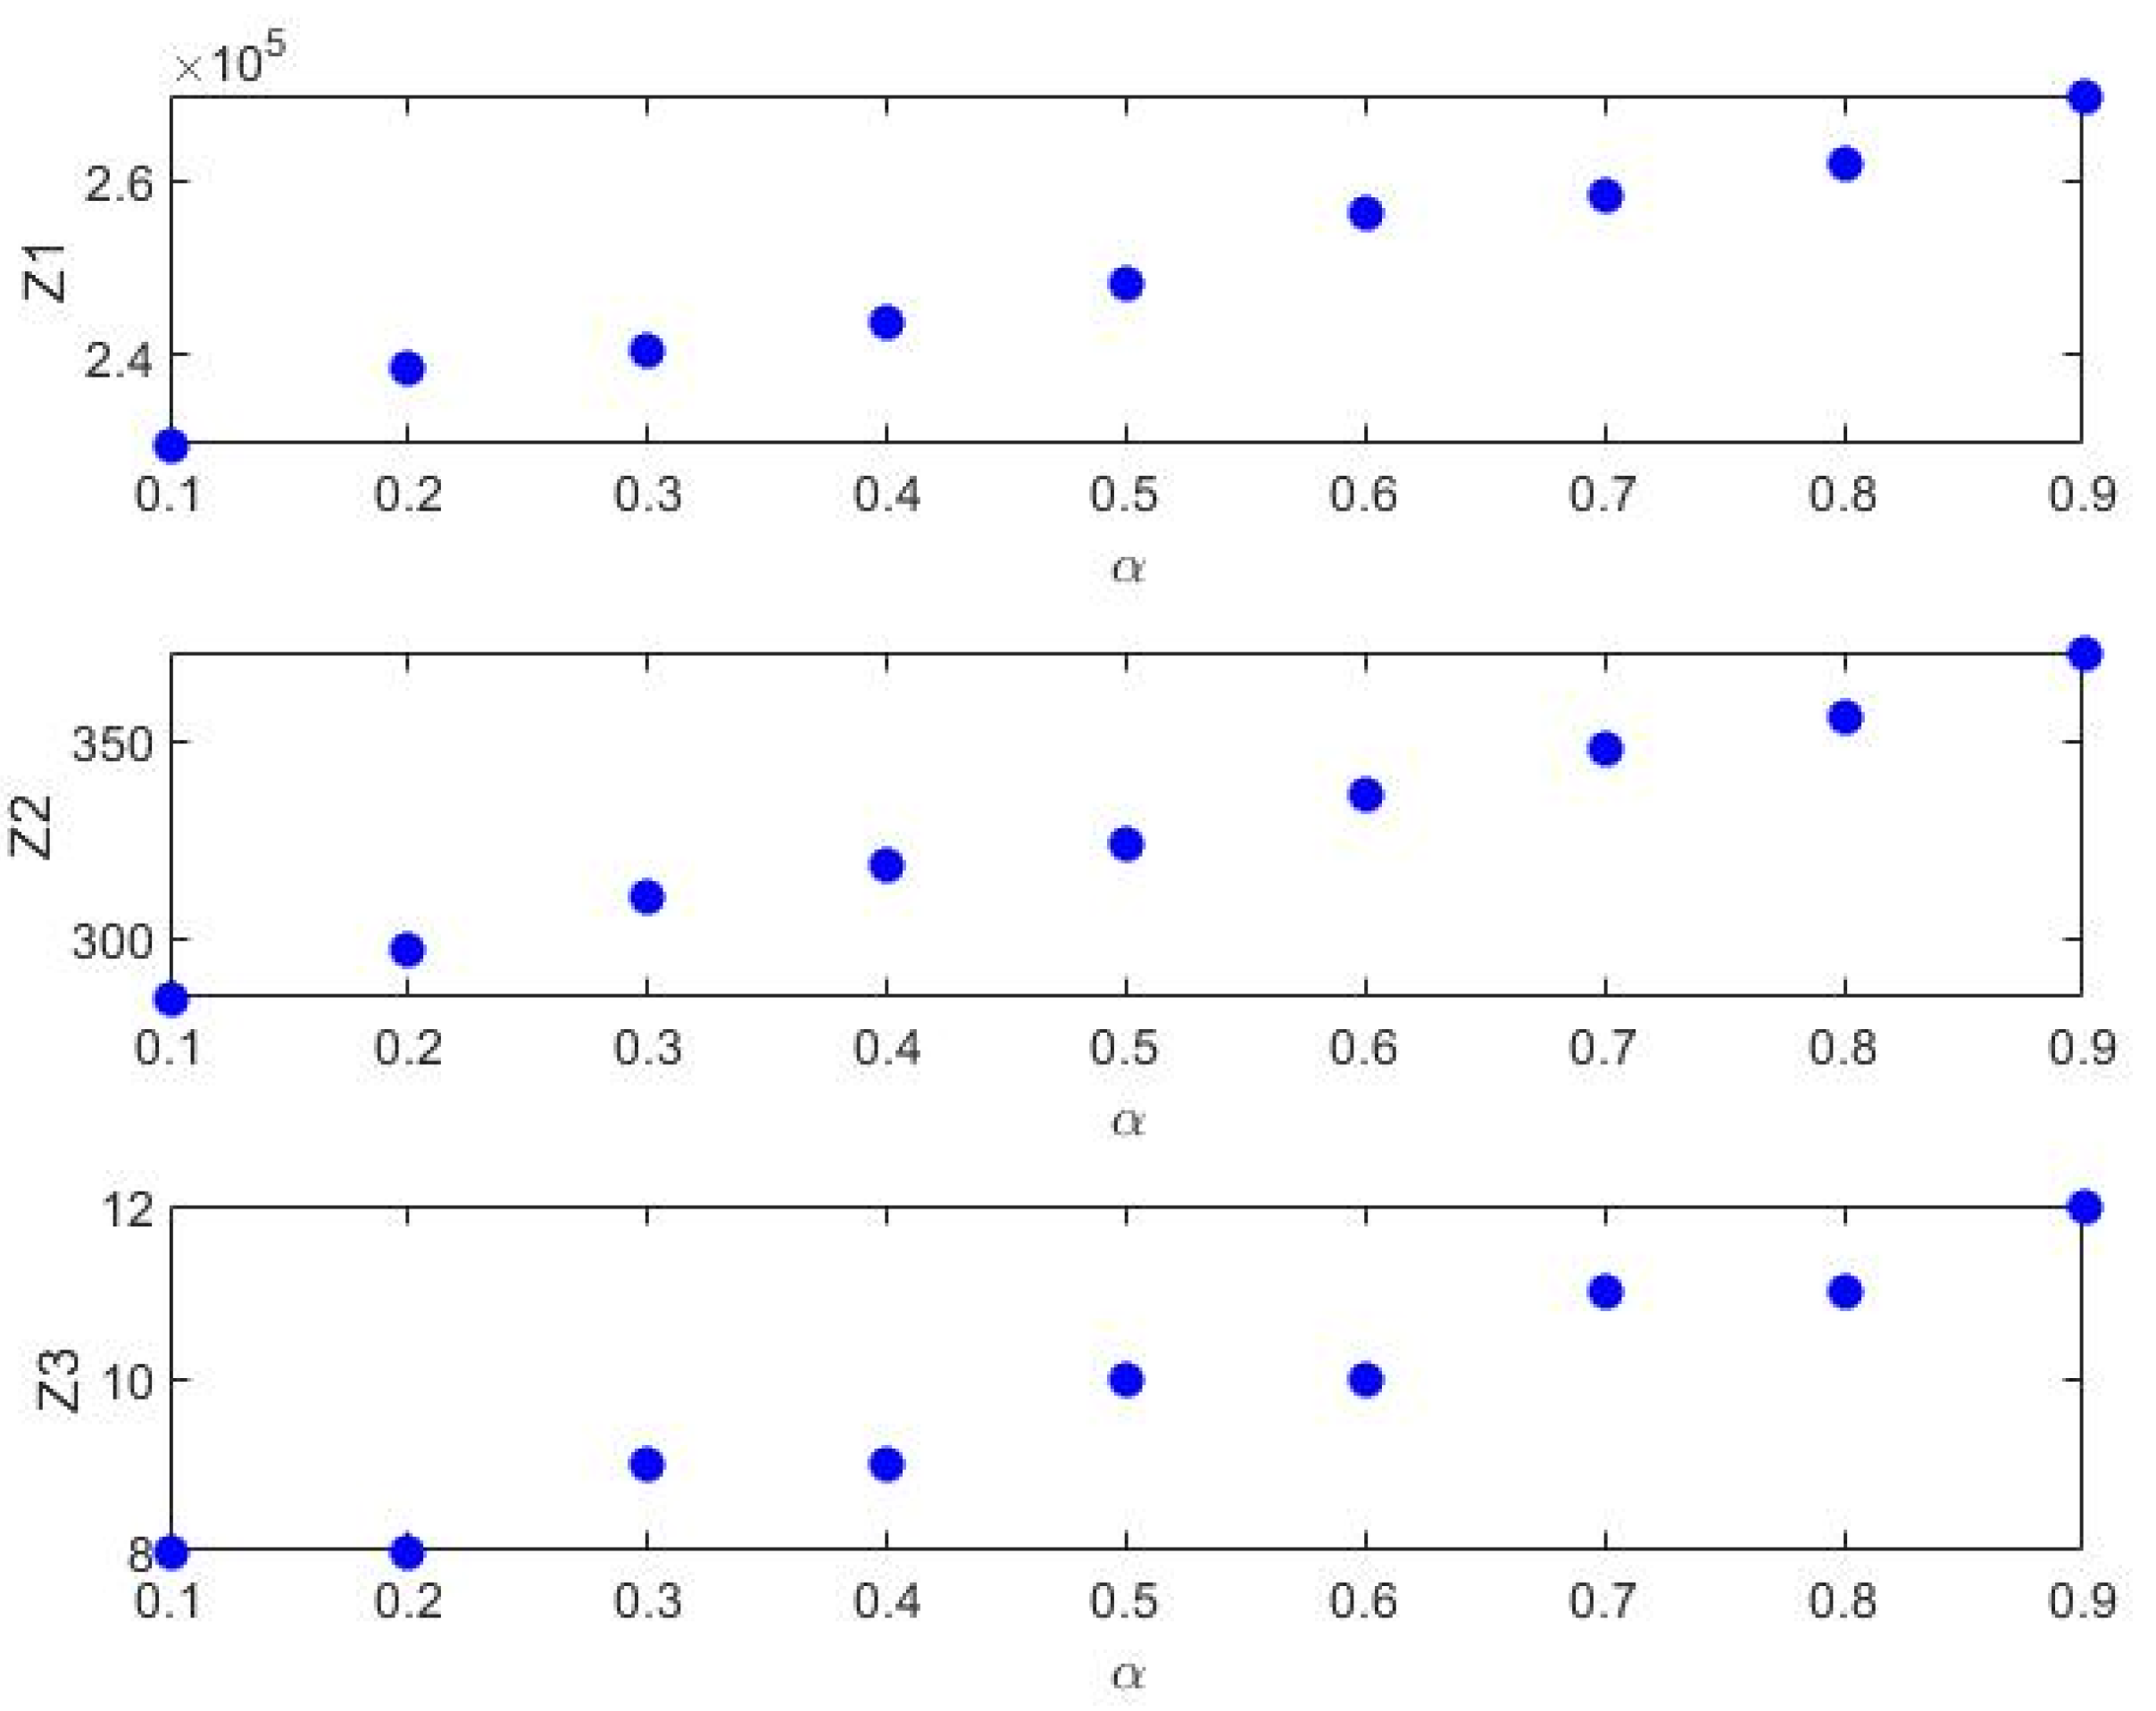
Due to the uncertainty of the closed-loop supply chain network model, this section examines the effect of the Go uncertainty rate on changes in objective functions. Hence, the uncertainty rate varies from 0.1 to 0.9 and its effects on the values of the objective functions are shown in
Table 9. It should be noted that the effect of uncertainty rate changes on the objective functions occurs on the first efficient solution obtained from the neutrosophic fuzzy programming method.
According to
Table 9, it is observed that with the increase in the uncertainty rate, the amount of demand for hospital medical equipment as well as the amount of product return has increased, and accordingly, more vehicles have been used for distribution and collection. Additionally, with the increase in demand, the amount of product flow in the supply chain network increased and the cost and time of transferring medical equipment to hospitals increased. Calculations also show that the probability of using vehicles in the supply chain network increases with increasing demand uncertainty, and the possibility of transmitting the Sars-Cov-2 virus increases as well. Therefore, with proper planning in the conditions of pessimistic demand, such as the construction of warehouses near hospitals, the lowest number of vehicles should be used to distribute medical equipment.
Figure 3 shows the trend of changes in the values of the objective functions for different uncertainty rates for the problem under study.
The different number of efficient solutions obtained from different methods shows the effectiveness of the solution method operators in solving the optimisation problems. Therefore, this section investigates the comparison indices of efficient solutions obtained from solving the sample problem between the LP metric and neutrosophic fuzzy programming methods. The basis for comparing the performance of the two methods used in this paper is the use of indicators such as the means of objective functions, the number of efficient answers (NPF), maximum amplitude (MSI), metric distance (SM), and computational time (CPU-Time).
Table 10 summarises the results of comparing the efficient solutions between the two solution methods.
Comparing the comparison indices, it is obvious that the neutrosophic fuzzy programming method is more efficient than the LP metric method in terms of achieving better objective functions in the shortest time.
6. Discussion and Conclusions
In this paper, a closed-loop supply chain network decision problem is modelled considering uncertainty and other conditions caused by the COVID-19 pandemic. The topic of the paper is relevant due to several reasons confirmed in the literature:
(3) VRP has become even more critical during the pandemic since uncertainty was so high that flexible optimization and planning solutions were needed (
Jiang et al. 2020).
In order to prevent the transmission of the Sars-Cov-2 virus, the model was designed to distribute and collect medical products to and from hospitals in the shortest time with the lowest cost and lowest vehicle traffic in predefined time windows. Due to the uncertainty in environmental conditions, demand parameters, returned products, and transfer costs, fuzzy triangular numbers were considered. Therefore, it was necessary to use the fuzzy programming method to control the model and use LP metric methods and neutrosophic fuzzy programming to solve the three-objective model. After modelling and problem solving, it was observed that to decrease the distance and time of transfer of medical equipment to hospitals, more vehicles are needed, and this leads to an increase in transportation costs and consequently the costs of designing the supply chain network. On the other hand, the total transfer time decreased with the increase in the number of vehicles for the distribution/withdrawal of medical equipment to/from hospitals. Therefore, it can be stated that to reduce COVID-19 transmission, fewer vehicles can be used, which leads to a reduction in the total cost of network design. However, with the reduction of the number of vehicles, the time of timely transfer of medical equipment to the hospital for use in hospital wards will increase sharply. The set of efficient answers shows that when 10 vehicles are used to distribute medical equipment, the cost of designing the supply chain network will be less than 250,378.08 units, while the transfer time of medical equipment will be more than 319.31 units. Therefore, to reduce the transfer time to less than 307.14, 15 vehicles should be used.
In addition, with the increase in the uncertainty rate, the amount of demand for hospital medical equipment as well as the amount of product returned has increased, and accordingly, more vehicles have been used for distribution and collection. Moreover, with the increase in demand, the amount of product flow in the supply chain network increased and the cost and time regarding transferring medical equipment to hospitals increased. Calculations also showed that the probability of using vehicles in the supply chain network increases with increasing demand uncertainty, as well as the possibility of transmitting the COVID-19 virus increases. Therefore, with proper planning in the conditions of pessimistic demand, such as the construction of warehouses near hospitals, the lowest number of vehicles should be used to distribute medical equipment. Changes in the uncertainty rate from probable to pessimistic also show that with the uncertainty rate increasing from 0.5 to 0.9, the number of vehicles increased by 2 units and network design costs increased by 8.76%. At the same time, the transfer time was reduced by 15.02%.
Those findings provide valuable insights for decision-makers and propose a possible way to deal with the complex decision-making situation in an unstable environment, e.g., during the pandemic, different kinds of critical situations, unplanned changes, sudden phenomena, etc. Therefore, the outcomes of this study, even if described in a limited manner and for the chosen sector, can be useful for many decision-makers with similar issues that need solving.
However, the model designed for a sustainable supply chain network for the transfer of medical equipment is considered in accordance with the COVID-19 pandemic. Decision variables, as well as the objectives of the issue, indicate that more distribution centres with a minimum number of vehicles should be used to reduce the transmission of the COVID-19. In this case, the problem is modelled on allocation and supply chain network design costs increase. If vehicle vestibule routing is used to distribute and collect medical equipment, in addition to reducing costs, the equipment can be delivered to hospitals in a convenient time window. This leads to no congestion of vehicles in the transmission route of equipment and minimal contact between people. As a result, the transmission of COVID-19 is significantly reduced. Then, at the same time, the equipment needed by the hospitals, which have been used as treatment centres for patients with the COVID-19, is fully supplied.
However, despite the value of this work, it has a few limitations. Firstly, in this research, there was no access to real-world data such as the cost, demand, and amount of returned equipment of hospitals, which can cause failure in solving the more complex and real-size problems due to NP-Hardness of the problem and software limitations. Secondly, the usefulness of solving real-life problems during the COVID-19 pandemic is limited because it persists, therefore final conclusions about the value of the presented method can be assessed after the end of the pandemic, or even later.
Therefore, the research problems presented in this study, as well as the method proposed to solve them, should be validated for similar situations, on the basis of real-life data, with future decision-making problems in the same or other economy sectors.


