Article

COVID 19 and Bank Profitability in Low Income Countries: The Case of Uganda

Economic Research Department, Bank of Uganda, Kampala P.O. Box 7120, Uganda
J. Risk Financial Manag. 2021, 14(12), 588; https://doi.org/10.3390/jrfm14120588
Submission received: 19 October 2021 / Revised: 19 November 2021 / Accepted: 25 November 2021 / Published: 7 December 2021

Abstract

:
This study investigates the impact of the COVID-19 pandemic on banking sector profitability in Uganda for the period spanning Q1 2000 to Q1 2021, using the autoregressive distributed lag (ARDL Bound) testing approach to co-integration while controlling for bank specific and macroeconomic determinants of bank profitability. Bank profitability is proxied by return on assets (ROA), return on equity (ROE), and net interest margin (NIM). The study finds that the COVID 19 pandemic has a significant negative effect on bank profitability only in the long run. Generally, the explanatory variables used in the study have short run and long run effects on bank profitability, although the impact is not uniform across the different measures of bank profitability. In the short run, bank profitability is generally negatively and significantly affected by the non-performing loans ratio, liquidity ratio, and market sensitivity risk, while the Treasury Bill interest rate and lending rate have a significant positive effect on bank profitability. In addition, the study finds that bank profitability has a tendency to persist in the short run, although persistence is only moderate, suggesting that the Ugandan banking sector may not have large deviations from a perfectly competitive market structure. In the long run, bank profitability is broadly positively and significantly affected by the non-performing loan ratio;, real GDP, lending rate and Treasury Bill interest rate while market sensitivity risk and the exchange rate significantly and negatively affect bank profitability. Surprisingly, the study finds inflation does not significantly affect bank profitability over both the short- and long-term.
JEL Classification:
E44; E59; G01; G10; G21; G29; L10

1. Introduction

The COVID-19 pandemic caused a significant global economic shock, triggering the deepest global economic recession in nearly a century (OECD 2020, n.d.). Although the global economy is on the journey to recovery, the rebound is expected to be uneven across countries, with strong growth in major economies even as many developing economies lag (World Bank 2021). Sub-Saharan African countries are among the most severely affected by the pandemic and are expected to have suffered serious setbacks in development and per capita income gains by at least a decade (African Development Bank 2021; World Bank 2021). Ongoing implementation of large-scale containment measures by governments and uncertainty regarding the duration of the pandemic continue to adversely affect economic and financial conditions in developing countries, making the recovery more varied, difficult and uncertain.
The African financial sector has not been spared from the pandemic, which exposed financial institutions to extraordinary operational and financial challenges. The COVID-19 pandemic contributed to a sharp rise in defaults of corporate and household debt, adversely affecting the financial performance of banks and their ability to intermediate credit and support an economic recovery (Minney 2020; Tyson 2020; Barua and Barua 2020). Indeed, the average return on equity for African banks fell by 50 percent to 7 percent in 2020, although this is expected to rebound to near pre-crisis levels within the next three years if economic recovery on the continent continues on the expected trajectory (Jurd de Girancourt et al. 2021). Regulators have, since the onset of the pandemic, taken steps to ensure financial stability and reduce the risks to the banking system. Nevertheless, an understanding of the effects of the COVID-19 pandemic on banks profitability in developing countries is critical given their pivotal role in Africa’s resilience and recovery. Understanding the effects of the pandemic on banks requires a careful case by case examination (Barua and Barua 2020).
To this end, this paper investigates the impact of the COVID-19 pandemic on the profitability of the banking sector in Uganda, given the paucity of empirical research on the impact of the COVID 19 pandemic on bank performance in the context of developing countries. In investigating the impact of the COVID 19 pandemic on banking sector profitability in Uganda, the study controls for bank specific factors such as non-performing loans ratio, liquidity ratio, and market sensitivity, as well as macroeconomic specific indicators such as real GDP, inflation, nominal exchange rate, lending rate and the Treasury Bill interest rate. The analysis is carried out using the autoregressive distributed lag (ARDL) cointegration framework and data spanning the period spanning Q1 2000 to Q1 2021. Bank profitability is proxied by return on assets (ROA), return on equity (ROE) and net interest margin (NIM). To the best of our knowledge, no previous empirical study has explicitly investigated the effect of the COVID 19 pandemic on bank profitability in developing countries.
The paper is structured as follows: Section 1 gives a brief introduction, Section 2 provides an overview of the literature on bank profitability, followed by Section 3, which gives an overview of the banking sector in Uganda, while Section 4 describes the methodology and estimation technique employed, namely, the autoregressive distributed lag (ARDL) bounds-testing approach introduced by Pesaran et al. (2001). In Section 5 the results are reviewed with a discussion of econometric analyses, while Section 6 draws some conclusions and makes policy recommendations.

2. Bank Profitability and the COVID-19 Pandemic

Due to the central role banks play in the economic welfare, growth and development of nations, banking performance continues to generate attention from industry experts, policy makers and researchers alike. The most common measure of bank performance is profitability, which is often proxied by profitability ratios like return on assets (ROA), return on equity (ROE) and net interest margin (NIM) (Sufian and Habibullah 2009; Rahman et al. 2015; Kumar et al. 2020; Titko et al. 2015). In the vast extant literature, bank profitability is generally expressed as a function of internal (bank specific) and external (macroeconomic and industry-specific) factors (Titko et al. 2015; Sufian and Habibullah 2009; Rahman et al. 2015). However, the contribution of various internal and external factors to bank profitability in emerging and developing economies remains a subject of contention largely due to the mixed and sometimes contradictory empirical results in the literature1.
For instance, Ozili (2021) found that consistency in determinants of bank profitability varied across countries and profitability measures. The study’s comparative analysis showed that the steadiest determinants of bank profitability in Nigeria were overhead cost to total asset ratio and cost efficiency ratio, while in south Africa it was the capital adequacy ratio and overhead cost to total asset ratio; and in the United States none of the determinants of bank profitability had a statistically significant affect on NIM, although for ROA and ROE, capital adequacy ratio and size of non-performing loans were the most consistent determinants of bank profitability. In addition, for the three countries taken together and across the three measures of bank profitability (ROA, ROE and NIM), the steadiest determinants of bank profitability were cost efficiency, the size of non-performing loans, and overhead cost to total asset ratio. Among the inconsistent determinants was inflation, which was significant and negatively related to NIM but insignificantly related to ROA and ROE, while GDP growth was significant and positively related to ROA and ROE but insignificantly related to NIM. He also found that NIM and ROA were higher in Nigeria and lowest in the United States, suggesting that the Nigerian banking sector was more profitable than the US banking sector, while inflation and GDP growth were lower in the United States and much higher in Nigeria, suggesting that the United States enjoyed greater macroeconomic stability compared to Nigeria. The study therefore concluded that the determinants of bank profitability vary across countries on account of country-specific characteristics such as the nature of banking systems, the level of financial sector development, and banking regulation and supervision.
Among the studies that highlight the variation in the determinants of bank profitability across countries is that by Boateng (2018). While examining the bank-specific and macroeconomic factors affecting bank profitability, the study found that credit risk, net interest margin, capital adequacy and inflation significantly affected the profitability of banks as measured by ROA in both Ghana and India. In contrast, liquidity risk and GDP growth were found to have insignificant effects on bank profitability in both countries, while cost to income ratio and bank size had insignificant effects on Indian bank profitability but were highly significant for Ghanian bank profitability. On the other hand, Almaqtari et al. (2019) found that bank size, the number of branches, assets management ratio, operational efficiency, and leverage ratio were key bank specific factors in explaining the profitability of Indian commercial banks as measured by ROA, while ROE was positively and significantly affected by asset quality ratio, asset management ratio, bank size, and liquidity ratio. In addition, ROE is significantly affected by gross domestic product, inflation rate, interest rate, financial crisis and exchange rate, while demonization, interest rate, exchange rate, and inflation rate are found to have a significant impact on ROA.
In addition, the determinants of bank profitability also appear to vary within countries over time. For instance, Sufian and Habibullah (2009) and Rahman et al. (2015) examined the factors affecting bank profitability proxied by ROA, ROE and NIM in Bangladesh and both studies found that loans intensity positively and significantly affected bank profitability. Sufian and Habibullah (2009) also found non-interest income, credit risk and cost significantly affected all three measures of bank profitability while Rahman et al. (2015) found that capital strength (both regulatory capital and equity capital), cost efficiency and off-balance sheet activities significantly affected all three measures of bank profitability. In addition, Sufian and Habibullah (2009) also found that the impact of size was not uniform across all employed measures of bank profitability and macroeconomic determinants did not significantly affect bank profitability with the exception of inflation which had a negative relationship with Bangladesh banks’ profitability proxied by NIM. Rahman et al. (2015) also found inconsistent effects of other variables employed in the study such as non-interest income, credit risk and GDP which were key determinants for NIM, while size had a positive and significant impact on ROA and inflation had a negative and significant impact on ROA and ROE.
Further Adelopo et al. (2018) examined the behavior of the determinants of bank profitability in the periods prior to, during and post the global financial crisis in the Economic Community of West African States. The study found that ROA before, during, and after the financial crisis was significantly affected by cost management, liquidity and size while the effect of bank specific factors such as market power, credit risk and capital strength and macroeconomic factors such as gross domestic product and inflation was sensitive to the applied periods of analysis and bank profitability measure. The study thus concluded that overall the financial crisis had no effect on relationships between some bank-specific determinants and bank profitability.
Le and Ngo (2020) found that the amount of automated teller machines (ATMs), point of sale (POS) terminals and bank cards issued could improve bank profitability in the 23 countries covered in their study while market power has a negative impact on profitability of banks, which may be suggestive of the beneficial effects of competition on bank profitability. In addition the study also found that greater financial development increased bank profitability, an indication of the importance of financial market development for the profitability of the banking sector. Importantly, banking systems faced with higher credit risk, charged higher interest rates in order to compensate for the associated default risk. Further, the global financial crisis and economic growth significantly affected bank profitability. Kohlscheen et al. (2018) analyzed key determinants of bank profitability in 19 emerging market economies and found a tendency to reduced profitability following higher short-term rates arising from increased funding costs while higher long-term interest rates are associated with increased profitability. In addition, during normal periods, credit growth appears to be crucial for bank profitability than GDP growth while rising sovereign risk premia significantly reduced bank profits, highlighting the need for credible monetary and fiscal frameworks in maintaining overall financial stability.
The emergent body of literature on effects of the COVID-19 pandemic on the banking sector remains mostly applicable to advanced economies (Barua and Barua 2020), even while the pandemic is expected to more adversely affect banking systems in low income countries especially where banks remain the leading providers of financial services (Damak et al. 2020). Among the few available studies in the context of emerging and developing countries is Elnahass et al. (2021) and Barua and Barua (2020). Elnahass et al. (2021) examined the impact of the ongoing COVID-19 pandemic on global banking stability and found the COVID-19 outbreak adversely affected both financial stability and financial performance. The results were consistent across in various regions and countries in the global banking sector as well as at different levels of country income generation and bank characteristics. In addition, the study found the pandemic had significant variation in its impact on conventional and Islamic banking systems although the bank stability signal for recovery in the second quarter of 2020 was identified from trend analyses based on financial stability over quarterly periods and bank average performance.
While looking at the banking sector in Bangladesh, Barua and Barua (2020) examined the potential effects of the COVID-19 pandemic on firm value, capital adequacy, and interest income under different NPL shock scenarios and found that the pandemic will likely adversely affect all banks’ capital adequacy ratios, interest income and risk-weighted asset values at both sectoral and individual bank levels although larger banks are likely to be more hard hit. In addition, in the event NPL shocks are greater, the decline in firm value, capital adequacy, and interest income will increase disproportionately. Even more concerning is the finding that all banks capital adequacy could fall under the minimum BASEL-III requirement in the event of a 10% NPL shock while a shock of 13% or more will likely cause a fall in banks capital adequacy to zero or negative at the sectoral level and as such the authors suggest urgent policy action is necessary to address the crisis in order to avert a potentially large-scale and contagious banking crisis in Bangladesh.
Thus this paper contributes to the extant literature by providing empirical evidence on the effect of the COVID-19 pandemic on bank performance in Uganda given the paucity of literature in the context of developing countries. More specifically, the study investigates the effect of the COVID-19 pandemic on bank profitability while controlling for bank specific factors like non-performing loans ratio, liquidity ratio and market sensitivity and macroeconomic determinants such as real GDP, inflation, nominal exchange rate, lending rate and the Treasury Bill interest rate.

3. An Overview of Uganda’s Banking Sector

In the period preceding the early 1990s, Uganda’s banking sector was considered weak, one of the least developed in sub-Saharan Africa, characterized by inefficiency, a lack of competition, heavy government ownership and control as well as a low degree of monetization of the economy (De Zoysa et al. 1995; Kuteesa et al. 2010; Bigsten and Kayizzi-Mugerwa 2001). The structural deficiencies of the financial sector manifested through the lack of confidence in the banking system, which was exacerbated by the 1987 currency reform that was accompanied by a 30 percent tax on currency in circulation, bank balances, and financial assets, high inflation and negative real interest rates between 1985 and 1988 (De Zoysa et al. 1995). The banking system was dominated by government-owned banks like Uganda Commercial Bank (UCB) which had more than half the deposits in the system and four foreign managed banks holding an additional 30 percent of deposits (De Zoysa et al. 1995; Bigsten and Kayizzi-Mugerwa 2001). In the decade following the early 1990s, the government in partnership with multilateral agencies such as the IMF began a series of financial sector reforms which included privatization of government-owned banks, adoption of indirect instruments of monetary policy, interest rates liberalization, banking legislation renewal, central bank restructuring, and other reforms (De Zoysa et al. 1995; Bigsten and Kayizzi-Mugerwa 2001; Kuteesa et al. 2010). In general, the main goal of the reforms was to improve banking sector efficiency and promote financial sector deepening and, since then, the banking sector has registered remarkable recovery and development.
As shown in Table 1, the banking sector has grown considerably over the last two decades, growing from 20 commercial banks with a total asset base of UGX 1.35 trillion, representing average assets per regulated bank of UGX 0.07 trillion in 1999 to 25 commercial banks with a total asset base of UGX 38.30 trillion, representing average assets per regulated bank of UGX 1.53 trillion in 2020 (see Table 1). Total banking sector assets are mainly funded by customer deposits and as at December 2020, approximately 57 per cent of Uganda’s banking sector assets are held by five banks, four of which are foreign owned. In addition, asset quality, which is measured by the ratio of non-performing loans to total gross loans and advances (NPL ratio) in the commercial banks, improved markedly from 26 percent in 1999 following the closure of insolvent banks and restructuring of weak banks during this time to 5.3 percent 2020.
The supervision and regulation of banking activity is vested in the Bank of Uganda (BOU), whose prudent regulatory and supervisory policies continue to support the development of the financial sector. Despite the growing number of financial institutions offering diversified services, the financial system remains dominated by the commercial banking sector, which is comprised of 25 commercial banks and 565 branches (Bank of Uganda 2020a, 2020c). Notwithstanding, partnerships are developing between traditional banks and fintechs such as mobile money operators to provide banking and other services to millions of the unbanked (Mawejje and Lakuma 2017; Katusiime 2021; Lwanga Mayanja and Adong 2016; Bank of Uganda 2020a). Recent data show the continued proliferation of electronic payment systems and digital banking services in Uganda, partly driven by the promotion of cashless transactions usage as a measure to reduce the risk of COVID-19 transmission by financial institutions. In the year ended June 2020, active users of internet and mobile banking services grew to by 36.7 percent and 46.9 percent, respectively, while the number of active credit card users grew by 8.2 percent relative to the previous year (Bank of Uganda 2020b). In contrast, the number of active debit card users declined marginally by 0.6 percent over the same period. Further, in the year to June 2020, the value and number of point-of-sale (POS) transactions rose by 14.5 percent and 27.5 percent, respectively.
Uganda’s banking sector is set to be adversely affected by the COVID-19 pandemic as a result of the slowdown in economic activity and its adverse impact on the financial condition of households and businesses and their ability to service their debt with an adverse knock-on effect on the financial performance of banking institutions (Bank of Uganda 2020b). The onset of the COVID-19 pandemic and the resultant containment measures posed an unprecedented shock to the banking sector to the extent that if the central bank had at the beginning of the COVID-19 pandemic enforced a three-month customer loans repayments holiday, more than half of Uganda’s commercial banks would have collapsed (The East African 2020; Bank of Uganda 2020b). While the banking sector continues to grow, as evidenced by the 20.3 percent increase in bank accounts to 17 million by June 2020 (Twaha 2021), bank performance declined following the onset of the COVID-19 pandemic and the necessary measures to contain it (See Table 1). Asset quality, which is measured by the non-performing loans ratio (NPL ratio), deteriorated in the commercial banks from 3.4 percent in 2018 to 4.9 percent and 5.3 percent in 2019 and 2020 respectively, while the profit and loss statements of the commercial banks show limited improvement in the profitability of the sector, with earnings of the sector at an aggregate level as depicted by the ratio of ROA and ROE falling to 1.8 percent and 10.3 percent, respectively.
However, the banking sector remains resilient, supported largely by BOU’s macro prudential policy measures aimed at moderating the impact of the pandemic on banks’ performance and the financial system as a whole. BOU implemented several decisive measures, including maintaining an accommodative monetary policy stance, instituting emergency liquidity assistance for banks, providing credit relief measures to borrowers, and putting a moratorium on bank dividend payments to build up capital and liquidity reserves (Bank of Uganda 2020b). Overall, the BOU continues to monitor and address emerging risks to financial sector stability, given the ongoing concerns related to the uncertainty of the duration of the pandemic and containment measures as well as the pace of the economic recovery and its effect on the performance of banks (Bank of Uganda 2020a, 2020b).
Thus, an understanding of the effects of the ongoing COVID-19 pandemic on bank performance in Uganda is essential and would inform existing efforts to support the banking sector against the ravages of the COVID-19 pandemic. To the best of our knowledge, an investigation of the impact of COVID-19 on bank profitability in low income African economies like Uganda’s has not been done previously. It is against this backdrop that this paper makes a contribution to the existing literature by providing empirical evidence on the effect of the COVID-19 pandemic on bank performance in Uganda, a typical developing country, while controlling for bank-specific and macroeconomic determinants of bank profitability.

4. Methodology

4.1. Model Specification

This study applies the ARDL cointegration technique to investigate the relationship between bank profitability and the COVID 19 pandemic crisis while controlling for bank specific and macroeconomic determinants. The technique developed by Pesaran et al. (2001) is parsimonious for empirically analysing the long-run relationships and the short-run dynamic interactions among the variables because it relies on a single equation which estimates simultaneously both the short-run and the long-run relationships, making it easy to implement and interpret. The ARDL approach is less restrictive and is applicable whether the underlying variables are integrated of order zero I(0), order one I(1), or have mixed orders of integration, but it is inapplicable for variables with orders integration of 2 or higher (Bahmani-Oskooee et al. 2010; Morley 2006; Pesaran et al. 2001). Moreover, the ARDL model is robust for small sample sizes (Narayan 2005; Pesaran and Shin 1999) and accounts for endogeneity (Harris and Sollis 2003; Pesaran and Shin 1998).
In general the ARDL relationship can be specified as follows:
( L , p ) y t = β i ( L , q i ) x i t + α z t + ε t
where L is the lag operator; ϕ ( L , p ) = 1 ϕ 1 L ϕ 2 L 2 ϕ 3 L 3 ϕ p L p and β i ( L , q i ) = β i 0 + β i 1 L + β i 2 L 2 + + β i q L q i , p and q i are the lag lengths, y t is the dependent variable, x i t represents explanatory variables in the cointegrating vector, z is a vector of deterministic variables such as the intercept term, time trends, seasonal dummies, or exogenous variables with the fixed lags, α represents coefficient on the deterministic variables and ε is the error term. The error-correction representation of Equation (1) takes the following form:
Δ y t = i = 1 k β i 0 Δ x i t + α Δ z t j = 1 p ^ 1 θ j * Δ y t j i = 1 k j = 1 q ^ i 1 β i j * Δ x i , t j θ ( 1 , p ^ ) E C T t 1 + ε t
where Δ is the first difference operator; the error-correction term is given by E C T t = [ y t i = 1 k θ ^ i x i t Ψ ^ z t ] and θ ( 1 , p ^ ) = 1 i = 1 p θ measures the quantitative significance of the error-correction term. The coefficients θ j * and β i j * relate to the short-run dynamics of the model’s convergence to equilibrium.
The specific form of our base model for mobile money usage can be expressed as follows:
Δ P t = α 0 + k = 1 n 1 α 1 k Δ P t k + k = 1 n 2 α 2 k Δ N P L S t k + k = 0 n 3 α 3 k Δ L I Q + k = 0 n 4 α 4 k Δ S E N t k + k = 0 n 5 α 5 k Δ ln   R G D P t k + k = 0 n 6 α 6 k Δ ln   I N F t k + k = 0 n 7 α 7 k Δ ln E R t k + k = 0 n 8 α 8 k Δ LEND t k + k = 0 n 9 α 9 k Δ T B t k + k = 0 n 10 α 10 k Δ C O V I D 19 t k + γ 0 l n   P t 1 + γ 1 N P L S t 1 + γ 2 L I Q t 1 + γ 3 S E N t 1 + ε t
where ln denotes natural logarithm, P is a measure of bank profitability, NPLS represents the Non-Performing Loans ratio, LIQ denotes the Liquidity ratio and SEN represents Market Sensitivity, while RGDP, INF, ER, LEND, TB and COVID19 denote real economic growth, inflation, nominal Uganda Shilling per US Dollar (UGX/USD) exchange rate, Lending Rate, 91-day Treasury Bill interest rate, and a Dummy for the COVID19 pandemic crisis respectively. It is expected that α 2 k < 0 , γ 1 < 0 , α 3 k > 0 , γ 2 > 0 , α 4 k > 0 ,   γ 3 > 0 ,   α 5 k > 0 , α 6 k < 0 , α 7 k < 0 , α 8 k > 0 , α 9 k > 0 , and α 10 k < 0 . The specification provides estimates of both the short run and long run effects which are inferred from α i k , and γ i k respectively normalised by α 0 . Using the joint F-statistic suggested by Pesaran et al. (2001) to test for cointegration, the null hypothesis of no cointegration is tested against the alternative by restricting all estimated coefficients of lagged level variables equal to zero that is:
H 0 : γ 0 = γ 1 = γ 2 = γ 3 = 0
H 1 : γ 0 γ 1 γ 2 γ 3 0
The null is rejected indicating co-integration when the computed F-statistic lies above the upper level of the band, while for values of the F-statistic that lie below the lower bound, the null hypothesis cannot be rejected. However inference is inconclusive when the F-statistic falls within the band and in such cases the error correction parameter can be viewed as a cointegration test (Kremers et al. 1992).

4.2. Data and Measurement of Key Variables

The study uses quarterly data for the period March 2000 to March 2021, consisting of 85 observations. The choice of the sample period and data frequency is guided by data availability. Data on all the variables of interest was obtained from the Bank of Uganda’s database. Table 2 provides a summary of descriptive statistics.
Bank profitability is proxied by ROA, ROE and NIM, and the effects of the COVID-19 pandemic on bank profitability is captured using a dummy for the COVID-19 pandemic crisis, which takes on the value of 1 during the pandemic (March 2020 to March 2021) and 0 otherwise, whereas inflation is measured as the first difference of the natural log of the consumer price index, where INF t = ( ln cpi t ln cpi t 1 ) × 100 . This study applies the ARDL estimation technique and E-views version 9.0 statistical package software.

5. Results and Discussion

5.1. Unit Root and Cointegration Tests Results

The ARDL technique does not require pre-testing of the orders of integration of variables of interest, although the series should not be I(2) or greater, as this invalidates the F-statistics and all critical values established by Pesaran et al. (2001). The results of unit root tests carried out using the ADF and PP tests are presented in Table 3, which indicates a mixture of I(1) and I(0) variables. Given the mixture of I(0) and I(1) variables, and also that none appears to be integrated at an order higher than one, employing the ARDL technique is justified.
The bounds test for cointegration was carried out using EVIEWS 9 software based on Equation (3), from which three models of bank profitability were derived using ROE, ROA and NIM, respectively. The ARDL-bound testing approach requires the determination of the optimal lag for the cointegrating equation based on the assumption of serially uncorrelated residuals and as such the selected lags must be long enough to render εt serially uncorrelated and not too long as to lead to an over parameterization (Narayan 2005; Pesaran et al. 2001). In the interest of parsimony, the Schwarz information criterion (SBC) criterion assuming a maximum lag length of four lags for each variable of the ARDL model is applied. The SBC results indicate an ARDL (1,4,2,0) model hereinafter referred to model 1 as the best model for ROE, an ARDL (3,4,0,0) model hereinafter referred to model 2 as the best model for ROA and an ARDL (2,0,0,0) model hereinafter referred to model 3 as the best model for NIM2. The results of the ARDL Bounds test are reported in Table 4.
The F-test statistic of 7.2 for model 1, is higher than the upper bounds of the critical value of 5.61 at the one percent significance level and likewise for models 2 and 3 whose F-test statistics of 6.9 and 10.5 are also higher than the upper bounds of the critical value of 5.61 at the 1 percent significance level, an indication that the null hypothesis of no cointegration between bank profitability and the explanatory long run forcing variables in Models 1, 2 and 3 is rejected at the 1 percent significance level.

5.2. Discussion of Results

In view of the conclusive evidence of cointegration, we estimate the long run and short run dynamics for models 1−3, which are presented in Table 5. The study uses a non- performing loans ratio (NPLS) as a proxy for credit default risk and as shown in Table 5, in the short run NPLS only have a statistically significant negative effect on bank profitability as measured by the ROA and ROE, while in the long run NPLs only have a statistically significant effect on bank profitability as measured by NIM, but the effect is positive. This suggests that, in the short run, increasing NPLS due to bad loans or poor loan quality reduces bank profitability as measured by ROA and ROE as a result of the fall in interest revenue and rising provisioning costs. This result is consistent with the findings of (Abdelaziz et al. 2020; Athanasoglou et al. 2008; Bhattarai 2016; Ozili 2021; Ozurumba 2016) who find NPLS significant and negatively related to the ROA and ROE. In the long run, NPLs are positively and significantly related to bank profitability as measured by NIM, suggesting that the high level of credit risk in developing country markets like Uganda’s may induce banks to increase their interest margins to compensate for possible default risk. This is similar to the findings of Alshatti (2015) and Le and Ngo (2020) who also found a statistically significant positive relationship between NPLS and NIM. The low level of creditworthiness of the debtors increases the NPLS, but banks compensate for the risk by lending at higher interest rates, which contributes to the increase in the interest income resulting in the rise in NIM (Le and Ngo 2020).
The obtained results for liquidity risk as measured by the Liquid assets to total deposits show a negative and statistically significant effect on bank profitability as measured by ROA and ROE only in the short run, and no statistically significant association between liquidity risk and bank profitability in the long run. The same negative association between liquidity risk and bank profitability was confirmed by, among others, Abdelaziz et al. (2020), who find that liquidity risk significantly decreases bank profitability measured by ROA and ROE and attribute it to that fact that insufficient liquidity negatively affects income revenues derived from loans’ activity, which lowers bank profitability and reduces both a bank’s reputation and customer trust. Adelopo et al. (2018) found a significant negative relationship between liquidity and bank profitability as measured by ROA before, during, and after the financial crisis, while profitability as measured by NIM showed a significant positive relationship before the crisis, a significant negative relationship during the crisis and no significant effect after the crisis. In addition, their study found that liquidity had no significant effect on profitability as measured by ROE. In contrast, Lartey et al. (2013) find a weak positive relationship between the liquidity and the profitability of the average listed bank in Ghana.
Sensitivity to market risk measures the banking sector’s exposure to foreign exchange risk, which is captured by the ratio of foreign currency loans to foreign currency deposits. The results reported in Table 5 indicate that the relative foreign currency exposure of banks has an impact on banks’ profitability. In both the short and long run, an increase in exposure to foreign exchange risk has a negative effect on bank profitability, although the effect is statistically significant only for the ROE measure of bank profitability. Foreign currency default risk increases substantially in an environment where borrowers’ abilities to repay are not necessarily indexed to foreign currency values and may adversely affect bank profits (Kutan et al. 2012).
Furthermore, the study finds that bank profitability as measured by ROA and NIM shows a tendency to persist in the short run, as evidenced by the highly significant coefficient of the lagged profitability variables. Nevertheless, bank profits persistence is moderate given that the associated coefficients of 0.31 and 0.33 for ROA and NIM respectively are close to 0, suggesting that departures from a perfectly competitive market structure in the Ugandan banking sector may not be that large. This finding is close to the estimate reported in Athanasoglou et al. (2008) of approximately 0.35 for the Greek banking sector and is also similar to Kohlscheen et al. (2018) who find evidence of bank profitability persistence for all three measures of bank profitability measure ROA, ROE and NIM.
Considering the effects of macroeconomic determinants on bank profitability, the results in Table 6 show that RGDP positively affects bank profitability in the long run, although the effect is only statistically significant for the NIM measure of bank profitability. However, the study finds that in the short run, RGDP does not statistically significantly affect bank profitability for all three profitability measures; ROA, ROE and NIM. This suggests that, in the long run, economic growth is associated with higher bank profitability due to the increased economic prosperity and associated increases in demand for credit and the improved solvency of creditors. Adelopo et al. (2018) also found that GDP was positively affected by bank profitability as measured by NIM in all sample periods, except after the global financial crisis, while the ROA and ROE had no significant effects. Nevertheless, these results contrast with the findings of Kohlscheen et al. (2018), who found a statistically significant negative relationship between GDP growth and NIM, Ozili (2021) and Le and Ngo (2020) found an insignificant effect for NIM while Yao et al. (2018) found a significant positive impact of RGDP on all profitability indicators including NIM.
Surprisingly, for all three profitability measures (ROA, ROE and NIM) the study finds inflation does not have a statistically significant effect on bank profitability in both the short and the long term. In contrast, many studies, including Adelopo et al. (2018), Al-Homaidi et al. (2018), Kohlscheen et al. (2018), Ozili (2021), Rahman et al. (2015) and Yao et al. (2018) find that the effect of inflation was not uniform across different measures of bank profitability. For instance, Adelopo et al. (2018) found that inflation had no significant effect on ROE, had a significant negative effect on ROA only during the global financial crisis, and a positive significant effect on NIM in all periods except before the global financial crisis, while Rahman et al. (2015) found a significant negative effect of inflation on ROA and ROE. In addition, the results reported in Table 5 also show a negative and statistically significant association between the exchange rate and bank profitability in the long run relating to ROA and ROE measures of bank profitability, while in the short run the exchange rate has a negative but statistically insignificant effect on bank profitability as measured by ROA, ROE and NIM. Almaqtari et al. (2019) also found a statistically significant negative effect of the exchange rate on bank profitability measures ROA and ROE, which they attribute to the deterioration of the Indian Rupee exchange rate against other currencies, while Al-Homaidi et al. (2018) found the exchange rate had a statistically significant negative impact on the three profitability measures; ROA, ROE and NIM.
The study finds a positive and statistically significant relationship between the lending interest rate bank profitability when only measured by NIM at both the short and long run horizons. This implies that banks in Uganda charge higher interest on loans to increase their profitability. Thus banks may maintain high lending interest rates as compensation for exposure to greater credit risk. Interest rate spreads in Uganda have been persistently high over the last two decades, averaging above 20 percent despite financial sector reforms to enhance competition and efficiency. The persistence in high lending rates is often attributed to the high cost structure of the banking business in Uganda. Only a few studies have focused specifically on the impact of interest rates on bank profitability. Owolabi (2020) found a statistically significant positive relationship between the lending rate and bank profitability in Nigeria, although this was for the ROE measure of bank profitability. Similarly, Oino (2015) found loan interest rates have a positive and statistically significant impact on bank profitability as measured by ROE in 97 sub-Saharan African economies. In contrast, Almaqtari et al. (2019) found a statistically significant negative effect of bank lending interest rates on bank profitability as measured by ROA and ROE, while Ogunbiyi (2014) found that lending rates had negative and significant effects on the profitability of Nigerian deposit money banks as measured by ROA, but found no significant relationship between lending rate and bank profitability as measured by ROE and NIM.
Furthermore, as shown in Table 5, the Treasury Bill interest rate has a statistically significant positive effect on bank profitability as measured by ROA and ROE in both the long and short term. The central bank rate (CBR) is used to signal all other rates under the Bank of Uganda’s Inflation Targeting (IT) framework. However, the 91- day Treasury Bill rate and the CBR are highly correlated and thus the Treasury Bill interest rate was used as a proxy for the monetary policy rate in the analysis. Thus, an increase in the Treasury Bill interest rate signals a tightening of monetary policy, dampening economic activity by reducing the supply of credit to firms, which increases bank profitability as credit conditions tighten and crowd out the private sector. While examining the effect of interest rates on the profitability of deposit money banks in Nigeria, Ogunbiyi (2014) found that the Treasury Bill interest rate significantly and positively affected bank profitability as measured by ROA but found no significant relationship between the Treasury Bill interest rate and bank profitability as measured by ROE and NIM. While exploring the link between monetary policy and bank profitability, Owolabi (2020) found that the monetary policy rate had no significant impact on the performance of Nigerian banks as measured by ROE. On the other hand, Kumar et al. (2020) examined the relationship between monetary policy and bank profitability in New Zealand and found that an increase in short-term rate leads to an increase in the profitability of banks as measured by ROA and ROE. In contrast, Kohlscheen et al. (2018), while investigating the key determinants of bank profitability in 19 emerging market economies, found that higher short-term rates increase funding costs, thus reducing bank profits as measured by ROA, ROE and NIM.
Interestingly, we find that the COVID19 pandemic crisis has a negative and statistically significant effect on bank profitability as measured by NIM, albeit only in the long run version of the model. Our findings are comparable to Barua and Barua (2020), who found that the COVID-19 pandemic likely adversely affected all banks’ risk-weighted asset values, capital adequacy ratios and interest income both at individual and a sectoral levels and also resonate with Elnahass et al. (2021), who found that the COVID-19 pandemic had detrimental effects on global banking sector financial performance across different indicators of financial performance. In April 2020, the Bank of Uganda put in place several measures aimed at alleviating the impact of the COVID19 pandemic on the performance of the banking system, including the setup of a credit relief program in an effort to support financial stability and to enable banks and borrowers to cope with the adverse effects of the ongoing pandemic (Bank of Uganda 2020a, 2020b). The credit relief program was recently extended to 30th September 2021 due to the slower than anticipated economic recovery and potential worsening of the pandemic, which continue to adversely affect the debt-servicing capabilities of businesses and households (Bank of Uganda 2020a). The level of gross loans under payment deferrals as well as past- due restructured loans is significant, and as payment deferrals come to an end, banks are likely to experience a significant deterioration in their loan books and rising losses while several sectors that are still under partial lockdown such as tourism, real estate, and trade, among others, continue to be adversely affected by the pandemic, which will also affect their debt-servicing capabilities going forward (Bank of Uganda 2020a, 2020b). Thus, we conclude that efforts by Ugandan policy makers to mitigate the impact of the COVID-19 crisis on bank profitability may account for the insignificant effect in the short run; however, the statistically significant negative effect of the COVID-19 crisis on bank profitability in the long run points to challenging conditions for the banking sector going forward.
The coefficient of the error correction term (ECT), which measures the speed of adjustment to the long run steady state of bank profitability following external shocks, is negative and highly significant in all three models of bank profitability. The ECT coefficients of −0.44, −0.30 and −0.37 for ROA, ROE and NIM, respectively, suggest that 44 percent, 30 percent and 37 percent of any deviation from equilibrium in each respective model is corrected in one quarter. Thus, the results demonstrate the slow speed of adjustment to a long run steady state in Uganda’s bank profit trajectory, which is estimated to be approximately 44 percentage points, 30 percentage points and 37 percentage points per quarter, with the full adjustment to equilibrium expected to take approximately 2.3 quarters, 3.4 quarters and 2.7 quarters, respectively, for ROA, ROE and NIM. The coefficient of the error correction term (ECT) in all models is negative and significant at the one percent level, giving further support of a long-term level relationship between bank profitability and the variables included in the cointegrating vector for all three estimated ARDL models.

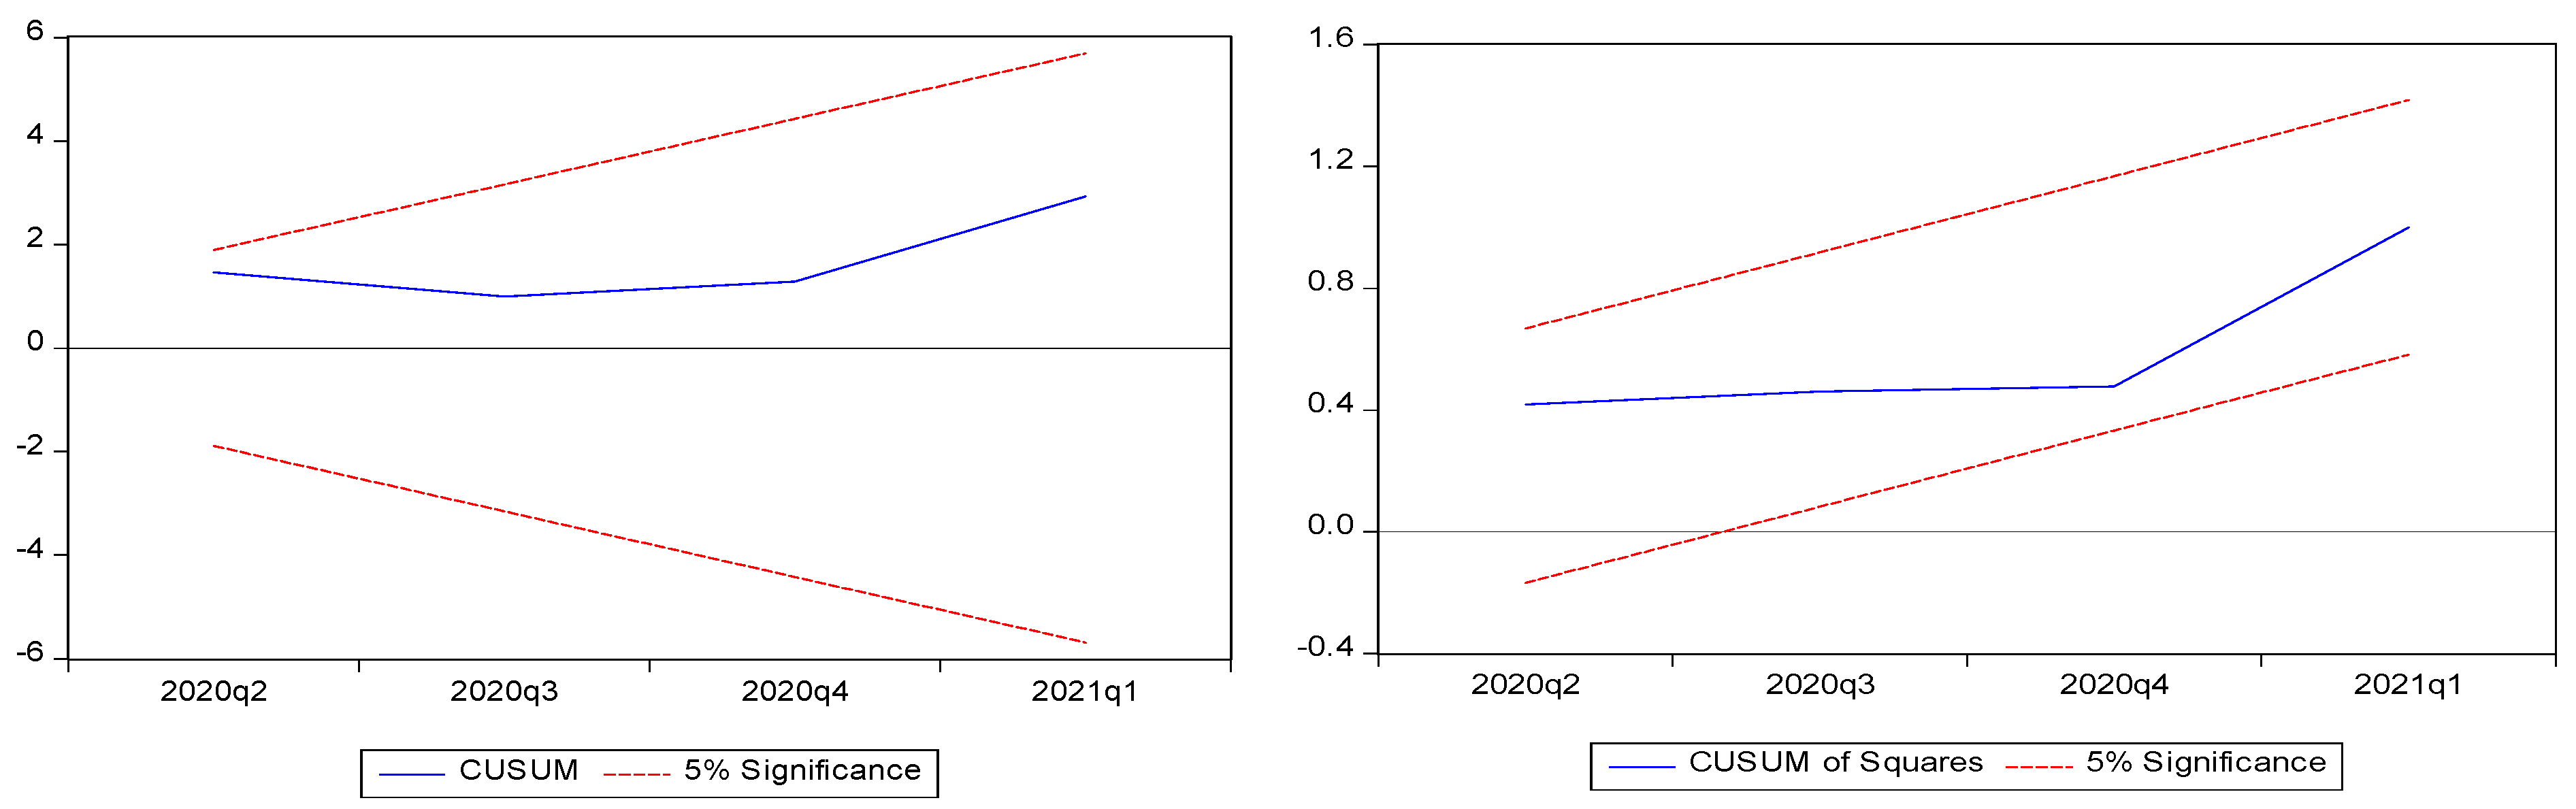
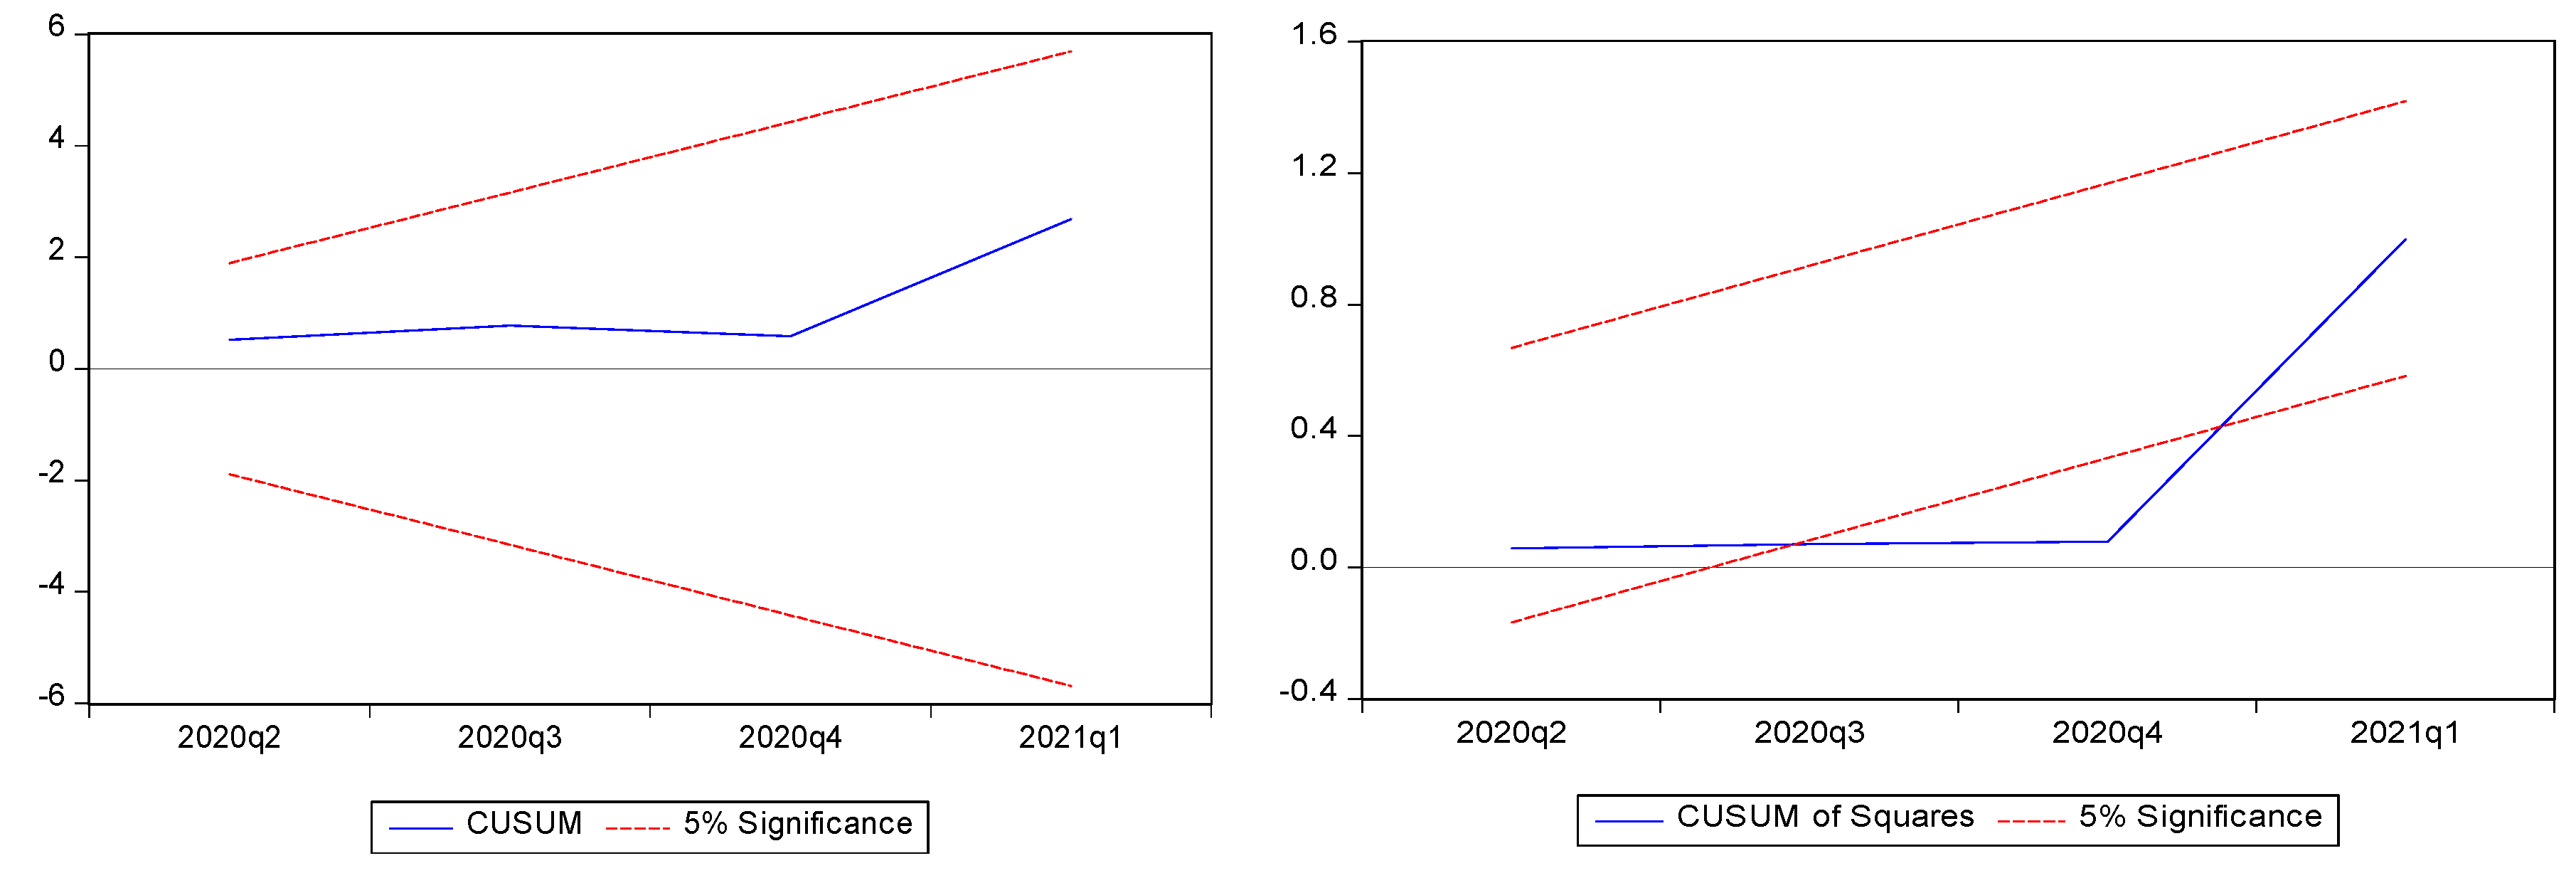
5.3. Model Specification and Robustness Test Results

The model’s diagnostic and specification tests presented in Table 6 were used to ascertain the robustness of the estimated models. According to the results, all the three models passed all the diagnostic tests, with the exception of the functional form test for Model 1, suggesting that these models can be reliable for policymaking and statistical inferences. The test statistics for serial correlation, heteroscedasticity and functional form are found to be lower than the critical values at a five percent significance level, leading to failure to reject the null hypothesis of no serial correlation, homoscedastic residuals and a well-specified functional form. The Jarque-Bera test fails to reject the null hypothesis, and thus we conclude that the residual distribution is normally distributed. In addition, the F-statistic test for the overall significance of the estimated models are highly significant at a one percent level of significance, an indication that all the explanatory variables in the estimated models are jointly significant in explaining bank profitability. As an additional robustness check, we also reestimated the three models over the March 2000–December 2019 period and find that the results of the three models for the period 2000–2019 are qualitatively similar, with magnitudes and signs of the coefficients comparable to the 2000–2021 period3.
Figure 1, Figure 2 and Figure 3 show conflicting results regarding parameter stability. The test results indicate parameter stability when the cumulative sum falls within the five percent critical lines. In both models 1 and 3, the CUSUM test and CUSUMSQ test suggests parameter stability. However, in model 2 the CUSUM test suggests parameter stability but the CUSUMSQ test shows signs of parameter instability.

6. Conclusions

Overall, this study provides new insight into the effect of the COVID-19 pandemic on bank profitability while controlling for bank specific and macroeconomic factors that determine bank profitability in Uganda. Bank profitability is proxied by return on assets (ROA), return on equity (ROE), and net interest margin (NIM) and the analyses are conducted using the Autoregressive Distributed Lag (ARDL Bound) testing approach to co-integration and quarterly data spanning the period Q1 2000 to Q1 2021. The study finds long run and short run associations between the explanatory variables used in the study and bank profitability although their impact is not uniform with respect to different measures of bank profitability. Overall, in the short run, the non-performing loans ratio, liquidity ratio bank and market sensitivity to foreign exchange market risk have a negative and significant effect on bank profitability, while bank profitability is positively and significantly affected by the Treasury Bill interest rates. In addition, the study finds that bank profitability has a tendency to persist in the short run as evidenced by the highly significant coefficient of the lagged profitability variables, even though this persistence is moderate, suggesting that the Ugandan banking sector largely does not significantly depart from a perfectly competitive market structure. In the long run, bank profitability is significantly and negatively affected by market sensitivity to foreign exchange market risk, the nominal exchange rate, and the COVID-19 pandemic, whereas the non-performing loans ratio, real GDP, Treasury Bill interest rate and lending interest rate have a positive and statistically significant effect on bank profitability in Uganda. Another interesting finding is that inflation does not seem to significantly affect bank profitability in either the short or long term.
The study’s findings have considerable policy relevance for regulators and industry experts seeking optimal policies for bank performance management. An important finding of this research is that going forward, policies for enhancing the efficiency, profitability and resilience of the banking system not only need to factor in bank-specific and macroeconomic factors affecting bank performance, but must also account for the adverse effects of the COVID-19 pandemic on bank profitability in order to improve the performance of the banking sector in Uganda and similar low income countries.
This study examines the effects of the COVID19 pandemic on Uganda’s banking system as a whole. However, future research should consider investigating the disaggregated effects of the pandemic by looking at bank-level impact. In addition, it would also be interesting to see the differential impact of domestically and internally owned banks.

Funding

This research received no external funding. The APC was funded by Lorna Katusiime.

Institutional Review Board Statement

Not applicable.

Informed Consent Statement

Not applicable.

Data Availability Statement

Restrictions apply to the availability of these data. Data was obtained from Bank of Uganda and are available with the permission of Bank of Uganda.

Conflicts of Interest

The author declares no conflict of interest.

Notes

1
For a summary of some of the recent studies see (Al-Homaidi et al. 2018).
2
As a precaution we apply the Heteroscedasticity and Autocorrelation Consistent Covariance (HAC) estimators in the ARDL model estimations to ensure that our results are robust in the presence of heteroscedasticity and serial correlation. Note that the HAC approach alters the estimates of the coefficient standard errors of an equation but not the point estimates themselves.
3
These results are available from the author upon request.

References

  1. Abdelaziz, Hakimi, Boussaada Rim, and Hamdi Helmi. 2020. The Interactional Relationships Between Credit Risk, Liquidity Risk and Bank Profitability in MENA Region. Global Business Review. [Google Scholar] [CrossRef]
  2. Adelopo, Ismail, Robert Lloydking, and Venancio Tauringana. 2018. Determinants of Bank Profitability before, during, and after the Financial Crisis. International Journal of Managerial Finance 14: 378–98. [Google Scholar] [CrossRef] [Green Version]
  3. African Development Bank. 2021. African Economic Outlook 2021—From Debt Resolution to Growth: The Road Ahead for Africa. Abidjan: African Development Bank Group. [Google Scholar]
  4. Al-Homaidi, Eissa A., Mosab I. Tabash, Najib H. S. Farhan, and Faozi A. Almaqtari. 2018. Bank-Specific and Macro-Economic Determinants of Profitability of Indian Commercial Banks: A Panel Data Approach. Cogent Economics & Finance 6: 1548072. [Google Scholar]
  5. Almaqtari, Faozi A., Eissa A. Al-Homaidi, Mosab I. Tabash, and Najib H. Farhan. 2019. The Determinants of Profitability of Indian Commercial Banks: A Panel Data Approach. International Journal of Finance & Economics 24: 168–85. [Google Scholar] [CrossRef] [Green Version]
  6. Alshatti, Ali Sulieman. 2015. The Effect of Credit Risk Management on Financial Performance of the Jordanian Commercial Banks. Investment Management and Financial Innovations 12: 338–45. [Google Scholar]
  7. Athanasoglou, Panayiotis P., Sophocles N. Brissimis, and Matthaios D. Delis. 2008. Bank-Specific, Industry-Specific and Macroeconomic Determinants of Bank Profitability. Journal of International Financial Markets, Institutions and Money 18: 121–36. [Google Scholar] [CrossRef] [Green Version]
  8. Bahmani-Oskooee, Mohsen, Marzieh Bolhassani, and Scott W. Hegerty. 2010. The Effects of Currency Fluctuations and Trade Integration on Industry Trade between Canada and Mexico. Research in Economics 64: 212–23. [Google Scholar] [CrossRef]
  9. Bank of Uganda. 2020a. Annual Supervision Report. Kampala: Bank of Uganda. [Google Scholar]
  10. Bank of Uganda. 2020b. Financial Stability Report. Kampala: Bank of Uganda. [Google Scholar]
  11. Bank of Uganda. 2020c. Licensed Commercial Banks as at July 01, 2020. Kampala: Supervised Institutions. [Google Scholar]
  12. Barua, Bipasha, and Suborna Barua. 2020. COVID-19 Implications for Banks: Evidence from an Emerging Economy. SN Business & Economics 1: 19. [Google Scholar] [CrossRef]
  13. Bhattarai, Yuga Raj. 2016. Effect of Credit Risk on the Performance of Nepalese Commercial Banks. NRB Economic Review 28: 41–64. [Google Scholar]
  14. Bigsten, Arne, and Steve Kayizzi-Mugerwa. 2001. Is Uganda an Emerging Economy?: A Report for the OECD Project “Emerging Africa”. Uppsala: Nordiska Afrikainstitutet. [Google Scholar]
  15. Boateng, Kwadwo. 2018. Determinants of Bank Profitability: A Comparative Study of Indian and Ghanaian Banks. Journal of Emerging Technology and Innovative Research 5: 1–12. [Google Scholar]
  16. Damak, Mohamed, Cynthia Cohen Freue, Geeta Chugh, Natalia Yalovskaya, Ming Tan, Ivan Tan, Sergio Garibian, Tatiana Lysenko, and Elijah Oliveros Rosen. 2020. Banks in Emerging Markets. New York: Standard & Poor’s Financial Services. [Google Scholar]
  17. De Zoysa, Hema R., Robert L. Sharer, and Calvin A. McDonald. 1995. Monetary Policy and Financial Sector Reform. In Uganda Adjustment with Growth, 1987–94, Occasional. Washington: International Monetary Fund, pp. 31–38. [Google Scholar] [CrossRef]
  18. Elnahass, Marwa, Vu Quang Trinh, and Teng Li. 2021. Global Banking Stability in the Shadow of Covid-19 Outbreak. Journal of International Financial Markets, Institutions and Money 72: 101322. [Google Scholar] [CrossRef]
  19. Harris, Richard, and Robert Sollis. 2003. Applied Time Series Modelling and Forecasting. Chichester: Wiley. [Google Scholar]
  20. Jurd de Girancourt, François, Aalind Gupta, Shikha Gupta, and Uzayr Jeenah. 2021. African Banking in the New Reality. Chicago: McKinsey & Company. [Google Scholar]
  21. Katusiime, Lorna. 2021. Mobile Money Use: The Impact of Macroeconomic Policy and Regulation. Economies 9: 51. [Google Scholar] [CrossRef]
  22. Kohlscheen, Emanuel, Andrés Murcia, and Juan Contreras. 2018. Determinants of Bank Profitability in Emerging Markets. Basel: Bank for International Settlements. [Google Scholar]
  23. Kremers, Jeroen J. M., Neil R. Ericsson, and Juan J. Dolado. 1992. The Power of Cointegration Tests. Oxford Bulletin of Economics and Statistics 54: 325–48. [Google Scholar] [CrossRef]
  24. Kumar, Vijay, Sanjeev Acharya, and Ly T. H. Ho. 2020. Does Monetary Policy Influence the Profitability of Banks in New Zealand? International Journal of Financial Studies 8: 35. [Google Scholar] [CrossRef]
  25. Kutan, Ali M., Emre Ozsoz, and Erick W. Rengifo. 2012. Cross-Sectional Determinants of Bank Performance under Deposit Dollarization in Emerging Markets. Emerging Markets Review 13: 478–92. [Google Scholar] [CrossRef]
  26. Kuteesa, Florence, Emmanuel Tumusiime-Mutebile, Alan Whitworth, and Tim Williamson. 2010. Uganda’s Economic Reforms: Insider Accounts. Edited by Florence Kuteesa, Emmanuel Tumusiime-Mutebile, Alan Whitworth and Tim Williamson. New York: Oxford University Press. [Google Scholar]
  27. Lartey, Victor Curtis, Samuel Antwi, and Eric Kofi Boadi. 2013. The Relationship between Liquidity and Profitability of Listed Banks in Ghana. International Journal of Business and Social Science 4: 1–9. [Google Scholar]
  28. Le, Tu D. Q., and Thanh Ngo. 2020. The Determinants of Bank Profitability: A Cross-Country Analysis. Central Bank Review 20: 65–73. [Google Scholar] [CrossRef]
  29. Lwanga Mayanja, Musa, and Annet Adong. 2016. A Pathway to Financial Inclusion: Mobile Money and Individual Savings in Uganda. Research Series; Kampala: Economic Policy Research Centre. [Google Scholar]
  30. Mawejje, Joseph, and E. C. Lakuma. 2017. Macroeconomic Effects of Mobile Money in Uganda. Kampala: Economic Policy Research Centre. [Google Scholar] [CrossRef]
  31. Minney, Tom. 2020. Can Africa’s Banks Emerge Stronger after Covid-19? African Business, November 3. [Google Scholar]
  32. Morley, Bruce. 2006. Causality between Economic Growth and Immigration: An ARDL Bounds Testing Approach. Economics Letters 90: 72–76. [Google Scholar] [CrossRef]
  33. Narayan, Paresh Kumar. 2005. The Saving and Investment Nexus for China: Evidence from Cointegration Tests. Applied Economics 37: 1979–90. [Google Scholar] [CrossRef]
  34. OECD. 2020. OECD Economic Outlook, Volume 2020 Issue 1: Vol. Issue 1, No. 107. Paris: OECD. [Google Scholar] [CrossRef]
  35. OECD. n.d. Focus on the Global Economy. Paris: Organisation for Economic Co-Operation and Development (OECD).
  36. Ogunbiyi, S. Samuel. 2014. Interest Rates and Deposit Money Banks’profitability Nexus: The Nigerian Experience. Arabian Journal of Business and Management Review (OMAN Chapter) 3: 133. [Google Scholar] [CrossRef] [Green Version]
  37. Oino, Isaiah. 2015. Competitiveness and Determinants of Bank Profitability in Sub-Saharan Africa. International Journal of Economics and Finance 7: 151–62. [Google Scholar] [CrossRef] [Green Version]
  38. Owolabi, Adesegun. 2020. Effect of Lending Rate on the Performance of Nigerian Deposit Money Bank. Journal of Asian Economics 1: 163–80. [Google Scholar]
  39. Ozili, Peterson K. 2021. Bank Profitability Determinants: Comparing the United States, Nigeria and South Africa. International Journal of Banking and Finance 16: 55–78. [Google Scholar] [CrossRef]
  40. Ozurumba, Benedict Anayochukwu. 2016. Impact of Non-Performing Loans on the Performance of Selected Commercial Banks in Nigeria. Research Journal of Finance and Accounting 7: 95–109. [Google Scholar]
  41. Pesaran, M. Hashem, and Yongcheol Shin. 1998. An Autoregressive Distributed-Lag Modelling Approach to Cointegration Analysis. Econometric Society Monographs 31: 371–413. [Google Scholar]
  42. Pesaran, M. Hashem, and Yongcheol Shin. 1999. An Autoregressive Distributed-Lag Modelling Approach to Cointegration Analysis. In Econometrics and Economic Theory in the 20th Century: The Ragnar Frisch Centennial Symposium. Edited by Steinar Strøm. Econometric Society Monographs. Cambridge: Cambridge University Press, pp. 371–413. [Google Scholar] [CrossRef] [Green Version]
  43. Pesaran, M. Hashem, Yongcheol Shin, and Richard J. Smith. 2001. Bounds Testing Approaches to the Analysis of Level Relationships. Journal of Applied Econometrics 16: 289–326. [Google Scholar] [CrossRef]
  44. Rahman, Mohammad Morshedur, Md Kowsar Hamid, and Md Abdul Mannan Khan. 2015. Determinants of Bank Profitability: Empirical Evidence from Bangladesh. International Journal of Business and Management 10: 135. [Google Scholar] [CrossRef] [Green Version]
  45. Sufian, Fadzlan, and Muzafar Shah Habibullah. 2009. Determinants of Bank Profitability in a Developing Economy: Empirical Evidence from Bangladesh. Journal of Business Economics and Management 10: 207–17. [Google Scholar] [CrossRef]
  46. The East African. 2020. Half of Ugandan Banks Fail Pandemic Liquidity Test. The East African, June 29. [Google Scholar]
  47. Titko, Jelena, Viktorija Skvarciany, and Daiva Jurevičienė. 2015. Drivers of Bank Profitability: Case of Latvia and Lithuania. Intellectual Economics 9: 120–29. [Google Scholar] [CrossRef] [Green Version]
  48. Twaha, Ali. 2021. Bank Deposit Accounts Hit 17 Million—New Vision Official. New Vision, February 25. [Google Scholar]
  49. Tyson, Judith. 2020. The Impact of COVID-19 on Africa’s Banking System|ODI: Think Change. London: Overseas Development Institute (ODI). [Google Scholar]
  50. World Bank. 2021. Global Economic Prospects: The Global Economy: On Track for Strong but Uneven Growth as COVID-19 Still Weighs. Feature Story, June 8. [Google Scholar]
  51. Yao, Hongxing, Muhammad Haris, and Gulzara Tariq. 2018. Profitability Determinants of Financial Institutions: Evidence from Banks in Pakistan. International Journal of Financial Studies 6: 53. [Google Scholar] [CrossRef] [Green Version]
Figure 1. Plot of CUSUM and CUSUMSQ tests for Model 1 (ROE).
Jrfm 14 00588 g001
Figure 2. Plot of CUSUM and CUSUMSQ tests for Model 2 (ROA).
Jrfm 14 00588 g002
Figure 3. Plot of CUSUM and CUSUMSQ tests for Model 3 (NIM).
Jrfm 14 00588 g003
Table 1. Excerpt of banking sector performance.
YearNumber of BanksTotal Assets (UGX Trillions)ROA (%)ROE (%)NPL Ratio (%)
1999201.3521.0224.526
2005153.6893.428.62.3
20182428.12.514.43.4
20192632.82.513.84.9
20202538.31.810.35.3
Source: Bank of Uganda.
Table 2. Summary statistics.
VariableDescriptionMeanMedianMaximumMinimumStd. Dev.Observations
ROEReturn on Equity (%)25.19722.43258.9338.32712.04285
ROAReturn on Assets (%)3.2983.2896.0251.3300.96685
NIMNet Interest Margin (%)10.83510.95113.5487.9791.15985
NPLSNon Performing Loans (%) 4.8914.13115.1491.6062.56185
LIQLiquidity (%)44.80845.46669.16617.64711.28885
SENMarket Sensitivity (%)57.14860.05789.78423.30819.03185
LRGDPNatural Log of Economic Activity 9.8509.92910.3979.1570.37885
LINFNatural Log of Inflation 5.8984.97021.579−4.4184.55985
LEXNatural Log of Exchange rate7.7727.7178.2357.3260.30185
LENDLending rate (%)21.06820.48227.21817.7272.16085
TBTreasury Bill Rate (%) 10.6259.61722.1203.7564.02585
Notes: ROE is a measure of bank profitability based on the return on shareholder’s equity; ROA is a measure of bank profitability based on the return on banks assets; NIM is a measure of bank profitability based on the net return on bank’s interest earning assets; NPLS is the ratio of non-performing loans to total gross loans that measures banks’ asset quality; LIQ is a measure of banks’ liquidity calculated by the a ratio of liquid assets to total deposits; SEN is a measure of market sensitivity calculated by the ratio of Forex loans to forex deposits.
Table 3. Unit root test results.
Unit Root TestsAugmented Dicky–Fuller (ADF)Phillips Peron (PP)
Levels1st DifferenceLevels1st DifferenceInference
Return on Equity (ROE)−3.783 *** −2.333−8.1896 ***I(1)/I(0)
Return on Assets (ROA)−2.721−7.243 ***−2.498−7.5766 ***I(1)
Net Interest Margin (NIM)−3.919 *** −3.392 ** I(0)
Non Performing Loans (NPLS)−4.468 *** −4.457 *** I(0)
Liquidity (LIQ)−2.799−6.660 ***−2.912 ** I(1)/I(0)
Market Sensitivity (SEN)−1.817−9.981 ***−1.790−10.0577 ***I(1)
Economic Activity (LRGDP)−0.116−2.851 ***−3.134 ** I(1)/I(0)
Inflation (LINF)−2.693−5.482 ***−2.550−5.0948 ***I(1)
Exchange rate (LER)−0.666−7.120 ***−0.688−6.9013 ***I(1)
Lending rate (LEND)−2.458−9.609 ***−2.610−9.609 ***I(1)
Treasury Bill Rate (TB)−3.476 ** −3.600 *** I(0)
Notes: The figures in this table are unit-root test statistics while *** and ** denote statistical significance at the 1 percent and 5 percent levels, respectively.
Table 4. ARDL bounds cointegration test results.
Dependent Variable aF-Statistic for Case III Intercept No Trend b Conclusion
MODEL 1: ROE
P7.159Cointegration
NPLS4.760No cointegration
LIQ4.334No cointegration
SEN3.915No cointegration
MODEL 2:ROA
P6.873Cointegration
NPLS3.420No cointegration
LIQ3.331No cointegration
SEN3.912No cointegration
MODEL 3:NIM
P10.483Cointegration
NPLS5.475No cointegration
LIQ3.034No cointegration
SEN3.631No cointegration
Notes: a The cointegrating vector includes a measure of Bank Profitability (P), Non-Performing Loans (NPLS), Liquidity (LIQ) and Market Sensitivity (SEN), while economic activity (LRGDP), inflation (LINF), exchange rate (LER), Lending Rate (LEND), Treasury Bill interest rate (TB), and the COVID-19 pandemic crisis (COVID19) are excluded from the cointegrating vector but included in the short run dynamics. When a long-run relationship exists between the lagged level variables in the cointegrating vector, the F-test indicates which variable should be normalised. Three alternative cointegrating relationships are examined with three different dependent variables; namely; Return on Equity (ROE), Return on Assets (ROA) and Net Interest Margin (NIM) for models 1−3 respectively. If it is below the lower bound, the null hypothesis of no level effect can’t be rejected. If it is above the upper bound, the null hypothesis of no level effect is rejected. If the F-statistic lies between the bounds, the test is inconclusive. b The relevant critical values are obtained from Table CI(iii) Case III: Intercept no Trend when k = 3. They are 4.29 and 5.61 for the lower and upper bound respectively at 99 percent significance level.
Table 5. ARDL model results.
MODEL 1: ROEMODEL 2: ROAMODEL 3: NIM
Regressors ARDL (1,4,2,0)LONG RUNSHORT RUNARDL (3,4,0,0)LONG RUNSHORT RUNARDL (2,0,0,0)LONG RUNSHORT RUN
Intercept13.994 14.944 ***5.075 * 5.554 ***−5.280 *** −6.269 ***
(0.62) (7.01)(1.79) (6.86)(−2.63) (−7.36)
Bank Profitability (−1)0.705 *** 0.891 *** 1.103 ***
(11.84) (11.44) (13.00)
Δ Bank Profitability (−1) 0.261 *** 0.331 ***
(3.13) (4.12)
Bank Profitability (−2) 0.082 −0.415 ***
(0.80) (−5.41)
Δ Bank Profitability (−2) 0.362 ***
(4.02)
Bank Profitability (−3) −0.375 ***
(−5.40)
Non Performing Loans−0.912 ***0.655 −0.108 ***−0.027 0.045 **0.144 **
(−4.01)(0.67) (−3.86)(−0.30) (2.34)(2.17)
Δ Non Performing Loans −0.927 *** −0.100 *** 0.029
(−3.99) (−3.63) (0.94)
Non Performing Loans (−1)0.658 * 0.078 **
(1.92) (2.26)
Δ Non Performing Loans (−1) −0.507 ** −0.029
(−2.15) (−1.08)
Non Performing Loans (−2)0.347 0.035
(1.35) (1.11)
Δ Non Performing Loans (−2) −0.171 −0.001
(−0.69) (−0.02)
Non Performing Loans (−3)−0.683 *** −0.110
(−3.19) (−2.75)
Δ Non Performing Loans (−3) −0.834 *** −0.105 ***
(−3.69) (−4.02)
Non Performing Loans (−4)0.782 ** 0.094 ***
(2.45) (2.35)
Liquidity−0.163 **0.103 −0.007−0.016 0.0020.005
(−2.72)(0.53) (−1.48)(−1.58) (0.47)(0.46)
Δ Liquidity −0.171 *** −0.016 ** −0.010
(−3.09) (−2.40) (−1.35)
Liquidity (−1)0.011
(0.16)
Δ Liquidity (−1) −0.188 ***
(−3.37)
Liquidity (−2)0.182 ***
(3.26)
Market Sensitivity−0.150 ***−0.511 *** −0.008−0.019 −0.005−0.017
(3.06)(3.44) (−1.20)(−1.24) (−1.26)(−1.17)
Δ Market Sensitivity −0.110 * −0.005 0.001
(−190) (−0.79) (0.10)
Economic Activity8.321 *28.249 0.1780.442 1.070 **3.427 **
(1.76)(1.71) (0.33)(0.33) (2.38)(2.20)
Δ Economic Activity −26.736 −1.956 −3.146
(−0.56) (−0.35) (−0.49)
Inflation−0.107−0.362 0.0040.010 0.0090.028
(−1.21)(−1.17) (0.41)(0.41) (0.73)(0.74)
Δ Inflation −0.164 −0.011 −0.004
(−1.29) (−0.73) (−0.23)
Exchange rate−12.20 **−41.416 *** −0.730−1.813 * −0.482−1.543
(−2.64)(−2.80) (−1.66)(−1.80) (−1.15)(−1.08)
Δ Exchange rate −9.500 −1.033 −1.145
(−1.44) (−1.35) (−1.31)
Lending rate0.3031.027 0.0280.069 0.081 **0.259 ***
(1.24)(1.33) (1.39)(1.46) (2.60)(2.86)
Δ Lending rate 0.324 0.009 0.075 **
(1.32) (0.30) (2.35)
Interest rate0.598 ***2.030 *** 0.030 *0.074 * 0.0140.046
(4.14)(3.52) (1.94)(1.88) (0.78)(0.75)
Δ Interest rate 0.605 *** 0.031 ** 0.005
(4.52) (2.03) (0.30)
Covid19 pandemic crisis0.9413.194 0.2260.562 −0.285 ***−0.914 ***
(0.68)(0.70) (1.13)(1.23) (−3.35)(3.20)
Δ (Covid19 pandemic crisis) −0.416 0.109 −0.180
(−0.18) (0.41) (−0.58)
ECT (−1) −0.304 *** −0.438 *** −0.375 ***
(−7.00) (−6.88) (−7.45)
Notes: The values in parentheses are t-ratios. The asterisks *, ** and *** denote statistical significance at 10 percent, 5 percent and 1 percent significance levels.
Table 6. ARDL Model Diagnostic Tests.
Model DiagnosticsMODEL 1MODEL 2MODEL 3
Adjusted R-squared0.950.920.92
S.E. of regression2.300.270.32
Schwarz Bayesian Criterion5.190.891.05
DW-statistic1.541.852.24
Residual Diagnostics
Serial Correlation 11.69 [0.193]1.03 [0.363]1.66 [0.197]
F-statistic 299.77 [0.00]55.25 [0.000]82.47 [0.000]
Heteroscedasticity 30.009 [0.92]0.111[0.740]0.693[0.408]
Functional Form 42.43 [0.018]0.59 [0.559]0.92 [0.360]
Normality 50.114 [0.945]1.331 [0.514]2.84 [0.241]
Notes: 1 Breusch-Godfrey Lagrange multiplier test of residual serial correlation; 2 F-statistic; 3 ARCH test for Heteroscedasticity based on the regression of squared residuals on squared fitted values; 4 Ramsey’s RESET test for omitted Variables/Functional form; 5 Jarque-Bera Normality test based on a test of skewness and kurtosis of residuals. The values in parentheses are t-ratios while probabilities are brackets.
Publisher’s Note: MDPI stays neutral with regard to jurisdictional claims in published maps and institutional affiliations.

