
Whose Policy Uncertainty Matters in the Trade between Korea and the U.S.?


Abstract
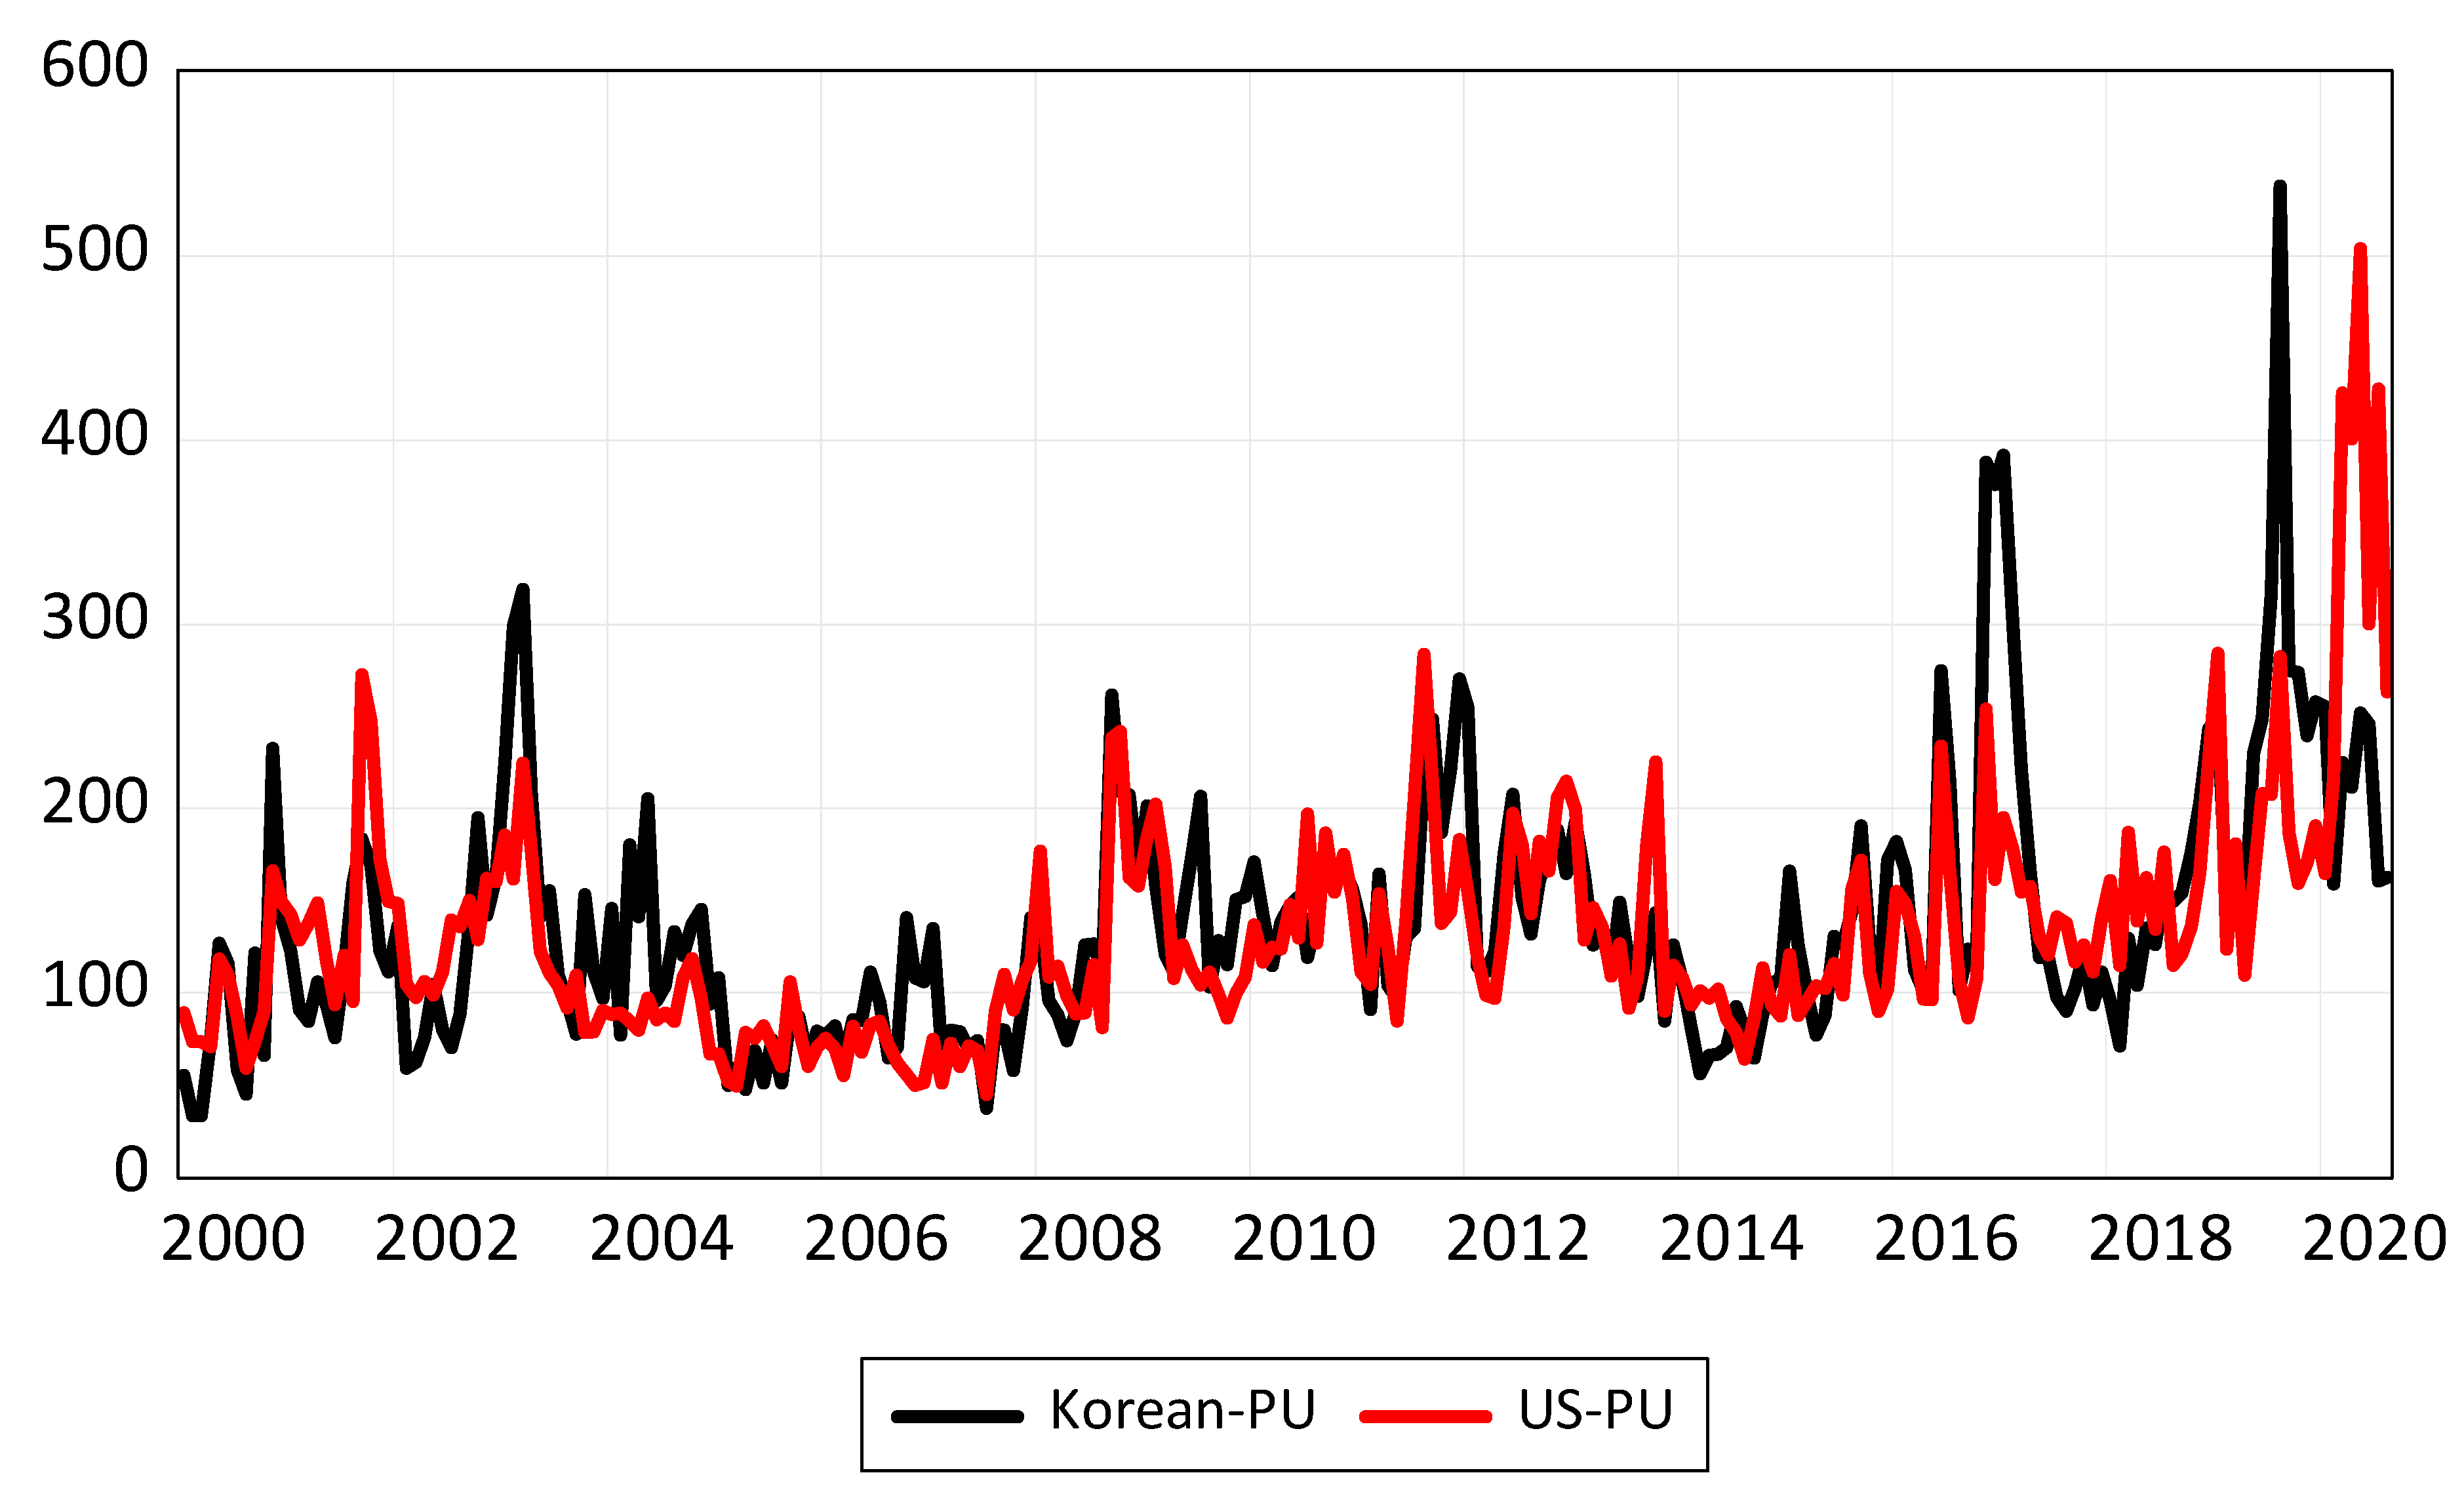
:1. Introduction
2. The Models and Methods
3. Empirical Results
4. Summary and Conclusions
Author Contributions
Funding
Acknowledgments
Conflicts of Interest
Appendix A. Data Definitions and Sources
- U.S. International Trade Commission (USITC).
- International Financial Statistics of the IMF (www.imfstatistics.org). (accessed on 15 February 2021)
- Economic Policy Uncertainty Group: https://www.policyuncertainty.com/. (accessed on 15 February 2021)
Variables
- XiUS
- = Volume of exports of commodity i by the U.S. to Korea. Export value data in U.S. dollars for each industry come from source a. In the absence of export prices at the commodity level, we follow Bahmani-Oskooee and Hegerty (2009) and use the aggregate export price index of the U.S. to deflate the nominal exports of each commodity. The aggregate export price index comes from source b.
- MiUS
- = Volume of imports of commodity i by the U.S. from Korea. Import value data in U.S. dollars for each industry come from source a. Again, we use the aggregate import price index of the U.S. to deflate the nominal imports of each commodity. The aggregate import price index comes from source b.
- YUS
- = Measure of U.S. economic activity. Since data are monthly, we follow Bahmani-Oskooee and Ardalani (2006) and Bahmani-Oskooee and Aftab (2017) and use the Industrial Production Index, which is available monthly from source b.
- YKOR
- = Measure of Korea’s economic activity, also proxied by the industrial production index from source b.
- REX
- = Real bilateral exchange rate between US dollar and Korean won. It is defined as (NEX*CPIUS)/ CPIKOR where NEXi is the nominal exchange rate defined as the number of won per US dollar, CPIUS is the price level in the United States and CPIKOR is the price level in Korea. Thus, a decline in REX reflects a real depreciation of the USD. All data come from Source b.
- PUUS
- = Measure of Economic Policy Uncertainty in the U.S., proxied by the economic policy uncertainty index from source c.
- PUKOR
- = Measure of Economic Policy Uncertainty in Korea, also proxied by the economic policy uncertainty index from source c.
| 1 | The policy uncertainty measure is now constructed for more than 20 countries by the Policy Uncertainty Group. For more details visit www.policyuncertainty.com (accessed on 4 March 2021). |
| 2 | A few examples are Bahmani-Oskooee (1986), Bahmani-Oskooee and Niroomand (1998), and Bahmani-Oskooee and Kara (2005). Bahmani-Oskooee et al. (2013) is the latest review article. |
| 3 | Note that estimates of θ0 and in this context are the same as an estimate of the coefficient attached to the lagged error-correction term in Engle and Granger’s (1987) approach. Hence, these estimates must be negative, and they measure the speed of adjustment. For proof, see Banerjee et al. (1998) and Bahmani-Oskooee and Ghodsi (2018). |
| 4 | For some other applications of this approach, see Halicioglu (2007), Durmaz (2015), Al-Shayeb and Hatemi-J. (2016), Aftab et al. (2017), Arize et al. (2017), and Hajilee and Niroomand (2019). |
| 5 | By meaningful we mean cointegration is supported either by the F or the t-test that is reported in the diagnostics in Table 4. Note that in industry 82, although the Korean policy uncertainty measure carries a significant coefficient, this industry is not included in the list since neither the F nor the t-test is significant. |
| 6 | As for the long-run effects of the income and exchange rate, while the exchange rate is significant in limited number of industries, Korean income or economic activity is significant in most industries. |
| 7 |
References
- Aftab, Muhammad, Karim Bux Shah Syed, and Naveed Katper. 2017. Exchange-rate Volatility and Malaysian-Thai Bilateral Industry Trade Flows. Journal of Economic Studies 44: 99–114. [Google Scholar] [CrossRef]
- Al-Shayeb, Abdulrahman, and Abdulnasser Hatemi-J. 2016. Trade Openness and Economic Development in the UAE: An Asymmetric Approach. Journal of Economic Studies 43: 587–97. [Google Scholar] [CrossRef]
- Al-Thaqeb, Saud Asaad, and Barrak Ghanim Algharabali. 2019. Economic Policy Uncertainty: A Literature Review. Journal of Economic Asymmetries 20: e00133. [Google Scholar] [CrossRef]
- Arize, Augustine C., John Malindretos, and Emmanuel U. Igwe. 2017. Do Exchange Rate Changes Improve the Trade Balance: An Asymmetric Nonlinear Cointegration Approach. International Review of Economics and Finance 49: 313–26. [Google Scholar] [CrossRef]
- Armelius, Hanna, Carl-Johan Belfrage, and Hanna Stenbacka. 2014. The Mystery of the Missing World Trade Growth after the Global Financial Crisis. Sveriges Riksbank Economic Review 3: 7–22. [Google Scholar]
- Bahmani-Oskooee, Mohsen. 1986. Determinants of International Trade Flows: Case of Developing Countries. Journal of Development Economics 20: 107–23. [Google Scholar] [CrossRef]
- Bahmani-Oskooee, Mohsen, and Farhang Niroomand. 1998. Long-Run Price Elasticities and the Marshall-Lerner Condition Revisited. Economics Letters 61: 101–9. [Google Scholar] [CrossRef]
- Bahmani-Oskooee, Mohsen, and Orhan Kara. 2005. Income and Price Elasticities of Trade: Some New Estimates. International Trade Journal 19: 165–78. [Google Scholar] [CrossRef]
- Bahmani-Oskooee, Mohsen, and Zohre Ardalani. 2006. Exchange Rate Sensitivity of U.S. Trade Flows: Evidence from Industry Data. Southern Economic Journal 72: 542–59. [Google Scholar] [CrossRef]
- Bahmani-Oskooee, Mohsen, and Scott W. Hegerty. 2007. Exchange Rate Volatility and Trade Flows: A Review Article. Journal of Economic Studies 34: 211–55. [Google Scholar] [CrossRef]
- Bahmani-Oskooee, Mohsen, and Scott W. Hegerty. 2009. The Effects of Exchange-Rate Volatility on Commodity Trade between the U.S. and Mexico. Southern Economic Journal 75: 1019–44. [Google Scholar] [CrossRef]
- Bahmani-Oskooee, Mohsen, and Muhammad Aftab. 2017. On the Asymmetric Effects of Exchange Rate Volatility on Trade Flows: New Evidence from US-Malaysia Trade at Industry Level. Economic Modelling 63: 86–103. [Google Scholar] [CrossRef]
- Bahmani-Oskooee, Mohsen, and Seyed Hesam Ghodsi. 2017. Policy Uncertainty and House Prices in the United States of America. Journal of Real Estate Portfolio Management 23: 73–85. [Google Scholar] [CrossRef]
- Bahmani-Oskooee, Mohsen, and Seyed Hesam Ghodsi. 2018. Asymmetric Causality between the U.S. Housing Market and its Stock Market: Evidence from State-Level Data. Journal of Economic Asymmetries 18: e00095. [Google Scholar] [CrossRef]
- Bahmani-Oskooee, Mohsen, Hanafiah Harvey, and Scott W. Hegerty. 2013. Empirical Tests of the Marshall-Lerner Condition: A Literature Review. Journal of Economic Studies 40: 411–43. [Google Scholar] [CrossRef]
- Bahmani-Oskooee, Mohsen, Ali Kutan, and Alice Kones. 2016. Policy Uncertainty and the Demand for Money in the United States. Applied Economics Quarterly 62: 37–49. [Google Scholar] [CrossRef]
- Bahmani-Oskooee, Mohsen, and Mehrnoosh Hasanzade. 2021. Policy Uncertainty and Income Distribution: Asymmetric Evidence from State-Level Data in the U.S. Bulletin of Economic Research. forthcoming. [Google Scholar] [CrossRef]
- Bahmani-Oskooee, Mohsen, Hanafiah Harvey, and Farhang Niroomand. 2018. On the Impact of Policy Uncertainty on Oil Prices: An Asymmetry Analysis. International Journal of Financial Studies 6: 12. [Google Scholar] [CrossRef] [Green Version]
- Baker, Scott R., Nicholas Bloom, and Steven J. Davis. 2016. Measuring Economic Policy Uncertainty. Quarterly Journal of Economics 131: 1593–636. [Google Scholar] [CrossRef]
- Banerjee, Anindya, Juan Dolado, and Ricardo Mestre. 1998. Error-Correction Mechanism Tests in a Single Equation Framework. Journal of Time Series Analysis 19: 267–85. [Google Scholar] [CrossRef] [Green Version]
- Brogaard, Jonathan, and Andrew Detzel. 2015. The Asset-Pricing Implications of Government Economic Policy Uncertainty. Management Science 61: 3–18. [Google Scholar] [CrossRef] [Green Version]
- Durmaz, Nazif. 2015. Industry Level J-curve in Turkey. Journal of Economic Studies 42: 689–706. [Google Scholar] [CrossRef]
- Engle, Robert F., and C. W. J. Granger. 1987. Cointegration and Error Correction: Representation, Estimation, and Testing. Econometrica 55: 251–76. [Google Scholar] [CrossRef]
- Hajilee, Massomeh, and Farhang Niroomand. 2019. On the Link between Financial Market Inclusion and Trade Openness: An Asymmetric Analysis. Economic Analysis and Policy 62: 373–81. [Google Scholar] [CrossRef]
- Halicioglu, Ferda. 2007. The J-Curve Dynamics of Turkish Bilateral Trade: A Cointegration Approach. Journal of Economic Studies 34: 103–19. [Google Scholar] [CrossRef]
- Han, Liyan, Mengchao Qi, and Libo Yin. 2016. Macroeconomic Policy Uncertainty Shocks on the Chinese Economy: A GVAR Analysis. Applied Economics 48: 4907–21. [Google Scholar] [CrossRef]
- Istiak, Khandokar, and Md Rafayet Alam. 2019. Oil Prices, Policy Uncertainty, and Asymmetries in Inflation Expectations. Journal of Economic Studies 46: 324–34. [Google Scholar] [CrossRef]
- Kang, Wensheng, and Ronald A. Ratti. 2013. Oil Shocks, Policy Uncertainty, and Stock Market Return. International Financial Markets, Institutions, and Money 26: 305–18. [Google Scholar] [CrossRef]
- Ko, Jun-Hyung, and Chang-Min Lee. 2015. International Economic Policy Uncertainty and Stock Prices: Wavelet Approach. Economics Letters 134: 118–22. [Google Scholar] [CrossRef]
- Pastor, Ľuboš, and Pietro Veronesi. 2013. Policy Uncertainty and Risk Premia. Journal of Financial Economics 110: 520–45. [Google Scholar] [CrossRef] [Green Version]
- Pesaran, Hashem M., Yongcheol Shin, and Richard J. Smith. 2001. Bounds Testing Approach to the Analysis of Level Relationships. Journal of Applied Econometrics 16: 289–326. [Google Scholar] [CrossRef]
- Tam, Pui Sun. 2018. Global trade flows and economic policy uncertainty. Applied Economics 50: 3718–34. [Google Scholar] [CrossRef]
- Wang, Yizhong, Carl R. Chen, and Ying Sophie Huang. 2014. Economic Policy Uncertainty and Corporate Investment: Evidence from China. Pacific-Basin Finance Journal 26: 227–43. [Google Scholar] [CrossRef]

| Code | # Lags on ΔPUKOR | |||||||
|---|---|---|---|---|---|---|---|---|
| 0 | 1 | 2 | 3 | 4 | 5 | 6 | 7 | |
| 00 Live animals | 0.063 | |||||||
| 01 Meat and preparations | −0.142 ** | |||||||
| 02 Dairy products and birds’ eggs | −0.162 ** | −0.153 ** | −0.169 ** | |||||
| 03 Fish, crustacean, and molluscs, and preparations thereof | −0.222 * | |||||||
| 04 Cereals and cereal preparations | −0.005 | |||||||
| 05 Vegetables and fruit | −0.170 ** | −0.055 | −0.018 | 0.026 | 0.062 | 0.116 ** | 0.129 ** | |
| 06 Sugar, sugar preparations, and honey | −0.029 | |||||||
| 07 Coffee, tea, cocoa, spices, and manufactures thereof | −0.015 | |||||||
| 08 Feeding stuff for animals (not including unmilled cereals) | 0.014 | |||||||
| 09 Miscellaneous edible products and preparations | −0.067 | |||||||
| 11 Beverages | 0.059 | −0.188 ** | −0.099 * | |||||
| 21 Hides, skins and furskins, raw | 0.054 | |||||||
| 22 Oil seeds and oleaginous fruit | 0.343 | −0.602 ** | ||||||
| 23 Crude rubber (including synthetic and reclaimed) | −0.038 | 0.259 ** | ||||||
| 24 Cork and wood | −0.034 | |||||||
| 25 Pulp and waste paper | −0.031 | −0.060 * | ||||||
| 26 Textile fibers (not wool tops) and their wastes (not in yarn) | 0.005 | |||||||
| 27 Crude fertilizer and crude minerals | −0.053 | |||||||
| 28 Metalliferous ores and metal scrap | 0.061 | |||||||
| 29 Crude animal and vegetable materials, nes | −0.022 | |||||||
| 33 Petroleum, petroleum products, and related materials | 0.015 | |||||||
| 41 Animal oils and fats | −0.203 | |||||||
| 42 Fixed vegetable oils and fats | −0.388 | 0.341 | 0.757 ** | 0.909 ** | ||||
| 43 Animal and vegetable oils and fats, processed and waxes | 0.030 | |||||||
| 51 Organic chemicals | 0.075 * | −0.007 | −0.066 | −0.153 ** | −0.076 * | −0.102 ** | ||
| 52 Inorganic chemicals | 0.102 | |||||||
| 53 Dyeing, tanning, and coloring materials | −0.033 | |||||||
| 54 Medicinal and pharmaceutical products | −0.070 | |||||||
| 55 Oils and perfume materials; toilet and cleansing preparations | −0.038 | |||||||
| 56 Fertilizers, manufactured | 0.119 | |||||||
| 57 Explosives and pyrotechnic products | −0.005 | |||||||
| 58 Artificial resins and plastic materials, and cellulose esters, etc | −0.101 ** | |||||||
| 59 Chemical materials and products, nes | −0.048 | −0.089 ** | −0.012 | 0.066 * | ||||
| 61 Leather, leather manufactures, nes, and dressed furskins | −0.185 * | |||||||
| 62 Rubber manufactures, nes # | 0.031 | |||||||
| 63 Cork and wood, cork manufactures | 0.009 | |||||||
| 64 Paper, paperboard, and articles of pulp, of paper, or of paperboard | −0.051 * | |||||||
| 65 Textile yarn, fabrics, made-up articles, nes, and related products | −0.036 | |||||||
| 66 Non-metallic mineral manufactures, nes | 0.014 | |||||||
| 67 Iron and steel | 0.069 | −0.113 * | ||||||
| 68 Non-ferrous metals. | −0.025 | |||||||
| 69 Manufactures of metals, nes | −0.091 ** | 0.085 ** | 0.043 | 0.069 ** | 0.076 ** | 0.058 * | 0.115 ** | 0.067 ** |
| 71 Power generating machinery and equipment | −0.087 | |||||||
| 72 Machinery specialized for particular industries | −0.068 | |||||||
| 73 Metalworking machinery | 0.009 | |||||||
| 74 General industrial machinery and equipment, nes, and parts of, nes | −0.049 | |||||||
| 75 Office machines and automatic data processing equipment | 0.008 | |||||||
| 76 Telecommunications, sound recording, and reproducing equipment | −0.055 | −0.168 ** | −0.265 ** | −0.062 | 0.015 | 0.103 | 0.227 ** | 0.157 ** |
| 77 Electric machinery, apparatus and appliances, nes, and parts, nes | 0.012 | |||||||
| 78 Road vehicles | −0.010 | |||||||
| 79 Other transport equipment | −0.045 | 0.415 ** | ||||||
| 81 Sanitary, plumbing, heating, lighting fixtures, and fittings, nes | −0.041 | |||||||
| 82 Furniture and parts thereof | 0.042 | 0.048 | 0.016 | 0.093 | 0.195 ** | 0.155 ** | 0.132 ** | 0.104 ** |
| 83 Travel goods, handbags, and similar containers | 0.184 ** | |||||||
| 84 Articles of apparel and clothing accessories | −0.037 | −0.108 | −0.125 * | −0.275 ** | −0.191 ** | 0.069 | −0.139 ** | |
| 85 Footwear | 0.086 | |||||||
| 87 Professional, scientific, controlling instruments, apparatus, nes | −0.064 * | −0.101 ** | −0.096 ** | −0.048 | −0.026 | 0.007 | 0.064 ** | 0.069 ** |
| 88 Photographic equipment and supplies, optical goods, watches, etc | −0.014 | 0.012 | −0.083 ** | |||||
| 89 Miscellaneous manufactured articles, nes | −0.068 | |||||||
| 93 Special transactions, commodity not classified according to class | −0.158 ** | |||||||
| 99 Estimate of non-Canadian low-value shipments | 0.009 | |||||||
| Code | # Lags on ΔPUUS | |||||||
|---|---|---|---|---|---|---|---|---|
| 0 | 1 | 2 | 3 | 4 | 5 | 6 | 7 | |
| 00 Live animals | 0.251 | |||||||
| 01 Meat and preparations | 0.078 | |||||||
| 02 Dairy products and birds’ eggs | 0.109 * | |||||||
| 03 Fish, crustacean and molluscs, and preparations thereof | −0.250 * | −0.128 | 0.076 | −0.139 | −0.388 ** | |||
| 04 Cereals and cereal preparations | −0.196 * | 0.202 * | ||||||
| 05 Vegetables and fruit | 0.068 | |||||||
| 06 Sugar, sugar preparations, and honey | 0.001 | |||||||
| 07 Coffee, tea, cocoa, spices, and manufactures thereof | 0.079 | |||||||
| 08 Feeding stuff for animals (not including unmilled cereals) | 0.037 | |||||||
| 09 Miscellaneous edible products and preparations | −0.008 | |||||||
| 11 Beverages | −0.102 | |||||||
| 21 Hides, skins and furskins, raw | −0.116 ** | |||||||
| 22 Oil seeds and oleaginous fruit | −0.334 | |||||||
| 23 Crude rubber (including synthetic and reclaimed) | −0.018 | −0.266 ** | 0.117 | 0.095 | −0.133 | |||
| 24 Cork and wood | −0.028 | |||||||
| 25 Pulp and waste paper | 0.068 | |||||||
| 26 Textile fibers (not wool tops) and their wastes (not in yarn) | −0.137 * | −0.122 | −0.108 | −0.016 | 0.062 | −0.030 | 0.183 ** | |
| 27 Crude fertilizer and crude minerals | 0.015 | |||||||
| 28 Metalliferous ores and metal scrap | −0.042 | −0.283 ** | −0.342 ** | −0.267 ** | −0.338 ** | −0.198 ** | −0.233 ** | |
| 29 Crude animal and vegetable materials, nes | 0.037 | −0.189 ** | −0.287 ** | −0.265 ** | −0.274 ** | −0.211 ** | −0.161 ** | |
| 33 Petroleum, petroleum products, and related materials | −0.252 * | −0.331 ** | −0.318 ** | |||||
| 41 Animal oils and fats | 0.003 | −0.353 ** | −0.215 | 0.101 | −0.391 ** | |||
| 42 Fixed vegetable oils and fats | 0.198 | |||||||
| 43 Animal and vegetable oils and fats, processed and waxes | −0.129 | |||||||
| 51 Organic chemicals | −0.054 | |||||||
| 52 Inorganic chemicals | −0.013 | |||||||
| 53 Dyeing, tanning, and coloring materials | −0.014 | |||||||
| 54 Medicinal and pharmaceutical products | 0.019 | |||||||
| 55 Oils and perfume materials; toilet and cleansing preparations | −0.004 | |||||||
| 56 Fertilizers, manufactured | 0.085 | |||||||
| 57 Explosives and pyrotechnic products | −0.006 | |||||||
| 58 Artificial resins and plastic materials, and cellulose esters, etc | 0.089 ** | |||||||
| 59 Chemical materials and products, nes | 0.057 | |||||||
| 61 Leather, leather manufactures, nes, and dressed furskins | 0.092 | |||||||
| 62 Rubber manufactures, nes # | −0.087 | |||||||
| 63 Cork and wood, cork manufactures | −0.200 ** | −0.094 | −0.176 ** | −0.083 | −0.096 | 0.128 | −0.004 | 0.163 ** |
| 64 Paper, paperboard, and articles of pulp, of paper, or of paperboard | 0.019 | |||||||
| 65 Textile yarn, fabrics, made-up articles, nes, and related products | −0.015 | |||||||
| 66 Non-metallic mineral manufactures, nes | −0.016 | |||||||
| 67 Iron and steel | −0.131 * | 0.049 | −0.141 ** | |||||
| 68 Non-ferrous metals. | −0.087 | |||||||
| 69 Manufactures of metals, nes | 0.051 | |||||||
| 71 Power generating machinery and equipment | 0.131 * | 0.079 | 0.107 | 0.211 ** | ||||
| 72 Machinery specialized for particular industries | 0.033 | |||||||
| 73 Metalworking machinery | −0.103 | 0.209 ** | ||||||
| 74 General industrial machinery and equipment, nes, and parts of, nes | −0.023 | |||||||
| 75 Office machines and automatic data processing equipment | −0.071 | |||||||
| 76 Telecommunications, sound recording, and reproducing equipment | −0.026 | 0.299 ** | 0.287 ** | 0.182 ** | 0.228 ** | 0.033 | ||
| 77 Electric machinery, apparatus and appliances, nes, and parts, nes | −0.033 | |||||||
| 78 Road vehicles | −0.073 | −0.116 * | ||||||
| 79 Other transport equipment | 0.040 | −0.474 ** | ||||||
| 81 Sanitary, plumbing, heating, lighting fixtures, and fittings, nes | −0.170 | |||||||
| 82 Furniture and parts thereof | 0.009 | |||||||
| 83 Travel goods, handbags, and similar containers | −0.107 | |||||||
| 84 Articles of apparel and clothing accessories | −0.030 | 0.027 | 0.250 ** | 0.233 ** | 0.194 ** | 0.071 | 0.194 ** | |
| 85 Footwear | −0.115 | |||||||
| 87 Professional, scientific, controlling instruments, apparatus, nes | 0.067 | 0.137 ** | 0.189 ** | 0.149 ** | ||||
| 88 Photographic equipment and supplies, optical goods, watches, etc | 0.017 | |||||||
| 89 Miscellaneous manufactured articles, nes | −0.007 | |||||||
| 93 Special transactions, commodity not classified according to class | 0.039 | |||||||
| 99 Estimate of non-Canadian low-value shipments | −0.003 | |||||||
| Industries | Sharec | Constant | Ln YtKOR | Ln REXt | Ln PUtKOR | Ln PUtUS |
|---|---|---|---|---|---|---|
| 00 Live animals #a | 0.045% | 10.571 (5.291) ** | 1.363 (4.093) ** | −0.743 (0.807) b | 0.067 (0.339) | 0.267 (1.157) |
| 01 Meat and preparations | 4.343% | −0.430 (3.411) ** | 2.197 (2.120) ** | 1.408 (0.471) | −0.232 (0.355) | 0.828 (1.173) |
| 02 Dairy products and birds’ eggs # | 0.532% | 2.283 (4.651) ** | 2.773 (6.204) ** | −1.132 (0.870) | −0.169 (0.568) | 0.488 (1.716) * |
| 03 Fish, crustacean and molluscs, and preparations thereof # | 0.906% | 15.737 (6.081) ** | 0.132 (0.478) | 0.033 (0.041) | −0.238 (1.591) | 0.111 (0.488) |
| 04 Cereals and cereal preparations # | 1.561% | 3.565 (6.644) ** | 1.731 (3.060) ** | 0.041 (0.026) | −0.423 (1.065) | −0.055 (0.127) |
| 05 Vegetables and fruit # | 1.745% | 1.387 (4.347) ** | 2.147 (7.541) ** | 0.565 (0.720) | −0.385 (1.787) * | 0.234 (1.336) |
| 06 Sugar, sugar preparations, and honey # | 0.076% | 3.629 (3.696) ** | 0.892 (1.874) * | −0.971 (0.715) | −0.148 (0.521) | 0.007 (0.021) |
| 07 Coffee, tea, cocoa, spices, and manufactures thereof # | 0.314% | 1.499 (5.324) ** | 2.051 (11.650) ** | 0.440 (0.894) | −0.029 (0.266) | 0.153 (1.253) |
| 08 Feeding stuff for animals (not including unmilled cereals) | 1.282% | 0.629 (6.418) ** | 2.396 (11.109) ** | 0.657 (1.098) | 0.028 (0.219) | 0.075 (0.514) |
| 09 Miscellaneous edible products and preparations # | 1.078% | −1.059 (3.775) ** | 1.962 (4.131) ** | 2.389 (1.749) * | −0.409 (1.431) | −0.051 (0.167) |
| 11 Beverages | 0.190% | 5.212 (3.173) ** | −0.341 (0.255) | −5.161 (1.314) | 1.065 (1.188) | 0.639 (0.840) |
| 21 Hides, skins and furskins, raw | 0.266% | −1.486 (2.962) ** | −1.273 (0.952) | −1.231 (0.328) | −0.974 (0.929) | 2.096 (1.099) |
| 22 Oil seeds and oleaginous fruit # | 0.792% | 21.274 (9.667) ** | −0.579 (1.872) * | 0.041 (0.047) | 0.251 (1.185) | 0.306 (1.327) |
| 23 Crude rubber (including synthetic and reclaimed) | 0.111% | 6.626 (5.215) ** | 0.926 (2.217) ** | −0.893 (0.739) | −0.308 (1.152) | 0.111 (0.302) |
| 24 Cork and wood # | 0.142% | 5.761 (3.120) ** | −0.437 (0.875) | −0.525 (0.380) | −0.136 (0.455) | −0.112 (0.320) |
| 25 Pulp and waste paper | 0.511% | 6.063 (5.901) ** | 0.049 (0.244) | −0.221 (0.404) | −0.264 (1.944) * | 0.209 (1.561) |
| 26 Textile fibers (not wool tops) and their wastes (not in yarn) # | 0.385% | 5.865 (4.919) ** | 0.240 (0.682) | −0.076 (0.076) | 0.013 (0.074) | 0.109 (0.359) |
| 27 Crude fertilizer and crude minerals # | 0.114% | 8.664 (7.621) ** | −0.122 (1.147) | 0.104 (0.351) | −0.096 (1.531) | 0.027 (0.366) |
| 28 Metalliferous ores and metal scrap # | 2.678% | 12.162 (6.174) ** | 0.549 (1.265) | −2.771 (2.244) ** | 0.162 (0.781) | 0.487 (1.338) |
| 29 Crude animal and vegetable materials, nes # | 0.188% | 8.871 (9.292) ** | 0.639 (3.431) ** | −0.668 (1.251) | −0.233 (2.285) ** | 0.649 (4.058) ** |
| 33 Petroleum, petroleum products, and related materials # | 17.503% | 1.632 (1.293) | 1.589 (0.376) | −3.495 (0.280) | 0.272 (0.122) | 1.194 (0.356) |
| 41 Animal oils and fats | 0.086% | 3.226 (2.321) ** | 0.097 (0.050) | −1.168 (0.208) | 0.571 (0.542) | −0.261 (0.157) |
| 42 Fixed vegetable oils and fats | 0.473% | −6.639 (4.517) ** | 1.695 (0.848) | 3.426 (0.611) | 0.202 (0.153) | 0.643 (0.533) |
| 43 Animal and vegetable oils and fats, processed and waxes | 0.012% | 5.726 (4.524) ** | 0.394 (0.635) | −0.338 (0.196) | 0.077 (0.207) | −0.334 (0.766) |
| 51 Organic chemicals | 4.545% | 7.253 (4.774) ** | −0.007 (0.021) | −1.808 (1.983) ** | 0.684 (2.796) ** | −0.217 (1.034) |
| 52 Inorganic chemicals # | 1.145% | 17.387 (15.138) ** | 0.838 (6.083) ** | −0.716 (1.826) * | 0.108 (1.356) | −0.014 (0.147) |
| 53 Dyeing, tanning, and coloring materials # | 0.549% | 1.536 (6.511) ** | 1.281 (6.851) ** | 1.022 (1.925) * | −0.096 (0.884) | −0.040 (0.312) |
| 54 Medicinal and pharmaceutical products | 1.922% | −2.337 (5.281) ** | 2.658 (13.398) ** | 1.615 (2.883) ** | −0.156 (1.336) | 0.042 (0.301) |
| 55 Oils and perfume materials; toilet and cleansing preparations # | 1.093% | 0.811 (4.018) ** | 1.605 (8.668) ** | 1.093 (2.078) ** | −0.148 (1.322) | −0.015 (0.122) |
| 56 Fertilizers, manufactured | 0.264% | 22.819 (4.497) ** | −1.450 (2.398) ** | −2.651 (1.499) | 0.207 (0.558) | 0.147 (0.359) |
| 57 Explosives and pyrotechnic products # | 1.927% | 9.900 (7.572) ** | 0.972 (12.307) ** | −0.668 (3.057) ** | −0.008 (0.182) | −0.012 (0.219) |
| 58 Artificial resins and plastic materials, and cellulose esters, etc # | 0.400% | 11.822 (8.409) ** | 0.445 (5.721) ** | −0.260 (1.197) | −0.141 (2.933) ** | 0.125 (2.301) ** |
| 59 Chemical materials and products, nes | 2.475% | 7.103 (7.389) ** | 1.302 (10.535) ** | −0.089 (0.258) | −0.0004 (0.004) | 0.099 (1.263) |
| 61 Leather, leather manufactures, nes, and dressed furskins | 0.007% | 2.924 (2.431) ** | −1.815 (0.594) | −3.637 (0.406) | −3.581 (1.093) | 1.782 (0.667) |
| 62 Rubber manufactures, nes # | 0.263% | 0.077 (3.811) ** | 2.093 (4.015) ** | 1.052 (0.749) | 0.196 (0.647) | −0.550 (1.315) |
| 63 Cork and wood, cork manufactures # | 0.046% | 7.012 (5.319) ** | −0.713 (1.548) | −0.935 (0.712) | 0.032 (0.143) | 0.031 (0.078) |
| 64 Paper, paperboard, and articles of pulp, of paper, or of paperboard # | 0.497% | 4.988 (4.753) ** | 0.557 (4.435) ** | 0.281 (0.813) | −0.129 (1.585) | 0.048 (0.566) |
| 65 Textile yarn, fabrics, made-up articles, nes, and related products | 0.269% | 0.816 (3.935) ** | 0.633 (1.851) * | 1.461 (1.391) | −0.207 (1.158) | −0.084 (0.415) |
| 66 Non-metallic mineral manufactures, nes # | 0.648% | 7.629 (7.263) ** | 0.859 (7.421) ** | −0.467 (1.404) | 0.030 (0.461) | 0.099 (1.183) |
| 67 Iron and steel # | 0.319% | 3.906 (4.303) ** | 0.916 (1.238) | −2.269 (1.036) | 1.315 (1.988) ** | −0.691 (1.254) |
| 68 Non-ferrous metals # | 1.178% | 9.945 (4.706) ** | 0.749 (2.343) ** | −2.034 (2.183) ** | −0.071 (0.409) | 0.119 (0.529) |
| 69 Manufactures of metals, nes | 1.000% | 2.110 (5.470) ** | 1.575 (10.064) ** | 0.863 (2.011) ** | −0.405 (3.310) ** | 0.133 (1.346) |
| 71 Power generating machinery and equipment | 1.811% | 10.889 (6.889) ** | 0.589 (3.099) ** | −0.050 (0.092) | −0.135 (1.402) | −0.104 (0.685) |
| 72 Machinery specialized for particular industries | 6.437% | 2.289 (5.321) ** | 1.899 (5.172) ** | 0.491 (0.495) | −0.228 (1.102) | 0.113 (0.457) |
| 73 Metalworking machinery | 0.178% | 9.253 (4.454) ** | −1.604 (2.492) ** | −1.557 (0.826) | 0.038 (0.107) | −0.935 (2.003) ** |
| 74 General industrial machinery and equipment, nes, and parts of, nes | 2.554% | 3.319 (4.233) ** | 0.962 (4.198) ** | 0.515 (0.799) | −0.174 (1.278) | −0.081 (0.501) |
| 75 Office machines and automatic data processing equipment | 1.177% | 3.524 (3.676) ** | −0.679 (0.889) | 0.065 (0.039) | 0.052 (0.153) | −0.446 (0.963) |
| 76 Telecommunications, sound recording, and reproducing equipment | 1.042% | 4.654 (4.796) ** | −0.245 (0.584) | 0.983 (0.839) | 0.187 (0.663) | −0.641 (1.820) * |
| 77 Electric machinery, apparatus and appliances, nes, and parts, nes # | 8.815% | 6.702 (4.565) ** | −0.693 (3.915) ** | −1.279 (2.566) ** | 0.056 (0.565) | 0.013 (0.106) |
| 78 Road vehicles # | 3.962% | 6.102 (6.399) ** | 1.695 (4.812) ** | −1.435 (1.434) | −0.033 (0.172) | 0.155 (0.586) |
| 79 Other transport equipment | 4.564% | 4.593 (5.299) ** | 0.932 (1.958) * | 1.335 (0.979) | −0.622 (1.839) * | −0.017 (0.045) |
| 81 Sanitary, plumbing, heating, lighting fixtures, and fittings, nes | 0.130% | −1.593 (4.188) ** | 1.076 (1.840) * | 2.704 (1.688) * | −0.144 (0.437) | −0.593 (1.364) |
| 82 Furniture and parts thereof | 0.130% | −1.068 (3.575) ** | 1.963 (2.301) ** | 2.694 (1.133) | −1.188 (1.762) * | 0.061 (0.143) |
| 83 Travel goods, handbags, and similar containers | 0.031% | 9.379 (3.416) ** | −1.758 (2.113) ** | −3.003 (1.435) | 0.822 (1.583) | −0.479 (0.986) |
| 84 Articles of apparel and clothing accessories | 0.186% | 5.342 (4.639) ** | 1.349 (4.237) ** | −0.749 (0.833) | 0.334 (1.544) | −0.378 (1.376) |
| 85 Footwear | 0.067% | 5.134 (3.753) ** | −1.691 (0.353) | −11.662 (0.931) | 1.795 (0.838) | −2.416 (0.957) |
| 87 Professional, scientific, controlling instruments, apparatus, nes | 4.707% | 5.523 (5.084) ** | 0.985 (3.605) ** | −0.643 (0.581) | 0.329 (1.562) | −0.574 (1.951) * |
| 88 Photographic equipment and supplies, optical goods, watches, etc # | 0.802% | 8.179 (4.641) ** | −0.523 (1.342) | −2.599 (2.416) ** | 0.176 (0.802) | 0.075 (0.302) |
| 89 Miscellaneous manufactured articles, nes | 2.359% | 8.434 (4.614) ** | 0.544 (2.572) ** | −0.075 (0.131) | −0.138 (1.039) | −0.015 (0.103) |
| 93 Special transactions, commodity not classified according to class # | 0.557% | −2.618 (5.249) ** | 1.334 (3.921) ** | 2.762 (2.746) ** | −0.435 (1.926) * | 0.199 (0.499) |
| 99 Estimate of non-Canadian low-value shipments | 0.946% | 1.807 (3.740) ** | 0.675 (2.467) ** | 0.067 (0.091) | 0.067 (0.429) | −0.019 (0.103) |
| Industries | Diagnostics | ||||||
|---|---|---|---|---|---|---|---|
| F Stat a | (t-Test) b | LM c | RESET d | CUSUM | CUSUMSQ | Adj. R2 | |
| 00 Live animals | 5.50 ** | −0.941 (5.292) ** | 0.129 | 0.785 | S | S | 0.63 |
| 01 Meat and preparations | 2.34 | −0.094 (3.446) | 0.349 | 0.073 | S | US | 0.08 |
| 02 Dairy products and birds’ eggs | 4.13 ** | −0.223 (4.586) ** | 0.309 | 3.200 * | S | S | 0.27 |
| 03 Fish, crustacean and molluscs, and preparations thereof | 7.20 ** | −0.933 (6.057) ** | 5.774 ** | 0.311 | S | S | 0.71 |
| 04 Cereals and cereal preparations | 8.69 ** | −0.288 (6.649) ** | 0.012 | 0.837 | S | S | 0.20 |
| 05 Vegetables and fruit | 3.63* | −0.290 (4.297) ** | 4.98 ** | 2.61 | US | S | 0.59 |
| 06 Sugar, sugar preparations, and honey | 2.67 | −0.196 (3.687) * | 0.466 | 0.144 | S | S | 0.36 |
| 07 Coffee, tea, cocoa, spices, and manufactures thereof | 5.42 ** | −0.519 (5.254) ** | 9.979 ** | 1.771 | S | S | 0.35 |
| 08 Feeding stuff for animals (not including unmilled cereals) | 8.43 ** | −0.495 (6.549) ** | 0.086 | 1.448 | S | US | 0.39 |
| 09 Miscellaneous edible products and preparations | 2.90 | −0.163 (3.841) * | 0.314 | 10.159 ** | S | S | 0.35 |
| 11 Beverages | 1.94 | −0.115 (3.146) | 0.179 | 2.721 * | S | S | 0.36 |
| 21 Hides, skins and furskins, raw | 1.66 | 0.055 (2.908) | 0.059 | 12.690 ** | S | S | 0.35 |
| 22 Oil seeds and oleaginous fruit | 18.38 ** | −1.312 (9.673) ** | 0.020 | 7.955 ** | S | S | 0.43 |
| 23 Crude rubber (including synthetic and reclaimed) | 5.35 ** | −0.358 (5.216) ** | 0.092 | 2.439 | S | S | 0.45 |
| 24 Cork and wood | 1.93 | −0.252 (3.134) | 0.293 | 0.029 | S | S | 0.54 |
| 25 Pulp and waste paper | 6.90 ** | −0.324 (5.928) ** | 0.528 | 0.012 | S | S | 0.45 |
| 26 Textile fibers (not wool tops) and their wastes (not in yarn) | 4.77 ** | −0.379 (4.929) ** | 0.703 | 0.275 | S | S | 0.30 |
| 27 Crude fertilizer and crude minerals | 11.44 ** | −0.553 (7.631) ** | 1.619 | 8.018 ** | S | S | 0.33 |
| 28 Metalliferous ores and metal scrap | 7.47 ** | −0.377 (6.168) ** | 1.057 | 1.505 | S | S | 0.31 |
| 29 Crude animal and vegetable materials, nes | 16.86 ** | −0.574 (9.298) ** | 0.017 | 1.245 | S | S | 0.46 |
| 33 Petroleum, petroleum products, and related materials | 0.32 | −0.056 (1.269) | 0.011 | 5.476 ** | S | S | 0.26 |
| 41 Animal oils and fats | 1.06 | −0.158 (2.320) | 0.224 | 0.301 | S | S | 0.32 |
| 42 Fixed vegetable oils and fats | 4.00* | −0.307 (4.512) ** | 0.816 | 0.072 | S | S | 0.44 |
| 43 Animal and vegetable oils and fats, processed and waxes | 4.01 ** | −0.388 (4.516) ** | 0.439 | 4.465 ** | S | S | 0.39 |
| 51 Organic chemicals | 4.49 ** | −0.247 (4.779) ** | 0.864 | 0.029 | S | S | 0.39 |
| 52 Inorganic chemicals | 45.09 ** | −0.945 (15.141) ** | 4.470 ** | 0.422 | S | US | 0.48 |
| 53 Dyeing, tanning, and coloring materials | 8.29 ** | −0.347 (6.491) ** | 0.194 | 2.916 * | S | S | 0.25 |
| 54 Medicinal and pharmaceutical products | 5.59 ** | −0.449 (5.332) ** | 1.932 | 0.142 | S | S | 0.48 |
| 55 Oils and perfume materials; toilet and cleansing preparations | 3.11 | −0.255 (−3.981) * | 0.424 | 0.441 | S | S | 0.45 |
| 56 Fertilizers, manufactured | 3.98* | −0.577 (4.499) ** | 0.292 | 10.609 ** | S | S | 0.53 |
| 57 Explosives and pyrotechnic products | 11.28 ** | −0.537 (7.577) ** | 1.658 | 0.073 | S | S | 0.41 |
| 58 Artificial resins and plastic materials, and cellulose esters, etc | 13.90 ** | −0.714 (8.413) ** | 0.389 | 2.359 | S | S | 0.39 |
| 59 Chemical materials and products, nes | 10.69 ** | −0.576 (7.376) ** | 1.759 | 4.636 ** | S | S | 0.46 |
| 61 Leather, leather manufactures, nes, and dressed furskins | 1.19 | −0.052 (2.457) | 1.030 | 0.008 | S | US | 0.25 |
| 62 Rubber manufactures, nes | 3.81* | −0.158 (4.401) ** | 4.721 ** | 9.169 ** | S | S | 0.23 |
| 63 Cork and wood, cork manufactures | 5.56 ** | −0.289 (5.322) ** | 1.375 | 1.095 | S | S | 0.28 |
| 64 Paper, paperboard, and articles of pulp, of paper, or of paperboard | 4.43 ** | −0.392 (4.747) ** | 4.193 ** | 1.557 | S | S | 0.34 |
| 65 Textile yarn, fabrics, made-up articles, nes, and related products | 3.12 | −0.175 (3.986) * | 0.488 | 0.257 | S | S | 0.31 |
| 66 Non-metallic mineral manufactures, nes | 10.37 ** | −0.483 (7.263) ** | 0.091 | 0.486 | S | S | 0.35 |
| 67 Iron and steel | 3.65* | −0.155 (4.313) ** | 0.034 | 0.011 | S | S | 0.41 |
| 68 Non-ferrous metals. | 4.34 ** | −0.349 (4.699) ** | 6.302 ** | 0.002 | S | S | 0.43 |
| 69 Manufactures of metals, nes | 5.92 ** | −0.386 (5.489) ** | 0.000 | 1.777 | S | S | 0.41 |
| 71 Power generating machinery and equipment | 9.32 ** | −0.641 (6.887) ** | 2.796 * | 0.322 | S | S | 0.45 |
| 72 Machinery specialized for particular industries | 5.61 ** | −0.296 (5.341) ** | 1.039 | 2.238 | S | S | 0.27 |
| 73 Metalworking machinery | 3.91 * | −0.237 (4.460) ** | 0.055 | 4.731 ** | S | S | 0.26 |
| 74 General industrial machinery and equipment, nes, and parts of, nes | 3.53 * | −0.281 (4.235) ** | 0.145 | 1.237 | S | S | 0.36 |
| 75 Office machines and automatic data processing equipment | 2.69 | −0.159 (3.701) * | 0.881 | 1.255 | S | S | 0.48 |
| 76 Telecommunications, sound recording, and reproducing equipment | 4.56 ** | −0.327 (4.824) ** | 0.016 | 5.949 ** | S | S | 0.37 |
| 77 Electric machinery, apparatus and appliances, nes, and parts, nes | 4.10 ** | −0.212 (4.568) ** | 0.386 | 0.006 | S | S | 0.28 |
| 78 Road vehicles | 8.00 ** | −0.302 (6.383) ** | 0.019 | 0.027 | S | S | 0.20 |
| 79 Other transport equipment | 5.57 ** | −0.534 (5.326) ** | 1.059 | 0.903 | S | S | 0.52 |
| 81 Sanitary, plumbing, heating, lighting fixtures, and fittings, nes | 3.50 | −0.287 (4.223) ** | 0.029 | 2.593 | S | S | 0.37 |
| 82 Furniture and parts thereof | 2.48 | −0.149 (3.557) | 0.533 | 0.014 | S | S | 0.44 |
| 83 Travel goods, handbags, and similar containers | 2.30 | −0.223 (3.423) | 1.088 | 0.005 | S | S | 0.47 |
| 84 Articles of apparel and clothing accessories | 4.21 ** | −0.355 (4.637) ** | 1.488 | 3.126 * | S | S | 0.47 |
| 85 Footwear | 2.77 | −0.048 (3.752) * | 5.070 ** | 1.928 | S | S | 0.35 |
| 87 Professional, scientific, controlling instruments, apparatus, nes | 5.06 ** | −0.274 (5.079) ** | 1.220 | 0.309 | S | S | 0.58 |
| 88 Photographic equipment and supplies, optical goods, watches, etc | 4.23 ** | −0.223 (4.638) ** | 7.025 ** | 0.169 | S | S | 0.24 |
| 89 Miscellaneous manufactured articles, nes | 4.20 ** | −0.492 (4.621) ** | 0.287 | 2.850 * | S | S | 0.47 |
| 93 Special transactions, commodity not classified according to class | 5.35 ** | −0.363 (5.217) ** | 1.012 | 0.053 | S | S | 0.40 |
| 99 Estimate of non-Canadian low-value shipments | 2.76 | −0.134 (3.746) * | 1.847 | 0.015 | S | S | 0.27 |
| Code | # Lags on ΔPUKOR | |||||||
|---|---|---|---|---|---|---|---|---|
| 0 | 1 | 2 | 3 | 4 | 5 | 6 | 7 | |
| 02 Dairy products and birds’ eggs | 0.005 | −0.365 ** | −0.229 ** | −0.225 ** | −0.166 * | |||
| 03 Fish, crustacean and molluscs, and preparations thereof | 0.049 | −0.146 ** | −0.147 ** | |||||
| 04 Cereals and cereal preparations | −0.033 | |||||||
| 05 Vegetables and fruit | 0.084 | 0.156 ** | ||||||
| 06 Sugar, sugar preparations, and honey | −0.088 | |||||||
| 07 Coffee, tea, cocoa, spices, and manufactures thereof | 0.049 | |||||||
| 09 Miscellaneous edible products and preparations | −0.019 | |||||||
| 11 Beverages | 0.010 | −0.077 * | −0.136 ** | −0.092 ** | −0.156 ** | −0.069 * | ||
| 12 Tobacco and tobacco manufactures | −0.049 | |||||||
| 26 Textile fibers (not wool tops) and their wastes (not in yarn) | 0.059 | |||||||
| 27 Crude fertilizer and crude minerals | −0.005 | −0.23 | −0.092 | −0.059 | −0.081 | 0.152 ** | ||
| 28 Metalliferous ores and metal scrap | 0.090 | |||||||
| 29 Crude animal and vegetable materials, nes | −0.026 | |||||||
| 33 Petroleum, petroleum products, and related materials | 0.008 | −0.319 ** | −0.316 ** | −0.091 | −0.308 ** | |||
| 34 Gas, natural and manufactured | −0.349 ** | |||||||
| 51 Organic chemicals | −0.190 ** | |||||||
| 52 Inorganic chemicals | −0.113 | −0.086 | −0.205 ** | |||||
| 54 Medicinal and pharmaceutical products | 0.099 | 0.010 | 0.033 | −0.019 | −0.454 ** | |||
| 55 Oils and perfume materials; toilet and cleansing preparations | −0.004 | |||||||
| 57 Explosives and pyrotechnic products | −0.125 ** | −0.090 ** | ||||||
| 58 Artificial resins and plastic materials, and cellulose esters, etc | −0.031 | |||||||
| 59 Chemical materials and products, nes | −0.015 | −0.143 ** | −0.110 ** | −0.085 ** | −0.115 ** | −0.112 ** | ||
| 61 Leather, leather manufactures, nes, and dressed furskins | −0.028 | |||||||
| 62 Rubber manufactures, nes # | 0.027 | |||||||
| 63 Cork and wood, cork manufactures | −0.082 | |||||||
| 64 Paper, paperboard, and articles of pulp, of paper, or of paperboard | −0.044 * | |||||||
| 65 Textile yarn, fabrics, made-up articles, nes, and related products | −0.032 * | −0.051 ** | −0.044 ** | −0.047 ** | −0.037 ** | −0.039 ** | ||
| 67 Iron and steel | −0.171 ** | |||||||
| 68 Non-ferrous metals | 0.027 | |||||||
| 69 Manufactures of metals, nes | 0.006 | |||||||
| 71 Power generating machinery and equipment | −0.152 ** | −0.057 | 0.018 | 0.018 | −0.135 ** | |||
| 72 Machinery specialized for particular industries | 0.058 | −0.155 ** | −0.211 ** | −0.087 ** | −0.059 | −0.118 ** | ||
| 73 Metalworking machinery | −0.065 | −0.138 ** | ||||||
| 74 General industrial machinery and equipment, nes, and parts of, nes | −0.038 | −0.115 ** | −0.047 | −0.065 ** | ||||
| 75 Office machines and automatic data processing equipment | −0.027 | |||||||
| 76 Telecommunications, sound recording, and reproducing equipment | −0.049 | |||||||
| 77 Electric machinery, apparatus and appliances, nes, and parts, nes | −0.033 | |||||||
| 78 Road vehicles | 0.148 ** | −0.021 | 0.030 | −0.075 ** | −0.141 ** | |||
| 79 Other transport equipment | −0.122 | −0.165 | −0.263 ** | |||||
| 81 Sanitary, plumbing, heating, lighting fixtures, and fittings, nes | 0.130 * | |||||||
| 82 Furniture and parts thereof | −0.008 | |||||||
| 83 Travel goods, handbags, and similar containers | −0.065 | |||||||
| 84 Articles of apparel and clothing accessories | −0.016 | 0.039 | 0.076 * | 0.021 | −0.042 | −0.101 ** | −0.064 ** | |
| 85 Footwear | 0.014 | |||||||
| 87 Professional, scientific, controlling instruments, apparatus, nes | 0.009 | −0.060 | −0.042 | 0.104 ** | 0.039 | −0.029 | 0.048 | |
| 88 Photographic equipment and supplies, optical goods, watches, etc | 0.032 | 0.095 ** | 0.027 | 0.094 ** | 0.086 ** | 0.035 | 0.088 ** | 0.139 ** |
| 89 Miscellaneous manufactured articles, nes | −0.022 | −0.061 ** | −0.014 | −0.034 | −0.048 ** | −0.029 | 0.045 ** | |
| 93 Special transactions, commodity not classified according to class | 0.005 | |||||||
| 98 Estimate of import items valued under $251 and others | 0.009 | |||||||
| Code | # Lags on ΔPUUS | |||||||
|---|---|---|---|---|---|---|---|---|
| 0 | 1 | 2 | 3 | 4 | 5 | 6 | 7 | |
| 02 Dairy products and birds’ eggs | 0.112 | |||||||
| 03 Fish, crustacean and molluscs, and preparations thereof | 0.012 | |||||||
| 04 Cereals and cereal preparations | 0.006 | |||||||
| 05 Vegetables and fruit | 0.196 ** | −0.279 ** | ||||||
| 06 Sugar, sugar preparations, and honey | −0.091 | |||||||
| 07 Coffee, tea, cocoa, spices, and manufactures thereof | 0.113 | |||||||
| 09 Miscellaneous edible products and preparations | 0.066 * | |||||||
| 11 Beverages | 0.047 | |||||||
| 12 Tobacco and tobacco manufactures | 0.036 | |||||||
| 26 Textile fibers (not wool tops) and their wastes (not in yarn) | −0.068 | |||||||
| 27 Crude fertilizer and crude minerals | 0.089 | |||||||
| 28 Metalliferous ores and metal scrap | −0.101 | 0.580 ** | ||||||
| 29 Crude animal and vegetable materials, nes | 0.016 | −0.226 ** | ||||||
| 33 Petroleum, petroleum products, and related materials | 0.278 | 0.254 | 0.238 | 0.165 | 0.715 ** | |||
| 34 Gas, natural and manufactured | 0.181 | |||||||
| 51 Organic chemicals | 0.214 ** | |||||||
| 52 Inorganic chemicals | 0.093 | 0.155 | 0.334 ** | 0.250 ** | 0.057 | −0.145 | 0.148 * | |
| 54 Medicinal and pharmaceutical products | −0.089 | |||||||
| 55 Oils and perfume materials; toilet and cleansing preparations | 0.034 | |||||||
| 57 Explosives and pyrotechnic products | 0.129 ** | 0.073 * | ||||||
| 58 Artificial resins and plastic materials, and cellulose esters, etc | 0.009 | |||||||
| 59 Chemical materials and products, nes | 0.086 | 0.097 | 0.128 ** | |||||
| 61 Leather, leather manufactures, nes, and dressed furskins | −0.103 | |||||||
| 62 Rubber manufactures, nes # | −0.020 | |||||||
| 63 Cork and wood, cork manufactures | 0.094 | |||||||
| 64 Paper, paperboard, and articles of pulp, of paper, or of paperboard | 0.035 | |||||||
| 65 Textile yarn, fabrics, made-up articles, nes, and related products | 0.012 | |||||||
| 67 Iron and steel | 0.236 ** | |||||||
| 68 Non-ferrous metals | −0.009 | |||||||
| 69 Manufactures of metals, nes | 0.029 | |||||||
| 71 Power generating machinery and equipment | 0.132 ** | |||||||
| 72 Machinery specialized for particular industries | −0.040 | |||||||
| 73 Metalworking machinery | 0.117 | |||||||
| 74 General industrial machinery and equipment, nes, and parts of, nes | 0.036 | |||||||
| 75 Office machines and automatic data processing equipment | 0.001 | −0.087 ** | ||||||
| 76 Telecommunications, sound recording, and reproducing equipment | −0.036 | |||||||
| 77 Electric machinery, apparatus and appliances, nes, and parts, nes | 0.029 | |||||||
| 78 Road vehicles | −0.141 ** | |||||||
| 79 Other transport equipment | 0.113 | |||||||
| 81 Sanitary, plumbing, heating, lighting fixtures, and fittings, nes | 0.144 * | |||||||
| 82 Furniture and parts thereof | 0.023 | |||||||
| 83 Travel goods, handbags, and similar containers | 0.148 ** | |||||||
| 84 Articles of apparel and clothing accessories | 0.056 | 0.045 | −0.052 | −0.056 | 0.068 | |||
| 85 Footwear | −0.062 | |||||||
| 87 Professional, scientific, controlling instruments, apparatus, nes | 0.082 * | −0.014 | 0.089 * | −0.122 ** | ||||
| 88 Photographic equipment and supplies, optical goods, watches, etc | 0.019 | |||||||
| 89 Miscellaneous manufactured articles, nes | 0.035 | |||||||
| 93 Special transactions, commodity not classified according to class | −0.112 | |||||||
| 98 Estimate of import items valued under $251 and others | −0.012 | |||||||
| Industries | Sharec | Constant | Ln YtUS | Ln REXt | Ln PUtKOR | Ln PUtUS |
|---|---|---|---|---|---|---|
| 02 Dairy products and birds’ eggs #a | 0.013% | 4.959 (4.628) ** | 3.828 (2.095) ** | −3.048 (2.236) ** | 0.325 (1.012) b | 0.305 (1.015) |
| 03 Fish, crustacean and molluscs, and preparations thereof # | 0.207% | 2.381 (2.672) ** | 1.673 (0.987) | −0.509 (0.399) | 0.293 (1.115) | 0.050 (0.199) |
| 04 Cereals and cereal preparations # | 0.162% | 0.476 (1.506) | 0.614 (0.004) | −17.538 (0.056) | −14.159 (0.057) | 2.529 (0.063) |
| 05 Vegetables and fruit# | 0.264% | −7.136 (5.353) ** | 7.973 (5.626) ** | −0.241 (0.239) | −0.156 (0.625) | 1.105 (3.706) ** |
| 06 Sugar, sugar preparations, and honey # | 0.006% | −4.945 (6.838) ** | 1.690 (1.655) * | 2.135 (2.948) ** | −0.155 (1.058) | −0.160 (0.959) |
| 07 Coffee, tea, cocoa, spices, and manufactures thereof # | 0.023% | 0.376 (2.873) ** | 4.197 (1.573) | −1.582 (0.845) | 0.216 (0.602) | 0.499 (1.211) |
| 09 Miscellaneous edible products and preparations# | 0.276% | −2.239 (2.444) ** | 3.579 (0.605) | −8.899 (0.874) | 0.470 (0.509) | 0.766 (0.634) |
| 11 Beverages | 0.147% | 1.498 (2.245) ** | 2.804 (0.807) | −2.679 (1.086) | 0.338 (0.607) | 0.538 (1.018) |
| 12 Tobacco and tobacco manufactures # | 0.108% | −8.897 (4.623) ** | 8.999 (3.972) ** | 2.459 (1.528) | −0.243 (0.759) | 0.177 (0.507) |
| 26 Textile fibers (not wool tops) and their wastes (not in yarn) # | 0.256% | 9.135 (9.445) ** | 1.239 (2.504) ** | −0.829 (2.381) ** | 0.107 (1.526) | −0.122 (1.517) |
| 27 Crude fertilizer and crude minerals # | 0.025% | −6.919 (4.872) ** | 5.109 (3.492) ** | 1.237 (1.248) | −0.021 (0.084) | 0.259 (1.090) |
| 28 Metalliferous ores and metal scrap # | 0.021% | 26.479 (14.544) ** | 0.468 (0.238) | −2.019 (1.448) | 0.099 (0.388) | −0.744 (2.329) ** |
| 29 Crude animal and vegetable materials, nes# | 0.052% | 6.505 (5.944) ** | 2.247 (2.431) ** | −1.602 (2.489) ** | 0.205 (1.377) | 0.137 (0.781) |
| 33 Petroleum, petroleum products, and related materials # | 4.354% | 2.345 (4.022) ** | 7.067 (2.278) ** | −3.384 (1.512) | 1.171 (1.604) | −1.149 (1.119) |
| 34 Gas, natural and manufactured | 0.021% | −1.798 (2.153) ** | 5.596 (0.876) | −1.144 (0.254) | 0.127 (0.126) | 1.028 (0.980) |
| 51 Organic chemicals | 1.732% | 13.939 (6.032) ** | 1.719 (0.899) | −4.796 (3.524) ** | −0.040 (0.158) | 0.629 (2.27) ** |
| 52 Inorganic chemicals # | 0.159% | −2.841 (2.951) ** | 6.424 (1.713) * | 0.587 (0.224) | 0.272 (0.448) | −0.271 (0.304) |
| 54 Medicinal and pharmaceutical products | 2.833% | −16.874 (3.150) ** | 31.559 (3.389) ** | 3.271 (0.542) | 0.822 (0.570) | −0.816 (0.562) |
| 55 Oils and perfume materials; toilet and cleansing preparations # | 0.828% | 3.521 (2.639) ** | 16.423 (2.108) ** | 5.391 (0.922) | 2.408 (1.337) | −1.029 (0.647) |
| 57 Explosives and pyrotechnic products # | 1.522% | 2.063 (1.687) * | 85.955 (0.117) | 17.065 (0.096) | 2.092 (0.102) | −0.828 (0.053) |
| 58 Artificial resins and plastic materials, and cellulose esters, etc # | 1.087% | −4.139 (2.914) ** | −8.386 (0.529) | −9.540 (0.732) | 0.909 (0.701) | −0.255 (0.294) |
| 59 Chemical materials and products, nes | 0.720% | 2.529 (2.720) ** | 3.406 (1.412) | −2.981 (1.479) | −0.093 (0.214) | 0.862 (1.646) |
| 61 Leather, leather manufactures, nes, and dressed furskins | 0.006% | 11.891 (3.479) ** | −5.549 (3.245) ** | 0.611 (0.501) | −0.088 (0.360) | −0.318 (1.067) |
| 62 Rubber manufactures, nes # | 2.146% | 2.073 (3.176) ** | −10.243 (0.614) | −0.453 (0.090) | 0.903 (0.719) | −0.662 (0.426) |
| 63 Cork and wood, cork manufactures # | 0.006% | −6.161 (3.089) ** | 3.972 (1.124) | 3.701 (1.468) | −0.429 (0.875) | 0.489 (0.769) |
| 64 Paper, paperboard, and articles of pulp, of paper, or of paperboard # | 0.849% | 1.342 (4.451) ** | 1.821 (2.084) ** | 0.371 (0.615) | 0.073 (0.529) | −0.101(0.524) |
| 65 Textile yarn, fabrics, made-up articles, nes, and related products | 1.231% | 0.734 (2.810) ** | −0.277 (0.161) | 1.595 (1.318) | −0.358 (1.242) | 0.149 (0.517) |
| 67 Iron and steel # | 3.506% | 7.709 (3.961) ** | 0.319 (0.114) | −4.981 (2.540) ** | 0.193 (0.474) | 0.514 (1.106) |
| 68 Non-ferrous metals # | 1.095% | 7.664 (3.845) ** | 4.228 (1.248) | −7.151 (2.812) ** | 0.151 (0.358) | 0.839 (1.564) |
| 69 Manufactures of metals, nes | 2.430% | −0.625 (3.623) ** | 3.864 (7.068) ** | 0.286 (0.741) | 0.021 (0.274) | 0.099 (1.096) |
| 71 Power generating machinery and equipment | 3.256% | −1.337 (3.786) ** | 5.493 (2.312) ** | 0.025 (0.016) | −0.555 (1.439) | 0.866 (2.372) ** |
| 72 Machinery specialized for particular industries | 3.804% | 10.219 (5.099) ** | −4.756 (1.177) | −10.609 (3.657) ** | 1.994 (2.96) ** | −0.419 (0.799) |
| 73 Metalworking machinery | 0.832% | 11.321 (5.779) ** | 2.163 (1.151) | −5.239 (3.718) ** | 0.175 (0.674) | 0.424 (1.628) * |
| 74 General industrial machinery and equipment, nes, and parts of, nes | 5.144% | 0.339 (2.322) ** | 4.419 (2.059) ** | −1.059 (0.703) | 0.265 (0.812) | 0.325 (1.029) |
| 75 Office machines and automatic data processing equipment | 6.193% | −1.250 (3.599) ** | 1.311 (0.546) | 3.769 (2.245) ** | −0.268 (0.801) | 0.228 (0.513) |
| 76 Telecommunications, sound recording, and reproducing equipment | 5.641% | 10.912 (5.509) ** | −3.595 (3.151) ** | −0.103 (0.130) | −0.178 (1.071) | −0.128 (0.691) |
| 77 Electric machinery, apparatus and appliances, nes, and parts, nes # | 11.154% | 1.103 (5.232) ** | 1.807 (2.937) ** | 0.987 (2.263) ** | −0.143 (1.571) | 0.130 (1.239) |
| 78 Road vehicles # | 27.347% | −0.411 (4.904) ** | 4.388 (4.925) ** | 0.248 (0.395) | 0.359 (2.173) ** | −0.283 (1.557) |
| 79 Other transport equipment | 1.093% | 6.521 (3.919) ** | 2.965 (1.133) | −2.528 (1.399) | 0.364 (0.864) | 0.313 (0.764) |
| 81 Sanitary, plumbing, heating, lighting fixtures, and fittings, nes | 0.183% | −11.502 (3.688) ** | 11.859 (4.000) ** | 3.493 (1.744) * | −0.596 (1.264) | 0.821 (1.578) |
| 82 Furniture and parts thereof | 0.329% | 1.424 (1.331) | 0.001 (0.001) | −2.336 (0.583) | −0.173 (0.239) | 0.513 (0.616) |
| 83 Travel goods, handbags, and similar containers | 0.106% | −5.251 (3.508) ** | 10.232 (2.100) ** | 2.907 (0.742) | −0.714 (1.001) | 1.616 (1.518) |
| 84 Articles of apparel and clothing accessories | 0.320% | −2.256 (2.329) ** | 4.049 (0.334) | 14.958 (1.547) | −1.954 (0.882) | 0.789 (0.268) |
| 85 Footwear | 0.074% | −5.997 (4.117) ** | 9.519 (1.614) * | 5.621 (1.581) | 1.390 (1.182) | −0.744 (0.856) |
| 87 Professional, scientific, controlling instruments, apparatus, nes | 1.022% | 3.837 (4.242) ** | 2.336 (1.139) | −4.459 (2.810) ** | −0.462 (1.001) | 1.252 (2.572) ** |
| 88 Photographic equipment and supplies, optical goods; watches, etc # | 0.215% | 0.866 (3.806) ** | 1.261 (1.194) | 1.164 (1.573) | −0.340 (1.827) * | 0.079 (0.478) |
| 89 Miscellaneous manufactured articles, nes | 4.262% | −3.116 (3.697) ** | 10.327 (2.502) ** | 1.889 (1.091) | 0.316 (0.654) | 0.529 (1.118) |
| 93 Special transactions, commodity not classified according to class # | 1.476% | −13.649 (9.581) ** | 4.394 (7.344) ** | 1.869 (4.444) ** | 0.005 (0.079) | −0.124 (1.544) |
| 98 Estimate of import items valued under $251 and others # | 0.454% | 3.025 (4.319) ** | 0.906 (1.133) | −0.210 (0.393) | 0.041 (0.390) | −0.058 (0.465) |
| Industries | Diagnostics | ||||||
|---|---|---|---|---|---|---|---|
| F Stat a | (t-Test) b | LM c | RESET d | CUSUM | CUSUMSQ | Adj. R2 | |
| 02 Dairy products and birds’ eggs | 4.13 ** | −0.367 (4.585) ** | 2.570 | 0.015 | US | S | 0.42 |
| 03 Fish, crustacean and molluscs, and preparations thereof | 1.39 | −0.234 (2.662) | 1.340 | 0.012 | S | S | 0.43 |
| 04 Cereals and cereal preparations | 0.39 | −0.002 (1.409) | 3.092 * | 1.188 | S | S | 0.39 |
| 05 Vegetables and fruit | 5.66 ** | −0.293 (5.370) ** | 22.259 ** | 1.188 | US | S | 0.45 |
| 06 Sugar, sugar preparations, and honey | 9.19 ** | −0.570 (6.839) ** | 1.974 | 0.221 | S | S | 0.44 |
| 07 Coffee, tea, cocoa, spices, and manufactures thereof | 1.57 | −0.226 (2.827) | 0.524 | 0.143 | S | S | 0.42 |
| 09 Miscellaneous edible products and preparations | 1.22 | 0.041 (2.493) | 4.530 ** | 0.325 | S | S | 0.40 |
| 11 Beverages | 0.95 | −0.087 (2.195) | 0.362 | 1.315 | S | S | 0.32 |
| 12 Tobacco and tobacco manufactures | 4.25 ** | −0.204 (4.649) ** | 0.013 | 0.136 | S | S | 0.41 |
| 26 Textile fibers (not wool tops) and their wastes (not in yarn) | 17.51 ** | −0.553 (9.441) ** | 0.332 | 0.936 | S | S | 0.37 |
| 27 Crude fertilizer and crude minerals | 4.67 ** | −0.346 (4.873) ** | 0.313 | 0.009 | S | S | 0.42 |
| 28 Metalliferous ores and metal scrap | 41.66 ** | −0.917 (14.558) ** | 0.003 | 0.123 | S | US | 0.46 |
| 29 Crude animal and vegetable materials, nes | 6.89 ** | −0.469 (5.922) ** | 2.139 | 0.926 | S | S | 0.46 |
| 33 Petroleum, petroleum products, and related materials | 3.06 | −0.249 (3.950) * | 0.635 | 4.598 ** | S | S | 0.46 |
| 34 Gas, natural and manufactured | 0.94 | −0.176 (2.184) | 0.466 | 2.605 | S | US | 0.38 |
| 51 Organic chemicals | 7.13 ** | −0.340 (6.024) ** | 0.048 | 2.158 | S | S | 0.27 |
| 52 Inorganic chemicals | 1.72 | −0.154 (2.963) | 1.876 | 2.436 | S | S | 0.38 |
| 54 Medicinal and pharmaceutical products | 1.96 | −0.109 (3.156) | 0.059 | 0.387 | S | US | 0.29 |
| 55 Oils and perfume materials; toilet and cleansing preparations | 1.32 | 0.033 (2.599) | 1.103 | 0.786 | US | S | 0.41 |
| 57 Explosives and pyrotechnic products | 0.55 | 0.004 (1.672) | 1.888 | 0.096 | S | S | 0.33 |
| 58 Artificial resins and plastic materials, and cellulose esters, etc | 1.68 | 0.034 (2.927) | 8.993 ** | 0.859 | S | S | 0.37 |
| 59 Chemical materials and products, nes | 1.41 | −0.136 (2.684) | 0.030 | 14.499 ** | S | S | 0.33 |
| 61 Leather, leather manufactures, nes, and dressed furskins | 2.39 | −0.324 (3.489) | 0.642 | 5.063 ** | S | S | 0.47 |
| 62 Rubber manufactures, nes. | 1.94 | −0.030 (3.150) | 1.340 | 2.107 | S | S | 0.38 |
| 63 Cork and wood, cork manufactures | 1.88 | −0.192 (3.091) | 0.088 | 2.057 | S | S | 0.37 |
| 64 Paper, paperboard, and articles of pulp, of paper, or of paperboard | 3.90 * | −0.209 (4.454) ** | 0.356 | 0.089 | S | S | 0.38 |
| 65 Textile yarn, fabrics, made-up articles, nes, and related products | 1.53 | −0.079 (2.792) | 2.831 * | 0.279 | S | S | 0.46 |
| 67 Iron and steel | 3.08 | −0.157 (3.962) * | 0.397 | 0.200 | S | S | 0.41 |
| 68 Non-ferrous metals | 2.89 | −0.177 (3.834) * | 0.056 | 0.005 | S | S | 0.37 |
| 69 Manufactures of metals, nes | 2.62 | −0.293 (3.651) | 0.003 | 1.667 | S | S | 0.49 |
| 71 Power generating machinery and equipment | 2.90 | −0.153 (3.841) * | 0.029 | 2.541 | S | S | 0.44 |
| 72 Machinery specialized for particular industries | 5.07 ** | −0.094 (5.083) ** | 0.000 | 9.702 ** | S | S | 0.39 |
| 73 Metalworking machinery | 6.54 ** | −0.275 (5.771) ** | 1.246 | 0.895 | S | S | 0.31 |
| 74 General industrial machinery and equipment, nes, and parts of, nes | 1.02 | −0.111 (2.279) | 0.645 | 0.026 | US | S | 0.27 |
| 75 Office machines and automatic data processing equipment | 3.00 | −0.102 (3.904) * | 1.027 | 0.007 | S | S | 0.19 |
| 76 Telecommunications, sound recording, and reproducing equipment | 5.97 ** | −0.278 (5.512) ** | 0.689 | 0.128 | S | S | 0.30 |
| 77 Electric machinery, apparatus and appliances, nes, and parts, nes | 5.40 ** | −0.229 (5.245) ** | 0.129 | 3.551 * | S | S | 0.31 |
| 78 Road vehicles | 5.24 ** | −0.242 (5.165) ** | 0.256 | 0.222 | S | S | 0.35 |
| 79 Other transport equipment | 3.01 | −0.360 (3.916) * | 2.526 | 0.808 | US | S | 0.45 |
| 81 Sanitary, plumbing, heating, lighting fixtures, and fittings, nes | 2.68 | −0.176 (3.696) * | 3.024 * | 1.387 | S | S | 0.31 |
| 82 Furniture and parts thereof | 0.34 | −0.045 (1.319) | 0.024 | 0.007 | US | S | 0.40 |
| 83 Travel goods, handbags, and similar containers | 2.41 | −0.092 (3.503) | 5.433 ** | 0.209 | S | S | 0.26 |
| 84 Articles of apparel and clothing accessories | 1.04 | −0.022 (2.305) | 7.209 ** | 3.453 * | S | S | 0.44 |
| 85 Footwear | 3.31 | −0.083 (4.104) ** | 1.363 | 0.337 | S | S | 0.39 |
| 87 Professional, scientific, controlling instruments, apparatus, nes | 3.52 * | −0.112 (4.237) ** | 2.336 | 0.448 | S | S | 0.48 |
| 88 Photographic equipment and supplies, optical goods, watches, etc | 2.91 | −0.246 (3.853) * | 0.006 | 2.376 | S | S | 0.44 |
| 89 Miscellaneous manufactured articles, nes | 2.71 | −0.067 (3.716) * | 1.012 | 15.944 ** | S | S | 0.28 |
| 93 Special transactions, commodity not classified according to class | 18.06 ** | −0.903 (9.589) ** | 0.014 | 0.647 | S | S | 0.54 |
| 98 Estimate of import items valued under $251 and others | 3.66 * | −0.212 (4.313) ** | 0.004 | 0.004 | S | S | 0.27 |
Publisher’s Note: MDPI stays neutral with regard to jurisdictional claims in published maps and institutional affiliations. |
© 2021 by the authors. Licensee MDPI, Basel, Switzerland. This article is an open access article distributed under the terms and conditions of the Creative Commons Attribution (CC BY) license (https://creativecommons.org/licenses/by/4.0/).
Share and Cite
Bahmani-Oskooee, M.; Baek, J. Whose Policy Uncertainty Matters in the Trade between Korea and the U.S.? J. Risk Financial Manag. 2021, 14, 520. https://doi.org/10.3390/jrfm14110520
Bahmani-Oskooee M, Baek J. Whose Policy Uncertainty Matters in the Trade between Korea and the U.S.? Journal of Risk and Financial Management. 2021; 14(11):520. https://doi.org/10.3390/jrfm14110520
Chicago/Turabian StyleBahmani-Oskooee, Mohsen, and Jungho Baek. 2021. "Whose Policy Uncertainty Matters in the Trade between Korea and the U.S.?" Journal of Risk and Financial Management 14, no. 11: 520. https://doi.org/10.3390/jrfm14110520
APA StyleBahmani-Oskooee, M., & Baek, J. (2021). Whose Policy Uncertainty Matters in the Trade between Korea and the U.S.? Journal of Risk and Financial Management, 14(11), 520. https://doi.org/10.3390/jrfm14110520