Realized Measures to Explain Volatility Changes over Time


 , and
, and
Abstract
1. Introduction
Q1: “If volatility is priced, does an anticipated increase in volatility raise the required return on equity, leading to an immediate stock price decline?”
Q2: “Does a drop in the value of the stock (negative return) increase financial leverage, so that it makes the stock riskier and increases its volatility?”.
2. Data and Methodology
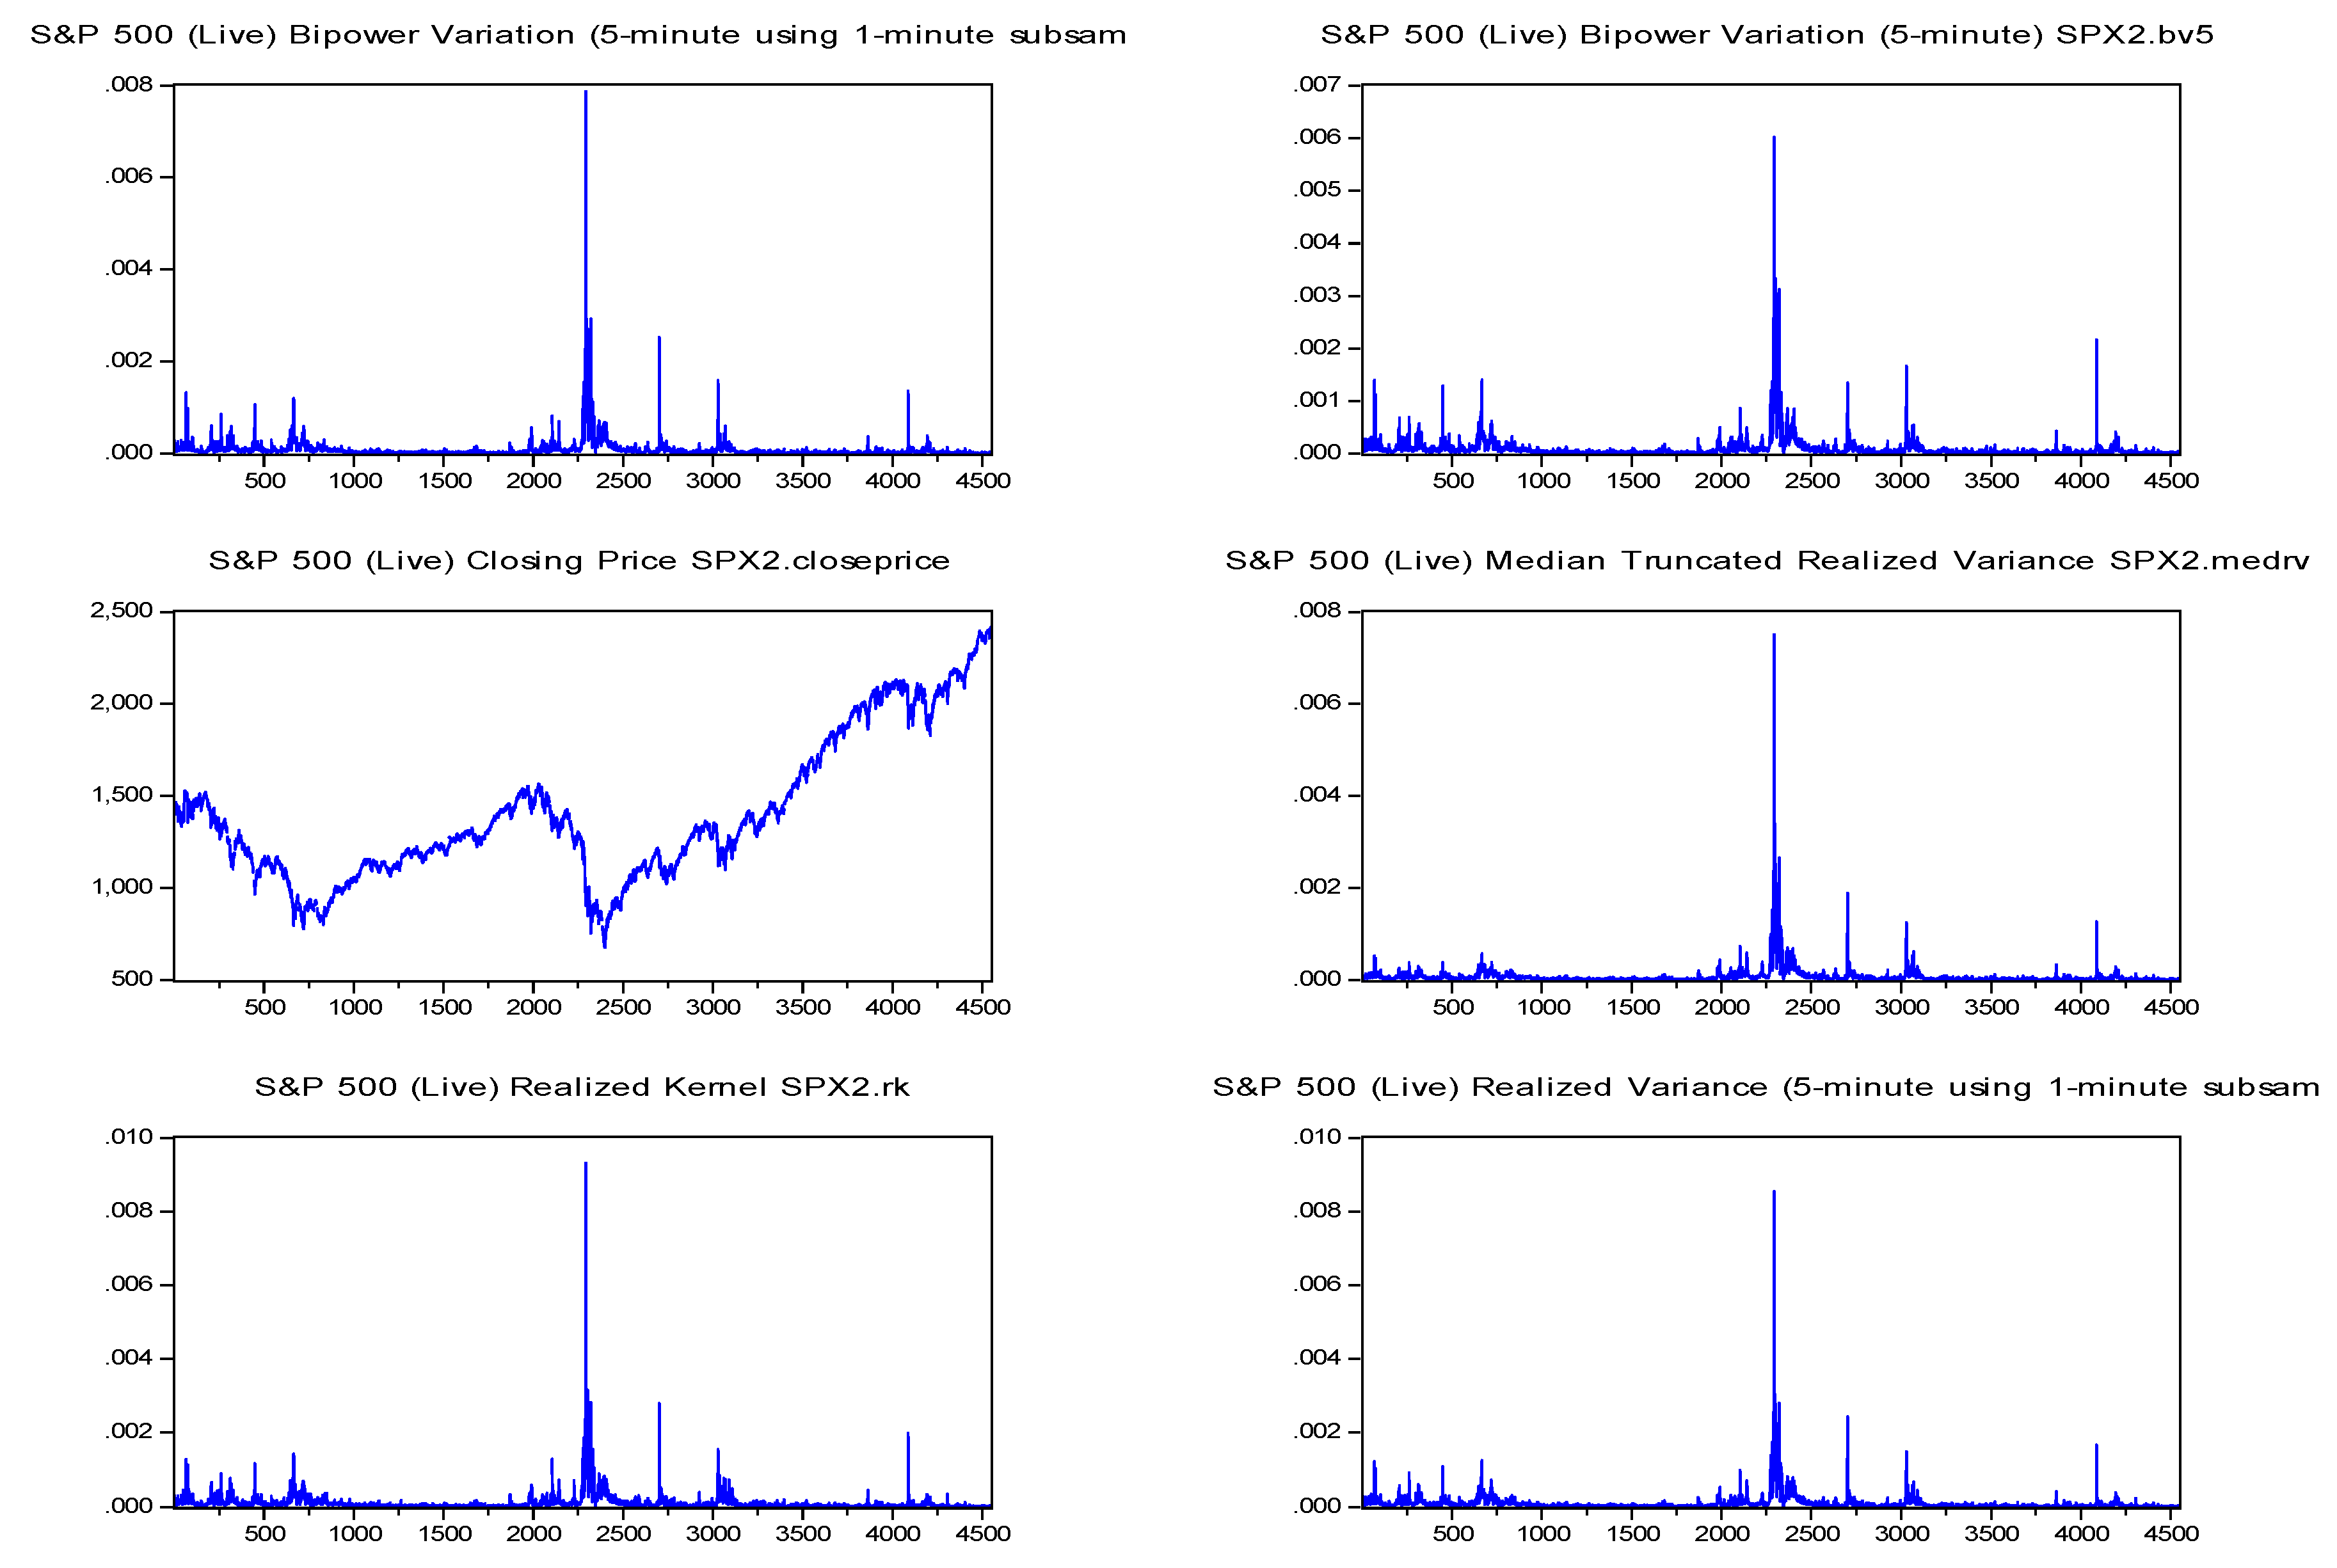
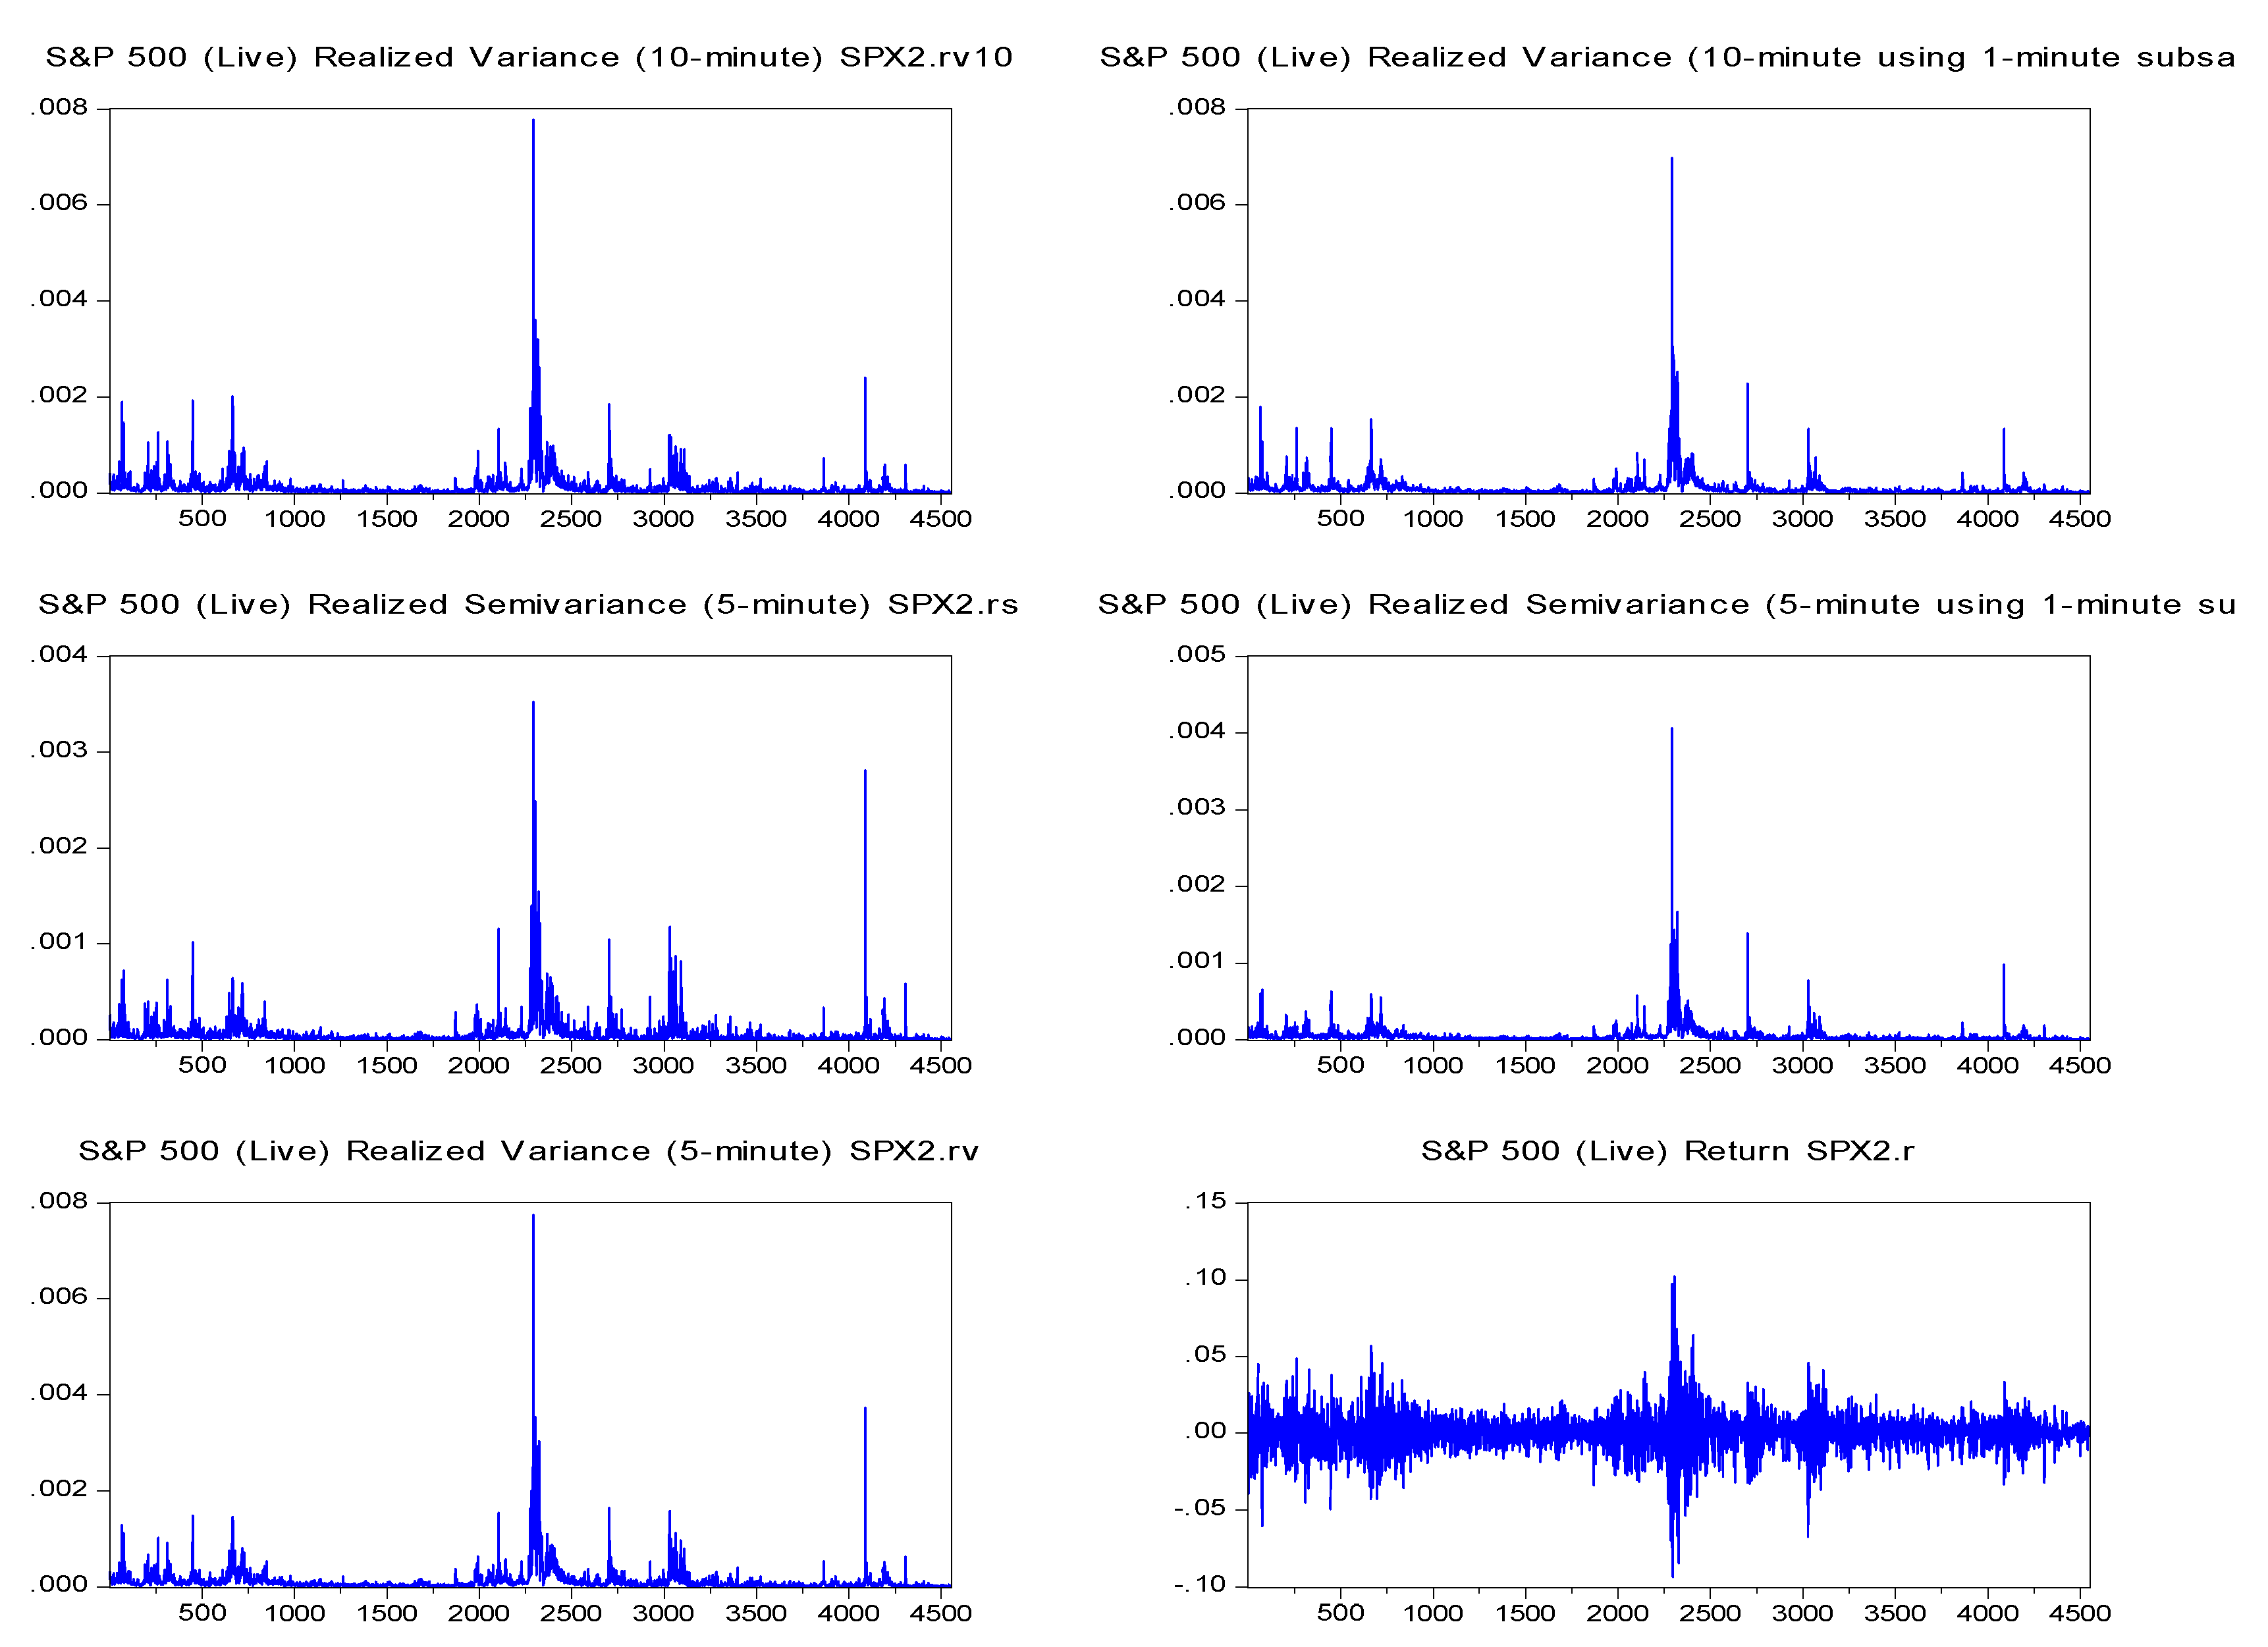
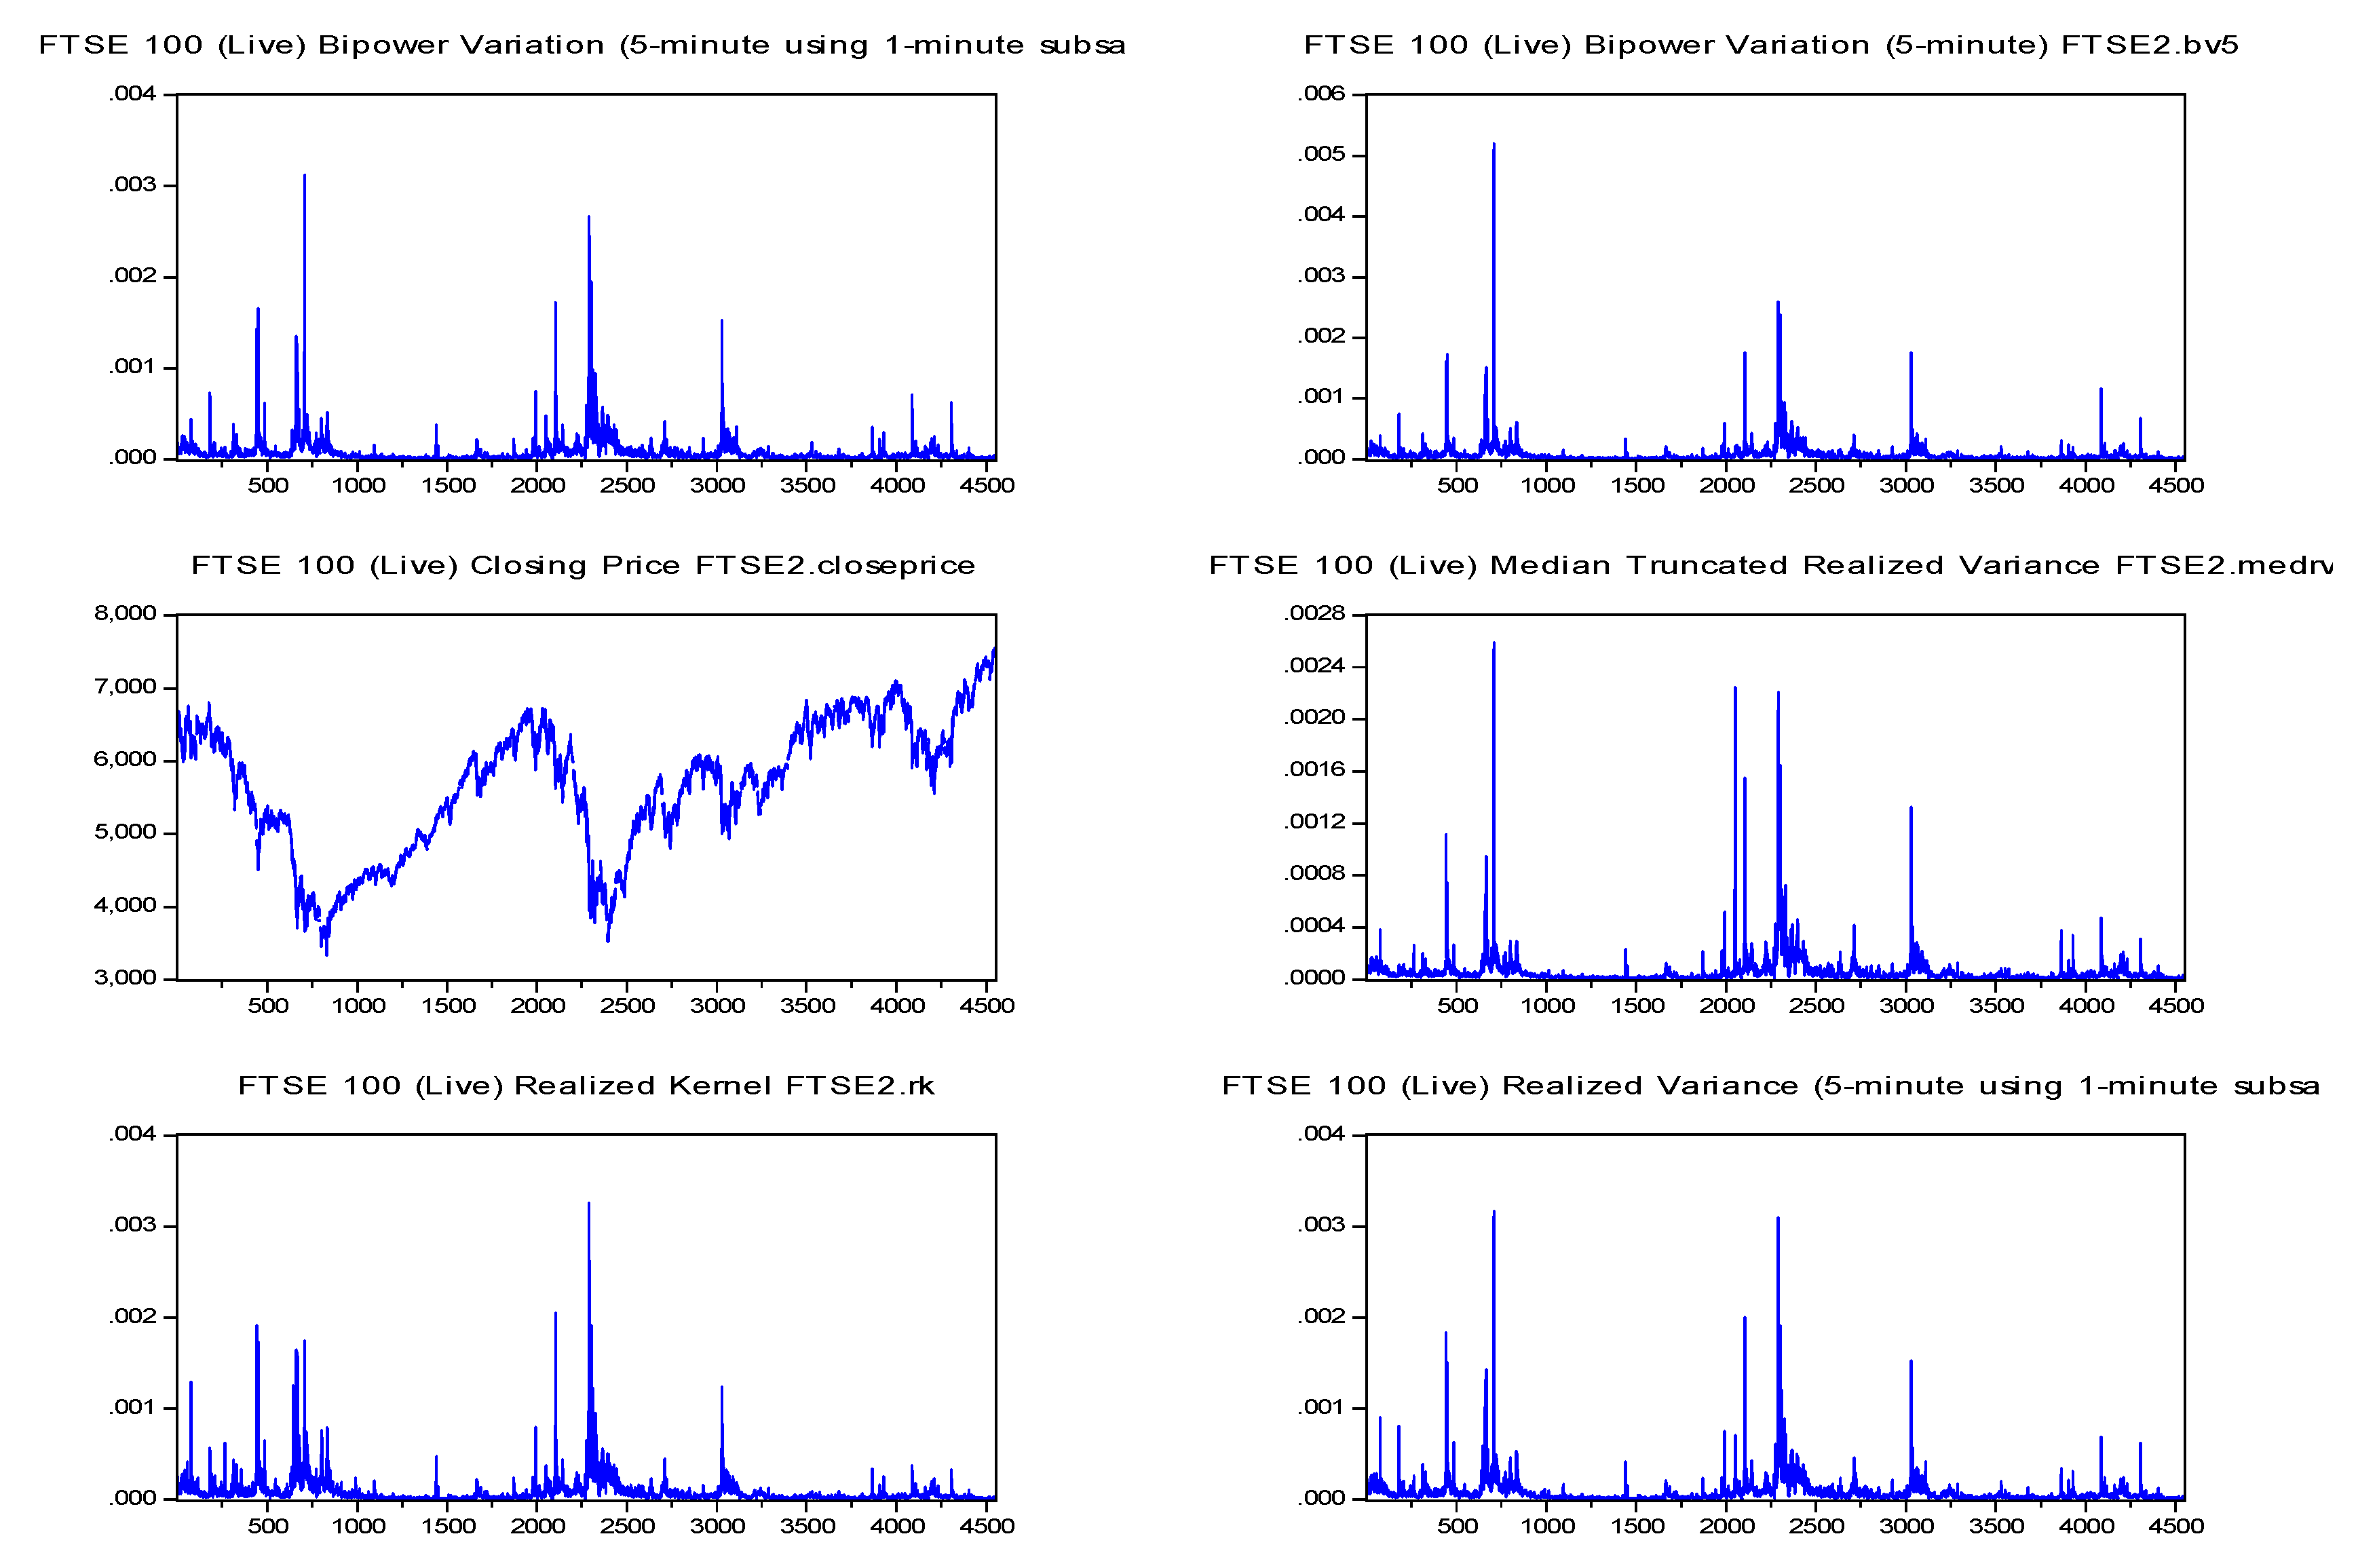
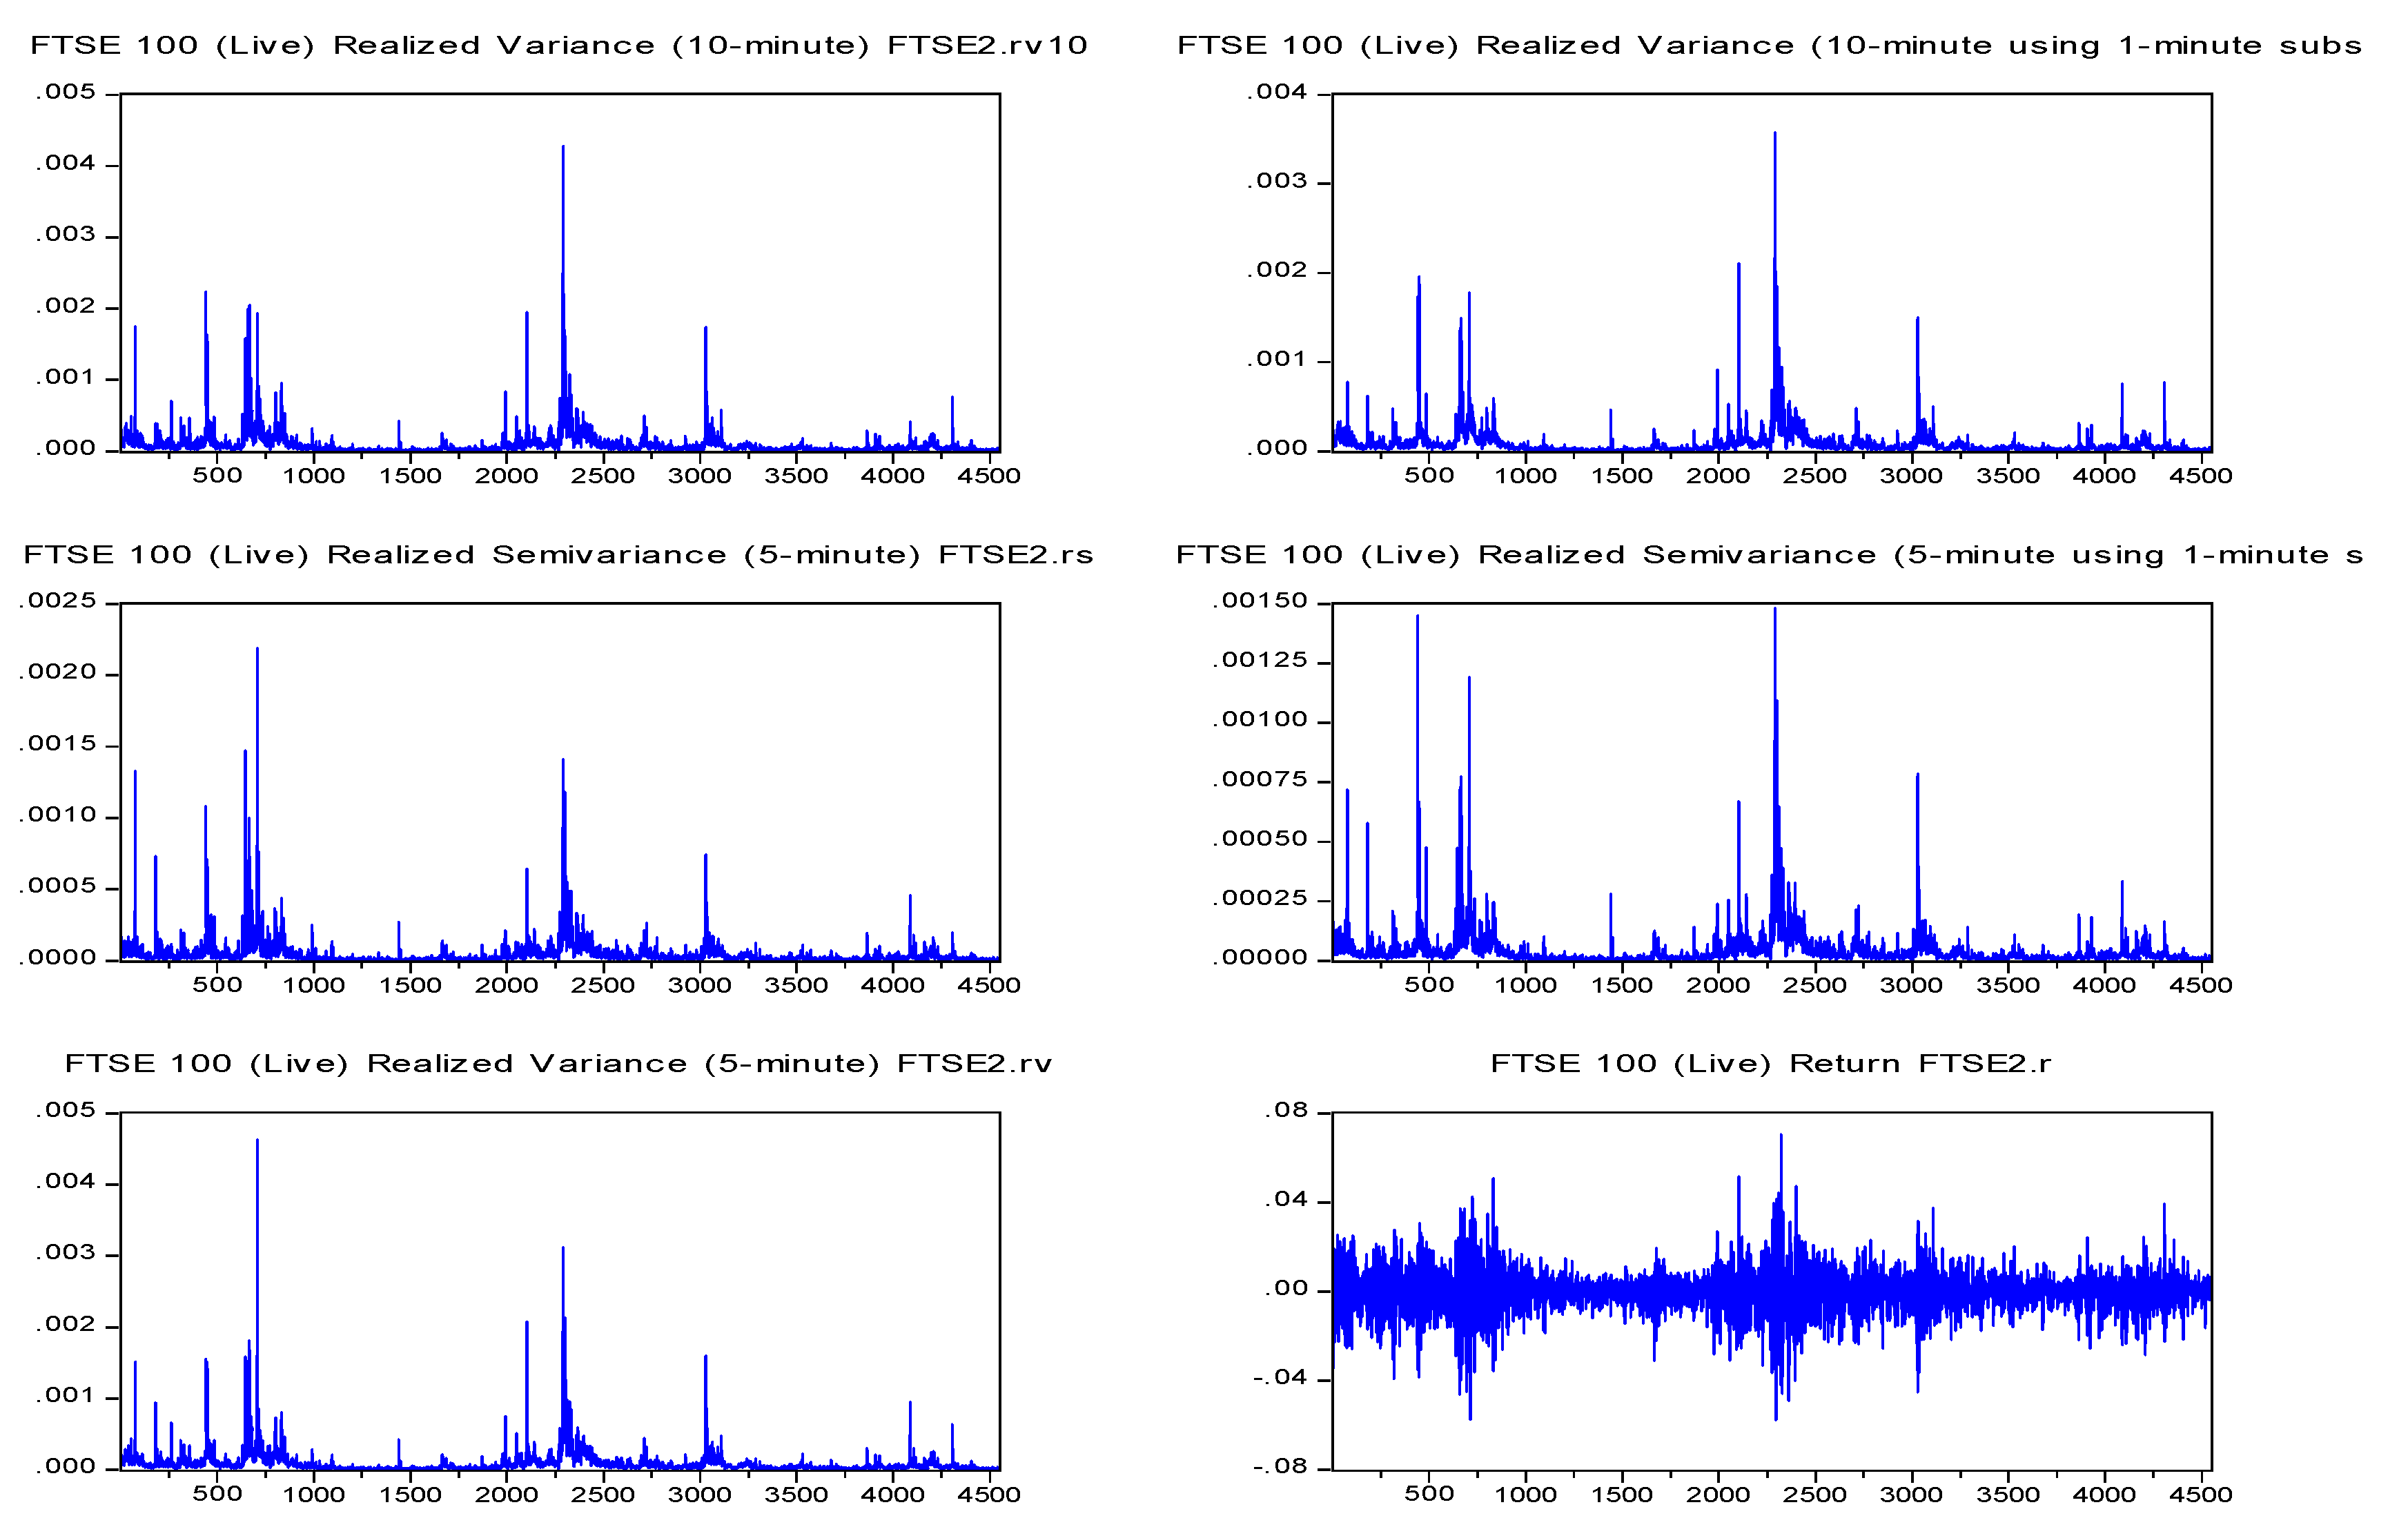
2.1. Realized Measures
2.1.1. Theoretical Considerations
2.1.2. Classes of Realized Measures
2.2. Data and Data Adjustments
3. Empirical Results
3.1. Volatility Feedback Effect
3.2. Leverage Effect Results
4. Practical Implications
4.1. Out-of-Sample Analysis
4.2. Portfolio Implications
5. Summary and Conclusions
Author Contributions
Funding
Acknowledgments
Conflicts of Interest
References
- Alghalith, Moawia, Christos Floros, and Konstantinos Gkillas. 2020. Estimating stochastic volatility under the assumption of stochastic volatility of volatility. Risks 8: 35. [Google Scholar] [CrossRef]
- Andersen, Torben G., and Tim Bollerslev. 1998. Answering the Skeptics: Yes, Standard Volatility Models do Provide Accurate Forecasts. International Economic Review 39: 885. [Google Scholar] [CrossRef]
- Andersen, Torben G., Tim Bollerslev, Francis X. Diebold, and Heiko Ebens. 2001a. The distribution of realized stock return volatility. Journal of Financial Economics 61: 43–76. [Google Scholar] [CrossRef]
- Andersen, Torben G., Tim Bollerslev, Francis X. Diebold, and Paul Labys. 2001b. The Distribution of Realized Exchange Rate Volatility. Journal of the American Statistical Association 96: 42–55. [Google Scholar] [CrossRef]
- Andersen, Torben G., Tim Bollerslev, Francis X. Diebold, and Clara Vega. 2007. Real-time price discovery in global stock, bond and foreign exchange markets. Journal of International Economics 73: 251–77. [Google Scholar] [CrossRef]
- Andersen, Torben G., Tim Bollerslev, and Nour Meddahi. 2011. Realized volatility forecasting and market microstructure noise. Journal of Econometrics 160: 220–234. [Google Scholar] [CrossRef]
- Andersen, Torben G., Dobrislav Dobrev, and Ernst Schaumburg. 2012. Jump-robust volatility estimation using nearest neighbor truncation. Journal of Econometrics 169: 75–93. [Google Scholar] [CrossRef]
- Ang, Andrew, Robert J. Hodrick, Yuhang Xing, and Xiaoyan Zhang. 2006. The Cross-Section of Volatility and Expected Returns. The Journal of Finance 61: 259–99. [Google Scholar] [CrossRef]
- Bali, Turan G., and Panayiotis Theodossiou. 2007. A Conditional-SGT-VaR Approach with Alternative GARCH Models. Annals of Operations Research 151: 241–67. [Google Scholar] [CrossRef]
- Barndorff-Nielsen, Ole E., and Neil Shephard. 2002. Econometric analysis of realized volatility and its use in estimating stochastic volatility models. Journal of the Royal Statistical Society: Series B (Statistical Methodology) 64: 253–80. [Google Scholar] [CrossRef]
- Barndorff-Nielsen, Ole E., and Neil Shephard. 2004. Power and Bipower Variation with Stochastic Volatility and Jumps. Journal of Financial Econometrics 2: 1–37. [Google Scholar] [CrossRef]
- Barndorff-Nielsen, Ole E., and Neil Shephard. 2006. Econometrics of Testing for Jumps in Financial Economics Using Bipower Variation. Journal of Financial Econometrics 4: 1–30. [Google Scholar] [CrossRef]
- Barndorff-Nielsen, Ole E., Peter Reinhard Hansen, Asger Lunde, and Neil Shephard. 2008. Designing Realized Kernels to Measure the ex post Variation of Equity Prices in the Presence of Noise. Econometrica 76: 1481–536. [Google Scholar] [CrossRef]
- Barndorff-Nielsen, Ole E., Peter Reinhard Hansen, Asger Lunde, and Neil Shephard. 2009. Realized kernels in practice: Trades and quotes. Econometrics Journal 12: C1–C32. [Google Scholar] [CrossRef]
- Barndorff-Nielsen, Ole E., Silja Kinnebrock, and Neil Shephard. 2010. Measuring Downside Risk-Realised Semivariance. In Volatility and Time Series Econometrics: Essays in Honor of Robert F. Engle. Edited by Tim Bollerslev, Jerrrey Russell and Mark Watson. New York: Oxford University Press, pp. 117–37. [Google Scholar]
- Bekaert, Geert, and Guojun Wu. 2000. Asymmetric Volatility and Risk in Equity Markets. Review of Financial Studies 13: 1–42. [Google Scholar] [CrossRef]
- Black, Fischer. 1976. Studies of Stock Price Volatility Changes. In Proceedings of the Business and Economics Section. Washington: American Statistical Association, pp. 177–81. [Google Scholar]
- Bollerslev, Tim, and Hao Zhou. 2006. Volatility puzzles: A simple framework for gauging return-volatility regressions. Journal of Econometrics 131: 123–50. [Google Scholar] [CrossRef]
- Bollerslev, Tim, Sophia Zhengzi Li, and Bingzhi Zhao. 2019. Good Volatility, Bad Volatility, and the Cross Section of Stock Returns. Journal of Financial and Quantitative Analysis 55: 751–81. [Google Scholar] [CrossRef]
- Campbell, John Y., and Ludger Hentschel. 1992. No News Is Good News: An Asymmetric Model of Changing Volatility in Stock Returns. Journal of Financial Economics 31: 281–318. Available online: https://www.sciencedirect.com/science/article/pii/0304405X9290037X (accessed on 22 April 2002). [CrossRef]
- Carr, Peter, and Liuren Wu. 2017. Leverage Effect, Volatility Feedback, and Self-Exciting Market Disruptions. Journal of Financial and Quantitative Analysis 52: 2119–56. [Google Scholar] [CrossRef]
- Christie, Andrew A. 1982. The Stochastic Behavior of Common Stock Variances: Value, Leverage and Interest Rate Effects. Journal of Financial Economics 10: 407–32. Available online: https://www.sciencedirect.com/science/article/pii/0304405X82900186 (accessed on 15 April 2002).
- Corsi, Fulvio, Francesco Audrino, and Roberto Renó. 2012. HAR Modeling for Realized Volatility Forecasting. In Handbook of Volatility Models and their Applications. Edited by Luc Bauwens, Christian M. Hafner and Sebastien Laurent. New York: Wiley & Sons Ltd. [Google Scholar]
- Degiannakis, Stavros, and Christos Floros. 2015. Modelling and Forecasting High Frequency Financial Data. Hampshire: Palgrave-MacMillan Ltd. [Google Scholar]
- Degiannakis, Stavros, and Christos Floros. 2016. Intra-Day Realized Volatility for European and USA Stock Indices. Global Finance Journal 29: 24–41. [Google Scholar] [CrossRef]
- Demirer, Riza, Konstantinos Gkillas, Rangan Gupta, and Christian Pierdzioch. 2019. Time-varying risk aversion and realized gold volatility. North American Journal of Economics and Finance 50: 101048. [Google Scholar] [CrossRef]
- Duffee, Gregory R. 1995. Stock Returns and Volatility a Firm-Level Analysis. Journal of Financial Economics 37: 399–420. Available online: https://www.sciencedirect.com/science/article/pii/0304405X94008017 (accessed on 7 March 2000).
- Engle, Robert F., and Victor K. Ng. 1993. Measuring and Testing the Impact of News on Volatility. The Journal of Finance 48: 1749–78. [Google Scholar] [CrossRef]
- Gallant, A. Ronald, Peter E. Rossi, and George Tauchen. 1992. Stock Prices and Volume. Review of Financial Studies 5: 199–242. [Google Scholar] [CrossRef]
- Gallant, A. Ronald, David Hsieh, and George Tauchen. 1997. Estimation of stochastic volatility models with diagnostics. Journal of Econometrics 81: 159–92. [Google Scholar] [CrossRef]
- Ghysels, Eric, and Arthur Sinko. 2011. Volatility forecasting and microstructure noise. Journal of Econometrics 160: 257–71. [Google Scholar] [CrossRef]
- Giot, Pierre, Sébastien Laurent, and Mikael Petitjean. 2010. Trading activity realized volatility and jumps. Journal of Empirical Finance 17: 168–75. [Google Scholar] [CrossRef]
- Gkillas (Gillas), Konstantinos, Dimitrios I. Vortelinos, and Shrabani Saha. 2018. The properties of realized volatility and realized correlation: Evidence from the Indian stock market. Physica A: Statistical Mechanics and Its Applications 492: 343–59. [Google Scholar] [CrossRef]
- Gkillas, Konstantinos, and François Longin. 2019. Is Bitcoin the New Digital Gold? Evidence from Extreme Price Movements in Financial Markets. Available online: http://dx.doi.org/10.2139/ssrn.3245571 (accessed on 26 September 2018).
- Gkillas, Konstantinos, Dimitrios Vortelinos, Christos Floros, Alexandros Garefalakis, and Nikolaos Sariannidis. 2019a. Greek Sovereign Crisis and European Exchange Rates: Effects of News Releases and Their Providers. Annals of Operations Research, 1–22. Available online: http://link.springer.com/10.1007/s10479-019-03199-x (accessed on 9 April 2019). [CrossRef]
- Gkillas, Konstantinos, Rangan Gupta, and Christian Pierdzioch. 2019b. Forecasting realized gold volatility: Is there a role of geopolitical risks? Finance Research Letters. [Google Scholar] [CrossRef]
- Gkillas, Konstantinos, Rangan Gupta, Chi Keung Marco Lau, and Muhammad Tahir Suleman. 2020a. Jumps beyond the realms of cricket: India’s performance in One Day Internationals and stock market movements. Journal of Applied Statistics 47: 1109–27. [Google Scholar] [CrossRef]
- Gkillas, Konstantinos, Rangan Gupta, and Christian Pierdzioch. 2020b. Forecasting realized oil-price volatility: The role of financial stress and asymmetric loss. Journal of International Money and Finance 104: 102137. [Google Scholar] [CrossRef]
- Gkillas, Konstantinos, Rangan Gupta, and Mark E. Wohar. 2020c. Oil shocks and volatility jumps. Review of Quantitative Finance and Accounting 54: 247–72. [Google Scholar] [CrossRef]
- Glosten, Lawrence R., Ravi Jagannathan, and David E. Runkle. 1993. On the Relation between the Expected Value and the Volatility of the Nominal Excess Return on Stocks. The Journal of Finance 48: 1779–801. [Google Scholar] [CrossRef]
- Hansen, Peter Reinhard, and Guillaume Horel. 2009. Quadratic Variation by Markov Chains. SSRN Electronic Journal. [Google Scholar] [CrossRef]
- Hansen, Peter Reinhard, and Zhuo Huang. 2016. Exponential GARCH Modeling with Realized Measures of Volatility. Journal of Business & Economic Statistics 34: 269–87. [Google Scholar] [CrossRef]
- Hansen, Peter R., and Asger Lunde. 2006. Realized Variance and Market Microstructure Noise. Journal of Business & Economic Statistics 24: 127–61. [Google Scholar] [CrossRef]
- Jacod, Jean. 2007. Statistics and High Frequency Data: SEMSTAT Seminar. Technical Report, Université de Paris-6. [1513]. Paris: Université de Paris. [Google Scholar]
- Kiliç, Deniz Kenan, and Ömür Ugur. 2018. Multiresolution Analysis of S&P500 Time Series. Annals of Operations Research 260: 197–216. [Google Scholar] [CrossRef]
- Liu, Lily Y., Andrew J. Patton, and Kevin Sheppard. 2015. Does Anything Beat 5-Minute RV? A Comparison of Realized Measures across Multiple Asset Classes. Journal of Econometrics 187: 293–311. [Google Scholar] [CrossRef]
- Low, Rand Kwong Yew. 2018. Vine copulas: Modelling systemic risk and enhancing higher-moment portfolio optimisation. Accounting & Finance 58: 423–63. [Google Scholar] [CrossRef]
- Low, Rand Kwong Yew, Robert Faff, and Kjersti Aas. 2016. Enhancing mean-variance portfolio selection by modeling distributional asymmetries. Journal of Economics and Business 85: 49–72. [Google Scholar] [CrossRef]
- Markowitz, Harry. M. 1952. Portfolio Selection. The Journal of Finance 7: 77–91. [Google Scholar] [CrossRef]
- McAleer, Michael, and Marcelo C. Medeiros. 2008. Realized Volatility: A Review. Econometric Reviews 27: 10–45. [Google Scholar] [CrossRef]
- Meddahi, Nour, Per Mykland, and Neil. E. Shephard. 2011. Special issue on realised volatility. Journal of Econometrics 160: 1. [Google Scholar] [CrossRef]
- Nelson, Daniel B. 1991. Conditional Heteroskedasticity in Asset Returns: A New Approach. Econometrica 59: 347. [Google Scholar] [CrossRef]
- Patton, Andrew J. 2011. Data-based ranking of realised volatility estimators. Journal of Econometrics 161: 284–303. [Google Scholar] [CrossRef]
- Poon, Ser-Huang, and Clive W. J. Granger. 2003. Forecasting Volatility in Financial Markets: A Review. Journal of Economic Literature 41: 478–539. [Google Scholar] [CrossRef]
- Rad, Hossein, Rand Kwong Yew Low, and Robert Faff. 2016. The profitability of pairs trading strategies: Distance, cointegration and copula methods. Quantitative Finance 16: 1541–58. [Google Scholar] [CrossRef]
- Schwert, G. William. 1990. Stock Volatility and the Crash of ’87. Review of Financial Studies 3: 77–102. [Google Scholar] [CrossRef]
- Shang, Han Lin, Yang Yang, and Fearghal Kearney. 2018. Intraday Forecasts of a Volatility Index: Functional Time Series Methods with Dynamic Updating. Annals of Operations Research, 1–24. [Google Scholar] [CrossRef]
- Wang, Li, and Ji Zhu. 2010. Financial Market Forecasting Using a Two-Step Kernel Learning Method for the Support Vector Regression. Annals of Operations Research 174: 103–20. [Google Scholar] [CrossRef]
- Wu, Guojun. 2001. The Determinants of Asymmetric Volatility. Review of Financial Studies 14: 837–59. [Google Scholar] [CrossRef]
- Xu, Jiangang. 1999. Modeling Shanghai Stock Market Volatility. Annals of Operations Research 87: 141–52. [Google Scholar] [CrossRef]
- Zhang, Lan. 2006. Efficient estimation of stochastic volatility using noisy observations: A multi-scale approach. Bernoulli 12: 1019–43. [Google Scholar] [CrossRef]
- Zhang, Lan, Per A. Mykland, and Yacine Aït-Sahalia. 2005. A Tale of Two Time Scales. Journal of the American Statistical Association 100: 1394–411. [Google Scholar] [CrossRef]
- Zumbach, Gilles. 2013. Leverage Effect. Berlin and Heidelberg: Springer, pp. 205–9. [Google Scholar] [CrossRef]
| 1 | The relation between asset returns and expected volatility motivates the research to produce volatility forecast models using several techniques (see Xu 1999; Bali and Theodossiou 2007; Wang and Zhu 2010; Kiliç and Ugur 2018; Shang et al. 2018; among others). |
| 2 |


| Code | Description |
|---|---|
| Realized bi-power variation (5-min) | |
| Realized bi-power variation (5-min sub-sampled) | |
| Median realized variance (5-min) | |
| Realized Kernel variance (non-flat Parzen) | |
| Realized Kernel variance (Tukey-Hanning(2)) | |
| Realized Kernel variance (two-scale/Barlett) | |
| Realized downside semi-variance (5-min) | |
| Realized downside semi-variance (5-min sub-sampled) | |
| Realized variance | |
| Realized variance (10-min) | |
| Realized variance (10-min sub-sampled) | |
| Realized variance (5-min) | |
| Realized variance (5-min sub-sampled) |
| Variable | Coefficient | Marginal Impact | Coefficient | Marginal Impact |
|---|---|---|---|---|
| Panel A. S&P500 | Panel B. FTSE100 | |||
| 24.5036 *** | 0.0037 | 14.8874 | 0.0010 | |
| (5.9560) | (7.0660) | |||
| 2.4522 | 0.0000 | 80.1180 *** | 0.0080 | |
| (13.1600) | (13.2200) | |||
| 53.8661 *** | 0.0307 | 41.4710 *** | 0.0231 | |
| (4.493) | (4.003) | |||
| 20.8178 ** | 0.0012 | 1.9995 | 0.0000 | |
| (9.0300) | (7.0130) | |||
| 174.6970 *** | 0.2244 | 121.288 *** | 0.0409 | |
| (4.8200) | (8.712) | |||
| 147.8110 *** | 0.1341 | 89.9744 *** | 0.0184 | |
| (5.5730) | (9.765) | |||
| 138.2400 *** | 0.0896 | 85.2223 *** | 0.0154 | |
| (6.5380) | (10.1000) | |||
| 13.5120 *** | 0.0026 | 10.6719 ** | 0.0011 | |
| (3.9240) | (4.7250) | |||
| 80.5904 *** | 0.0256 | 10.4318 | 0.0003 | |
| (7.383) | (9.0230) | |||
| 183.5250 *** | 0.0256 | 157.8510 *** | 0.0226 | |
| (16.8100) | (15.4000) | |||
| c | 3.0330 × 10⁻⁴ * | 0.0007 | 5.9472 × 10⁻⁴ *** | 0.0034 |
| (1.6720 × 10⁻⁴) | (1.5020 × 10⁻⁴) | |||
| Obs. | 4552 | 4552 | ||
| R adj | 0.7229 | 0.7436 | ||
| Variable | Coefficient | Marginal Impact | Coefficient | Marginal Impact |
|---|---|---|---|---|
| Panel A. S&P500 | Panel B. FTSE100 | |||
| −1.1040 × 10⁻³ *** | 0.0068 | −5.6477 × 10⁻⁴ *** | 0.0037 | |
| (1.9790 × 10⁻⁴) | (1.3730 × 10⁻⁴) | |||
| c | 1.1636 × 10⁻⁴ | 0.1755 | 8.5092 × 10⁻⁵ *** | 0.2158 |
| (3.7350 × 10⁻⁶) | (2.4060 × 10⁻⁶) | |||
| Obs. | 4550 | 4550 | ||
| R-squared | 6.7900 × 10⁻³ | 3.7000 × 10⁻³ | ||
| Low Volatility Regimes | High Volatility Regimes |
|---|---|
| Panel A. S&P500 | |
| 0.8174 | 0.8809 |
| 0.8274 | 0.8101 |
| 0.7920 | 0.7452 |
| 0.7377 | 0.7849 |
| 0.7821 | 0.7921 |
| Panel B. FTSE100 | |
| 0.6685 | 0.7423 |
| 0.6776 | 0.7564 |
| 0.7324 | 0.7762 |
| 0.6416 | 0.8731 |
| 0.7934 | 0.7697 |
© 2020 by the authors. Licensee MDPI, Basel, Switzerland. This article is an open access article distributed under the terms and conditions of the Creative Commons Attribution (CC BY) license (http://creativecommons.org/licenses/by/4.0/).
Share and Cite
Floros, C.; Gkillas, K.; Konstantatos, C.; Tsagkanos, A. Realized Measures to Explain Volatility Changes over Time. J. Risk Financial Manag. 2020, 13, 125. https://doi.org/10.3390/jrfm13060125
Floros C, Gkillas K, Konstantatos C, Tsagkanos A. Realized Measures to Explain Volatility Changes over Time. Journal of Risk and Financial Management. 2020; 13(6):125. https://doi.org/10.3390/jrfm13060125
Chicago/Turabian StyleFloros, Christos, Konstantinos Gkillas, Christoforos Konstantatos, and Athanasios Tsagkanos. 2020. "Realized Measures to Explain Volatility Changes over Time" Journal of Risk and Financial Management 13, no. 6: 125. https://doi.org/10.3390/jrfm13060125
APA StyleFloros, C., Gkillas, K., Konstantatos, C., & Tsagkanos, A. (2020). Realized Measures to Explain Volatility Changes over Time. Journal of Risk and Financial Management, 13(6), 125. https://doi.org/10.3390/jrfm13060125