Article

Impacts of Endogenous Sunk-Cost Investment on the Islamic Banking Industry: A Historical Analysis

by
Siddharth Jain
and
Partha Gangopadhyay
*
School of Business, Western Sydney University, Penrith, NSW 2751, Australia
*
Author to whom correspondence should be addressed.
J. Risk Financial Manag. 2020, 13(6), 108; https://doi.org/10.3390/jrfm13060108
Submission received: 28 April 2020 / Revised: 25 May 2020 / Accepted: 26 May 2020 / Published: 29 May 2020
(This article belongs to the Special Issue Islamic Finance)

Abstract

:
Endogenous sunk-cost investments are optional fixed investment or capita, that a firm can choose to impact either upon its price-cost margin or its market share for capturing larger market spoils. Oft-cited examples are investments in vertical product (quality) differentiation, advertising outlays, and R&D type expenses for improving production processes. The importance of sunk-cost capital has been highlighted in the recent literature since these investments significantly influence the degree of competition in an industry mainly through forestalling entry and thereby limiting future competition in the industry. Sunk-cost investments play an important role in the debate on the competition-(in)stability perspectives for the banking industry. This paper is motivated by an important distinction, hitherto unrecognized, that some endogenous sunk-cost investments impact on the relative efficiencies of firms and thereby on its market spoils or profits, while others will only impact on its market share and thereby on profits. An example of this distinction is as follows: while quality improvement in a product or production processes will create efficiencies and, therefore, additional profits, while advertising expenses are used to snatch market shares from rivals. The unintended consequence of the first type of endogenous-sunk cost investment is to boost efficiencies and thereby shape the nature of competition in a market. The second type will have little effect on efficiencies. In this paper, by exploiting the above distinction and using a dataset created from the annual reports of nine major Islamic banks in Jordon during 1993–2010, we will apply the efficiency models and the autoregressive distributed lag (ARDL) methodology to test if information technology (IT) capital is strategically used by Islamic banks as an endogenous sunk-cost investment to boost their relative efficiencies. For the first time—to the best of our knowledge—we find that IT capital is strategically used by seven out of the nine Islamic banks. We then consider the implication of the strategic use of IT capital by Islamic banks for the nature of competition in the Islamic bank industry of Jordon. By so doing, we also argue that IT capital, through its effects on the nature of competition, will lend stability to the Islamic banking industry of Jordan.

1. Introduction

In a branch of modern industrial economics, commonly known as the endogenous sunk-cost investment (see Sutton 1991, 1997a, 1997b, 1998, 2001a, 2001b, 2007; Shaked and Sutton 1983, 1987), economists seek to understand and explain a peculiar type of empirical regularities that fail to disappear even after five decades from modern (industrial) markets. In this context, what is commonly known as “market structure” issues can be summarized by twin (long-term) observations. First, many industries worldwide have a few dominant firms with large market shares; second, the size distribution of firms within most industries are highly lopsided or skewed and remains almost invariant over time. These twin observations arise despite the fact that individual industries have wide variations in terms of (industry-specific) idiosyncratic features. Sutton (2007) argues that most, if not all, industries are propelled by “some highly robust competitive mechanisms” to yield the above empirical regularities. The raison d’être of the endogenous sunk-cost investment models is to understand the competitive mechanism that can create and propel such regularity across various markets. Our main contribution is to apply the endogenous sunk-cost investment theory to a very novel market, which is called the Islamic banking industry, for understanding if the Islamic banking industry has also been subject to the above competitive mechanism and what are the implications of the above competitive mechanism for the Islamic banking industry.
Endogenous sunk-cost investment, as an important ingredient of modern industries, mainly includes scientific and engineering personnel, high-tech laboratories, information technology (IT) and related inputs to improve upon (i) product quality and (ii) the technology of production. The only other category of endogenous sunk-cost investment, such as advertisement expenses, is that firms grab larger market shares without any effect on efficiency (see Dick 2007). In a pioneering paper, building on Sutton (2007), Dick (2007) shows that endogenous sunk-cost investments are a major driver of competition and rivalry in the modern banking industry while the links between competition and stability for banking have been seriously explored in the existing literature (Ariss 2010; Jeon et al. 2011; Fu et al. 2014; Diallo 2015; Ijtsma et al. 2017, etc.—see Section 2 for details).
In this paper, we examine the impacts of endogenous sunk-cost investment for Islamic banks, for the first time—to the best of our knowledge—by applying a historical data set from Jordon1. If endogenous sunk-cost investment plays an important role for boosting efficiencies, then such investments can have far-reaching consequences for the nature of competition in the Islamic banking industry to shape the long-term stability of this industry. On the contrary, if we find that endogenous sunk-cost investments have a minimal or no role for the Islamic banking industry, then one can argue that the Islamic banking market can be beset with stability issues. From the existing literature, we know that the presence of endogenous sunk-cost investments in the traditional banking sector leads to the following features in the traditional banking industry (see Dick 2007): first and foremost, the nature of bank competition across (banking) markets becomes almost homologous in the presence of significant endogenous sunk-cost investment. Second, regardless of the size of the banking industry, the concentration index in the banking industry remains unchanged over time. Thirdly, the position of dominant banks remains highly stable and mostly unchallenged, while the fringe banks face intense competition with increases in the market size. Finally, the quality of baking services increases as the market size expands. As the market size grows, dominant banks are found to increase service quality by investing in endogenous sunk-cost investment to capture the additional demand when market size expands. Thus, endogenous sunk-cost investment is used as barriers to entry by dominant banks to lend banking stability.
In order to assess if the Islamic banking industry is characterized by endogenous sunk-cost investment, our analysis will proceed in the following steps with a rough plan of the paper as follows: In Section 2, we provide a brief literature review and then explain the methodology to detect endogenous sunk-cost investment for the Islamic banking industry. In Section 2, we also explain the relevant variables and he historical dataset from Jordan. In Section 3, we apply the autoregressive distributed lag (ARDL) approach to explain if IT capital operates as an endogenous sunk-cost investment in the Islamic banking industry of Jordan. In Section 4, we discuss our findings, and we present our conclusions in Section 5.

2. Modelling Endogenous Sunk-Cost Investment for the Islamic Banking Industry

The key to the understanding of any segment of a banking industry, like Islamic banking, as a single field of study comes from the very nature of banking (see Turner 2014a, 2014b): first and foremost, all banks—regardless of their types—operate in financial markets, which makes bank loans an imperfect substitute for capital market financing. More importantly, all types of bank financing derive from financial intermediation. Second, any model of financial intermediation requires the business of banking to exist because the market participants (depositors and borrowers) cannot meet in the market place and, hence, require a mediator (bank) to act on their behalf. Third, every transaction is internalized within a bank to lessen the adverse impacts of information asymmetries by matching borrowers with depositors. Banks receive a compensation for the risk that banks bear for carrying out financial intermediation (see Freixas and Rochet 2008). In the banking industry, regardless of the specific type of banks, financial intermediation has led to the emergence of two distinct and mutually opposing strands of thought, especially since the publication of two path-breaking monographs in the 1960s: the work of Gerschenkron (1962) stressed the role of banking in driving industrial and economic growth by improving efficiency as a result of better matching between borrowers and lenders by banks. On the other hand, Friedman and Schwartz (1963) argued that the banking sector makes the entire economic system extremely fragile as panics—fueled by bank failures (due to the problem of information asymmetries)—can create and amplify economic downturns across numerous sectors of an economy.
Can Islamic banks promote banking efficiency without triggering banking instability/fragility? Basov and Bhatti (2016), pp. 85–101, argued that Islamic banks play a special role to partially overcome the problems of information asymmetries: by applying the model of monopolistic screening, Basov and Bhatti argued that Islamic banks have a greater incentive to devise an optimal compensation scheme for the managers of firms/borrowers to mitigate the adverse consequences of information asymmetries. Misman and Bhatti (2020) found that Islamic banks lower their credit risks by improving their financing quality. They further noted that the size and the age of an Islamic bank are important determinants of its credit risk. Thus, the question of efficiency vis-a-vis fragility is fast becoming a central theme of the Islamic banking industry. In order to evaluate this important theme, we provide a detailed review of the existing literature on efficiency and fragility lest our emphasis be misplaced.
It is only recently that endogenous sunk-cost investments have been brought to the forefront to understand how efficiency and stability evolve in the banking sector characterized by the presence of large endogenous sunk-cost investments. To fully comprehend the ramifications of the endogenous sunk-cost investments for the Islamic banking industry, it is imperative to examine the consequences of the endogenous sunk-cost investment to the issues of efficiency and fragility in the existing banking literature.2
Endogenous sunk-cost investments drive efficiencies by either creating new products or improving the production processes, which converts technological possibilities into economic opportunities. A firm’s endogenous sunk-cost investments can directly impact on its profitability by raising the price-cost margin. Hence, ceteris paribus, the endogenous sunk-cost investment will either (a) enhance the value of a firm’s product to its customers due to improved product quality or (b) lower its marginal and average costs of production due to technological, or process, innovations3. Endogenous sunk-cost investments, due to their effects on efficiency, are expected to intensify competition among firms operating in a market. Such investments are also known to limit potential competition by limiting future entry (see Sutton 2007 and others). The existing (banking) literature has done little to highlight the endogenous sunk-cost investment; however, a large amount of literature exists on the impacts of efficiencies and competition on the stability of banking.
How does increased efficiency or competition impact the stability of the banking sector? The findings have been rather inconclusive. In recent years, there are important studies to address this question, which can be broadly divided into the cross-country studies and the country studies. In a pioneering paper, Ariss (2010) uses the Lerner’s index of market power for assessing the impact of increased competition on the profit, cost efficiencies and the overall market stability of the banking sectors of several emerging economies of our globe. Ariss finds that an increase in market power increases the bank stability and profit efficiency, however, lowers cost efficiencies. Hence, more competition can be detrimental for stability in the banking industry. Diallo (2015), exploring the banking industries of 145 countries during 1997–2007, highlights how increases in bank competition can create banking fragility and precipitate financial crises. Fiordelisi and Mare (2014) focus upon one segment of the entire banking sector in Europe—namely, the cooperative banks—to argue that a rising competition can improve the financial stability of this specific market segment. Forssbæck and Shehzad (2015) extend the study in a large panel of banks from many countries to show that increased competition can incentivize bankers to adopt more risky business strategies and will, hence, increase banking instability. Fu et al. (2014) turn their attention to the regional banking industries of 14 Asia-Pacific nations during 2003–2007 to establish that the effects of banking competition on the systemic stability of the regional markets are rather mixed. Fungáčová and Weill (2013), examining the Russian banking industry from 2001 to 2007, argue that a tighter bank control increases the probability of a bank failure. Almarzoqi et al. (2015), in their study of the banks in the Middle East and North African (MENA) countries, examine the impacts of the Lerner’s index of market power on the Z-scores and the liquidity ratios to argue that price competition positively impacts on bank liquidity, as it induces self-discipline on banks for the choice of bank funding sources and for the holding of liquid assets. However, increased price competition has a negative impact on bank solvency and on the credit quality of the loan portfolio. In a European Union (EU)-wide study, Ijtsma et al. (2017) utilize the experience of 25 EU countries from 1998 to 2014 to argue that the increasing market concentration improves banking stability. Kouki and Al-Nasser (2017), examining banks of 31 African countries over 2005–2010, note that an increase in competition decreases stability. Lapteacru (2014) examines the relevance of competition for banking stability for 10 East European countries during 2000–2010 to find that the results are mixed. Leroy and Lucotte (2017) examine 97 listed banks in the European markets from 2004 to 2013 and note that competition compromises banking stability. Tabak et al. (2012), in examining banks of 10 Latin American countries during 2003–2008, find mixed results. Tabak et al. (2013) expand the dataset for 17 Latin American countries for the same period and note that an increase in competition will increase banking stability.
As the cross-country studies failed to provide unequivocal conclusion, many authors started examining the banking industry at the country level to assess the impacts of banking competition on stability. Kick and Prieto (2015), using German universal bank data during 1994–2010, note inconclusive results. German universal banks are a special type of banks that are “full-service financial firms” offering commercial banking, investment banking, insurance, and other financial services. Jiménez et al. (2013), in their study of Spanish banks from 1988 to 2003, find inconclusive evidence of whether competition can impact on the stability of the banking industry. In another country-level study, Jeon and Lim (2013) examine the impacts of competition on banking stability in South Korea during 1999–2011. Their main innovation is to separate the banking industry into commercial banks and mutual savings banks to find inconclusive evidence on the precise impact of competition on stability for either market segments. Kasman and Kasman (2015) set the analysis in the context of Turkey during 2002–2012 to note that an increased competition will compromise banking stability in Turkey. Soedarmono et al. (2013), in the context of 11 Asian banks during 1994–2009, highlight that competition decreases stability. Tabak et al. (2015), in the context of Brazilian banks during 2001–2011, note mixed results.
In this work, we hence rely on the important insights of industrial economics to understand the implications of competition and stability by highlighting the impacts of endogenous sunk-cost investment on efficiency.

2.1. Endogenous Sunk-Cost Investment and Imperfect Appropriability

One of the important issues of endogenous sunk-cost investment is what is known as imperfect appropriability,4 which means that a bank might fail to get the full benefits (extra profits) from the endogenous sunk-cost investment due possibly to similar investments (or copy-cat strategies) adopted by its competitors. As an example, if all banks improve their product quality, there will be very little improvement in their individual profits since customers will not vote with their feet.5 It is imperative to note that there are several ways in which firms appropriate gains from endogenous sunk-cost investment, though the effectiveness of these appropriability mechanisms vastly differ across industries and innovations (see Levin et al. 1987; Cohen and Klepper 1996; Cohen et al. 2000).
The strength of the appropriability regime is a critical factor for creating dominant firms with large market shares and persistence of size distribution in an industry. This strength of the appropriability regime also determines potential competition by forestalling entry. In Section 2.2, we utilize the relative performance of banks to detect the effectiveness of endogenous sunk-cost investment in appropriating the value added from IT capital.

2.2. Detection of the Sunk-Cost Investment

The central mechanism of sunk-cost investment is that a bank can optimally choose to invest in endogenous sunk-cost investment, which will increase the price-cost margin to enable the bank to appropriate the value added. Thus, profitability will rise with an increase in sunk-cost capital, given the market share of a bank. As the market size and/or a firm’s output increases, their incentive to invest in endogenous sunk-cost investment will increase, ceteris paribus.
In a similar vein, the sunk-cost investment fails to be effective for a bank if all banks invest equally in acquiring endogenous sunk-cost investment, which will give rise to the appropriability problem. In other words, the ex-ante (subjective) profitability will fail to be ex-post (realized) profitability if a firm’s rivals match that firm’s sunk-cost investment. The sunk-cost investment of a bank fails to have any impact since it does not produce any perceptible effect on the profitability of a bank. The bank-specific profitability, or price-cost margin, is the key to the detection of sunk-cost investment for a bank. We hence put forward two hypotheses to empirically test if a firm has endogenous sunk-cost investment:
Hypothesis 1.
If the chosen sunk-cost investment of a bank increases its cost efficiency relative to other banks, the investment is considered an endogenous sunk-cost investment. This hypothesis is predicated upon the definition of an endogenous sunk-cost investment that improves the technology of production used by a bank, given the quality of its products or services. If a bank fails to improve its relative (cost) efficiency, which signifies the presence of serious appropriability problem for reaping the benefits from sunk-cost investments.
Hypothesis 2.
If the chosen (endogenous) investment of a bank increases its profit efficiency, the investment is defined as an endogenous sunk-cost investment. This hypothesis invokes another facet of the endogenous sunk-cost investment: it defines an endogenous sunk-cost investment as the outlay to improve its product quality, which will increase its profitability given the technology of production. The implicit assumption is that the higher the quality of the product of a bank, the higher will be the price given the cost function, by construction, which assumes away the appropriability problem. Hence, the larger is the endogenous sunk-cost investment by a bank, the larger will be its relative profitability, or profit efficiency, compared to its rival.
In the following sub-section, we will define the measures of efficiency utilized in this paper for the Islamic banks. The main prediction of the existing literature from Hypothesis 1 and Hypothesis 2 is given by the following:
Prediction 1.
The major implication of Hypothesis 1 and Hypothesis 2 is that, for industries with significant endogenous sunk-cost investment, the concentration ratio in the industry will be at best sluggish—if not totally invariant—over time. In theoretical terms, the concentration of an industry with significant endogenous sunk-cost investment will have a lower bound to its concentration index. (Sutton 1991, chp. 3)
The theoretical prediction, confirmed by most empirical studies, is explained by entry barriers for potential entrants created by the endogenous sunk-cost investment. The entry barrier is erected by the need to incur an additional cost—for any potential entrant—for acquiring an endogenous sunk-cost investment necessary to enter and meaningfully participate in the market which can, if suitably chosen by incumbent firms, outweigh the additional revenues generated by the growth of revenues for entrants. In what follows in Section 2.3, we apply the standard measures of efficiency frontiers to derive the cost efficiency scores and profit efficiency scores of banks. In Section 3, we explore if IT capital of individual banks impacts on their efficiency scores for assessing if IT capital is truly an endogenous sunk-cost investment for the Islamic banks of Jordan.

2.3. Efficiency Frontiers to Measure Profitability: The Cost Function Approach to Islamic Banks

The concept of productivity, or efficiency, of a firm can be reduced to a production function:
Y = f ( X m )
In Equation (1), Y represents the output of an Islamic bank, Xm represents a vector of inputs, and f(.) is a functional form representing the embedded technology in the production. The duality theory establishes the precise relationships between production function vis-a-vis cost function and profit function (Coelli et al. 2005). The main idea of efficiency is either to achieve the least cost given the output or to maximize the output (for the maximum profit) given the total cost. When data on prices for inputs and outputs are available, a firm is operating in a competitive market, and its aims are to achieve cost minimization or/and profit maximization, then it is possible for a firm to decide on the best mix of inputs or/and outputs meeting such aims. The cost function is the one that can be interpreted as being derived from minimizing cost, subject to the constraint of reasonable production technology. The concept of productivity efficiency flows directly from the microeconomic theory of the firm, and the production function represents the maximum rate of output that can be produced with given inputs and technology. This relationship can be expressed as follows:
C = F(Pm, Yn)
where Yn represents a vector of output, Pm (m = 1, 2, … M) is a vector of input prices, and F(.) is a functional form. In terms of the cost of production, the efficiency approach seeks to find the best practice banks who are cost-efficient while the other banks operate inefficiently above the cost frontier above the estimated minimum cost. The basic panel-data cost function model of bank i in year t is expressed logarithmically as
ln Cit = β0 + h(yit, wit; β) + vit + ηit
where Cit is the total cost incurred by bank i in year t ; wit denotes the vector of input price of farm i in period; yit denotes the vector of output; β is the vector of the parameters to be estimated; h ( y i t , w i t , β ) is the cost function that represents the (dual) cost technology; vit is the noise term; and ηit ≥ 0 is the inefficiency score of bank i in year t. We thus assume that the bank inefficiency is individual-specific and also time-varying by allowing the likelihood of the bank inefficiency to change over time, ηit = ηi k(t) where k(t) is a function of time—see Battese and Coelli (1988, 1992). Hence, Equation (3a) can be written as
ln Cit = β0 + h(yit, wit; β) + vit + ηi k(t)
We use a generalisation of the Cobb–Douglas functional form is the so-called translog cost function is given below (see Christensen et al. 1973), ignoring the time subscript:
ln (Cit) = β0 + ∑j αj ln(wjt) + ∑k βk ln(Ykt) + ½ ∑ji γji ln(wjt) ln(wit)
+ ½ ∑kl δkl ln(Ykt) ln(Ylt) + ∑jk ρik ln(wjt) ln(Ykt) + ηit + vit
In Equation (3c), wj is the price of input j; Yk is output k; Ci is the total costs of bank I; and β0, αj, βk, γji, δkl, and ρik are the parameters to be estimated. Note that ln is the natural logarithmic transformation, and ηit is the time-varying inefficiency term for estimation. The translog cost function is estimated as a system of equations. The observables of each of the Islamic bank are the total cost of each bank, the allocation of total cost across the various inputs (i.e., input expenditure shares), each Islamic bank’s output level, and the input prices that the firm faces. In Equation (3c), we hence have
  • Cit—the total costs of bank i in year t;
  • Yijt—the vector of the outputs of bank i at date t; output (labelled j) are (i) the total loan, (ii) investment, and (iii) other earning assets at date t;
  • Wijt—the vector of input prices facing bank i; j is input types which are (i) the price of labour, (ii) price of physical capital, and (iii) price of financial capital inputs computed as
Price of labour = wiL = (total personal expenses/total employment)
Price of physical capital = wiA = (non-interest and non-personal expenses)/(fixed assets)
Price of financial capital = wiF = (total interest costs)/(total deposits)
nit measures time-varying inefficiency.
The best practice frontier, estimated through a cost function, focuses on the input side of bank production and may overlook important dimensions of banks’ decision making. Berger and Mester (2003) argue that the use of a profit frontier can be more appropriate than that of a cost frontier because it accounts for both output and input suboptimal bank decisions. However, in standard profit analysis output prices are taken as exogenous, considering profit inefficiency as a sub-optimal choice with respect to input–output relative prices. This is not an accurate representation of the banking industry because a large share of revenues originates from bilateral contracting in which banks have substantial bargaining power.
Alternatively, one can adopt the formulation of the profit function, introduced by Humphrey and Pulley (1997), in which output prices are flexible while output levels are taken as given. Errors in the choice of outputs do not affect the efficiency vector, while errors in setting output prices do. The estimated efficiency levels in this case will measure how close a bank is to its maximum profit given an input-output quantity mix. The price to be paid for this gain is the assumption that profits are maximized, conditional on output levels.

2.4. Efficiency Frontiers to Measure Profitability: The Profit Function Approach

The best practice frontier, estimated through a cost function, focuses on the input side of bank production and may overlook important dimensions of banks’ decision-making. Berger and Mester (1997) argue that the use of a profit frontier can be more appropriate than that of a cost frontier because it accounts for both output and input suboptimal bank decisions. However, in standard profit analysis, output prices are taken as exogenous, considering profit inefficiency as a sub-optimal choice with respect to input-output relative prices. This is not an accurate representation of the banking industry because a large share of revenues originates from bilateral contracting in which banks have some bargaining power. We, therefore, adopt the formulation of the profit function, introduced by Humphrey and Pulley (1997), in which output prices are flexible while output levels are taken as given. Errors in the choice of outputs do not affect the efficiency vector, while errors in setting output prices do. The estimated efficiency levels in this case measure how close a bank is to its maximum profit given an input–output quantity mix. The price to be paid for this gain is the assumption that profits are maximized conditional on output levels, which is a very demanding hypothesis.
The profit function can be interpreted as the result of maximizing profit subject to the constraint of reasonable production technology. The profit function is expressed as follows (see Berger and Mester 1997).
Π = Φ(Pn, Wm, Yn, Xn)
where Π is the profit, Yn ( n = 1, 2, …, n ) is a vector of output, Pn is the vector of output prices, and Wm is a vector of input prices. Xm is a vector of input use, which is a function of prices only. As with the cost function, the profit function should satisfy many properties, which are generalizations of cost properties. The profit function is estimated from a system of equations. Our extension is on the basis of three outputs and three inputs of banks; the translog profit frontier is specified as follows:
ln πit = β0 + Σn βYn lnYn + Σm βwm lnPm + [Σn Σm βmn lnYn lnXm + Σn Σm βmn lnPm lnPn]/2
+ Σn Σm βnmw lnYn Pm + ηit + μit
where πit is the profits of bank i in year t to measure the effectiveness of banks in creating a surplus.
In this study, we will use return on assets (ROA) to measure the effectiveness of management in the use of available resources and the extent of their ability to achieve returns, and thus reflects the effect of operating, financing, investment, and technological activities. ROA is a useful measure of the performance of banks (Molyneux et al. 1996; Polius and Samuel 2000):
  • Yn is the vector of the outputs of bank i in year t , which are (i) total loans, (ii) investment and (iii) other earning assets;
  • Xmt is the vector of input uses (labour, capital, and financial capital) as a function of input prices and output;
  • Pm is the price of inputs (PL: price of labour (wage), PK: price of capital, PF: price of financial capital);
  • nit is the measure of inefficiency in terms of forfeited profits;
  • μit is the error term.

2.5. Historical Dataset (1993–2010) and Relevant Variables

Banking became a highly regulated industry after the Great Depression in the 1930s in almost every country. Within four decades from the era of control and regulation, the US policy makers sought to reduce the regulations by undertaking a series of deregulation measures of the US banking system in the 1970s. Gradually, most nations have emulated the US policy in deregulating their banking industries. During the era of regulations, the banking industry enjoyed a remarkable stability. The rationale for regulation of the first era was driven by the collective wisdom that competition will create costly instability in the banking sector. Gradually, policy makers started highlighting the massive costs of (banking) regulations, mainly from inefficiencies due to financial repression. A major source of banking inefficiency in the first era was identified as the soft application of the competition policy to the banking sector for avoiding excessive competition among banks triggering a potentially devastating banking instability (see Vives 2010). During the era of deregulation, since the 1970s, the enforcement of the competition policy became much stricter in the industry exposing banks to face intense competition from each other. This intense competition was meant to reduce costly inefficiencies in the banking industry. However, the era of deregulation experienced recurring incidents of banking crisis culminating with the subprime crisis of 2007. Thus, the controversy over the trade-off between competition and stability has dominated the debate over the desirability of competition and efficiency for the banking sector.
As we highlighted in Footnote 1, during the 1990s, Jordon’s banking system witnessed a series of major reforms to promote competition and rivalry in the banking sector, which also led to a massive expansion of bank branches with a solid footing in Islamic financial practices. In 2015–2016, Reuter’s ranking of leading Islamic finance industries of our globe, Jordon stood at the ninth place. Roughly 14% of all banking assets and 11% of all banking equities belong to the Islamic banks while the liabilities of Islamic banks are about 25% of banking liabilities in Jordon. Not only Islamic banks are a powerful player in Jordon, but its considerable potential for future expansion as financial inclusion is still a major problem in Jordon. Hence, in this paper, we will examine the Islamic banks of Jordon for the first time to understand the implications of competition for stability for Islamic banks. Admittedly, Jordon’s corporate sector will still need to improve the gender-neutrality of the corporate culture as highlighted by Banihani and Syed (2020), yet the neutrality of gender for productivity is commonly observed in the Islamic banking industry Jordon mainly for dispute resolution. Bhatti (2020b) highlighted the importance of effectively managing the procedure of Shariat-compliant dispute resolution for achieving social and financial inclusion in Jordon.
Though there are 14 Islamic banks in Jordan, for newer banks the datasets are inadequate for undertaking any long-term analysis. In this paper, we hence use detailed data collected from the annual reports of nine (9) major Islamic banks of Jordon or banks with subsidiaries offering banking services that are Islamic-sharia complaint. The top three Islamic banks in Jordan had a combined balance sheet total of $10.9 billion USD—about 16.3% of total assets of all banks in Jordon. Among the top three Islamic banks in Jordan, we are only able to use Jordan Islamic Bank’s (JIB) data for offering a reasonably long time-series data. The other two Islamic banks started their operation in 1997, which will be inadequate for any meaningful time-series analysis. JIB is the leading Islamic bank of Jordon. For each of the nine banks, Table 1 provides their identities. We gather data from annual and monthly reports for the variables described in Table 2.
In Table 3, we provide the summary statistics of the chosen variables.

2.6. Implications of Competition for the Banking Industry

It is an important view of the modern banking literature that there is a trade-off between competition and stability in the traditional banking industry. It is often argued that, although competition promotes bank efficiency, the competition also contributes to the compromise of the systemic stability of the banking industry. This compromise is meant to work through the adverse impacts of (increased) competition in banking on bank valuation since increased competition is meant to squeeze bank profits. The profit squeeze incentivizes bank executives to indulge in riskier investments as they have less to lose. Thus, increased competition can lead to riskier investment by banks, which can, in turn, cause increased fragility for the banking industry. From this competition-fragility perspective, a relatively new view has emerged, at least since the global financial crisis, that calls forth a careful balancing of the efficiency benefits with the fragility costs of competition (see Jiang et al. 2018). The debate has been immensely popularized by the Economist (The Economist 2009):
[T]here is clearly some tension between financial stability goals and the tenets of competition policy, which hold that oligopolies are inefficient and serve consumers badly … many policymakers seem to think that some curbs on competition may be a price worth paying to improve stability.
Senior policymakers from the Federal Reserve of the US accorded significant support to the above view that competition breeds banking fragility/instability (see Tarullo 2012). The academic economists, however, tend not to fully support the view that the banking system will need less competition and efficiency in return for greater stability (see Jiang et al. 2019). The empirical research finds that increased competition does not necessarily create banking fragility/instability. Yet, there is no convincing argument as to why some banking sectors are robust to increased competition while others are not. The important missing link in this context is the use of endogenous sunk-cost investment such as information technology (IT) capital, which can have significant impacts on the nature of bank competition and thereby on the fragility in the banking sector.
The existing literature has not examined the role of IT as an endogenous sunk-cost investment for the banking industry, especially so or the Islamic banking sector. If IT capital is an endogenous sunk-cost, increased competition will have minimal impacts on the banking industry due to the lower bound on the concentration ratio as highlighted by Sutton (2007). Our research can hence offer very important insights to explain whether increased competition—as a driver of banking efficiency—triggers instability, or stability, in the banking sector.

3. Determinants of Profitability and Endogenous Sunk-Cost Investment of Islamic Banks of Jordon: The ARDL Approach

In Section 3, our goal is to assess if IT capital impacts on the cost and profit efficiency scores of the Islamic banks. To do this, we apply the cointegration analysis to explore the short-run and long-run relationships between IT capital and efficiency scores of Islamic banks. One of the major hurdles for analyzing the role of IT capital in our efficiency measures is to address the problems of autocorrelation and non-stationarity for making our results reliable. We hence apply the autoregressive distributed lag (ARDL) bounds testing approach of Pesaran et al. (2001).
The ARDL method is especially suitable for small sample situations (Gangopadhyay and Jain 2019), as the case in the present study, due to the non-availability of reliable long-run data for investments in IT. More importantly, the methodology is capable of handling variables that are stationary and non-stationary (integrated of up to order 1 or even fractionally integrated). Results obtained from this approach are unbiased and efficient since they are robust to problems of autocorrelation.
The ARDL approach involves two steps. In step 1, as predicted by the theory, we test for the existence of the long-run relationship between our variables of interest. If evidence of such a link is shown to exist, then in step 2, we estimate the short and long-run parameters of the relationship.

3.1. Stationarity (Unit Root) Tests

To check the presence of unit roots in our variables of interests, we have undertaken the following tests. (1) the Phillips–Perron (PP) test, (2) the Augmented Dicky–Fuller (ADF) test with lag length chosen using the modified Akaike Information Criterion (AIC) as per Ng and Perron (2001), and (3) the procedure suggested by Clemente et al. (1998), allowing for a single structural break (additive outlier). The Table 4 and Table 5 below present the unit root results from PP test and ADF (AIC).
As variables are stationary at the level [I(0)] or First Difference [I(1)], we safely apply the ARDL bounds testing approach to detect cointegration.

3.2. Postulated Models to Unravel the Effects of IT Capital as Sunk-Cost Capital on Efficiency Scores of Islamic Banks

Our postulated model for ARDL bounds testing, at the bank level, is
y t = α 0 + ρ y t 1 + a l n I T K t 1 + i = 1 p 1 α i y t i + i = 0 q 1 b i l n I T K t i + ω t
where y is the dependent variable, which is an efficiency score (say, cost efficiency score (CES)). The explanatory variables include the following: lnITK denotes the log values of IT capital of a chosen bank. Note that we will undertake the analysis Separately for each of the nine Islamic banks. Note that ω t is a vector of the error term. In Equation (7), the two variables ( y and lnITK) are not cointegrated if ρ = a = 0. Pesaran et al. (2001) have proposed the F-test to test the presence of cointegration in the estimated ARDL model. The decision is based on two critical bounds—the upper bound and the lower bound. When the value of F-statistic is higher than the upper bound, the null hypothesis is rejected, which means a long-run relationship between y and l n I T K exist. The ARDL model in the above equation assumes a linear combination of dependent and independent variables, which indicate a symmetric adjustment in the long and the short-run of y to any shock in our interest variable—lnITK. Our model is consistent with Pesaran et al. (2001), who developed a linear cointegration autoregressive distributed lag model (ARDL) to evaluate the long run and the short-run effects simultaneously. In their model, the dependent variable responds symmetrically to both increases and decreases in the independent variable. To do the above, we use the ARDL bounds testing approach of Pesaran et al. (2001).
One of the advantages of using the time series approach is that since coefficient estimates in the presence of cointegration have the super consistency property, we do not need to address the problem of endogeneity between variables (Engle and Granger 1987). Thus, endogeneity will not affect our results. Further, the super consistency property of the estimates holds, even if there are omitted stationary variables (Gangopadhyay and Nilakantan 2018; Herzer and Strulik 2017). Step 1 of the ARDL approach involves estimating an unrestricted ARDL error correction model (ECM), as shown in the generic model given by Equation (7). The specific equations and their results are summarized in the Tables below. Diagnostics are explained in the Appendix A.

4. Findings

Table 6 shows that there is a long-term relationship between cost efficiency scores and IT capital for seven out of nine Islamic banks in Jordon from the historical data set from 1993–2010. This result has been anticipated in earlier work on bank profitability and IT capital by Oliner and Sichel (2000) for understanding the relevance of information and technology for firm/bank-level efficiency.
Table 7 confirms that all nine Islamic banks in Jordan, for which the relevant information is available out of 14 Islamic banks, the long-term relationship exists between profit efficiency scores (PES) and the IT capital. Thus, regardless of choosing Hypothesis 1 and Hypothesis 2 of this paper, there is evidence of IT capital (LnITK) being used as an endogenous sunk-cost investment for Islamic banks in Jordon during 1993–2019.
As highlighted in Section 2.5, during the 1990s, major reforms of the banking sector of Jordon led to the (i) liberalization of interest rates and foreign exchange rates, (ii) introduction of new financial regulations for enforcing international banking standard, (iii) modernization of Jordan’s capital market. These reforms triggered a massive expansion of bank branches intensifying competition among banks along with the expansion of the networks of Islamic banks. Several serious economic and financial problems engulfed Jordon from rising unemployment, various disasters in the Middle East—like the Gulf War, the Arab Spring, the Syrian crisis, and social tension from fiscal consolidation, massive annual spending of $2.5 billion on refugees despite Jordon’s historical dependence on grants and soft loans for financing budget deficits. Yet, as we noted before, the banking sector has posted excellent record. Within the banking sector, the Islamic banks consolidated their market positions in an increasingly competitive environment, making Jordon the ninth largest Islamic finance market of our globe. Islamic banks have more than 25% of the entire banking liabilities, or banking debts, of Jordon. The development in the banking sector, especially for the Islamic banks, would remain unachievable without meaningful endogenous sunk-cost investments by banks, especially the Islamic banks during the new era of competition and rivalry in Jordon’s banking sector. These endogenous sunk-cost investments are meaningful, or effective, when they improve product quality and foster technological developments without appropriability problems. Alternatively, sunk-cost investment could have taken unproductive forms such as “advertisement wars” with little consequences for banking efficiencies in Jordon.
We discovered that Islamic banks during 1993–2010 started using IT capital as a meaningful endogenous sunk-cost investment, which not only consolidated their market positionings but also created stability in the entire banking industry.
It is imperative to stress that not all banks can, or should, utilize IT capital as endogenous sunk-cost investment; if we choose Hypothesis 1, using cost efficiency scores, to test the efficiency of endogenous sunk-cost investment, only two out of nine Islamic banks are effective improving their relative positions in cost efficiency and thereby able to deter entry by potential competitors (namely, JIB and HB, see Table 5, for the variable lnITK) using IT capital. From the existing literature, we know only a few firms can effectively use endogenous sunk-cost investment (see Sutton 2007) to create a well-functioning market. If we choose Hypothesis 2, using profit efficiency scores (PES), the picture becomes clearer: four out of nine Islamic banks can effectively use IT capital as an endogenous sunk-cost investment to drive efficiency in the sector.
There are two important messages emerging from the empirical findings. First, an intensification of the competitive environment facing a bank, ceteris paribus, will incentivize some banks—if not all of them—to increase IT capital to forestall future entry to retain a lower bound on concentration or degree of competition in the Islamic banking industry of Jordon. There is inherent stability in the Islamic banking industry, and hence, the Islamic banking sector does not face extreme fragility. The fragility does not arise as many Islamic banks use the IT capital as an endogenous sunk-cost investment to retain the market concentration.
In their recent work, Jiang et al. (2016, 2018, 2019) also noted that increased competition does not necessarily lead to banking fragility in the US context. Our findings lend support to their work and also provide an explanation, i.e., the role of endogenous sunk-cost investment in promoting efficiency, why more intense competition does not necessarily cause fragility in the (Islamic) banking industry.
The second message is that some Islamic banks suffer in terms of loss of either cost or profit efficiencies despite using IT capital to influence the degree of competition in the Islamic banking industry. In other words, some banks fail to appropriate the benefits from investing in the sunk-cost capital like IT capital. Following the intuition of Sutton (2007), in our future work, we will apply the notion of “firms’ capabilities” to explain why some banks can improve their relative efficiency from the endogenous sunk-cost investment while others fail. Sutton (2007) forcefully argued the need for introducing firms’ capabilities to represent their productivity and product quality in their markets of operations. As Sutton argues, “the term capability relates to the set of shared know-how embodied in a set of individuals within the firm, from which these levels of productivity and quality derive” (p. 2308).

5. Conclusions

The theory of endogenous sunk-cost investment has become a powerful rationale for explaining the persistence of market concentration in many industries, including the banking sector. Industries with significant endogenous sunk costs, with expanding markets, will incentivize (some or all) firms to increase their investments in these sunk costs, which will in turn limit potential competition by preventing entry. In other words, individual banks can use endogenous sunk costs to secure future profits by controlling or preventing entry, even though these investments might not directly yield any additional profits when other firms/banks invest in endogenous sunk costs. As a result, these industries will tend to remain or become more concentrated.
In this work, we consider the relevance of endogenous sunk-cost investment by Islamic banks, to the best of our understanding, for the first time. We find evidence from a historical dataset that some Islamic banks in Jordan during 1993–2010 sued information technology investment as an endogenous sunk-cost investment. The implications of the finding are far-reaching. It has been a time-honored debate on whether competition is good for banking; the banking and fragility perspective highlights that there is a trade-off between competition and stability in the banking industry. As competition boosts efficiency, it significantly compromises banking system stability by squeezing profits, lowering bank valuations, and encouraging bankers to make riskier investments because they have less to lose (see Jiang et al. 2016, 2018, 2019; Tarullo 2012). As a result, both theoretical and empirical research seeks to identify the degree of competition that can suitably balance the efficiency benefits and the fragility costs of increased competition.
A missing link in the existing research is how endogenous sunk-cost investment can influence the competition-fragility perspective for Islamic banks or banks at large since such endogenous investments create a lower bound below in which the concentration or degree of competition does not fall. This lower bound can offer protection to Islamic banks from becoming too fragile. In other words, from our empirical study from Jordan, we find evidence that the Islamic banking industry seems to enjoy an inherent protection mechanism that prevents the system from becoming fragile. Further work is warranted to fully understand the relevance of the competition-fragility perspective for Islamic banks.

Author Contributions

S.J. did the econometric modelling in Section 3 and wrote the conclusion. P.G. did the econometric modelling in Section 2, wrote the introduction and contributed to the literature review and a detailed discussion of the statistical results. All authors have read and agreed to the published version of the manuscript.

Funding

This research received no external funding.

Conflicts of Interest

The authors declare not conflict of interest.

Appendix A

In the classical linear regression models, normality is one of the most common assumptions. We tested normality of our data using the Jarque and Bera (1980) test. It is one of the most popular tests to verify the normality of the regression residuals, which is widely accepted by econometricians (Thadewald and Büning 2007).
The results of the Jarque and Bera (1980) test are present in Table A1.
Table A1. Diagnostic for normality using the Jarque-Bera test.
Bank NameJarque–Bera Test
Normality
CESPESlnITK
AB12.82 ***2.526.38 ***
AEB1.571.797.38 ***
CAB1.633.470.03
HB4.391.750.45
JB9.80 ***4.273.92
JCB2.247.35 ***11.41 ***
JIB0.710.457.50 ***
JKB1.490.454.51
UB1.490.310.12
Note: *, **, *** represents 10%, 5% and 1% levels of significance respectively. Source: constructed by the authors.
The results of the Jarque and Bera (1980) test indicate that CES of Arab Bank (AB) and Jordan Bank (JB) are not normally distributed. While the variable PES is not normally distributed for Jordan Commercial Bank (JCB). The variable lnITK was found to lack normality for (i) Arab Bank (AB), (ii) Arab Egyptian Bank (AEB), (iii) Jordan Commercial Bank (JCB), and iv) Jordan Islamic Bank (JIB).
To test our models for serial autocorrelation, we undertook the Breusch–Godfrey LM test, with the null hypothesis: H 0 = no autocorrelation on the residuals. The results of the test are present in Table A2.
Table A2. Diagnostic for serial autocorrelation using the Breusch–Godfrey LM test.
Bank NameBreusch–Godfrey
Serial Correlation
CES & lnITKPES & lnITK
AB0.083.43 *
AEB7.85 ***0.29
CAB3.28 *0.1 *
HB13.00 ***0
JB3.07 *2.07
JCB6.67 ***0.06
JIB6.88 ***0.09
JKB0.040.18
UB0.5112.04
Note: *, **, *** represents 10%, 5%, and 1% levels of significance, respectively. Source: constructed by the authors.
The null hypothesis of no-autocorrelations requires to be rejected if the significance level of the test statistics exceeds the 5% level of significance. The p-values of the tests indicate that there exists no sufficient evidence against the null hypothesis of no autocorrelation for our model contemplating the relationship between the variables PES and lnITK. However, our model, which assessed cointegration between CES and lnITK of Islamic banks in Jordan, suffered from the problem of serial autocorrelation for four banks, namely, the (i) Arab Egyptian Bank, (ii) Houing Bank, (iii) Jordan Commercial Bank, and (iv) Jordan Islamic Bank.
We further undertook the Breusch and Pagan (1979) test, which verifies the null hypothesis of homoskedasticity. The results of the test are present in Table A3.
Table A3. Test for Heteroskedasticity using Breusch-Pagan test.
Bank NameBreusch–Pagan
Heteroskedasticity
CES & lnITKPES & lnITK
AB0.640.07
AEB0.0010.08
CAB2.171.21
HB1.630.01
JB1.780.72
JCB0.161.1
JIB0.430.63
JKB1.040.03
UB1.930.01
Note: *, **, *** represents 10%, 5% and 1% levels of significance respectively. Source: Constructed by the authors.
The results from the Breusch–Pagan test indicate that we cannot reject the null hypothesis of homoskedasticity. Hence, these are models are free from the problem of heteroskedasticity.
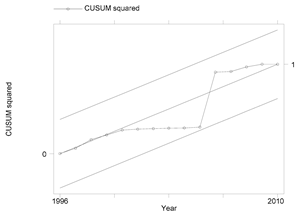
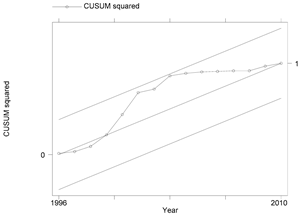
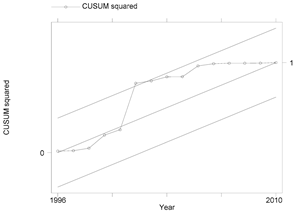
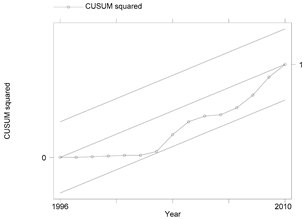
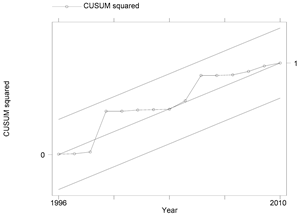
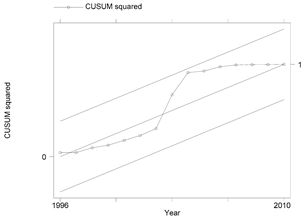
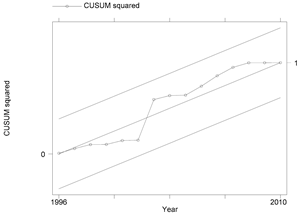
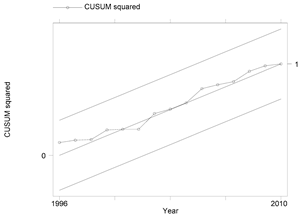
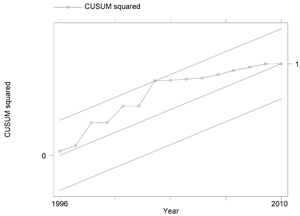
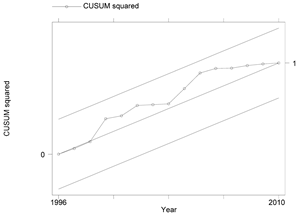
Cumulative Sum Control Charts (CUSUMs) are control charts that display the cumulative sums of deviation from a target variable. We used the CUSUM charts to assess if our models are within tolerances, or beyond tolerances. The results for our sample banks and their respective models are present below.
Table A4. Model stability using the Cumulative Sum Control Chart (CUSUM) test.
BankCESPES
AB Jrfm 13 00108 i0a1 Jrfm 13 00108 i0a2
AEB Jrfm 13 00108 i0a3 Jrfm 13 00108 i0a4
CAB Jrfm 13 00108 i0a5 Jrfm 13 00108 i0a6
HB Jrfm 13 00108 i0a7 Jrfm 13 00108 i0a8
JB Jrfm 13 00108 i0a9 Jrfm 13 00108 ia10
JCB Jrfm 13 00108 ia11 Jrfm 13 00108 ia12
JIB Jrfm 13 00108 ia13 Jrfm 13 00108 ia14
JKB Jrfm 13 00108 ia15 Jrfm 13 00108 ia16
UB Jrfm 13 00108 ia17 Jrfm 13 00108 ia18
The results of the CUSUM test indicate that our model assessing the cointegration of CES and lnITK for (i) Jordan Bank and (ii) Jordan Islamic Bank, which have problems of parameter stability. While, the model testing cointegration between PES and lnITK, suffer from the problem of parameter stability in the case of (i) Cairo Amman Bank.

References

  1. Alam, Intekhab, and Pouya Seifzadeh. 2020. Marketing Islamic Financial Services: A Review, Critique, and Agenda for Future Research. Journal of Risk and Financial Management 13: 12. [Google Scholar] [CrossRef] [Green Version]
  2. Almarzoqi, Raja, Sami Ben Naceur, and Alessandro Scopelliti. 2015. How Does Bank Competition Affect Solvency, Liquidity and Credit Risk? Evidence from the MENA Countries. IMF Working Papers 15/210. Washington, DC: International Monetary Fund. [Google Scholar]
  3. Ariss, Rima Turk. 2010. On the implications of market power in banking: Evidence from developing countries. Journal of Banking & Finance 34: 765–75. [Google Scholar]
  4. Banihani, Muntaha, and Jawad Syed. 2020. Gendered work engagement: Qualitative insights from Jordan. The International Journal of Human Resource Management 31: 611–37. [Google Scholar] [CrossRef]
  5. Basov, Suren, and M. Ishaq Bhatti. 2016. Islamic Finance in the Light of Modern Economic Theory. Berlin/Heidelberg: Springer. [Google Scholar]
  6. Battese, George, and Tim J. Coelli. 1988. Prediction of firm-level technical efficiencies with a generalized frontier production function and panel data. Journal of Econometrics 38: 387–99. [Google Scholar] [CrossRef]
  7. Battese, George, and Tim J. Coelli. 1992. Frontier production functions, technical efficiency, and panel data: With application to paddy farmers in India. In International Applications of Productivity and Efficiency. Edited by Thomas Gulledge and Knox Lovell. Dordrecht: Springer, pp. 181–90. [Google Scholar]
  8. Berger, Allen N., and Loretta J. Mester. 1997. Inside the black box: What explains differences in the efficiencies of financial institutions? Journal of Banking and Finance 21: 895–947. [Google Scholar] [CrossRef] [Green Version]
  9. Berger, Allen N., and Loretta J. Mester. 2003. Explaining the dramatic changes in performance of US banks: Technological change, deregulation, and dynamic changes in competition. Journal of Financial Intermediation 12: 57–95. [Google Scholar] [CrossRef] [Green Version]
  10. Bhatti, Maria. 2020a. Resolving Islamic finance disputes through arbitration in the Middle East. In The Growth of Islamic Finance and Banking: Innovation, Governance and Risk Mitigation. Abingdon: Routledge, pp. 254–61. [Google Scholar]
  11. Bhatti, Maria. 2020b. Managing Shariah Non-Compliance Risk via Islamic Dispute Resolution. Journal of Risk and Financial Management 13: 2. [Google Scholar] [CrossRef] [Green Version]
  12. Breusch, Trevor S., and Adrian R. Pagan. 1979. A simple test for heteroscedasticity and random coefficient variation. Econometrica: Journal of the Econometric Society, 1287–94. [Google Scholar] [CrossRef]
  13. Christensen, Laurits R., Dale W. Jorgenson, and Lawrence Lau. 1973. Transcendental Logarithmic Production Frontiers. Review of Economics and Statistics 55: 28–45. [Google Scholar] [CrossRef]
  14. Clemente, Jesus, Antonio Montañés, and Marcelo Reyes. 1998. Testing for a unit root in variables with a double change in the mean. Economics Letters 59: 175–82. [Google Scholar] [CrossRef]
  15. Coelli, Timothy J., Dodla Sai Prasada Rao, Christopher J. O’Donnell, and George Edward Battese. 2005. An Introduction to Efficiency and Productivity Analysis, 2nd ed. New York and Christiansen: Springer Science and Business Media Inc. [Google Scholar]
  16. Cohen, Wesley, and Steven Klepper. 1996. A Reprise of Size and R&D. The Economic Journal 106: 925–51. [Google Scholar]
  17. Cohen, Wesley, Richard Nelson, and John Walsh. 2000. Protecting Their Intellectual Assets: Appropriability Conditions and Why U.S. Manufacturing Firms Patent (or Not). Working Paper No. 7552. Cambridge: NBER. [Google Scholar]
  18. Diallo, Boubacar. 2015. Bank competition and crises revisited: New results. Economics Letters 129: 81–86. [Google Scholar] [CrossRef]
  19. Dick, Astrid. 2007. Market Size, Service Quality, and Competition in Banking. Journal of Money, Credit and Banking 39: 49–81. [Google Scholar] [CrossRef]
  20. Engle, Robert F., and Clive W. J. Granger. 1987. Co-integration and error correction: Representation, estimation, and testing. Econometrica: Journal of the Econometric Society 55: 251–76. [Google Scholar] [CrossRef]
  21. Fiordelisi, Franco, and Davide Salvatore Mare. 2014. Competition and financial stability in European cooperative banks. Journal of International Money and Finance 45: 1–16. [Google Scholar] [CrossRef] [Green Version]
  22. Forssbæck, Jens, and Choudhry Tanveer Shehzad. 2015. The conditional effects of market power on bank risk—Cross-country evidence. Review of Finance 19: 1997–2038. [Google Scholar] [CrossRef]
  23. Freixas, Xavier, and Jean-Charles Rochet. 2008. Microeconomics of Banking. Cambridge: MIT Press. [Google Scholar]
  24. Friedman, Milton, and Anna Jacobson Schwartz. 1963. A Monetary History of the United States, 1867-1960. Princeton: National Bureau of Economic Research and Princeton University Press. [Google Scholar]
  25. Fu, Xiaoqing Maggie, Yongjia Rebecca Lin, and Philip Molyneux. 2014. Bank competition and financial stability in Asia Pacific. Journal of Banking & Finance 38: 64–77. [Google Scholar]
  26. Fungáčová, Zuzana, and Laurent Weill. 2013. Does competition influence bank failures? Economics of Transition 21: 301–22. [Google Scholar] [CrossRef]
  27. Gangopadhyay, Partha, and Siddharth Jain. 2019. Understanding subnational conflicts in Myanmar. IGDR. [Google Scholar] [CrossRef]
  28. Gangopadhyay, Partha, and Rahul Nilakantan. 2018. Estimating the effects of climate shocks on collective violence: ARDL evidence from India. The Journal of Development Studies 54: 441–56. [Google Scholar] [CrossRef]
  29. Gerschenkron, Alexander. 1962. Economic Backwardness in Historical Perspective: A Book of Essays. Cambridge: The Belknap Press of Harvard University Press. [Google Scholar]
  30. Herzer, Dierk, and Holger Strulik. 2017. Religiosity and income: A panel cointegration and causality analysis. Applied Economics 49: 2922–38. [Google Scholar] [CrossRef] [Green Version]
  31. Humphrey, David B., and Lawrence B. Pulley. 1997. Banks’ Responses to Deregulation: Profits, Technology, and Efficiency. Journal of Money, Credit and Banking 29: 73–93. [Google Scholar] [CrossRef]
  32. Ijtsma, Pieter, Laura Spierdijk, and Sherrill Shaffer. 2017. The concentration–stability controversy in banking: New evidence from the EU-25. Journal of Financial Stability 33: 273–84. [Google Scholar] [CrossRef]
  33. Jarque, Carlos, and Anil Kumar. Bera. 1980. Efficient Tests for Normality, Homoscedasticity and Serial Independence of Regression Residuals. Economics Letters 6: 255–59. [Google Scholar] [CrossRef]
  34. Jeon, Jin Q., and Kwang Kyu Lim. 2013. Bank competition and financial stability: A comparison of commercial banks and mutual savings banks in Korea. Pacific-Basin Finance Journal 25: 253–72. [Google Scholar] [CrossRef]
  35. Jeon, Bang Nam, María Pía Olivero, and Ji Wu. 2011. Do foreign banks increase competition? Evidence from emerging Asian and Latin American banking markets. Journal of banking & Finance 35: 856–75. [Google Scholar]
  36. Jiang, Liangliang, Ross Levine, and Chen Lin. 2016. Competition and Bank Opacity. Review of Financial Studies 29: 1911–42. [Google Scholar] [CrossRef]
  37. Jiang, Liangliang, Ross Levine, and Chen Lin. 2018. Does Competition Affect Bank Risk? NBER Working Paper No. 23080. Cambridge: NBER. [Google Scholar]
  38. Jiang, Liangliang, Ross Levine, and Chen Lin. 2019. Competition and Bank Liquidity Creation. Journal of Financial and Quantitative Analysis 54: 513–38. [Google Scholar] [CrossRef] [Green Version]
  39. Jiménez, Gabriel, Jose A. Lopez, and Jesús Saurina. 2013. How does competition affect bank risk-taking? Journal of Financial Stability 9: 185–95. [Google Scholar] [CrossRef]
  40. Kasman, Saadet, and Adnan Kasman. 2015. Bank Competition, Concentration and Financial Stability in the Turkish Banking Industry. Economic Systems 39: 502–17. [Google Scholar] [CrossRef]
  41. Kay, John. 1995. Foundation of Corporate Success: How Business Strategies Add Value. Oxford: Oxford University Press. [Google Scholar]
  42. Kick, Thomas, and Esteban Prieto. 2015. Bank Risk and Competition: Evidence from Regional Banking Markets. Review of Finance 19: 1185–222. [Google Scholar] [CrossRef]
  43. Kouki, Imen, and Amjad Al-Nasser. 2017. The Implication of Banking Competition: Evidence from African Countries. Research in International Business and Finance 39: 878–95. [Google Scholar] [CrossRef]
  44. Lapteacru, Ion. 2014. Do More Competitive Banks have Less Market Power? The Evidence from Central and Eastern Europe. Journal of International Money and Finance 46: 41–60. [Google Scholar] [CrossRef]
  45. Leroy, Aurélien, and Yannick Lucotte. 2017. Is There a Competition-Stability Trade-off in European Banking? Journal of International Financial Markets, Institutions and Money 46: 199–215. [Google Scholar] [CrossRef]
  46. Levin, Richard, Alvin Klevorick, Richard Nelson, and Sidney Winter. 1987. Appropriating the Returns from Industrial Research and Development. Brookings Papers on Economic Activity 1987: 783–831. [Google Scholar] [CrossRef] [Green Version]
  47. Misman, Faridah Najuna, and M Ishaq Bhatti. 2020. The Determinants of Credit Risk: An Evidence from ASEAN and GCC Islamic Banks. Journal of Risk and Financial Management 13: 89. [Google Scholar] [CrossRef]
  48. Molyneux, Philip, Yener Altunbas, and E. P. M. Gardener. 1996. Efficiency in European Banking. Chichester: John Wiley & Sons Ltd. [Google Scholar]
  49. Ng, Serena, and Pierre Perron. 2001. Lag Length Selection and the Construction of Unit Root Tests with Good Size and Power. Econometrica 69: 1519–54. [Google Scholar] [CrossRef] [Green Version]
  50. Oliner, Stephen D., and Daniel E. Sichel. 2000. The Resurgence of Growth in the Late 1990s: Is Information Technology the Story? Journal of Economic Perspectives 14: 3–22. [Google Scholar] [CrossRef] [Green Version]
  51. Pesaran, M. Hashem, Yongcheol Shin, and Richard J. Smith. 2001. Bounds testing approaches to the analysis of level relationships. Journal of Applied Econometrics 16: 289–326. [Google Scholar] [CrossRef]
  52. Polius, Tracy, and Wendell Samuel. 2000. Banking Efficiency in the Eastern Caribbean Currency Union: An Examination of the Structure-Conduct-Performance Parading and the Efficiency Hypothesis. Money Affairs 15: 75–92. [Google Scholar]
  53. Shaked, Avner, and John Sutton. 1983. Natural Oligopolies. Econometrica 51: 1469–84. [Google Scholar] [CrossRef]
  54. Shaked, Avner, and John Sutton. 1987. Product Differentiation and Industrial Structure. The Journal of Industrial Economics 36: 131–46. [Google Scholar]
  55. Soedarmono, Wahyoe, Fouad Machrouh, and Amine Tarazi. 2013. Bank Competition, Crisis and Risk Taking: Evidence from Emerging Markets in Asia. Journal of International Financial Markets, Institutions and Money 23: 196–221. [Google Scholar] [CrossRef] [Green Version]
  56. Sutton, John. 1991. Sunk Costs and Market Structure. Cambridge: MIT Press. [Google Scholar]
  57. Sutton, John. 1997a. Game Theoretic Models of Market Structure. In Advances in Economics and Econometrics, Proceedings of the World Congress of the Econometric Society, Tokyo 1995. Edited by David Kreps and Kenneth Wallis. Cambridge: Cambridge University Press, pp. 66–86. [Google Scholar]
  58. Sutton, John. 1997b. Gibrat’s Legacy. Journal of Economics Literature 35: 40–59. [Google Scholar]
  59. Sutton, John. 1998. Technology and Market Structure. Cambridge: MIT Press. [Google Scholar]
  60. Sutton, John. 2001a. Rich Trades, Scarce Capabilities: Industrial Development Revisited, (Keynes Lecture 2000). In Proceedings of the British Academy, vol. III (2000 Lectures and Memoirs). Oxford: Oxford University Press, pp. 245–73, Reprinted in Economic and Social Review 2002: 33: 1–22. [Google Scholar]
  61. Sutton, John. 2001b. The Variance of Firm Growth Rates: The Scaling Puzzle. Physica A 312: 577–90. [Google Scholar] [CrossRef] [Green Version]
  62. Sutton, John. 2007. Market Structure: Theory and Evidence. In Handbook of Industrial Organization. Cambridge: Elsevier, vol. 3, Chapter 35. pp. 2301–68. [Google Scholar]
  63. Tabak, Benjamin M., Dimas M. Fazio, and Daniel O. Cajueiro. 2012. The relationship between banking market competition and risk-taking: Do size and capitalization matter? Journal of Banking & Finance 36: 3366–81. [Google Scholar]
  64. Tabak, Benjamin M., Dimas M. Fazio, and Daniel O. Cajueiro. 2013. Systemically important banks and financial stability: The case of Latin America. Journal of Banking & Finance 37: 3855–66. [Google Scholar]
  65. Tabak, Benjamin M., Guilherme M. R. Gomes, and Maurício da Silva Medeiros Jr. 2015. The impact of market power at bank level in risk-taking: The Brazilian case. International Review of Financial Analysis 40: 154–65. [Google Scholar] [CrossRef]
  66. Tarullo, Daniel. 2012. Financial stability regulation. Paper presented at Distinguished Jurist Lecture, University of Pennsylvania Law School, Philadelphia, PA, USA, October 10. [Google Scholar]
  67. Teece, David J. 2000. Managing Intellectual Capital. Oxford: Oxford University Press. [Google Scholar]
  68. Thadewald, Thorsten, and Herbert Büning. 2007. Jarque–Bera test and its competitors for testing normality—A power comparison. Journal of Applied Statistics 34: 87–105. [Google Scholar] [CrossRef]
  69. The Economist. 2009. Deliver us from Competition. Economic Focus, June 25. [Google Scholar]
  70. Turner, John D. 2014a. Financial history and financial economics. In The Oxford Handbook of Banking and Financial History. Oxford: Oxford University Press. [Google Scholar]
  71. Turner, John D. 2014b. Banking in Crisis: The Rise and Fall of British Banking Stability, 1800 to the Present. Cambridge: Cambridge University Press. [Google Scholar]
  72. Vives, Xavier. 2010. Competition and stability in banking. Economia Chilena 13: 85–112. [Google Scholar] [CrossRef] [Green Version]
1
At the outset, the selection of the country and its industry begs the question of whether it is justified to consider Jordon’s Islamic banking industry for a detailed analysis like this. In the Middle East, Jordon’s banking industry has consistently posted an excellent record since the early 1990s, as policy makers launched a series of banking liberalization measures to fight financial repression in Jordan. Such measures were meant to intensify competition among banks for delivering efficiency gains. As a result, the banking sector became one of the largest economic sectors in Jordon; by 2019, the banking industry contributed 18.8% of Jordon’s GDP. As another indicator of its relevance, in 2017, the total assets of Jordon’s banks stood at 114% of its GDP, while the global average stood at 64%. Despite mounting economic challenges in the region, Jordon’s banks have maintained excellent profit figures with adequate stocks of liquid assets and healthy capital adequacy ratios (17.2% in 2019). The banking sector has enforced a strong compliance system to contain the NPL ratio under 6%. Hence, Jordon fulfils all Basel III requirements. Jordon thus stands out as a prime example of how competition can promote efficiency in banking without risking financial instability. Additionally, in Section 2, we will also highlight that the Islamic banks have become a major player in Jordon. There are two important sources of growth in Islamic banking in Jordon. First, investors came to hold a shared perception that Islamic banks adopt more responsible business practices (see Alam and Seifzadeh 2020). Second, it is widely held that Islamic banks’ better financing quality lowers their credit risks (see Misman and Bhatti 2020). We hence choose Jordon as a prime example of successful banking reforms, with the strong presence of Islamic banks, for understanding if endogenous sunk-cost investments can propel efficiencies, which will, in turn, create stability for Islamic banking.
2
It is also important to highlight that Islamic banks also undertake an important function of dispute resolution (besides the Sharia-approved banking activities), as highlighted by Bhatti (2020a).
3
The other type of sunk-cost investment is comprised of a firm’s expenses to grab market shares from its rivals, like advertisement, without any impact on its relative efficiency.
4
At the textbook level, appropriability is defined by Kay (1995) as the capacity of a business entity to capture the value added—through its rivalry with its competitors in the market—that it creates for its own profits. The value added is created and captured either by innovating better products or better processes than their rivals. The appropriability critically depends on the structure of the market in which it operates (see Cohen et al. 2000).
5
There will be little effects on their profits if a bank improves its product quality or technology of production, which is easily imitable or reproducible by others. The appropriability regime is defined as weak. On the other hand, some quality improvements involve sticky knowledge, which are intimately ingrained in a particular organization, so that they cannot be easily imitated and replanted elsewhere in a meaningful way. The market/system has strong appropriability (see Teece 2000).
Table 1. List of nine banks chosen for the study.
1. Arab Bank2. Arab Egyptian Bank3. Cairo Amman Bank
4. Housing Bank5. Jordan Bank6. Jordon Commercial Bank
7. Jordon Islamic Bank8. Jordan 9. Kuwait Bank
Source: Constructed by authors.
Table 2. Choice and labelling of variables.
Yn: Vector of Output (Y1: Loans, Y2: Investment, Y3: Other Earning Assets)
Pn: Prices of Output
Xm: Vector of Inputs (X1: Labour input, X2: Capital Input, X3: Financial Capital Input)
Pm: Price of Inputs (PL: Price of Labour (Wage)
PK: Price of Capital, PF: Price of Financial Capital)
Cit: Cost of production of bank i at date t
ITK: IT Budget Allocated to Acquiring only IT Capital (in $)
Πit: Profit of Bank i at date t
ηit: Measures inefficiency in terms of profits/costs
CES: Cost Efficiency Scores
PES: Profit Efficiency Scores
Source: Constructed by authors.
Table 3. Summary statistics of variables of interest.
Variable MeanStd. Dev.MinMaxObservations
CESoverall0.8000.0960.6001.000N = 162
between 0.0830.7260.983n = 9
within 0.0560.6591.009T = 18
PESoverall0.8600.0910.5401.000N = 162
between 0.0280.8250.910n = 9
within 0.0870.5391.023T = 18
ITK(Million)overall7.30710.7820.53065.118N = 162
between 9.5182.13732.335n = 9
within 5.934−20.17040.090T = 18
Source: constructed by the authors.
Table 4. Unit root statistics for variables of interest.
Bank NameVariablesADF (AIC)PP
Level1st DifferenceLevel1st Difference
InterceptIntercept & TrendInterceptIntercept & TrendInterceptIntercept & TrendInterceptIntercept & Trend
Arab BankCES−3.53 **−3.46 *−3.17 ***−3.03−3.57 **−3.54 *−9.94 ***−10.11 ***
PES−3.42 **−3.49 *−3.81 **−3.68 *−2.44−2.35−4.53 ***−4.82 ***
ITK−2.180.16−0.88−1.64−4.41 ***−4.91 ***−5.36 ***−5.03 ***
Arab Egyptian BankCES−1.79−1.63−3.70 **−3.61 *−1.86−1.76−3.70 **−3.61 *
PES−1.65−5.62 ***−3.99 **−3.87 **−3.58 **−5.64 ***−7.47 ***−7.34 ***
ITK−3.92 ***−1.27−9.54 ***−8.53 ***−3.39 **−5.87 ***−9.54 ***−8.28 ***
Cairo Amman BankCES−1.35−1.933.11 **−4.65 **−1.32−2.25−4.62 ***−4.91 ***
PES−3.82 **−3.46 **−5.32 ***−5.13 ***−2.77 *−2.80−5.32 ***−5.13 ***
ITK−1.58−2.15−1.84−1.91−2.31−2.68−3.75 **−3.57 *
Housing BankCES−1.64−1.90−1.96−2.09−1.43−0.88−2.02−2.09
PES−2.73 *−3.62 *−5.67 ***−4.06 **−2.69 *−3.58 *−10.80 ***−12.87 ***
ITK−0.22−2.81−4.56 ***−4.34 **−1.66−2.70−4.28 ***−4.17 **
Jordan BankCES−1.55−2.12−4.28 ***−6.86 ***−2.19−2.22−5.50 ***−5.24 ***
PES−1.96−1.86−4.60 ***−4.77 ***−1.88−1.89−4.74 ***−5.19 ***
ITK−2.62−4.17 **−1.60−1.05−3.40 **−8.54 ***−7.01 ***−7.26 ***
Jordan Commercial BankCES−2.80 *−3.17−3.16 **−3.05−1.88−1.83−3.18 **−3.08
PES−4.09 ***−3.98 **−5.53 ***−5.29 ***−4.19 ***−4.05 **−11.73 ***−11.62 ***
ITK−2.11−0.35−2.26−2.81−4.37 ***−4.15 **−6.48 ***−6.22 ***
Jordan Islamic BankCES−2.91 *−2.97−3.56 **−3.63 *−1.97−1.97−2.48−2.44
PES−3.57 **−4.53 **−5.10 ***−5.09 ***−3.62 **−4.52 **−16.58 ***−18.96 ***
ITK−3.99 ***−1.38−9.37 ***−8.38 ***−3.46 **−5.97 ***−9.37−8.22
Jordan Kuwait BankCES−4.09 ***−4.05 **−4.67 ***−3.55 *−4.14 ***−4.07 **−14.14 ***−15.78 ***
PES−3.45 **−3.15−6.35 ***−6.13 ***−3.45 **−3.35 *−6.35 ***−6.13 ***
ITK−1.67−1.83−2.51−2.42−3.18 **−3.17−4.73 ***−4.21 **
Union BankCES−4.50 ***−4.43 **−6.15 ***−6.07 ***−3.38 **−3.27−6.19 ***−6.15 ***
PES−5.09 ***−5.46 ***−6.00 ***−5.75 ***−5.09 ***−5.50 ***−18.74 ***−18.04 ***
ITK−1.38−1.67−2.02−1.71−1.91−2.75−3.34 **−3.22
Note: *, **, *** represents 10%, 5% and 1% levels of significance respectively. Source: constructed by the authors.
Table 5. Order of integration of variables of interest.
BanksVariablesOrder of Integration
Arab BankCESI(0)
PESI(1)
ITKI(1)
Arab Egyptian BankCESI(1)
PESI(0)
ITKI(0)
Cairo Amman BankCESI(1)
PESI(0)
ITKI(1)
Housing BankCESI(2) *
PESI(1)
ITKI(1)
Jordan BankCESI(1)
PESI(1)
ITKI(1)
Jordan Commercial BankCESI(1)
PESI(0)
ITKI(1)
Jordan Islamic BankCESI(1)
PESI(0)
ITKI(0)
Jordan Kuwait BankCESI(0)
PESI(0)
ITKI(1)
Union BankCESI(0)
PESI(0)
ITKI(1)
Source: constructed by the authors; Note: * The CES figures for Housing Bank are I(2) for some unit root tests, hence the ARDL results using CES data are not suitable only for Housing Bank.
Table 6. Estimates of autoregressive distributed lag (ARDL) and error correction model (ECM) models for cost efficiency scores (CES).
ABAEBCABHBJBJCBJIBJKBUB
Adjustment
CESL1−1.90 **−1.04 **0.912.21−2.40 **−0.50−0.79 ***−1.23 ***−1.67
LONG-RUN
lnITK−0.020.07−0.390.60 **−0.200.060.24 ***0.02−0.06
SHORT-RUN
ΔCESLD0.84−0.56−1.25−3.841.17 *0.380.19
ΔCESL2D0.53−0.20−1.23−5.500.490.54
ΔCESL3D−0.17−1.27−5.46−0.600.45
ΔlnITKD10.150.28−0.432.900.90 *−0.220.72 ***0.33
ΔlnITKLD−0.060.75−0.514.770.230.310.11
ΔlnITKL2D0.38 **0.36 **−0.254.160.14−0.60 *0.17
ΔlnITKL3D−0.080.07−0.09−0.200.180.17−0.11
CONSTANT2.42 **−0.42 **−5.9517.362.36 *−0.08−2.16 **0.712.86
Adj R squared0.730.960.010.640.390.890.800.530.94
F statistic for no cointegration8.525.820.683.834.8511.0916.427.266.99
CointegrationYes **Yes **NoNoYes *Yes ***Yes ***Yes **Yes **
Note: *, **, *** represents 10%, 5% and 1% levels of significance respectively. The table provides the estimates of the coefficients of the ARDL regressions. Source: constructed by the authors.
Table 7. Estimates of ARDL and ECM models for profit efficiency score (PES).
ABAEBCABHBJBJCBJIBJKBUB
Adjustment
PESL19.681−1.067−1.577 ***−2.929 **2.143−1.09 ***−2.127 ***−2.493 ***−1.425 ***
LONG-RUN
lnITK0.442 ***0.2880.0153−0.020.381 **0.0950.0090.035 *0.262 **
SHORT-RUN
ΔPESLD−10.389−0.6990.4481.175 *−2.2710.4121.607 **
ΔPESL2D−6.806−0.7460.5540.802−1.7171.319 **
ΔPESL3D4.927 **−0.3080.519 *−0.5250.634 **
ΔlnITKD135.84 *−1.214 **−0.853 *1.2990.276 **−0.998 **
ΔlnITKLD5.549−0.642−1.312−0.124−0.423
ΔlnITKL2D−0.6230.5052.2360.419 ***−0.791 **
ΔlnITKL3D−4.516 *0.295 *−0.479 *
CONSTANT62.569 *−3.5960.9073.479 *10.76−0.5781.3950.931−4.183 **
Adj R squared0.8860.9540.5750.5820.7410.4420.7510.9120.798
F statistic for no cointegration31.57621.5127.6945.7917.725.3499.46927.30320.569
CointegrationYes ***Yes ***Yes **Yes **Yes **Yes *Yes ***Yes ***Yes ***
Note: *, **, *** represents 10%, 5% and 1% levels of significance respectively. The table provides the estimates of the coefficients of the ARDL regressions. Source: Constructed by the authors.