Abstract
This paper investigates the decoupling and integration between the region-wise (Asia, Europe, Africa and the Americas) developed and emerging market’s equity pairs of Islamic and conventional stock returns with the focus on multi-horizons. In doing so, daily wavelet and ADCC-based stock returns correlations are estimated to capture the dynamics of time-frequency and the time-domain based correlations, respectively. The findings of this study indicate that at the short-term horizon, the all selected emerging and developed Islamic and conventional equity markets across all regions depict a high positive correlation, suggesting a rejection of the decoupling hypothesis. However, it is accepted for some of the developed markets of the Pacific region (Hong Kong and New Zealand), Europe (Ireland, Denmark and Spain) and emerging markets of Asia (China), Europe (Czech Republic) and Americas (Argentina and Peru) at a medium-term horizon. Moreover, in an examination of the comparative behaviors of the wavelet and ADCC-based Islamic-conventional correlations, the observed transitional behavior has been exemplified as the difference between the time-frequency and time-domain analysis. This study provides fruitful insights for investors who opt for cross-asset allocation and seek maximum portfolio diversification benefits.
1. Introduction
The recent global financial crisis led to significant losses due to a slowdown in the economy but also prompted a debate between several influential research scholars, such as Robert Shiller who could not resist criticizing the conventional financial systems. In this respect, Kroszner and Shiller (2011) invited regulators and policymakers to bring about improvements in the U.S. financial system and enrich its robustness with the acknowledgment of the human and democratic factors in finance. This debate has opened the floor for the alternative forms of finance that entail more reasonable risks than traditional conventional finance. Meanwhile, Islamic finance is considered to serve as an alternative that better implements the UN’s sustainable goals to create an impartial financing system and affect society positively (Ahmed et al. 2015; Paltrinieri et al. 2020). The Islamic finance industry has experienced tremendous growth over the last decade (Shahzad et al. 2017). This growth keeps continuing with the development of the core Islamic financial markets, the wider consensus on the necessity of the standardized legal structures and the Shariah interpretation (Ahmed 2019). Particularly, in the year 2018, Islamic assets grew to reach $2.19 trillion (gross value) with an overall growth rate of 6.9%. Among them, the Islamic capital markets demonstrated higher growth by 27%, whereas the Islamic banking sector shrank by 4% (IFSISR 2019). The developments in Islamic and conventional banking sectors and the associated risks are already highlighted by several studies1. Therefore, the focus of this paper is limited to these fast-growing capital markets (i.e., equity markets).
The theoretical studies claim that the Islamic financial system is superior to the conventional financial system due to its participatory mode of financing or pure equity financing (El-Karanshawy et al. 2015). Moreover, the Islamic equity markets move or co-move in dissimilar directions to their conventional counterparts (Walid Mensi et al. 2015; Masih et al. 2018). As a consequence, soon after the Global Financial Crisis of 2007 (GFC hereafter), the fast-growing literature has started to primarily assess the performance of the Islamic and conventional stock market indices (Ibrahim 2015). Subsequently, the higher focus turned towards the identification of diversification opportunities between the two markets. In doing so, the performance of the Islamic stocks with their conventional counterparts is being justified with the help of Markowitz Portfolio Theory (MPT) (Markowitz 1952). The theory that argues an optimal portfolio can be achieved by maximizing the utility function of investors, which can ultimately be realized through diversification. Since the investors show concern towards the risk-return profile of their portfolio, therefore, rather than only focusing on the Muslim investor’s perspective, the non-Muslim investor’s perspective is also kept under consideration. Similarly, global investors also focused on Islamic stock markets due to their resilient nature to crises and better-positioned markets that may have resulted due to their unique features i.e., ratio screening, ethical investing, low tolerance towards interest-based leverage and restricting intensively structured based financial products such as derivatives (Saiti et al. 2014).
The researchers have addressed the performance-related issues and came up with mixed results based on both Muslim and non-Muslim investors’ perspectives2. However, the conflicting views regarding the decoupling and recoupling of Islamic stocks with their conventional counterparts emphasize the need to scrutinize whether the former provides higher and the latter provides lower diversification benefits or not. Keeping in view the most commonly raised criticism that Islamic stocks are considered as providers of low diversification benefits, several researchers came up with mixed results. For instance, scholars suggested that Islamic stocks are either decoupled based on the characteristics they possess (Rizvi and Arshad 2014; Majdoub and Mansour 2014; Mensi et al. 2015; Kenourgios et al. 2016) or recoupled based on their similarity or by being a part of the conventional stocks (Masih et al. 2018; Hammoudeh et al. 2014; Dewandaru et al. 2014; Ajmi et al. 2014; Yilmaz et al. 2015; Dewandaru et al. 2016; Grinsted et al. 2004; Majdoub et al. 2016; Aloui et al. 2016; Mensi et al. 2017) in providing higher and lower diversification benefits, respectively. Similarly, another view or criticism that is linked to the issue of the decoupling or recoupling of Islamic and conventional stocks is of greater importance when it comes to the behavior of the Islamic stocks in response to turbulent periods. For instance, based on the characteristics of Islamic stocks, these Islamic stocks are said to be less volatile, less risky and safe-haven stocks. But controversies do exist when it comes to the recoupling hypothesis indicating that Islamic and conventional stocks behave in the same way during crisis periods and indicate the contagion effect (Rizvi and Arshad 2014; Kenourgios et al. 2016; Mensi et al. 2017; Nazlioglu et al. 2015; Ftiti et al. 2015; el Alaoui et al. 2015). However, some of the recent studies such as Ho et al., Narayan and Bannigidadmath (Ho and Odhiambo 2014; Narayan and Bannigidadmath 2017) argue that during the global financial crisis, the Islamic stocks were found to be more profitable than the conventional stocks. Thus, the Islamic stocks were found to be decoupled from their conventional counterparts due to their safe-haven/hedge ability (Mensi et al. 2015; Hkiri et al. 2017; Azad et al. 2018). This suggests that investors could diversify their risks by investing in Islamic stocks, particularly during financial and economic downturns. However, the literature provides inconclusive results regarding the decoupling or safe-haven and the integration or contagion effects between Islamic and conventional stock markets. Thus, the above-discussed reasons are the major source of motivation for this study to sort out the challenges and controversies related to the Islamic-conventional equity market’s link.
Recently, the assessment of the Islamic-conventional equity market’s link has grown to become a well-defined focus (Narayan and Phan 2017). The existing empirical studies have concentrated highly on the aggregate-level (global and regional indices) Islamic-conventional nexus, whereas few studies with a limited focus are found on the disaggregate-level (country-level) analysis. For instance, Ajmi et al. (2014) have employed only two regions, and one developed market, Naseri and Masih (2014) employed only two developed and two emerging economies’ Islamic stock indices, Majdoub and Mansour (2014) employed five emerging markets and one developed market, Shahzad et al. (2017) employed three developed markets, Hkiri et al. (2017) employed the world at large, two regions and four developed countries, Uddin et al. (2018) employed a set of two developed and a few emerging markets, Ahmed and Elsayed (2019) employed only one emerging market and Usman et al. (2019) employed three developed and two emerging markets. Therefore, this study differentiates its data sample from the above highlighted recent studies by including the maximum number of developed and emerging countries from the Asia Pacific, Europe, Africa and Americas regions. The purpose is to provide more generalized and comprehensive results regarding each advanced and emerging country’s Islamic and conventional equity markets correlation. In doing so, unlike prior research in this field, this study has identified several developed (Hong Kong, New Zealand, Ireland, Denmark and Spain) and emerging (China, Czech Republic, Argentina and Peru) countries whose Islamic equity markets are decoupled from their conventional counterparts and those provide diversification benefits during crisis and non-crisis periods. Therefore, based on these results of this study, the importance of our extended sample can be highlighted, as none of the past studies have investigated this phenomenon for these markets (except for China) and identified these new markets as the providers of the diversification benefits.
Similarly, to draw a comparative view of the two equity markets, the focus of the financial econometrics is turned towards modeling the volatility and correlations of the alternative assets3. In doing so, recent studies have applied different approaches to consider either the correlation or volatility factor for examining the association or the decoupling hypothesis between Islamic and conventional equity markets. For instance, focusing on the correlation factor, Uddin et al. (2018) applied the wavelet squared coherence, and for the case of volatility factor, Ahmed and Elsayed (2019) applied the forecast error variance decompositions method to examine the decoupling hypothesis. Unlike the methods employed in the two aforementioned studies, this paper differentiates itself by focusing on the correlation as well as the volatility factors by applying the wavelet and the ADCC-GARCH based approaches, respectively.
Therefore, the threefold contribution of this paper is summarized as follows; first, this paper aims to be the first of its nature that attempts to generalize the results regarding the dynamics of decoupling or recoupling hypotheses and the safe-haven or contagion effect between the Islamic and the conventional stock markets. However, in perusing this issue of weakly positive (decoupling) or strongly positive (recoupling) dependence of Islamic and conventional stocks, this paper explores the Islamic-conventional stock returns dependence based on the time-frequency (wavelet) and the time-domain (ADCC-GARCH) based correlations. Second, to examine the features of the Islamic-conventional stock return correlations in the form of evolving correlations and common trends, this paper compares the patterns of differing multi-horizons (short, medium and long-term) wavelet-based stock return correlations with the asymmetric dynamic conditional stock returns correlations. Finally, this paper contributes to this field of knowledge by investigating the Islamic-conventional stock returns correlation (either decoupling or integration) in both crisis and non-crisis periods.
2. Data and Methodology
This section designates the stock indices data for Islamic and conventional equity markets, and the wavelet and ADCC-GARCH approaches to test the decoupling and integration between the pairs of these two equity markets.
2.1. Data
This study employs daily stocks data to estimate the wavelet and ADCC-based correlations that contain richer information than other frequency (monthly, quarterly or weekly) data4. Moreover, it gives us enough observations that help in avoiding the inefficiency that may arise during the time-varying estimations procedure. For the matched pair comparison, this study restricts the study period to be the same for both Islamic and conventional equity indices that cover 1 June 2007 to 31 December 2018. This duration encompasses several episodes of wide instabilities and crises (e.g., the recent global financial crisis—a period characterized by high volatility, and the European sovereign debt crisis and plunges in oil prices in 2014) and the gradual recovery of global stock markets, etc.
However, the sample of this study comprises of the forty-one countries’ Islamic and conventional equity indices pairs that cover a large geographical area encompassing several developed and emerging markets. By following MSCI ACWI classification of the markets, 21 developed markets (5 markets from the Pacific, 14 from Europe and 2 from the Americas regions) and 20 emerging markets from four regions (9 from Asia, 5 from Europe, 1 from Africa and 5 from the Americas region) were employed. However, the Middle East region was excluded from this study’s data sample to avoid the bias that may result due to the dominance of Muslim investors as well as the higher development of the Islamic financial industry in this region, as compared to other regions where the Islamic finance industry is still in the development process. Several studies such as Shahzad et al. (2017), Kenourgios et al. (2016) have employed Dow Jones stock indices but we preferred to employ MSCI stock indices. The preference for MSCI indices data is due to the non-availability of Dow Jones indices data for some of the selected countries. The data for all the Islamic and conventional stock indices were extracted from DataStream and all the indices were selected in their local currencies. The lists of region-wise Islamic and conventional stock indices are presented in Table 1, Table 2, Table 3 and Table 4.

Table 1.
The Asian Region’s Islamic and Conventional Stock Indices.
Table 2.
European Region’s Islamic and Conventional Stock Indices.
Table 3.
The Africa Region’s Islamic and Conventional Stock Indices.
Table 4.
The Americas Region’s Islamic and Conventional Stock Indices.
2.2. Wavelet Coherence
The wavelet approach is a strong mathematical tool that was developed for signal processing in the mid-1980s. The wavelet is a minor wave that raises and drops in a limited period. Unlike the traditional linear tools such as the Pearson correlation, a wavelet transform is a non-linear tool that provides higher insights regarding the underlying structures and the dynamics of the resulting correlations. Moreover, unlike the economic time-series models, those tools solely focus on the time-varying structure of the correlations over the time-domains by covering the information at a pre-determined frequency, while the wavelet transform is considered as a time-frequency based approach that combines both time and frequency-based information. Similarly, unlike the Fourier transforms that cannot adjust the size of the window and deal with non-stationary signals, the wavelet transform is considered suitable for relating the behavior of non-stationary signals and adjusting the size of the window to longer basis functions at low frequencies and shorter basis functions at high frequencies. Therefore, the wavelet is the best and suitable approach that facilitates testing the decoupling hypothesis or integration between the Islamic and conventional equity market returns.
The wavelet approach considers the investor’s heterogeneity across short-, medium- and long-term horizons5 and provides a simple way to study the connections among time series based on the scale by scale. In the wavelet approach, the wavelet transform has two forms: one is the continuous transform and second is the discrete wavelet transform (CWT and DWT). The continuous wavelet transform functions over each possible time position and scale, whereas the other transform employs a limited amount of discrete location and scale values. For a long time, the DWT was considered as the dominant transform in both fields of economics and finance (Ramsey and Lampart 1998; Gençay et al. 2002), due to its supplementary parsimonious nature that requires fewer resources to allocate and a minimal time to compute. However, recently the CWT has received more attention from economists (Gallegati and Ramsey 2013; Aguiar-Conraria and Soares 2014) due to its main benefit of providing a more visually spontaneous output. Thus, its generated results are much easier to interpret than those of the DWT.
Similarly, the wavelet transform facilitates analyzing the variations of power in time-frequency domains. Based on that, the wavelet transform coherence (WTC) and the cross-wavelet analysis (XWT) are the two wavelet analyses that can estimate the level of coherence for the two series (Grinsted et al. 2004). However, there are some remarkable differences based on which we preferred to apply the wavelet coherence. For instance, the XWT is the initial measure of the relation between the two-time series that exhibits common power and the relative phase in time-frequency domains. It is the phenomenon of the simple cause and effect relationship between the two series in which the oscillations are expected to be phase-locked. On the other hand, the WTC analysis can be applied to estimate the relation between the periodicities of two distinct series. It is considered as the local correlation between the two series that uncovers the locked phase behavior. It introduces a smoothing-pattern that localizes the all probable common powers and the relative phase of the two series in time-frequency domains. Thus, as compared to XWT, wavelet coherence is the approach that was most ideal for investigating the objective of this paper, as it can uncover the locked phase and can determine the significant coherence even if the common power is low. However, the significance level of the WTC is estimated using the Monte Carlo methods.
The wavelet transform relies upon the two distinct functions: the father and the mother wavelet . A family of the daughter wavelets based on the mother wavelet is engendered by scaling and translating
where and are the location and scale parameters that identify the exact time position and the dilation of the wavelet.
By considering the CWT, a time series concerning to mother wavelet is provided by the convolution below;
where is referred to as a complex conjugation. Similarly, the commonly used form of continuous wavelet is the Morlet Wavelet, that is given by;
where the is the wavelet’s central frequency that is set to 6 by following past studies. This helps to create a better balance between the time and frequency localization.
Given the is the wavelet transform of series and is the wavelet transform of series , the cross wavelet spectrum is defined as;
Within CWT framework, (Rua and Nunes 2009) suggested a wavelet-based measure that can assess the degree of co-movement among the two series based on time and frequency domains. This measure, known as the wavelet correlation, is denoted as and given by;
The wavelet correlation can be considered as a correlation coefficient about each time and frequency. This coefficient is like the classical linear coefficient among the two series based on the time domain. Like the traditional correlation coefficient, this wavelet correlation ranges between −1 and 1. It furnishes information related to the co-movement between the two-time series at both the frequency level and the time within the integrated framework. Thus, one can easily categorize the regions in time-frequency space by inspecting the contour plot of wavelet correlation and identify the significant correlation between the two series under scrutiny.
2.3. ADCC-GARCH Model
The Asymmetric Dynamic Conditional Correlation-GARCH model that was introduced by Cappiello et al. (2006) considers the asymmetric behaviors of the returns or volatility and uses them to examine the decoupling or integration phenomenon based on its given time-varying correlations. The purpose of applying this approach in this paper is to examine the properties or characteristics (i.e., evolving correlations, the common trend, etc.) of the Islamic-conventional stock return correlations. In doing so, we did not only rely on the series of asymmetric conditional correlations (extracted through ADCC approach) but we also incorporated the series of multi-horizon correlations. Therefore, the series of correlations extracted from the two different approaches (i.e., wavelet and ADCC) are drawn together to examine the characteristics of Islamic conventional correlations.
This ADCC approach is basically an extension of the DCCGARCH specification that was developed by Engle (2002) to study the time-varying correlations between two or more series. Its generalized extension was developed by Sheppard (2002) and was further extended by Cappiello et al. (2006) to develop the ADCC specification. The preference for the ADCC model was given due to the limitations that the DCC model faces such as: it allows the asymmetric responses in the variances but it does not cover the asymmetric dynamics in correlation (it assumes that all assets share the same new impact curve) between different assets; its estimation is restricted by the border dynamics or a specific model (model specificity); and it does not capture the non-linearity. Therefore, the main advantage of the ADCC model is that it can overcome the all limitations faced by the DCC model.
The ADCC specification is based on two components. One is the vector autoregressive (VAR) model that is used to model the stock market return and the other is multivariate GARCH model that is used to model the conditional variance. To best fit the VAR models, the stationarity tests were applied for rejecting the unit root of all the sample series. The importance of the VAR model can be highlighted with its generated residuals that are taken as an input for estimating the ADCC model. Therefore, the working of this model starts with the process that was designated by Engle (2009). In first step, the VAR model is fitted to the series (to model the stock indices return) and the residuals generated from the VAR model are standardized by dividing them by their respective GARCH conditional standard deviations. In the second step, these standardized residuals are further employed by the DCC model to estimate the dynamic conditional correlations.
The first step starts from the Maximum likelihood methods (MLE) that are employed to estimate the GARCH (p,q) model. It can be highlighted in the following equations;
where
- = the residual generated from one of the estimated VAR equations.
- = standardized residuals after removing the mean from VAR residuals.
- = the betas represent the persistence volatility.
- = the alphas represent the GARCH effect.
- = the log of volatility is demonstrated as the function of its own lagged values and the lagged standardized residuals.
Since GARCH (1,1) was used to standardize the residuals in this research, the VAR-based standardized residuals were further be standardized by dividing them by their corresponding standard deviations as follows;
Following the second step, the Generalized DCC model (Sheppard 2002) is given by
where a and b are scalars. Since this model does not account for the asymmetries nor the asset-specific news impact parameters, the A-DCC process that is an extension of the DCC model (Sheppard 2002), is then defined by
where and are the unconditional matrices of , and . is the indicator function that takes a value of 1 if the argument is true and 0 otherwise. In addition, “” indicates the Hadamard product and the . However, the A, B and G are diagonal parameter matrices.
where is characterized as the time-varying correlation between the time series employed in this study and that can be plotted alongside time.
For the ADCC model (Cappiello et al. 2006), the A, B and G matrices comprise of elements a, b and g, as follows;
However, the constraint is that , and parameter matrices must be positive, their total must be not more than one and all the time series must follow the dynamic process. Therefore, the main strength and the weakness of this model is depending on those three parameter matrices and to look for an optimum solution, these parameter matrices have to be estimated regardless of the variable counts.
Finally, the causes of the existence of high and low correlation were explained as the correlation between the two variables rises due to simultaneous dropping or increasing of the standard residuals from the two variables. But as the information will be wholly absorbed with time, that elevated level of correlation will gradually decrease back to its regular (mean) level. Contrarily, if the residuals move in dissimilar directions, that will result in a low correlation and over time that will also reverse back to its average level. However, the and parameters govern the speed of this process, whereas the parameter captures the asymmetric effect of the positive and negative returns on the correlation.
3. Empirical Results
This section reports the results generated from the wavelet and the ADCC-GARCH based approaches in the form of wavelet cross-correlations and Asymmetric dynamic conditional correlations of Islamic-conventional stock return correlations, respectively.
3.1. Wavelet Cross-Correlations
This section demonstrates the time-frequency based wavelet correlations presented in the form of contour plots to view the weak and the strong dependence between the Islamic and conventional equity market indices returns across all frequencies and over time. The wavelet contour plots that represent the wavelet correlations for all individual pairs of Islamic-conventional stock returns were obtained by applying the wavelet cross-correlation approach. The wavelet plot facilitates the visual examination of the cross-correlation between Islamic and conventional stock returns through its three dimensions i.e., the correlation value, frequency and time those are embodied on the contour plot’s right vertical (y-axis), left vertical (y-axis) and horizontal axis (x-axis), respectively.
For the easiness of the interpretation of wavelet results, these wavelet dimensions were elaborated as: the correlation value that ranges between −1 to 1 and displayed on the y-axis (right) are illustrated with a color scale where the dark blue color (at bottom of contour plot) indicates a negative correlation, dark yellow (at mid-point of the contour plot) indicates a weak positive correlation and the dark red (at top of contour plot) presents a high positive correlation. The frequency generally is in the ranges of 4–1024 days and is displayed on the y-axis is categorized as 4 days at top of the contour plot means the highest frequency scale, and 1024 days at the bottom of the contour plot means the lowest frequency scale. To make it easier to understand the frequency scale, this paper follows Uddin et al. (2018) and considers the frequency of 4–64 days (2-months) as the short-term, 64–256 days (1-year) as the medium-term and 256–1024 days (4-years) as the long-term horizon. Finally, the time horizon that ranges from 2007–2018 is displayed on the horizontal axis of the wavelet contour plot. Therefore, we can visually examine the weak (positive/negative) or strong (positive) link between Islamic and conventional equity market indices returns through wavelet correlation by spotting the significant regions as well as the colors with the help of both frequency bands and the time intervals. Moreover, the wavelet correlations for three different horizons (i.e., short-, medium- and long-term) can also be distinguished on the frequency scale. Thus, these contour plots may help to examine the strength of changing association or link between the Islamic-conventional equity nexus over the time domains and across frequency domains.
Before interpreting the wavelet contour plots, we summarized the wavelet-based results i.e., either decoupling or integration for all the sampled market’s Islamic and conventional stock returns in Table 5.
Table 5.
Summary of the Islamic and Conventional Stock Return Wavelet Correlations.
However, the wavelet plots for the integrated markets (see Figure A1, Figure A2, Figure A3 and Figure A4) are presented in the appendix section of this paper (see Appendix A, Appendix B, Appendix C and Appendix D). Meanwhile, the results of region-wise selected country’s Islamic-conventional stock return correlations for whom the decoupling hypothesis is fully or partially accepted are reported in the following sub-section (see Figure 1, Figure 2 and Figure 3).
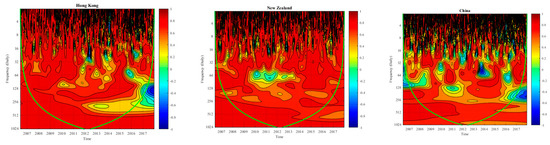
Figure 1.
Asia/Pacific region’s Islamic-conventional stock returns wavelet correlations.
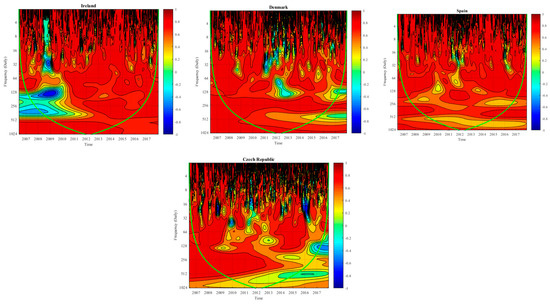
Figure 2.
The European region’s Islamic-conventional stock returns wavelet correlations.
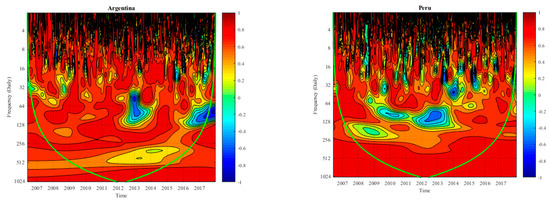
Figure 3.
The America region’s Islamic-conventional stock returns wavelet correlations.
3.1.1. Wavelet Cross Correlation for Asian/Pacific Markets
The Islamic-conventional stock returns wavelet correlations for developed and emerging markets of the Asian/Pacific region are displayed in the form of contour plots in Figure 1.
As evidenced by the dark red color in the plots of Figure 1, there is a strong positive correlation between the Asia Pacific region’s Islamic and conventional stock market returns that can be seen throughout the sample period and at the short-term horizon, whereas at the medium-term horizon, the prominent and infrequent yellow color showing a weak correlation is observed for the two developed (Hong Kong and New Zealand) and one emerging (China) markets in the Asia Pacific region. Though, at the long-term horizon, all countries’ equity pairs depict positive correlation except for Hong Kong, which depicts a weak correlation from the year 2012 onward. Therefore, from the set of Asia Pacific region’s markets (see Table 1), the decoupling hypothesis is accepted only for Hong Kong, New Zealand and Chinese Islamic and conventional equity markets at the medium-term horizon, suggesting that these markets provide diversification benefits to investors.
Similarly, for examining the contagion effect or the safe-haven ability of Islamic stocks, we limited the crisis period to one year such as the GFC period from July 2007 to June 2008 and the ESDC from 2011–2012, as suggested by Azad et al. (2018). We observed that all of Asia Pacific’s developed and emerging Islamic and conventional stock indices return depict an increase in correlations during these periods particularly at short-term horizons, which suggest that all Asia Pacific country’s Islamic and conventional equity markets have suffered from pure contagion (high-coherency areas). Moreover, during those periods, the Islamic stocks failed to serve and justify their theoretical safe-haven ability (as there is no evidence of negative correlation during crisis periods). However, at the medium-term horizon, unique evidence can be furnished regarding New Zealand and Chinese Islamic equity markets that serve as safe-haven stocks during the ESDC and the GFC period, respectively.
3.1.2. Wavelet Cross Correlation for European Markets
Following the wavelet contour plots presented in Figure 2 represent the European region’s developed and emerging market’s Islamic-conventional equity indices return correlations. The findings indicate the rejection of decoupling hypothesis at the short-term horizon for all European markets. However, at the medium-term horizon, infrequent weak positive correlations were observed for three of the European developed markets (Ireland, Denmark and Spain) and one European emerging market (the Czech Republic). But at the medium-term horizon, the evidence of weak positive correlation dominates only for Ireland, Denmark and Czech Republic markets. Subsequently, at the long-term horizon, infrequent weak positive correlations were observed for Ireland, Denmark, Spain and the Czech Republic markets but the evidence of the weak positive correlation predominates only for the Spanish and Czech Republic’s markets. This means that at the long-term horizon, the decoupling hypothesis is accepted only for the Spanish and Czech Republic’s Islamic and conventional equity markets. Therefore, from the set of the European region’s markets (see Table 2), the decoupling hypothesis was accepted only for Ireland, Denmark, and the Czech Republican’s Islamic and conventional equity markets, suggesting that these markets provide diversification benefits to investors.
Finally, due to increased correlation at short-term horizons, the evidence of pure contagion was observed for all the European developed and emerging markets except for Ireland and the Czech Republic’s Islamic equity markets that served as safe-havens due to the negative correlation between their Islamic and conventional equity returns during the GFC (2008–2009) and ESDC (2011–2012) periods, respectively. However, at the medium-term horizon, Ireland and Denmark’s Islamic equity markets served as safe-havens during the GFC and ESDC periods, respectively.
3.1.3. Wavelet Cross Correlation for Americas Markets
The contour plots presented in Figure 3 indicate strong positive correlations at the short-term horizon for all of the Americas region’s emerging markets. However, at the medium-term horizon, Argentina and Peru’s markets support the acceptance of the decoupling hypothesis due to the predominant existence of the weak positive and negative correlations between their Islamic and conventional equity markets. Subsequently, at the long-term horizon, only Argentina’s Islamic and conventional equity markets are partially decoupled. Therefore, from the set of European region’s markets (see Table 4), the decoupling hypothesis was accepted for Argentina and Peru’s Islamic and conventional equity markets, suggesting portfolio diversification benefits for the investors. Finally, among the Americas region’s markets, the weak evidence of the safe-haven ability of Islamic stocks was observed at the medium-term horizon for Argentina and Peru during the ESDC period.
3.2. Characteristics of Islamic and Conventional Stock Return Correlations
This section facilitates to examine the characteristics of the Islamic-conventional stock returns correlations in the form of evolving correlations and the common trends by considering both time-domain and time-frequency based correlations. For this purpose, the series of volatility based asymmetric dynamic conditional correlations were plotted with their respective time-frequency based short-, medium- and long-term wavelet correlations. Though, before comparing the series of ADCC-GARCH based and the wavelet-based Islamic-conventional stock correlations, we needed to estimate the ADCC models. The ADCC model’s estimation helps to identify whether the bad news (negative shocks) has more of an effect than the positive news. In doing so, we examined the significance of the asymmetric parameters or coefficients (ɡ) for each pair of Islamic-conventional equity market return indices. The ADCC parameter estimates (see Table A1, Table A2, Table A3, Table A4, Table A5, Table A6, Table A7, Table A8 and Table A9) for the region-wise selected developed and emerging market’s Islamic-conventional equity pairs are reported in the appendix section (see Appendix E, Appendix F and Appendix G). Thus, after verifying the suitability of the ADCC model i.e. significant asymmetric parameters, we extracted the series of volatility based asymmetric dynamic conditional correlations and compared them with the series of multi-horizon wavelet correlations. This helped to identify the in-depth possible divergences in the dependence structure of the Islamic and conventional equity returns.
The time-trajectory of the multi-horizon wavelet correlations and the asymmetric dynamic conditional correlations have conspired in figures (see Figure 4, Figure 5 and Figure 6) to present the dynamics of the linkages between the equity market pairs (Islamic and conventional) of the developed and emerging markets of the Asia, Europe and Americas regions.
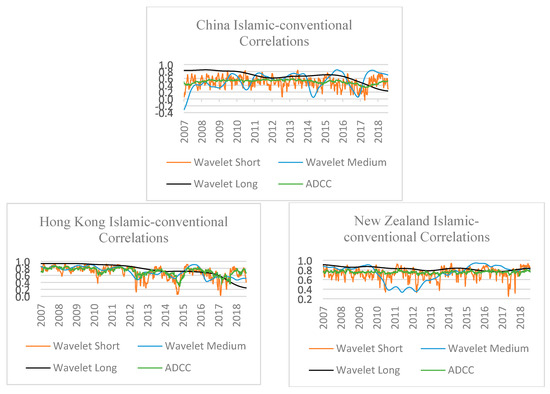
Figure 4.
Wavelet short-, medium-, long-term and ADCC correlations for Asian/Pacific Islamic and conventional equity markets.
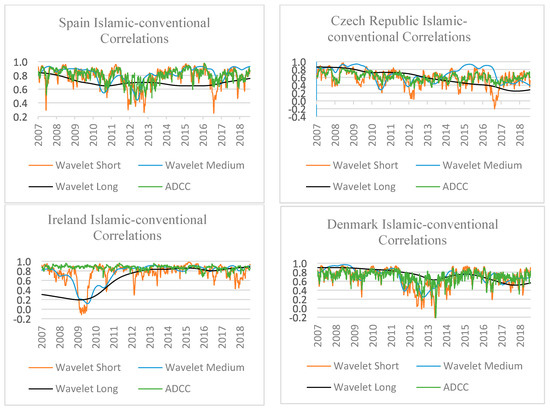
Figure 5.
Wavelet short-, medium-, long-term and ADCC correlations for European Islamic and conventional equity markets.
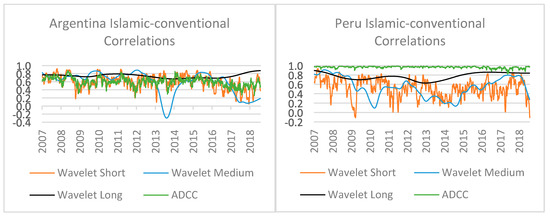
Figure 6.
Wavelet short-, medium-, long-term and ADCC correlations for the Americas Islamic and conventional equity markets.
3.2.1. Characteristics of Correlations for Asian/Pacific Markets
The charts plotted for the developed and emerging Asian/Pacific (Hong Kong, New Zealand and China) market’s Islamic-conventional stock indices return correlations in Figure 4 disclose the prevalence of positive Islamic-conventional correlations for the three-time horizons over the sample considered, except for the China market that depicts a temporary negative correlation at the medium-term horizon. Thus, some remarkable differences in the development of Islamic-conventional correlations across the three selected different Asian/Pacific markets, as well as in their patterns of short-, medium- and long-term wavelet correlations can be observed. For the former case, regardless of the prevalence of high positive correlations at the medium- and long-term horizons, the differences in the development of correlations can be observed at short-term wavelet correlations for the two developed (Hong Kong, New Zealand) and one emerging (China) Asia Pacific markets. For instance, the weak positive correlations for Hong Kong’s Islamic-conventional equity markets can be observed during the years 2012–2018, and for New Zealand during the years 2010–2018 and 2017. However, for China, these weak correlations can be observed throughout the sample period.
Focusing on the latter case or the comparative patterns of the short-, medium- and long-term wavelet correlations, the short-term Islamic-conventional stock returns wavelet correlations for all the Asian/Pacific developed markets depict more volatile behavior as compared to the medium and the long-term wavelet correlations. The reason for this high volatile behavior can be factors such as sporadic or ephemeral events (e.g., surprising earnings announcements) and psychological events (e.g., a shift in market sentiments); those events determine the performance of these two equity markets in the short-term horizon. Therefore, it can be inferred that momentary factors influence the investment decisions of short-term investors. More specifically, these factors lead to sudden changes in the short-term developed market’s Islamic-conventional equity indices return wavelet correlations of the Asian/Pacific region. On the other hand, the medium-term wavelet correlations demonstrate a stable pattern, unlike the short-term ones. The reason behind this stability is the effect of the medium frequency-based factors i.e., micro and the macroeconomic fundamentals.
However, the long-term wavelet correlations are characterized as having a more stable pattern than their short-term and medium-term counterparts. The reason for this highly stable pattern can be the effect of low frequency-based factors i.e., the economic fundamentals. That means the economic fundamentals lead to indifferent behavior between the Islamic and conventional stock returns, particularly at the long-time horizon. Finally, the ADCC-GARCH based correlation generally demonstrates a similar trend to the medium-term wavelet correlation. But for the case of Hong Kong, it resembles the short-term wavelet correlations and for New Zealand and China, it depicts a pattern similar to the long-term wavelet correlation. Therefore, this transitional comportment can be exemplified as the difference between the time-frequency and time-domain analysis.
3.2.2. Characteristics of Correlations for European Markets
The charts plotted for the developed and emerging European markets (Ireland, Denmark, Spain and the Czech Republic) Islamic-conventional stock indices in Figure 5 disclose the prevalence of positive Islamic-conventional stock return correlations for the three-time horizons over the sample considered except for in Ireland and Denmark; those two market’s Islamic and conventional indices depict a temporary negative correlation at the short-term horizon. Thus, some remarkable differences in the development of Islamic-conventional correlations across the four selected different European markets, as well as in their patterns of short-, medium- and long-term wavelet correlations can be observed. For the former case, regardless of the prevalence of high positive correlations at the medium- and long-term horizons, the differences in the development of correlations can be observed at short-term wavelet correlations for the three developed (Ireland, Denmark and Spain) and one emerging (Czech Republic) European markets. For instance, for the case of Ireland, the pattern of the weak positive or negative correlation can be found between the years 2009–2010 and 2012, for Denmark between the years 2011–2014 and 2016–2017, for Spain, between the years 2007–2008, 2012–2013 and 2016–2017 and for the Czech Republic, between the years 2010–2018. Similarly, some differences in the long-term wavelet correlations can also be observed for two European markets (Ireland and the Czech Republic). For instance, for the case of Ireland, the weak positive correlation can be observed during the years 2007–2010 and for the Czech Republic, it can be observed from the year 2015 onwards.
For the latter case or the comparative patterns of the European market’s Islamic-conventional stock return correlations, the short-term Islamic-conventional stock returns wavelet correlations depict a more volatile behavior as compared to the medium- and the long-term wavelet correlations whereas the medium-term wavelet correlations demonstrate a stable pattern, unlike the short-term ones. However, the long-term wavelet correlations were characterized as having a more stable pattern than its short-term and medium-term counterparts. Finally, the ADCC-GARCH based correlations generally demonstrate a similar trend to short-term wavelet correlations except for in Ireland, where all wavelet correlations differ from each other particularly during the years 2007–2011. However, for the case of Ireland, the ADCC correlation demonstrated a highly stable pattern as compared to three horizons-based wavelet correlations.
3.2.3. Characteristics of Correlations for Americas Markets
The charts plotted for the Americas market’s Islamic-conventional stock return indices in Figure 6 disclose the prevalence of positive Islamic-conventional correlations for the three-time horizons over the sample considered except for the Argentina and Peru markets; those markets depict a temporary negative correlation at the medium- and short-term horizons, respectively. Therefore, some remarkable differences in the development of Islamic-conventional correlations across the two selected different Americas markets, as well as in their patterns of short-, medium- and long-term wavelet correlations can be observed. For the former case, regardless of the prevalence of high positive correlations at medium- and long-term horizons, the differences in the development of correlations can be observed at short-term wavelet correlations for the two Americas emerging markets (Argentina and Peru). For instance, the weak positive correlations for these two markets were observed from the year 2009 onwards. However, the negative correlations for the two markets (Argentina and Peru) were observed at the medium- and the short-term wavelet correlations, respectively. For instance, for the case of Argentina, the pattern of negative correlations can be observed in medium-term wavelet correlations between the years 2013–2014, whereas for Peru, it can be observed in the short-term horizon and during 2009–2010 and 2017–2018.
Though, for the latter case (comparative patterns), the volatile behavior is observed for the short-term wavelet correlation than the medium and long-term wavelet correlations. However, the medium-term wavelet correlations demonstrate a stable pattern unlike the short-term ones and the long-term wavelet correlations were characterized as having a more stable pattern than their short-term and medium-term counterparts. Finally, the patterns of Argentina’s ADCC correlation show similarity with its short-term Islamic-conventional wavelet correlation, whereas the pattern of Peru’s ADCC correlation resembles the long-term wavelet correlation.
3.2.4. Granger Causality Test
In this sub-section, the Granger causality tests are discussed as a robustness test to examine the causation between the Islamic and conventional equity markets. The causality tests were implemented between a country’s Islamic and conventional equity returns as well as their respective volatilities (results for the decoupled markets are reported in Table 6).
Table 6.
Granger Causality Results for Islamic and Conventional Stock Returns and Volatility.
For the Hong Kong market, unsurprisingly the Islamic stock returns cause the conventional equity market returns, whereas bi-directional causation exists between the volatilities of both equity markets. New Zealand’s conventional stock returns cause the Islamic stock returns, whereas volatility in Islamic equity markets can cause volatility in conventional equity markets. For the case of China, Ireland and Denmark, their respective Islamic and conventional equity returns as well as the volatility levels demonstrate a bi-directional relationship, except for Ireland’s Islamic equity market volatility that shows no significance for the causality from the Islamic to conventional stock volatility. However, Spain’s Islamic stock returns cause the conventional equity market returns and bi-directional causation exists between the volatilities of both equity markets. For the case of Argentina, the conventional equity market’s returns cause the returns and the volatility in the Islamic equity market. Finally, Peru’s Islamic and conventional equity market returns show no significant effect on each other. However, volatility in Peru’s conventional equity markets can cause volatility in Islamic equity markets. In general, it is the conventional equity market that can affect the Islamic equity market and cause or result in volatility (spillover). However, the evidence of causation from the Islamic to conventional equity markets is not enough to conclude that the Islamic equity markets can cause return and volatility in conventional equity markets. Therefore, the Islamic equity markets depend on the conventional equity markets to a varying degree6.
4. Discussion
In this section, the findings and detailed discussion regarding the evidence of decoupling or integration for region-wise developed and emerging markets as well as the contagion or safe-haven phenomenon are provided. For the developed countries’ time-frequency analysis, the rejection of decoupling hypothesis or the evidence of integration was found for almost all major developed markets (e.g., the US, UK, Japan, Canada, etc.) with a few exceptions (e.g., Hong Kong, New Zealand, Ireland, Denmark and Spain). However, for these few developed markets, the decoupling hypothesis was predominantly rejected at both short- and long-term horizons but differentiating results are observed only at the medium-term horizon. For instance, the evidence of weak (low positive) correlation was found only for five developed market equity indices return pairs such as Hong Kong, New Zealand, Ireland, Denmark and Spain, as those markets have depicted temporarily low positive Islamic-conventional stock return correlations at medium-term horizons. The reason behind this weak positive correlation (decoupling) can possibly be a consequence of the improving performance of the constituents of an Islamic (Shariah-compliant) stock index generally, rather than only the greater differential exposure to a specific sector or the exclusion of a major proportion of financials. For these five developed markets (Hong Kong, New Zealand, Ireland, Denmark and Spain), we did not find consistent or inconsistent results from the past studies, as none of the studies has investigated this phenomenon for these markets.
However, consistent and inconsistent results from several past studies were found regarding our evidence of integration between the selected developed Islamic and conventional equity markets (e.g., US, UK, Japan, Canada, etc.). Although this study has applied different methodologies than the past studies, some of the findings of this study are supported with the findings of those studies such as el Alaoui et al. (2015) who provided the evidence of integration between the US Islamic and conventional equity markets by applying the wavelet squared coherence and asymmetric-based causality methodologies and Majdoub et al. (2016) who applied cointegration and ADCC-GARCH models and found integration between Islamic and conventional equity markets of the US and UK. Similarly, Shahzad et al. (2017) applied a forecast error variance decomposition technique and provided evidence of integration between Islamic and conventional equity markets of the US, UK and Japan. Though contrasting results are also provided by some of the past studies, those do not support the findings of this study such as Majdoub and Mansour, who (Majdoub and Mansour 2014) applied the GARCH-BEKK, CCC and DCC models and did not find evidence of integration between the US Islamic and conventional equity markets as well as Kenourgios et al. (2016) who applied the A-DCC model and found the decoupling of the US, UK and Japan’s Islamic equity markets from their conventional counterparts. Similarly, El Mehdi and Mghaieth (2017) as well as Trabelsi and Naifar (2017) applied the DCC-FIAPARCH and the CoVaR models, respectively, and they also did not find evidence of integration between the Islamic and conventional equity markets of the US and UK. Thus, for 16 out of 21 developed markets, the results of this study indicate high positive correlations between the Islamic equity prices and the corresponding conventional ones, which means that the majority of the developed market’s Islamic equity markets are highly dependent on their conventional counterparts, they behave in the same way and do not provide diversification benefits. However, for 5 out of 21 developed markets, the results of this study indicate weak positive correlations, meaning very few developed markets’ Islamic equity markets show different behavior or dependency from their conventional counterparts and provide diversification benefits to investors. However, one of the reasons for the weak correlation or the rejection of the decoupling hypothesis can be the contingency among the capital markets and their regional trade partnerships.
Similar to developed markets, the rejection of decoupling hypothesis or the evidence of integration is also found for almost all major emerging markets (e.g., Pakistan, India, Malaysia, Russia, Turkey, etc.) though not for a few ones (e.g., China, the Czech Republic, Argentina and Peru). Though, for these few emerging markets, the decoupling hypothesis is also predominantly rejected at both short- and long-term horizons, whereas differentiating results were observed only at the medium-term horizon. For instance, the evidence of weak (low positive) correlation is found only for four emerging equity indices returns pairs such as China, the Czech Republic, Argentina, and Peru, as those markets depicted temporarily low positive Islamic-conventional correlations at medium-term horizons. Again, we did not find consistent or inconsistent results regarding the decoupling hypothesis that are evident for the four emerging markets (China, Czech Republic, Argentina and Peru) except for the China market. Therefore, the findings of this study are supported by some of the past studies, such as Kenourgios et al. (2016) who applied the A-DCC model and provided evidence in favor of the decoupling hypothesis for China.
However, the consistent and inconsistent results from several past studies are found regarding our evidence of integration between the selected emerging market’s Islamic and conventional equity markets (e.g., Pakistan, India, Malaysia, Russia, Turkey, etc.). For instance, the findings of this study are consistent with the studies that provided evidence of integration such as Majdoub and Mansour (2014) that applied the GARCH BEKK, CCC and DCC models and provided evidence of integration between the Islamic and conventional equity markets for Malaysia, Pakistan and Turkey, while Krasicka and Nowak (2012) also supported the evidence of integration for Malaysia. However, the findings of this study are inconsistent to those studies that applied the A-DCC model and found the decoupling effect between Islamic and conventional or equity markets of India and Russia (Kenourgios et al. 2016). Finally, the overall results of this study for developed and emerging countries (except for Hong Kong, New Zealand, Ireland, Denmark, Spain, Argentina and Peru) are consistent with Walkshäusl and Lobe (2012) who applied the time-series factor regression technique and did not find any difference in the performances of both developed and emerging markets Islamic-conventional indices. Therefore, we would acknowledge the fact that the majority of the market’s Islamic equity markets show indifferent behavior from their conventional counterparts and that can be due to a faulty Shariah screening process which can be improved or there may be some economic or financial indicators that may lead the other markets to behave indifferently.
By focusing on the crisis periods, 8 out of the 41 markets (developed and emerging) Islamic stocks can be seen to serve as safe-havens during periods of financial turmoil (GFC and ESDC). For instance, during the GFC period, one developed (Ireland) and three emerging markets (China, Argentina and Peru) were safe-havens, whereas during the ESDC, three developed (the Hong Kong, New Zealand, and Denmark) and two emerging markets (the Czech Republic, and Peru) Islamic stocks serve as safe-havens. However, the reason for this safe-haven ability of Islamic stocks can be that none of the Islamic financial institutions have failed during and after GFC, since they (e.g., Islamic banks) are not allowed to invest or finance the instruments (e.g., derivatives and toxic assets) that may have badly affected their conventional counterparts and stimulated the GFC (Hasan and Dridi 2011). Moreover, the Islamic and conventional equity markets portray similar behavior that usually diverges during the crisis periods, therefore, the Islamic equity markets of developed and emerging markets serve as safe-havens and hedges during those periods (Saâdaoui et al. 2017). These findings regarding a market’s Islamic stocks have some implications such as during periods of financial turmoil, if investors with their short-term intraday or medium-term investments find Islamic stocks to serve as safe-havens, then they may switch their investments to these Islamic stocks and try to minimize their losses. This finding is supportive of the argument that for conventional investors, the Islamic stocks are favorable to achieve short-term profitability and obtain risk diversification benefits (Umar 2017), and that Islamic stocks provide a cushion from a crisis (Jawadi et al. 2014; Dewandaru et al. 2014). Therefore, both Islamic (faith-based) and conventional investors can switch their investments to Islamic stocks and minimize the losses resulting from a systemic crisis. This argument is also supported by Jawadi et al. (2014) that the Muslim (faith-based) and Non-Muslim (religiously neutral) investors can invest in Islamic stocks during a normal period but to protect their investments in crisis periods, they can incline more towards Islamic stocks.
Finally, for the majority made up of 33 out of 41 markets (developed and emerging), the results of this study indicated a contagion effect between their Islamic and conventional equity indices which mean that the majority of the developed and emerging markets’ Islamic equity markets show indifferent behavior from their conventional counterparts, particularly during crisis periods. This evidence is supported by Azad et al. (2018) who applied quantile regressions and did not find evidence of the safe-haven ability of developed (US, UK, Japan) and emerging (India along with other four countries except for China) countries’ Islamic indices, nor any diversification benefits to investors during crisis periods. Therefore, the overall results of this study for region-wise developed and developing country pairs (except for Hong Kong, New Zealand, Ireland, Denmark, Argentina and Peru) are consistent with the argument built by Ajmi et al. (2014) that Islamic equity markets cannot act to hedge against risky movements in conventional equity markets, particularly during periods of financial turmoil. The reason behind this non-ability of Islamic stocks to act as diversifiers or hedges is that the whole financial system including Islamic and conventional equity markets are directly or indirectly affected by global common shocks as well as contagion risks during periods of financial turbulence. Thus, during crisis periods, investors can transfer their investments to other safe-haven assets (e.g., bond and commodities like gold) to hedge their invested funds against the severe exposure of equity markets to the crises (Baur and Lucey 2010; Baur and McDermott 2010).
5. Conclusions
This paper examines the weak (decoupling) or the strong (integration) dependence between the region-wise developed and emerging market’s Islamic and conventional equity market indices with the application of time-frequency based and time-varying-volatility based correlation models. The results of this study suggest that the decoupling hypothesis was generally rejected for all region-wise (Asia, Europe and the Americas) developed and emerging market’s equity indices pairs over time and across frequencies. However, it was accepted for only five (Hong Kong, New Zealand, Ireland, Denmark and Spain) of the 21 developed countries and four (China, Czech Republic, Argentina and Peru) of 20 emerging countries. These findings may provide several practical implications for investors and portfolio managers such as; they can grasp information on the dynamics of the decoupling or integration between Islamic and conventional equity markets to opt for a better international diversification strategy and to form decoupling strategies that may guard against contagion risks. Moreover, they can reconsider their portfolio investments from tranquil to turmoil periods and shift their investments to other alternative investments if Islamic stocks do not provide additional diversification benefits or safe-havens during turmoil periods. For future research, one can find the sources of these decoupling and integration phenomenon between Islamic and conventional equity markets and construct optimal portfolio designs to avoid greater losses during tranquil periods, as well as during turmoil periods.
Author Contributions
Research Idea, M.A. and G.M.; supervision G.M.; methodology and formal analysis M.A.; review and editing S.N.; visualization S.A. All authors have read and showed consensus to the published version of the manuscript.
Funding
This research received no external funding.
Conflicts of Interest
The authors declare no conflict of interest.
Appendix A. Asian/Pacific Market’s Islamic-Conventional Wavelet Stock Returns Correlation


Figure A1.
Islamic-conventional stock returns Wavelet correlations for Asia-Pacific region’s markets.
The wavelet plots reported in Appendix A indicate that these Asian/Pacific Islamic and conventional equity markets are highly and positively correlated to each other at all frequency scales and over time. This evidence suggests the rejection of the decoupling hypothesis or the evidence of integration between the Islamic and conventional markets. Thus, lower diversification benefits to portfolio investors.
Appendix B. European Market’s Islamic-Conventional Wavelet Stock Returns Correlation


Figure A2.
Islamic-conventional stock returns Wavelet correlations for European region’s markets.
The wavelet plots reported in Appendix B indicate that these European region’s Islamic and conventional equity markets are highly and positively correlated to each other at all frequency scales and over time which implies that these markets are integrated, and the decoupling hypothesis is rejected. Thus, lower diversification benefits to portfolio investors.
Appendix C. African Market’s Islamic-Conventional Wavelet Stock Returns Correlation

Figure A3.
Islamic-conventional stock returns Wavelet correlations for African region’s markets.
The wavelet plot reported in Appendix C indicates that the South Africa region’s Islamic and conventional equity markets are highly and positively correlated to each other at all frequency scales and over time which implies that these markets are integrated, and the decoupling hypothesis is rejected. Thus, lower diversification benefits to portfolio investors.
Appendix D. Americas Market’s Islamic-Conventional Wavelet Stock Returns Correlation

Figure A4.
Islamic-conventional stock returns Wavelet correlations for Americas’ region markets.
The wavelet plots reported in Appendix D indicate that the Americas region’s Islamic and conventional equity markets are highly and positively correlated to each other at all frequency scales and over time. This evidence suggests the rejection of the decoupling hypothesis or the evidence of integration between the Islamic and conventional markets. Thus, lower diversification benefits to portfolio investors.
Appendix E. Results of Estimated ADCC Models for Asian/Pacific Region
Table A1.
Parameter Estimates of Hong Kong’s Islamic-conventional ADCC-GARCH model.
Table A1.
Parameter Estimates of Hong Kong’s Islamic-conventional ADCC-GARCH model.
| Parameters | Estimate | Std. Error | t-Value | p-Value |
|---|---|---|---|---|
| α | 0.01701 | 0.00377 | 4.51324 | 6 × 10⁻⁶ |
| β | 971443 | 0.00528 | 184.16 | 0.00000 |
| ɡ | 0.01363 | 0.00609 | 2.23693 | 0.02529 |
| Akaike | −12.846 | |||
| Bayes | −12.804 | |||
| Shibata | −12.846 | |||
| Hannan-Quinn | −12.831 |
Table A2.
Parameter Estimates of New Zealand’s Islamic-conventional ADCC-GARCH model.
Table A2.
Parameter Estimates of New Zealand’s Islamic-conventional ADCC-GARCH model.
| Parameters | Estimate | Std. Error | t-Value | p-Value |
|---|---|---|---|---|
| α | 0.019063 | 0.005106 | 3.73373 | 0.000189 |
| β | 0.961953 | 0.009866 | 97.50299 | 0.000000 |
| ɡ | 0.016277 | 0.008140 | 1.99955 | 0.045549 |
| Akaike | −12.271 | |||
| Bayes | −12.229 | |||
| Shibata | −12.271 | |||
| Hannan-Quinn | −12.256 |
Table A3.
Parameter Estimates of China’s Islamic-conventional ADCC-GARCH model.
Table A3.
Parameter Estimates of China’s Islamic-conventional ADCC-GARCH model.
| Parameters | Estimate | Std. Error | t-Value | p-Value |
|---|---|---|---|---|
| α | 0.033366 | 0.007480 | 4.46079 | 0.000008 |
| β | 0.909057 | 0.018064 | 50.32293 | 0.000000 |
| ɡ | 0.047817 | 0.016492 | 2.89935 | 0.003739 |
| Akaike | −13.840 | |||
| Bayes | −13.798 | |||
| Shibata | −13.840 | |||
| Hannan-Quinn | −13.825 |
Appendix F. Results of Estimated ADCC Models for European Region
Table A4.
Parameter Estimates of Ireland’s Islamic-conventional ADCC-GARCH model.
Table A4.
Parameter Estimates of Ireland’s Islamic-conventional ADCC-GARCH model.
| Parameters | Estimate | Std. Error | t-Value | p-Value |
|---|---|---|---|---|
| α | 0.034182 | 0.006137 | 5.569988 | 0.000000 |
| β | 0.946325 | 0.009577 | 98.812218 | 0.000000 |
| ɡ | 0.026761 | 0.011170 | 2.395743 | 0.016587 |
| Akaike | −12.579 | |||
| Bayes | −12.537 | |||
| Shibata | −12.579 | |||
| Hannan-Quinn | −12.564 |
Table A5.
Parameter Estimates of Denmark’s Islamic-conventional ADCC-GARCH model.
Table A5.
Parameter Estimates of Denmark’s Islamic-conventional ADCC-GARCH model.
| Parameters | Estimate | Std. Error | t-Value | p-Value |
|---|---|---|---|---|
| α | 0.059453 | 0.013754 | 3.5667 | 0.000362 |
| β | 0.863444 | 0.028299 | 30.5115 | 0.000000 |
| ɡ | 0.072412 | 0.027396 | 2.6431 | 0.008215 |
| Akaike | −12.787 | |||
| Bayes | −12.745 | |||
| Shibata | −12.787 | |||
| Hannan-Quinn | −12.772 |
Table A6.
Parameter Estimates of Spain’s Islamic-conventional ADCC-GARCH model.
Table A6.
Parameter Estimates of Spain’s Islamic-conventional ADCC-GARCH model.
| Parameters | Estimate | Std. Error | t-Value | p-Value |
|---|---|---|---|---|
| α | 0.031758 | 0.006938 | 4.577229 | 0.000005 |
| β | 0.932285 | 0.009930 | 93.886312 | 0.000000 |
| ɡ | 0.043750 | 0.013520 | 3.235859 | 0.001213 |
| Akaike | −12.854 | |||
| Bayes | −12.812 | |||
| Shibata | −12.854 | |||
| Hannan-Quinn | −12.839 |
Table A7.
Parameter Estimates of Czech Republic’s Islamic-conventional ADCC-GARCH model.
Table A7.
Parameter Estimates of Czech Republic’s Islamic-conventional ADCC-GARCH model.
| Parameters | Estimate | Std. Error | t-Value | p-Value |
|---|---|---|---|---|
| α | 0.049311 | 0.008379 | 5.885143 | 0.000000 |
| β | 0.893956 | 0.011595 | 77.101496 | 0.000000 |
| ɡ | 0.058043 | 0.014848 | 3.909067 | 0.000093 |
| Akaike | −15.039 | |||
| Bayes | −14.997 | |||
| Shibata | −15.039 | |||
| Hannan-Quinn | −15.024 |
Appendix G. Results of Estimated ADCC Models for Americas Region
Table A8.
Parameter Estimates of Argentina’s Islamic-conventional ADCC-GARCH model.
Table A8.
Parameter Estimates of Argentina’s Islamic-conventional ADCC-GARCH model.
| Parameters | Estimate | Std. Error | t-Value | p-Value |
|---|---|---|---|---|
| α | 0.043289 | 0.009225 | 4.692727 | 0.000003 |
| β | 0.911344 | 0.011082 | 82.234829 | 0.000000 |
| ɡ | 0.072196 | 0.015076 | 4.788926 | 0.000002 |
| Akaike | −15.064 | |||
| Bayes | −15.022 | |||
| Shibata | −15.064 | |||
| Hannan-Quinn | −15.049 |
Table A9.
Parameter Estimates of Peru’s Islamic-conventional ADCC-GARCH model.
Table A9.
Parameter Estimates of Peru’s Islamic-conventional ADCC-GARCH model.
| Parameters | Estimate | Std. Error | t-Value | p-Value |
|---|---|---|---|---|
| α | 0.032072 | 0.009039 | 3.54826 | 0.000388 |
| β | 0.930281 | 0.014975 | 62.12198 | 0.000000 |
| ɡ | 0.021323 | 0.010729 | 1.98736 | 0.046883 |
| Akaike | −12.900 | |||
| Bayes | −12.858 | |||
| Shibata | −12.900 | |||
| Hannan-Quinn | −12.885 |
Table A1, Table A2, Table A3, Table A4, Table A5, Table A6, Table A7, Table A8 and Table A9 represent the ADCC models estimated for the region-wise selected developed and emerging market’s Islamic and conventional equity markets. The low alpha and high beta values in each model highlight the importance of long-term over the short-run persistence. However, the statistics or asymmetric coefficient (ɡ) of ADCC models support our intuition that the Islamic and conventional equity markets are influenced by the sharp rise in returns or the bad news.
References
- Aguiar-Conraria, Luís, and Maria Joana Soares. 2014. The continuous wavelet transform: Moving beyond uni-and bivariate analysis. Journal of Economic Surveys 28: 344–75. [Google Scholar] [CrossRef]
- Ahmed, Walid M. A. 2019. Islamic and conventional equity markets: Two sides of the same coin, or not? The Quarterly Review of Economics and Finance 72: 191–205. [Google Scholar] [CrossRef]
- Ahmed, Habib, and Ahmed H. Elsayed. 2019. Are Islamic and conventional capital markets decoupled? Evidence from stock and bonds/sukuk markets in Malaysia. The Quarterly Review of Economics and Finance 74: 56–66. [Google Scholar] [CrossRef]
- Ahmed, Habib, Mahmoud Mohieldin, Jos Verbeek, and Farida Aboulmagd. 2015. On the Sustainable Development Goals and the Role of Islamic Finance. Washington, DC: The World Bank. [Google Scholar]
- Ajmi, Ahdi Noomen, Shawkat Hammoudeh, Duc Khuong Nguyen, and Soodabeh Sarafrazi. 2014. How strong are the causal relationships between Islamic stock markets and conventional financial systems? Evidence from linear and nonlinear tests. Journal of International Financial Markets, Institutions and Money 28: 213–27. [Google Scholar] [CrossRef]
- Al Rahahleh, Naseem, M. Ishaq Bhatti, and Faridah Najuna Misman. 2019. Developments in risk management in Islamic finance: A review. Journal of Risk and Financial Management 12: 37. [Google Scholar] [CrossRef]
- Aloui, Chaker, Besma Hkiri, Chi Keung Marco Lau, and Larisa Yarovaya. 2016. Investors’ sentiment and US Islamic and conventional indexes nexus: A time–frequency analysis. Finance Research Letters 19: 54–59. [Google Scholar] [CrossRef]
- Azad, ASM Sohel, Saad Azmat, Abdelaziz Chazi, and Amirul Ahsan. 2018. Sailing with the non-conventional stocks when there is no place to hide. Journal of International Financial Markets, Institutions and Money 57: 1–16. [Google Scholar] [CrossRef]
- Bannigidadmath, Deepa, and Paresh Kumar Narayan. 2016. Stock return predictability and determinants of predictability and profits. Emerging Markets Review 26: 153–73. [Google Scholar] [CrossRef]
- Baur, Dirk G., and Brian M. Lucey. 2010. Is gold a hedge or a safe haven? An analysis of stocks, bonds and gold. Financial Review 45: 217–29. [Google Scholar] [CrossRef]
- Baur, Dirk G., and Thomas K. McDermott. 2010. Is gold a safe haven? International evidence. Journal of Banking & Finance 34: 1886–98. [Google Scholar]
- Benhmad, François. 2013. Bull or bear markets: A wavelet dynamic correlation perspective. Economic Modelling 32: 576–91. [Google Scholar] [CrossRef]
- Cappiello, Lorenzo, Robert F. Engle, and Kevin Sheppard. 2006. Asymmetric dynamics in the correlations of global equity and bond returns. Journal of Financial Econometrics 4: 537–72. [Google Scholar] [CrossRef]
- Dewandaru, Ginanjar, Syed Aun R. Rizvi, Rumi Masih, Mansur Masih, and Syed Othman Alhabshi. 2014. Stock market co-movements: Islamic versus conventional equity indices with multi-timescales analysis. Economic Systems 38: 553–71. [Google Scholar] [CrossRef]
- Dewandaru, Ginanjar, Rumi Masih, and A. Mansur M. Masih. 2016. Contagion and interdependence across Asia-Pacific equity markets: An analysis based on multi-horizon discrete and continuous wavelet transformations. International Review of Economics & Finance 43: 363–77. [Google Scholar]
- el Alaoui, Abdelkader O., Ginanjar Dewandaru, Saiful Azhar Rosly, and Mansur Masih. 2015. Linkages and co-movement between international stock market returns: Case of Dow Jones Islamic Dubai Financial Market index. Journal of International Financial Markets, Institutions and Money 36: 53–70. [Google Scholar] [CrossRef]
- El Mehdi, Imen Khanchel, and Asma Mghaieth. 2017. Volatility spillover and hedging strategies between Islamic and conventional stocks in the presence of asymmetry and long memory. Research in International Business and Finance 39: 595–611. [Google Scholar] [CrossRef]
- El-Karanshawy, Hatem A., Azmi Omar, Tariqullah Khan, Salman Syed Ali, Hylmun Izhar, Wijdan Tariq, Karim Ginena, and Bahnaz Al Quradaghi. 2015. Financial Stability and Risk Management in Islamic Financial Institutions. Doha: HBKU Press. [Google Scholar]
- Engle, Robert. 2002. Dynamic conditional correlation: A simple class of multivariate generalized autoregressive conditional heteroskedasticity models. Journal of Business & Economic Statistics 20: 339–50. [Google Scholar]
- Engle, Robert. 2009. Anticipating Correlations: A New Paradigm for Risk Management. Princeton: Princeton University Press. [Google Scholar]
- Ftiti, Zied, Aviral Tiwari, Amél Belanès, and Khaled Guesmi. 2015. Tests of financial market contagion: Evolutionary cospectral analysis versus wavelet analysis. Computational Economics 46: 575–611. [Google Scholar] [CrossRef]
- Gallegati, Marco, and James B. Ramsey. 2013. Bond vs stock market’s Q: Testing for stability across frequencies and over time. Journal of Empirical Finance 24: 138–50. [Google Scholar] [CrossRef]
- Gençay, Ramazan, Faruk Selçuk, and Brandon Whitcher. 2002. Robustness of Systematic Risk Across Time Scales. Informal University of Windsor Working Paper. Windsor: University of Windsor. [Google Scholar]
- Grinsted, Aslak, John C. Moore, and Svetlana Jevrejeva. 2004. Application of the cross wavelet transform and wavelet coherence to geophysical time series. Nonlinear Processes Geophysics 11: 561–66. [Google Scholar] [CrossRef]
- Guimarães-Filho, Roberto, and Gee Hee Hong. 2016. Dynamic Connectedness of Asian Equity Markets. IMF Working Papers 16/57. Washington, DC: IMF. [Google Scholar]
- Hammoudeh, Shawkat, Walid Mensi, Juan Carlos Reboredo, and Duc Khuong Nguyen. 2014. Dynamic dependence of the global Islamic equity index with global conventional equity market indices and risk factors. Pacific-Basin Finance Journal 30: 189–206. [Google Scholar] [CrossRef]
- Hasan, Maher, and Jemma Dridi. 2011. The effects of the global crisis on Islamic and conventional banks: A comparative study. Journal of International Commerce, Economics and Policy 2: 163–200. [Google Scholar] [CrossRef]
- Hkiri, Besma, Shawkat Hammoudeh, Chaker Aloui, and Larisa Yarovaya. 2017. Are Islamic indexes a safe haven for investors? An analysis of total, directional and net volatility spillovers between conventional and Islamic indexes and importance of crisis periods. Pacific-Basin Finance Journal 43: 124–50. [Google Scholar] [CrossRef]
- Ho, Sin-Yu, and Nicholas M. 2014. Odhiambo. Stock market development in the Philippines: Past and present. Philippine Journal of Development 41: 135. [Google Scholar]
- Ibrahim, Mansor H. 2015. Issues in Islamic banking and finance: Islamic banks, Shari’ah-compliant investment and sukuk. Pacific-Basin Finance Journal 34: 185–91. [Google Scholar] [CrossRef]
- Islamic Financial Services Board. 2019. Islamic Financial Services Industry Stability Report. Kuala Lumpur: Islamic Financial Services Board. [Google Scholar]
- Jawadi, Fredj, Nabila Jawadi, and Wael Louhichi. 2014. Conventional and Islamic stock price performance: An empirical investigation. International Economics 137: 73–87. [Google Scholar] [CrossRef]
- Kenourgios, Dimitris, Nader Naifar, and Dimitrios Dimitriou. 2016. Islamic financial markets and global crises: Contagion or decoupling? Economic Modelling 57: 36–46. [Google Scholar] [CrossRef]
- Krasicka, Ms Olga, and Sylwia Nowak. 2012. What’s in it for Me? A Primeron Differences between Islamic and Conventional Finance in Malaysia. No. 12–151. Washington, DC: International Monetary Fund. [Google Scholar]
- Kroszner, Randall S., and Robert J. Shiller. 2011. Reforming US Financial Markets: Reflections Before and Beyond Dodd-Frank. Cambridge: MIT Press. [Google Scholar]
- Majdoub, Jihed, and Walid Mansour. 2014. Islamic equity market integration and volatility spillover between emerging and US stock markets. The North American Journal of Economics and Finance 29: 452–70. [Google Scholar] [CrossRef]
- Majdoub, Jihed, Walid Mansour, and Jamel Jouini. 2016. Market integration between conventional and Islamic stock prices. The North American Journal of Economics and Finance 37: 436–57. [Google Scholar] [CrossRef]
- Markowitz, Harry M. 1952. Portfolio selection. Journal of Finance 7: 77–91. [Google Scholar]
- Masih, Mansur, Nazrol KM Kamil, and Obiyathulla I. Bacha. 2018. Issues in Islamic equities: A literature survey. Emerging Markets Finance and Trade 54: 1–26. [Google Scholar] [CrossRef]
- Mensi, Walid, Shawkat Hammoudeh, Juan C. Reboredo, and Duc Khuong Nguyen. 2015. Are Sharia stocks, gold and US Treasury hedges and/or safe havens for the oil-based GCC markets? Emerging Markets Review 24: 101–21. [Google Scholar] [CrossRef]
- Mensi, Walid, Shawkat Hammoudeh, Ahmet Sensoy, and Seong-Min Yoon. 2017. Analysing dynamic linkages and hedging strategies between Islamic and conventional sector equity indexes. Applied Economics 49: 2456–79. [Google Scholar] [CrossRef]
- Narayan, Paresh Kumar, and Deepa Bannigidadmath. 2017. Does financial news predict stock returns? New evidence from Islamic and non-Islamic stocks. Pacific-Basin Finance Journal 42: 24–45. [Google Scholar] [CrossRef]
- Narayan, Paresh Kumar, and Dinh Hoang Bach Phan. 2017. Momentum strategies for Islamic stocks. Pacific-Basin Finance Journal 42: 96–112. [Google Scholar] [CrossRef]
- Naseri, Marjan, and Mansur Masih. 2014. Integration and Comovement of Developed and Emerging Islamic Stock Markets: A Case Study of Malaysia. MPRA Paper 58799. Munich: University Library of Munich. [Google Scholar]
- Nazlioglu, Saban, Shawkat Hammoudeh, and Rangan Gupta. 2015. Volatility transmission between Islamic and conventional equity markets: Evidence from causality-in-variance test. Applied Economics 47: 4996–5011. [Google Scholar] [CrossRef]
- Paltrinieri, Andrea, Alberto Dreassi, Milena Migliavacca, and Stefano Piserà. 2020. Islamic finance development and banking ESG scores: Evidence from a cross-country analysis. Research in International Business and Finance 51: 101100. [Google Scholar] [CrossRef]
- Peillex, Jonathan, Elias Erragragui, Mohammad Bitar, and Mohammed Benlemlih. 2019. The contribution of market movements, asset allocation and active management to Islamic equity funds’ performance. The Quarterly Review of Economics and Finance 74: 32–38. [Google Scholar] [CrossRef]
- Ramsey, James B., and Camille Lampart. 1998. Decomposition of economic relationships by timescale using wavelets. Macroeconomic Dynamics 2: 49–71. [Google Scholar] [CrossRef]
- Rizvi, Syed Aun R., and Shaista Arshad. 2014. An empirical study of Islamic equity as a better alternative during crisis using multivariate GARCH DCC. Islamic Economic Studies 130: 1–27. [Google Scholar]
- Rua, António, and Luís C. Nunes. 2009. International comovement of stock market returns: A wavelet analysis. Journal of Empirical Finance 16: 632–39. [Google Scholar] [CrossRef]
- Saâdaoui, Foued, Nader Naifar, and Mohamed S. Aldohaiman. 2017. Predictability and co-movement relationships between conventional and Islamic stock market indexes: A multiscale exploration using wavelets. Physica A: Statistical Mechanics and Its Applications 482: 552–68. [Google Scholar] [CrossRef]
- Saiti, Buerhan, Obiyathulla I. Bacha, and Mansur Masih. 2014. The diversification benefits from Islamic investment during the financial turmoil: The case for the US-based equity investors. Borsa Istanbul Review 14: 196–211. [Google Scholar] [CrossRef]
- Shahzad, Syed Jawad Hussain, Román Ferrer, Laura Ballester, and Zaghum Umar. 2017. Risk transmission between Islamic and conventional stock markets: A return and volatility spillover analysis. International Review of Financial Analysis 52: 9–26. [Google Scholar] [CrossRef]
- Sheppard, Kevin. 2002. Understanding the dynamics of equity covariance. Unpublished Manuscript. San Diego: UCSD. [Google Scholar]
- Trabelsi, Nader, and Nader Naifar. 2017. Are Islamic stock indexes exposed to systemic risk? Multivariate GARCH estimation of CoVaR. Research in International Business and Finance 42: 727–44. [Google Scholar] [CrossRef]
- Tsutsui, Yoshiro, and Kenjiro Hirayama. 2013. Are Chinese Stock Investors Watching Tokyo? International Linkage of Stock Prices Using Intraday High-Frequency Data. Japanese Journal of Monetary and Financial Economics 1: 37–57. [Google Scholar]
- Uddin, Gazi Salah, Jose Areola Hernandez, Syed Jawad Hussain Shahzad, and Seong-Min Yoon. 2018. Time-varying evidence of efficiency, decoupling, and diversification of conventional and Islamic stocks. International Review of Financial Analysis 56: 167–80. [Google Scholar] [CrossRef]
- Umar, Zaghum. 2017. Islamic vs conventional equities in a strategic asset allocation framework. Pacific-Basin Finance Journal 42: 1–10. [Google Scholar] [CrossRef]
- Usman, Muhammad, Muhammad Ali Qamar Jibran, Rafi Amir-ud-Din, and Waheed Akhter. 2019. Decoupling hypothesis of Islamic stocks: Evidence from copula CoVaR approach. Borsa Istanbul Review 19: S56–S63. [Google Scholar] [CrossRef]
- Walid, Mensi, Hammoudeh Shawkat, Ahmet Şensoy, and Seong-Min Yoon. 2015. Dynamic Correlations and Portfolio Diversification between Islamic and Conventional Sector Equity Indexes. Research Department of Borsa İstanbul Working Paper Series No.31; İstanbul: Research Department of Borsa İstanbul. [Google Scholar]
- Walkshäusl, Christian, and Sebastian Lobe. 2012. Islamic investing. Review of Financial Economics 21: 53–62. [Google Scholar] [CrossRef]
- Yilmaz, Mustafa K., Ahmet Sensoy, Kevser Ozturk, and Erk Hacihasanoglu. 2015. Cross-sectoral interactions in Islamic equity markets. Pacific-Basin Finance Journal 32: 1–20. [Google Scholar] [CrossRef]
| 1 | For details see Al Rahahleh et al. (2019). |
| 2 | For details see Jawadi et al. (2014) and Peillex et al. (2019). |
| 3 | For details, see Tsutsui and Hirayama (2013), Guimarães-Filho and Hong (2016). |
| 4 | For the superiority of daily data, see Bannigidadmath and Narayan (2016). |
| 5 | For details, see Benhmad (2013). |
| 6 | This argument is based on the Granger causality test results for the majority countries whose Islamic equity markets are not decoupled from their conventional equity markets. |
© 2020 by the authors. Licensee MDPI, Basel, Switzerland. This article is an open access article distributed under the terms and conditions of the Creative Commons Attribution (CC BY) license (http://creativecommons.org/licenses/by/4.0/).