Article

A Wavelet-Based Analysis of the Co-Movement between Sukuk Bonds and Shariah Stock Indices in the GCC Region: Implications for Risk Diversification

by
Samia Nasreen
1,
Syed Asif Ali Naqvi
2,
Aviral Kumar Tiwari
3,
Shawkat Hammoudeh
4,* and
Syed Ale Raza Shah
2
1
Department of Economics, Lahore College for Women University, Lahore 53720, Pakistan
2
Department of Economics, Government College University, Faisalabad 38000, Pakistan
3
Rajagiri Valley Campus, Rajagiri Business School, Kochi 682001, India
4
Economics and International Business, Lebow College of Business, Drexel University, Philadelphia, PA 19104, USA
*
Author to whom correspondence should be addressed.
J. Risk Financial Manag. 2020, 13(4), 63; https://doi.org/10.3390/jrfm13040063
Submission received: 11 February 2020 / Revised: 10 March 2020 / Accepted: 25 March 2020 / Published: 29 March 2020
(This article belongs to the Special Issue Modern Portfolio Theory)

Abstract

:
Investors are interested in knowing whether sukuk bonds and shariah stock indices in the Gulf Corporation Council (GCC) region are related. This study examines the connectedness between the sukuk- and shariah-compliant stock indices in the GCC financial markets. Bivariate and multivariate wavelet approaches are applied to the daily data covering the period 10 July 2008 to 15 May 2017. The empirical findings demonstrate a strong correlation between these GCC sukuk bond indices and shariah stock indices. The degree of connectedness between these sukuk and shariah stock indices varies across time and scale. A strong and positive association is observed in the short term and a negative association is evident in the long term. The same findings are observed, using the wavelet cohesion approach that also validates the existence of portfolio diversification opportunities at a short-time horizon. The multivariate cross-correlation analysis reveals that these sukuk and shariah stock markets are highly integrated across time and scale. Furthermore, the value at risk (VaR) for the sukuk bond–shariah stocks portfolio is performed to highlight the significance of the wavelet analysis. The outcomes show that portfolio stocks are variable with respect to time or scale (time diversification). Overall, analyzing the sukuk bond–shariah stock index returns in the GCC at a multiscale level makes it easier for financial agents dealing with heterogeneous trading horizons to assess the benefits of diversifications.

1. Introduction

The global Islamic financial market has shown an impressive expansion during the last decade, because of strong investment in the halal sector, infrastructure, and shariah-compliant financial instruments. Islamic banking is the largest sector in the Islamic finance industry, contributing to 71%, or USD 1.72 trillion, of the industry’s assets. Yet commercial banking remains the main contributor to the sector’s growth; the role of Islamic banking is also impressive. There were 505 Islamic banks in 2017, including 207 Islamic banking windows. Shariah-compliant assets represent a significant portion of total banking assets of the Gulf Corporation Council (GCC). While in the Middle East and North African (MENA) region, Islamic banking assets represent 14% of total banking assets. In the GCC, the market share of Islamic banking crossed the 25% threshold, which suggests that Islamic banks have become systemically important in these countries (GIFR 2019)1.
Sukuk provide an alternative mode of debt financing compared to commercial banking. These are investment certificates that represent a proportional or undivided interest in an asset or a pool of assets, and that the claim embodied in sukuk is not simply a claim to a cash flow, but an ownership claim. This differentiates sukuk from conventional bonds, as the latter offer proceeds on interest bearing securities, while sukuk are investment certificates consisting of ownership claims in a pool of assets. The main purpose of issuing sukuk is to sell an asset and recover its value from subscription, and in this case, the holder of the certificate becomes the owner of the assets. Global sukuk outstanding surged by a record 25.6% to close at USD 399.9 billion by the end of 2017, on the back of strong sovereign and multilateral issuances in key Islamic finance markets to support respective budgetary expenditures. This included debut entries into the sovereign sukuk market by Saudi Arabia and Nigeria, as well as the pan-African multilateral development finance institution, Africa Finance Corporation (GIFR 2019).
There are three main reasons that motivate our attention on Islamic financial markets. First, the issuance of shariah assets compliant with Islamic laws is the main reason for impressive growth of Islamic financial markets. Indeed, the sustained investment spending and the large domestic liquidity have likely supported the issuance of sukuk in Malaysia and GCC countries. Second, lower values of global interest rates and investors preference for bonds during turbulent periods and decline in stock markets indicate strong investor demand at all manners of Islamic financial instruments in the GCC financial market. Third, sukuk bonds and shariah stock assets have heterogeneous returns’ characteristics and they are anticipated to act contrarily from conventional stocks and bonds. Islamic shariah laws do not allow investors to engage in prohibited activities (haram), such as debt, gaming, and alcohol actions. To avoid such prohibited activities, some scholars of the Islam rules have given concessions to the firms that offer financial programs (i.e., debt, to address liquidity shortage, and investment in case of excess cash).
The upsurge in Islamic financial products has led to the corresponding expansion in the empirical literature, exploring the co-movement between sukuk–shariah stocks. However, it is necessary to distinguish between short- and long-term investments in co-movement analysis because both these investments have different objectives. This aspect becomes more important when we are dealing with foreign investors who want to diversify away risk, derive high returns from their international investment portfolios, and work under different time horizons (Aloui et al. 2015b). Candelon et al. (2008) argued that from a portfolio management perspective, the objective of short-term investment is to observe co-movement of stock returns at higher frequencies, while the long-term investment’s major concern is to observe the relationship at higher frequencies.
The current study contributes to the empirical literature by examining the connectedness and lead–lag interactive association between the sukuk- and sharia-compliant stock indices in the GCC financial markets. To this end, firstly, we employ the latest statistical and econometric techniques, i.e., the continuous wavelet transform, and various multivariate and discrete wavelet approaches to access the interactive association between the shariah stocks and the sukuk bonds in GCC financial markets. Secondly, the study performed a value at risk analysis to quantify the risk between financial assets that have not been previously estimated by most of the relevant studies. Thirdly, the study offered different interpretations of investment behavior for the policy makers to help in decision making. In previous literature, researchers have applied linear and nonlinear time-series econometric methodologies, including ARCH and GARCH class models (Aloui et al. 2015a), switching regime models (Aloui et al. 2015b), and copula methods (Naifar et al. 2016), to estimate the relevant information. Recently, wavelet techniques have revealed their ability to overcome the leading shortages of traditional time-series models, and from a financial perspective, they help in distinguishing between short- and long-run investors’ behaviors, which is more appropriate in the co-movement analysis between shariah stock and sukuk bonds. More precisely, from a portfolio diversification view, managers of Islamic portfolios are more interested in asset price co-movement at higher frequencies, while some others are interested at lower frequencies. Thus, it would be helpful for portfolio managers to resort to an appropriate frequency domain to provide a better perception of the shariah-compliant stocks and sukuk co-movement behavior at the frequency level. Furthermore, this technique provides improvement over standard approaches in terms of analysis and implications because it takes into account time and frequency jointly in a single framework when examining the co-movement between two time-series. From the implication of this approach, one can easily identify areas in a unified time–frequency band space where the two Islamic markets move together.
The general result of the study shows a strong correlation between the sukuk bond indices and shariah stock indices in the GCC region. Positive association is observed between these sukuk and shariah stocks in the short term and a negative association is found in the long term. Sukuk bond and shariah stock markets are found to be highly integrated across time and scale. The findings of the value at risk (VaR) for the sukuk bond–shariah stock index portfolio highlighted the significance of the wavelet analysis. The outcomes show that shariah portfolios are variable with respect to time or scale. This conclusion is particularly relevant for policy makers and bond issuers because the Islamic bonds are extensively growing in the GCC region. Indeed, the reason behind the issuance of Islamic assets is to assist governments and corporates to finance their investment deficits after the end of the persistently low energy price period from 1979 to 1980. Sukuk prove their worth in financing infrastructure and supporting investments in the GCC countries. In sum, it is essential for portfolio managers and sukuk issuers to understand the co-movement of sukuk indices over time and scale to better design their hedging strategies and the allocation of assets.
The remainder of the paper is structured as follows. Section 2 presents a brief review of existing studies; Section 3 describes the empirical methodology. The empirical results are presented in Section 4, and Section 5 concludes the study.

2. Literature Review

2.1. Theoretical Literature

Three criteria must be fulfilled for sukuk to be compliant with shariah rules. First, the bond must represent ownership in tangible assets or services of revenue-generating firms; second, payments to investors come from after-tax profit; third, the value prepaid at maturity may reflect the current market price of the underlying asset, not the original amount invested (Godlewski et al. 2013; Aloui et al. 2018). Recently, there has been a debate on whether sukuk are really complying with shariah or whether they are in violation with one of the aforementioned rules. Two conflicting hypotheses are branded in Islamic finance literature. The first hypothesis supports the theoretical argument regarding the relationship between conventional bonds and Islamic stocks (Aloui et al. 2015b). No doubt, the issuance of sukuk is based on Islamic principles. However, no significant difference has been expected between the announcement effect of sukuk and conventional bonds issuance on their corresponding stocks. Some scholars, such as Miller et al. (2007) and Wilson (2008), support this argument. Miller et al. (2007) claimed that there is no difference between sukuk and conventional bonds, and sukuk are structured according to western rules. Wilson (2008) argued that financial investors are making efforts to render sukuk comparable to conventional bonds, and thus unfamiliar investors can evaluate the risk of these Islamic assets.
The second hypothesis asserts that there are fundamental differences between sukuk and conventional bonds, and the former offer unique risk reduction benefits when added to a portfolio of fixed income securities and, therefore, are different from conventional bonds (Cakir and Raei 2007; Thuronyi 2007). The authors show this through a comparative analysis in terms of risk between sovereign sukuk and their conventional counter-parts, using the value-at-risk tool. They uncovered that the risk is substantially reduced when sukuk are added to a portfolio of fixed income securities and conjectured that sukuk create higher diversification profits for investors. Fathurahman and Fitriati (2013) supported this argument and show that yields on sukuk instruments is different from the yields on comparable conventional bonds in the Malaysian Islamic capital market. In the current study, we participate in this great debate by investigating the nature of co-movement between sukuk and shariah stocks in the time–frequency domain and analyze the lead–lag relationship between the two Islamic asset classes.

2.2. Empirical Literature

The literature suggests there are only limited studies that tried to calculate the co-movement and portfolio diversification for the Islamic certificates (e.g., Islamic Savings Certificate (ISC)). Most of the studies focus on the performance of sukuk and the risk–return profile from the sukuk in terms of investment. For this evidence, Zin et al. (2011) studied the sukuk bond and equity markets in Malaysia, and their results show the speculation on sukuk bonds was the supreme investment for investors seeking a fixed investment return with low risk. Similarly, Ariff and Safari (2012) present another empirical estimation related to conventional bonds and sukuk certificates, in which they tried to estimate the returns on sukuk bonds and conventional bonds. They found that there was a significant difference between sukuk and conventional bond returns. In the same year, by employing the VaR approach, Hassan et al. (2018) provided evidence of different behaviors of the sukuk and conventional bonds, and results indicated that a pure sukuk portfolio was considerably less safe than a conventional bond portfolio. This evidence was supported by another study related to issues in Islamic capital markets, the sukuk and shariah stock markets (Lahsasna and Lin 2012). Later, another study related to the theoretical and empirical estimation of the sukuk bonds compared the qualitative, rather than quantitative, research approaches (Zulkhibri 2015).
In a study related to local and global uncertainty issues, Naifar et al. (2017) found different relations between the sukuk and traditional bonds. They showed that those assets are dissimilar in term of co-movement, and that both types of bonds cannot be substituted for each other. In another study related to the long term conventional and sukuk bonds in Malaysia, Saad et al. (2018) used an inferential statistic test to assess the equality of variances for a variable calculated for two or more groups (T and Levene’s test) for the verification of the proposed hypothesis related to differences in the yield spreads between conventional bonds and sukuk. The results also supported the same trend with the view of different co-movements of sukuk and shariah bonds. In addition, there was a case study related to conventional bonds and shariah-compliant sukuk done by Khartabiel et al. (2019) who employed a multiple regression model for 12 financial markets from 2005 to 2017. They used the economic settings, pre-crisis, during the crisis, and post-crisis, using the (2007–2009) financial crisis as a benchmark. The findings of the study showed that during the crisis period, market reaction was significantly negative for both groups. While the market reaction for sukuk was significantly positive, it was insignificant for conventional bonds for the post-crisis period.
Duqi and Al-Tamimi (2019) examined the behavior of investors related to the sukuk bond investment. The study used cross-sectional data and the results show that investment in the sukuk bond was the most important factor influencing investor behavior. Likewise, Junaidi et al. (2019) analyzed the association between sukuk and endogenous growth in Indonesia using the generalized method of moments (GMM). The variables used for this analysis were the outstanding value of stocks in Indonesia, savings, economic growth, and capital flows for the Indonesian economy, and concluded that sukuk and bonds have a positive significant relationship with economic growth. In addition, in a study related to sukuk and conventional bonds that employed data from the year 2003 to 2014 and used the GMM econometric technique for the empirical estimations, Mimouni et al. (2019) revealed that development of the sukuk market was negatively related to the insolvency risk of Islamic banks (IBs), and these results are the same for conventional banks (CBs).
Likewise, Suciningtias (2019) studied the macro-economic impact on the sukuk behavior in Indonesia, using cointegration and the vector error correction model. This author considered the exchange rates, inflation, variation in world gold prices, and sukuk bonds as the independent variables. He contended that the performance of sukuk bonds was influenced by the previous exchange rate, and world gold prices. However, crude oil prices show an insignificant impact on sukuk performance both in the long and short run. In the same way, Qizam and Fong (2019) examined the financial revelation quality in the sukuk and bond markets of Indonesia, Malaysia, and Australia, using the pooled Feasible Generalized Least Square (FGLS) regression. The results indicated that the quality related to reliability was affected by the sukuk ratings rather than the bond ratings.
There are also several studies in the existing literature that used similar methodologies to estimate the co-movement of sukuk and conventional bonds, including Kristoufek (2015), Tian et al. (2016), Cai et al. (2017), Phillips and Gorse (2018), and Buriev et al. (2018). For the South Asian countries, Najeeb et al. (2015) examined portfolio diversification by employing the M-GARCH-DCC and wavelet correlation methods. The findings of their study highlighted the significance of heterogeneity in investment horizons. Abdullah et al. (2016) tried to estimate the relation between three commodities—crude oil, gold, and corn—and the Islamic stock indices of five countries (Malaysia, Thailand, Singapore, Philippines, and Indonesia) by employing wavelet coherence (WC) analysis. Aloui and Hkiri (2014) used the wavelet squared coherence to estimate the short-term and long-term dependencies between the stock market returns for the Gulf Cooperation Council economies’ bonds. They concluded that there were recurrent variations in the pattern of the co-movement for all the selected markets at higher frequencies. Kristoufek (2015), Tian et al. (2016), Cai et al. (2017), and Phillips and Gorse (2018) also applied the same methodology in their studies.
As highlighted above, shariah stocks and sukuk are different from conventional stocks and bonds. However, in the Islamic finance literature, no particular attention has been paid to analyze the connectedness between shariah stocks and sukuk in the time–frequency domain. We identify only a few studies that have focused on risk diversification, and the current study was aimed at filling this research gap. Thus, this study provides contributions to the Islamic financial market literature by investigating the co-movement and lead–lag relationship between sukuk bonds and shariah stocks by applying a different variant of the wavelet methodology.

3. Methodology

Understanding the time- and scale-varying correlations between asset returns is important for both domestic and foreign investors because it helps to design portfolio strategies against uncertainty. Domestic and foreign investors behave heterogeneously with respect to the time scale or the investment horizon. Heterogeneity in financial markets implies that true dynamic linkages between financial assets are observed only when asset prices are decomposed into various time-scales or investment horizons (In and Kim 2013). This analysis can be explained in the present study by using the continuous wavelet transform (CWT), and various multivariate and discrete wavelet approaches. Moreover, a value at risk analysis (VaR) is performed to quantify the risk between financial assets.

3.1. Continuous Wavelet Transform (CWT)

A wavelet in a layman’s terms refers to ‘small waves’ that exhibit an oscillating pattern of growth and decay in a time period which is limited in nature. A wavelet transformation function enables decomposition of a time-series into some elementary functions known as daughter wavelets ψ ι , s ( t ) , which results out of a mother wavelet ψ ( t ) . The mother wavelet ψ ( t ) may be expressed as a function of time and scale, i.e., a translation parameter τ that is a function of time, and a dilation parameter s which represents the scale that is associated with the frequency-based information. t. The wavelets can be mathematically expressed as
λ s , ι ( t ) = 1 s λ ( t ι s ) .
The normalization factor is denoted by 1 s , which ensures the comparability of wavelet transforms across time-scales.
There are certain conditions that are required of wavelets to comply with in order to become a mother wavelet ψ ( t ) (Gencay et al. 2002; Percival and Walden 2000). The conditions are listed as below:
(i) The mother wavelet must have a mean of zero λ ( t ) d t = 0 .
(ii) The square of the mother wavelet must integrate to one λ 2 ( t ) d t = 1 .
(iii) The admissibility condition 0 < C λ = 0 + | Ψ ( ω ) | 2 ω d ω < , where Ψ ( ω ) is the Fourier transformation of λ ( t ) , which stands as Ψ ( ω ) = + λ ( t ) e i w t d t . This condition permits the restoration of a time-series z ( t ) from its continuous wavelet transformation (CWT) C W z ( s , ι ) . Thus, from the wavelet-based transformation, it becomes possible to recover z ( t ) using the following formula:
z ( t ) = 1 C λ + [ + 1 s λ ( t ι s ) T z ( s , ι ) d ι ] d s s 2 .
Thus, the CWT of a time-series z ( t ) with respect to λ ( t ) is given by the following representation:
T z ( s , ι ) = z ( t ) 1 s λ * ( t ι s ) d t ,
where s is called a scaling parameter and indicates the resolution of the wavelet, ι is known as a translation parameter and shows where the wavelet is centered.
The complexity of the wavelet transform T z depends on the complexity of the wavelet function λ ( t ) . Thus, the transform is distributed into the real part [ { T z } ] , an assumed part [ I { T z } ] , and a phase tan 1 [ I { T z } ] [ { T z } ] . The complex wavelet is used to distinguish the phase and amplitude data of a given time-series. Under some regularity conditions, the given series z ( t ) can be constructed into CWT from the following formula:
z ( t ) = 1 C W λ 0 [ + T z ( s , ι ) λ ι , s ( t ) d ι d s s 2 ] .
The characteristics of a given time-series are also preserved with CWT, therefore,
z 2 = 1 C W λ 0 [ + | T z ( s , ι ) | 2 ] d ι d s s 2 .
Various shapes of wavelet, such as Morlet, Mexican Hat, symlet, and daublets, are used in literature. However, the most commonly used wavelet is the Morlet wavelet presented by Goupillaud et al. (1984) and is given by
z η ( t ) = π 1 / 4 ( e i η t e η 2 / 2 ) e t 2 / 2 .
For η 5 , the term e η 2 / 2 becomes insignificant and the Morlet wavelet is reduced to
z η ( t ) = π 1 / 4 2 e 1 2 ( 2 f η ) 2 .
The wavelet power spectra (WPS) can be used to estimate the spectral density of the time-series within a two-dimensional time scale. Torrence and Compo (1998) calculated a white and red noise WPS at each time n and scale s, as follows:
D ( | T n Z ( s ) | 2 σ p 2 p ) = 1 2 p f χ ν 2
where ν is equal to 1 for real wavelets or 2 for complex wavelets.
Following Torrence and Compo (1998), the cross-wavelet transform of two time-series y ( t ) and z ( t ) is defined as
W y z ( s , ι ) = W y ( s , ι ) W z * ( s , ι )
where W y ( s , ι ) and W z ( s , ι ) represent the CWTs of y ( t ) and z ( t ) , respectively, and the subscript * describes a complex conjugate. Cross-wavelet transform | W y z ( u , s ) | is used to calculate the cross-wavelet power.
According to Torrence and Webster (1999), the squared WC is defined as
R t 2 ( s ) = | S ( s 1 w t y z ( s ) | 2 S ( s 1 | w t y ( s ) | 2 ) . S ( s 1 | w t z ( s ) | 2 )
where R t 2 ( s ) [ 0 , 1 ] measures the local correlation in the time–frequency space and S is a smoothing operator.

3.2. Multivariate Wavelet Methods

The multivariate continuous and discrete wavelet techniques are described in this sub-section. For this purpose, firstly, we will briefly explain the wavelet cohesion of Rua (2013), that is the extension of the bivariate WC defined in the earlier segment. Then, the wavelet multiple correlation and cross-correlation measures presented by Fernandez-Macho (2012) are described in some detail. The main objective for the application of such approaches is to check the robustness of the results estimated from the bivariate framework and to evaluate in a concrete way the interdependence of the Islamic assets.

3.2.1. The Wavelet Cohesion

The wavelet cohesion developed by Rua (2010) is defined as the weighted mean of the wavelet-based measures between all possible pairs of the time-series
W C ( ι , s ) = i j ϖ i j ρ x i x j ( ι , s ) i j ϖ i j
where ϖ i j is the weight assigned to pair ( i , j ) , while ρ x i x j ( ι , s ) is the bivariate wavelet based quantification presented by Rua (2010). The unique characteristics of the wavelet cohesion is that it measures the spread of cohesion among different series at various frequencies and also examines whether such cohesion is variable across time and frequency. The value of cohesion lies between −1 and +1.

3.2.2. Wavelet Multiple Correlation (WMC) and Wavelet Multiple Cross-Correlation (WMCC)

WMC and WMCC measure the overall correlation between the series of the multivariate random variable at various time-scales. The WMC measure suggested by Fernandez-Macho (2012) is expressed as follows:
ϑ z ( ϕ j ) = c o r r ( w i j t , w ^ i j t ) = cov ( w i j t , w ^ i j t ) var ( w i j t ) var ( w ^ i j t ) .
In the above equation, var ( w i j t ) and cov ( w i j t , w ^ i j t ) are defined as
var ( w i j t ) = δ ¯ j 2 = 1 T j t = j 1 T 1 w i j t 2
cov ( w i j t , w ^ i j t ) = γ ¯ j = 1 T j t = j 1 T 1 w i j t , w ¯ i j t .
where w j t is the vector of wavelet coefficient of the scale γ j , w i j is the coefficient of determination, and w ^ i j indicates the consistent fitted values. Moreover, several wavelet coefficients are affected by the boundary related to a given wavelet filter of length L and scale ϕ j while unaffected by the boundary condition T ˜ j = T L j + 1 . Likewise, a consistent estimator of WMCC at lag p is defined as follows:
ϑ z , p ( ϕ j ) = c o r r ( w i j t , w ^ i j t + p ) = cov ( w i j t , w ^ i j t + p ) var ( w i j t ) var ( w ^ i j t + p ) .

3.2.3. Value at Risk Analysis (VaR)

VaR is the most commonly used tool to measure the risks constructed for portfolio management. For the present analysis, we assign an equal weight (1/n) to the sukuk–shariah stock indices in portfolios. The VaR at a ( 1 α ) % confidence of a (k) entity portfolio is given by
V a R ( α ) = V 0 ξ 1 ( 1 α ) θ p
where V 0 is the value of the initial investment and θ p is the square root of the total portfolio risk.
We hypothesize that the portfolio of funds is equally invested in sukuk bond–shariah stock indices. Thus, the key underlying question is how the association between sukuk and shariah stock indices impacts the VaR of the portfolio. Formally, the entire risk of a portfolio consisting of k-assets is
θ p 2 = i = 1 k ω i 2 θ i 2 + i k i j k ω i ω j cov ( r i , r j ) .
The above equation shows that the weight for asset (i) and the return of asset (i) in a portfolio are represented by ω i and r i , respectively. The above equation further describes that the total risk of a pooled portfolio is the sum of the risk of each asset and the degree of correlation between asset returns.
Following Rua and Nunes (2009), the VaR of a portfolio is firstly estimated by considering that there is an absence of association between two assets, and secondly, the VaR for the same portfolio is valued without the implication of this restriction. However, the total risk of the combined portfolio in these two cases is estimated by using Equation (17). Next, we estimated the ‘ratio of portfolio variances’ to check whether taking into consideration the association between two assets affects the corresponding portfolio’s VaR estimation. This process allows us to quantify the percentage of increase or decrease in the portfolio risk due to the co-movements between assets.

4. Data Description

In this study, we used daily data from 2009 and 2017, and the main sukuk index is the Nasdaq Dubai IdealRatings Global Sukuk Index (NISKG)2. We examined the following three sukuk sub-indices, namely, the NASDAQ Dubai IdealRatings USD GCC SUKUK index (NISKGC Index), the NASDAQ Dubai IdealRatings USD Corporate SUKUK index (NISKC Index), and the NASDAQ Dubai IdealRatings USD Financials SUKUK index (NISKF Index). Notice that the NISKGC index is issued by the Gulf Corporation Council (GCC) member states3, while the NISKC Index and the NISKF Index are issued by corporates and financial institutions, as shown in Table 1. These are the US dollar-dominated sukuk that provide accurate benchmarks against which global fixed income investors can measure their portfolio performance. These indices have added a valuable new stream of knowledge to investors’ existing trading tools that help them to make more successful short- and long-term trading decisions.
Correspondingly, the two indices of the shariah stocks, namely, the S&P GCC Composite Shariah Total Returns Index (SPSHGT Index) and the S&P GCC Composite Shariah Index (SPSHG Index) are used in the present study. Shariah stocks are designed to measure the performance of the highest dividend yielding stocks within the S&P GCC Composite Shariah Index that meet the respective liquidity, dividend growth, and dividend sustainability criteria. These indices offer a comprehensive shariah-compliant stock benchmark to the investors of the GCC region. They reflect the float defined by the foreign investment limits applicable to GCC residents, which is typically larger than that available to investors based outside the region. The detail about the composition of sukuk and shariah stocks is provided in Appendix A. The value of shariah-compliant assets is impressive in the GCC, as total assets are worth over USD 517 billion and accounted for more than 65% of global Islamic banking. In GCC, Saudi Arabia is the dominant player and 70% of the banking industry was shariah compliant in 2019, followed by Kuwait with 51%. GCC sukuk issuance has reached USD 28.3 billion by the end of 2018, 27.3% higher than the same period last year. In 2015, Saudi Arabia was the second big issuer of sukuk after Malaysia and then the UAE (GIFR 2019).
The daily data of these Islamic assets’ ranges from 10 July 2008 to 15 May 2017 was collected from the HSBC-NASDAQ sukuk database and S&P Dow Jones Indices database. We used daily data because it may better capture the interaction between sukuk and shariah stocks than weekly or monthly data. The use of weekly data induces potential biases arising from the bid-ask effects, the nonsynchronous trading days, and the effects of illiquid asset prices. Monthly data are not subject to volatility transmission mechanisms due to time aggregation and strong compensation effects for the positive and negative shocks (Batten et al. 2010).

5. Empirical Findings and Discussion

5.1. The Wavelet Coherence (WC) Analysis

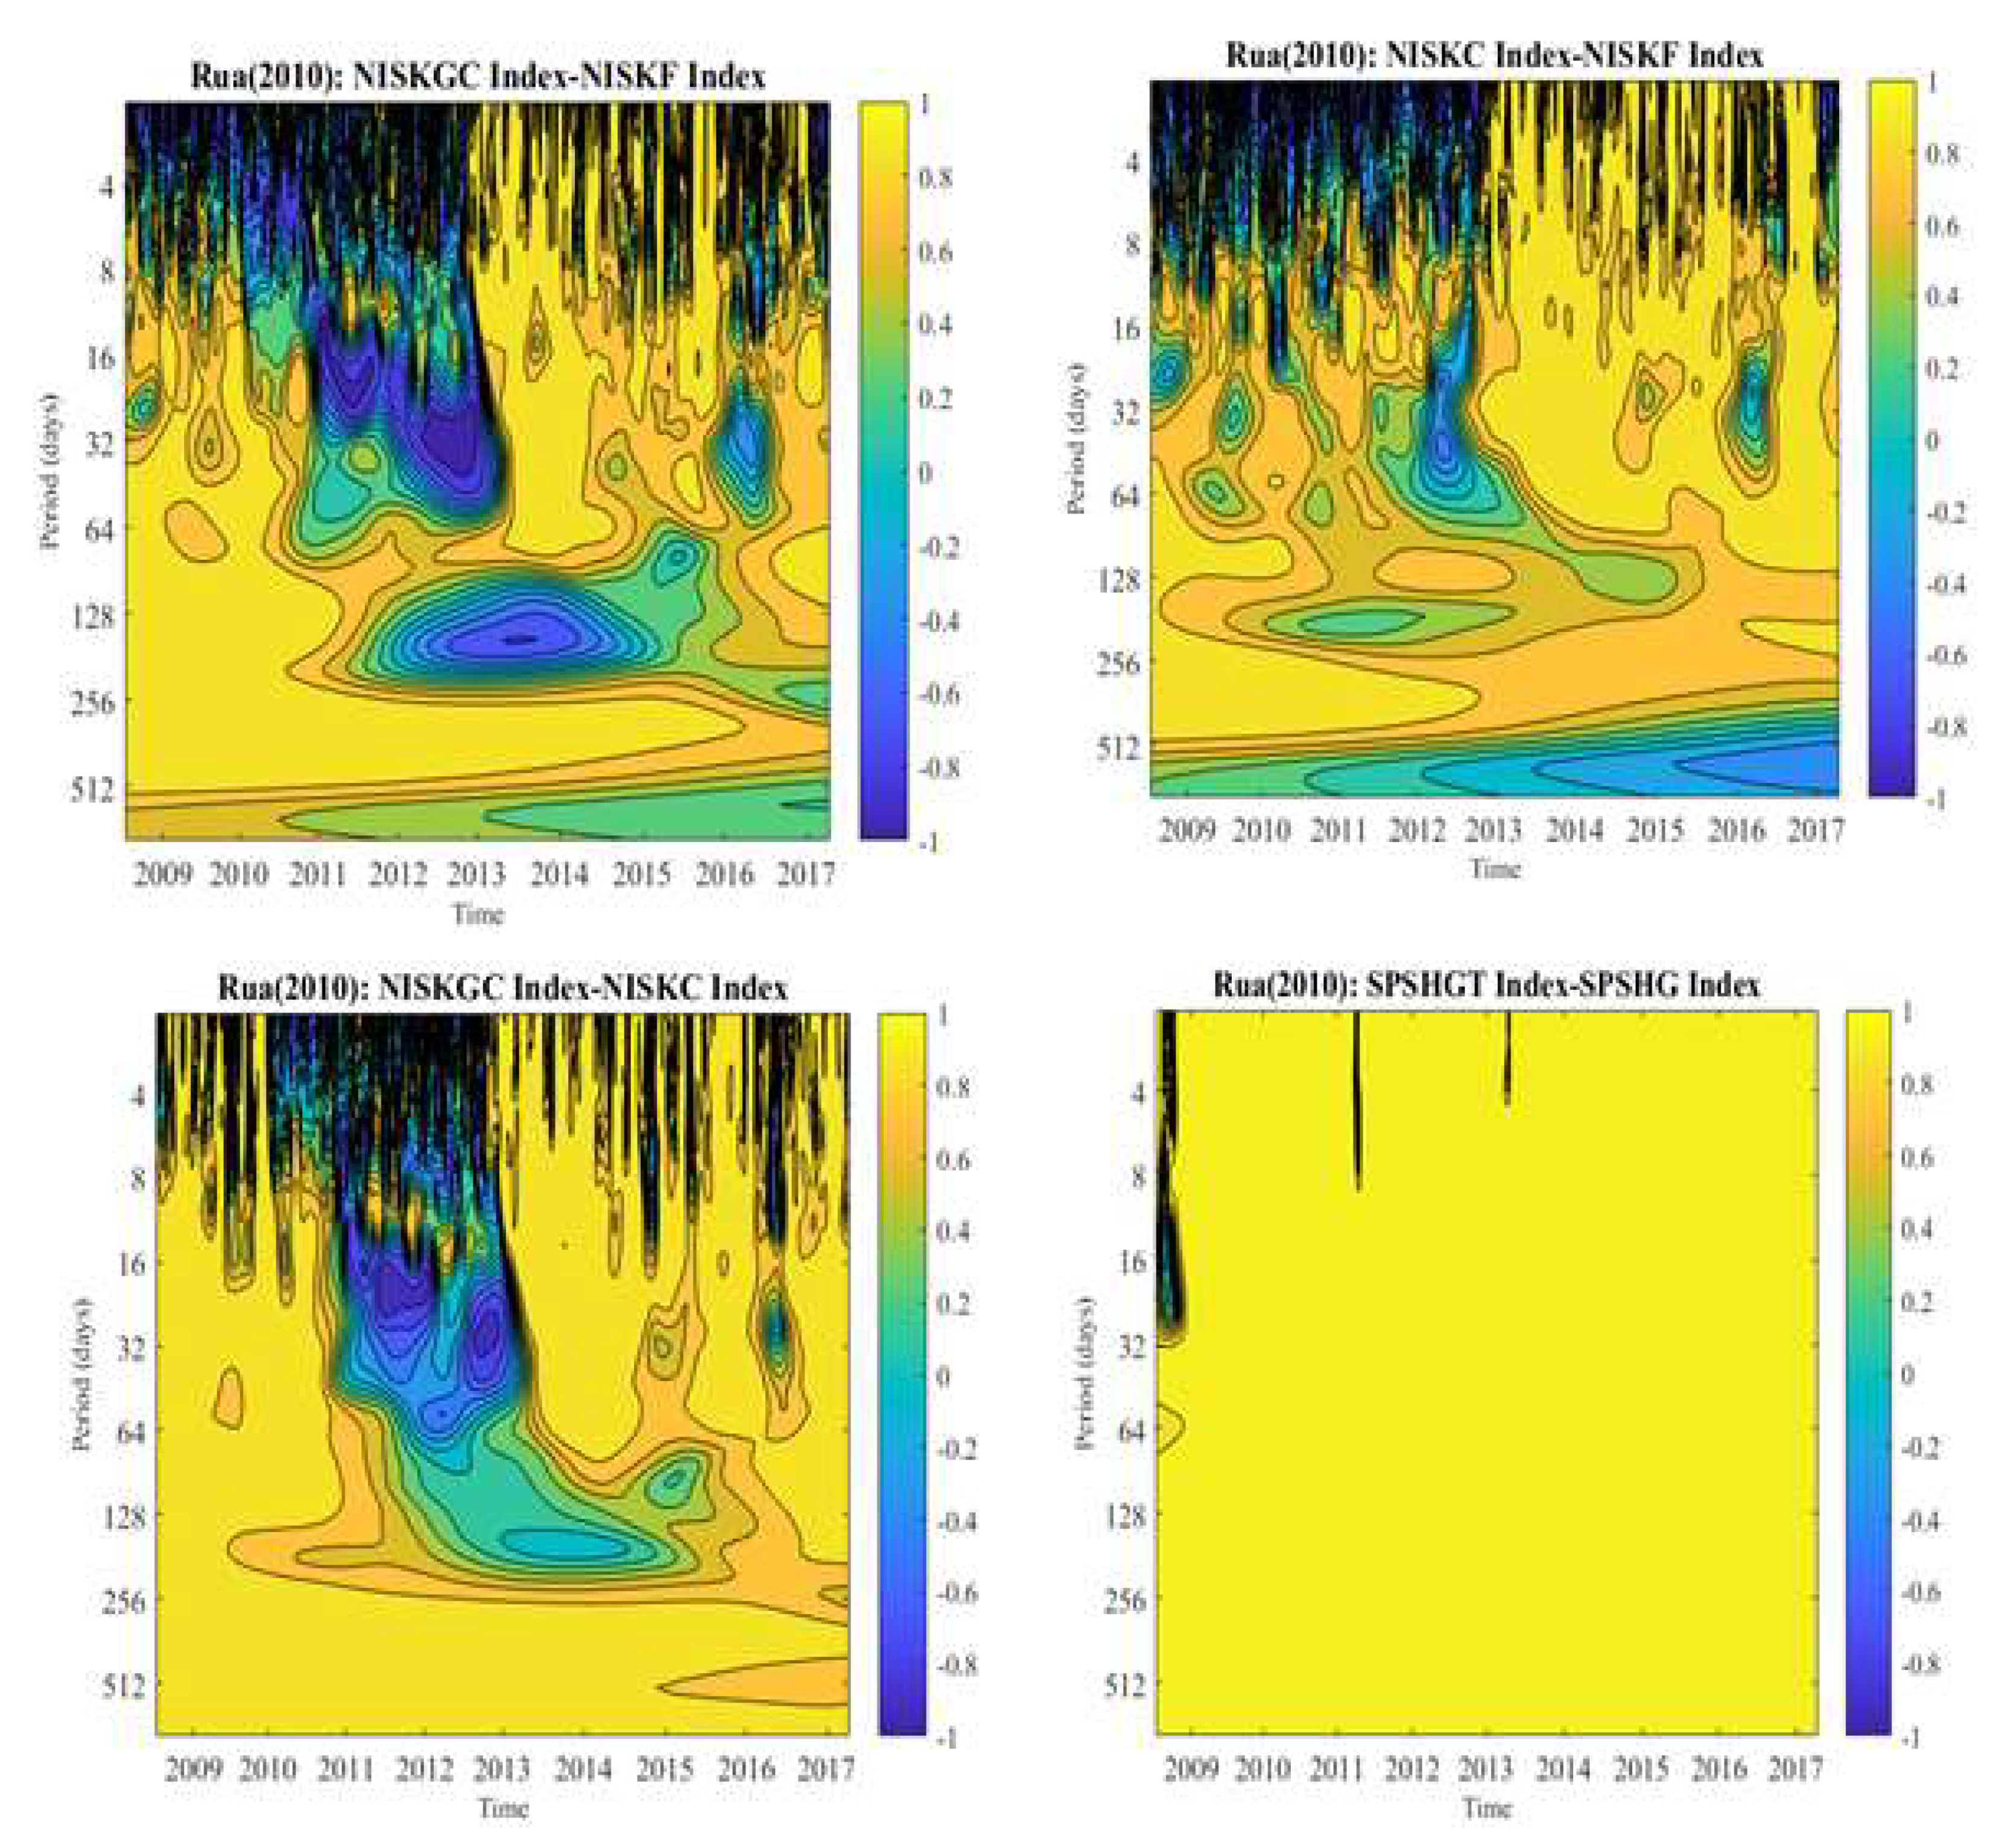
5.1.1. Co-Movement between Sukuk Sub-Indices and between Shariah Stocks

The WCs between the three sukuk bond sub-index pairs: the NISKGC index and NISKC Index; the NISKGC index and NISKF Index; the NISKC Index and NISKF Index as well as for pairs of the sukuk sub-indices and the two shariah stock indices: the SPSHGT Index and SPSHG Index, and pairs of shariah stock indices are displayed through four contour plots, as shown in Figure 1. The visual inspection of these plots underscores the strong positive correlation between those sukuk sub-indices and between the shariah stock indices from the whole sample period as the outcome showed more yellow islands (a high level of coherence) in the diagrams. In addition, a high positive correlation is depicted between the sukuk pairs at lower frequencies and negative correlations at higher frequencies. However, a substantial variation is observed in the pattern of the correlation between the sukuk sub-indices at various time horizons. We can observe a substantial part of the blue islands (negative correlations) at higher frequencies during the sample period 2009 to the end of 2013. This is the period followed the end of the financial crisis and investors have considered short-term co-movement to seize better diversification opportunities during this period. The degree of correlation is high, especially at the lower frequencies, between all the sukuk sub-index pairs after the end of 2013.
These findings are inconsistent with the argument raised by Fleming et al. (1998) and Akhtar et al. (2017) that particular characteristics of individual Islamic financial markets may reduce the collaborative linkage between these Islamic assets. We notice that the reduced set of shared information and the low degree of cross-market hedging, as well as prohibition of arbitrage and speculation under shariah law, have no significant effect on the co-movement between these Islamic assets.

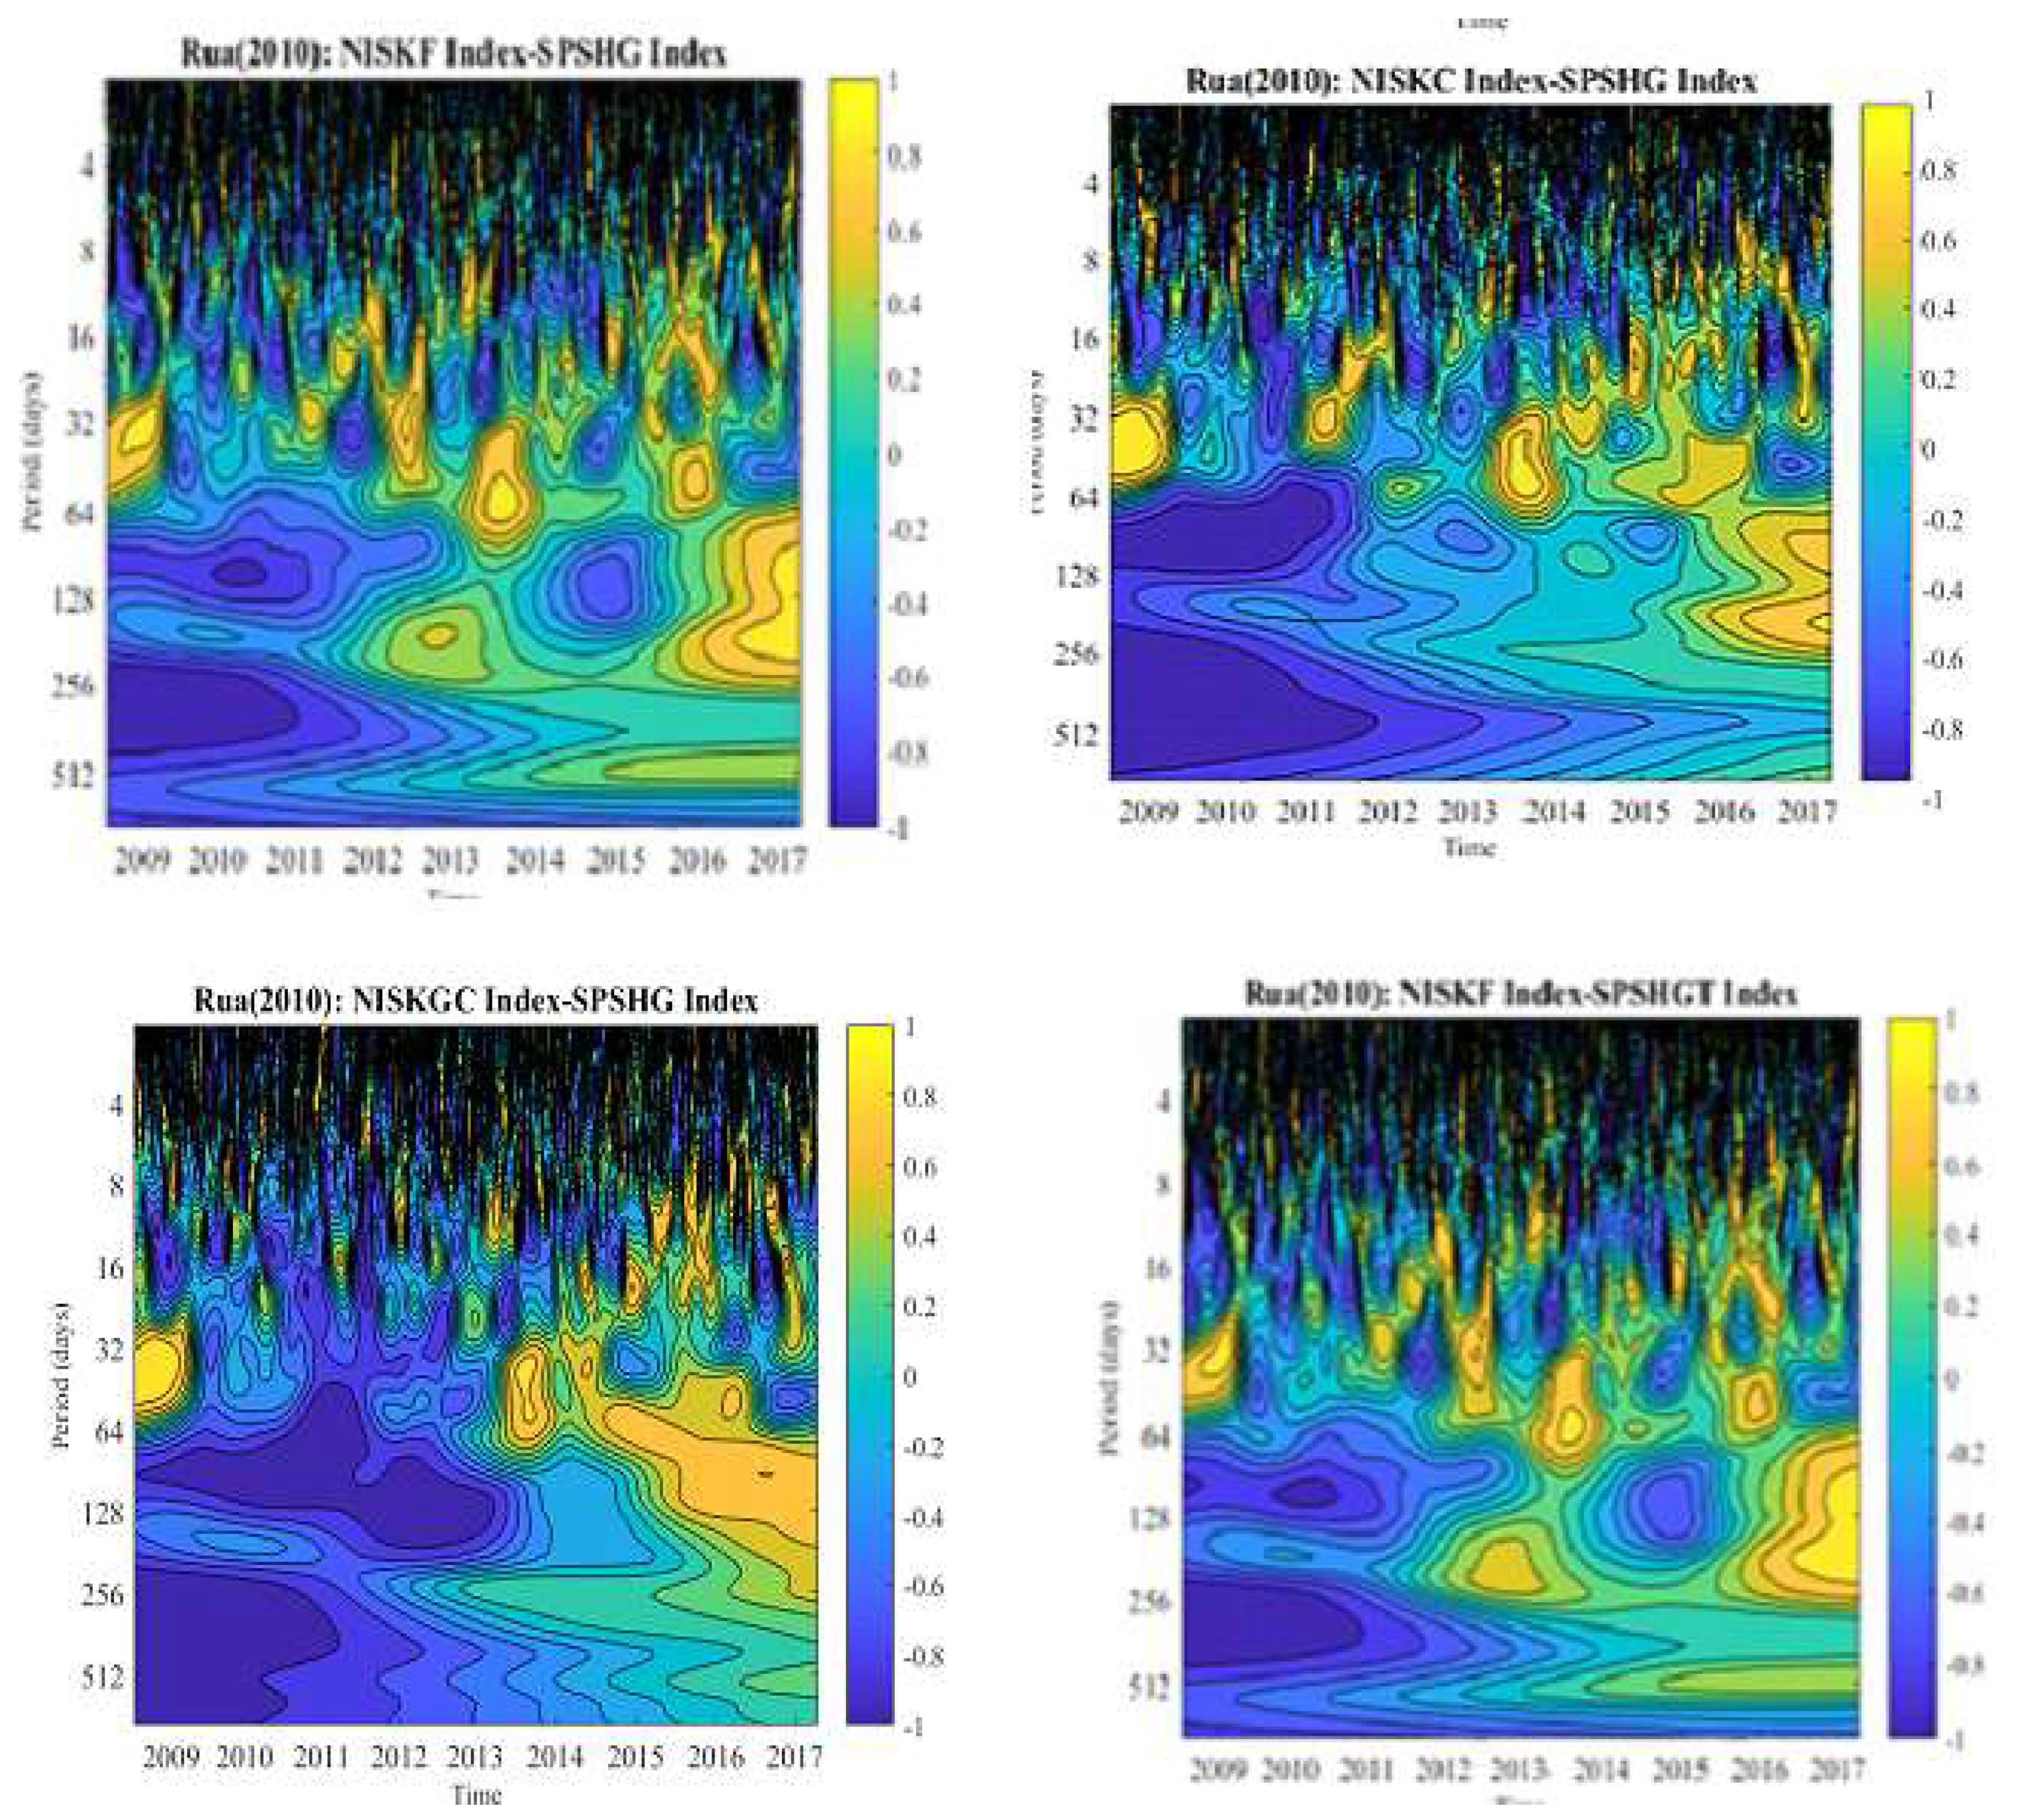
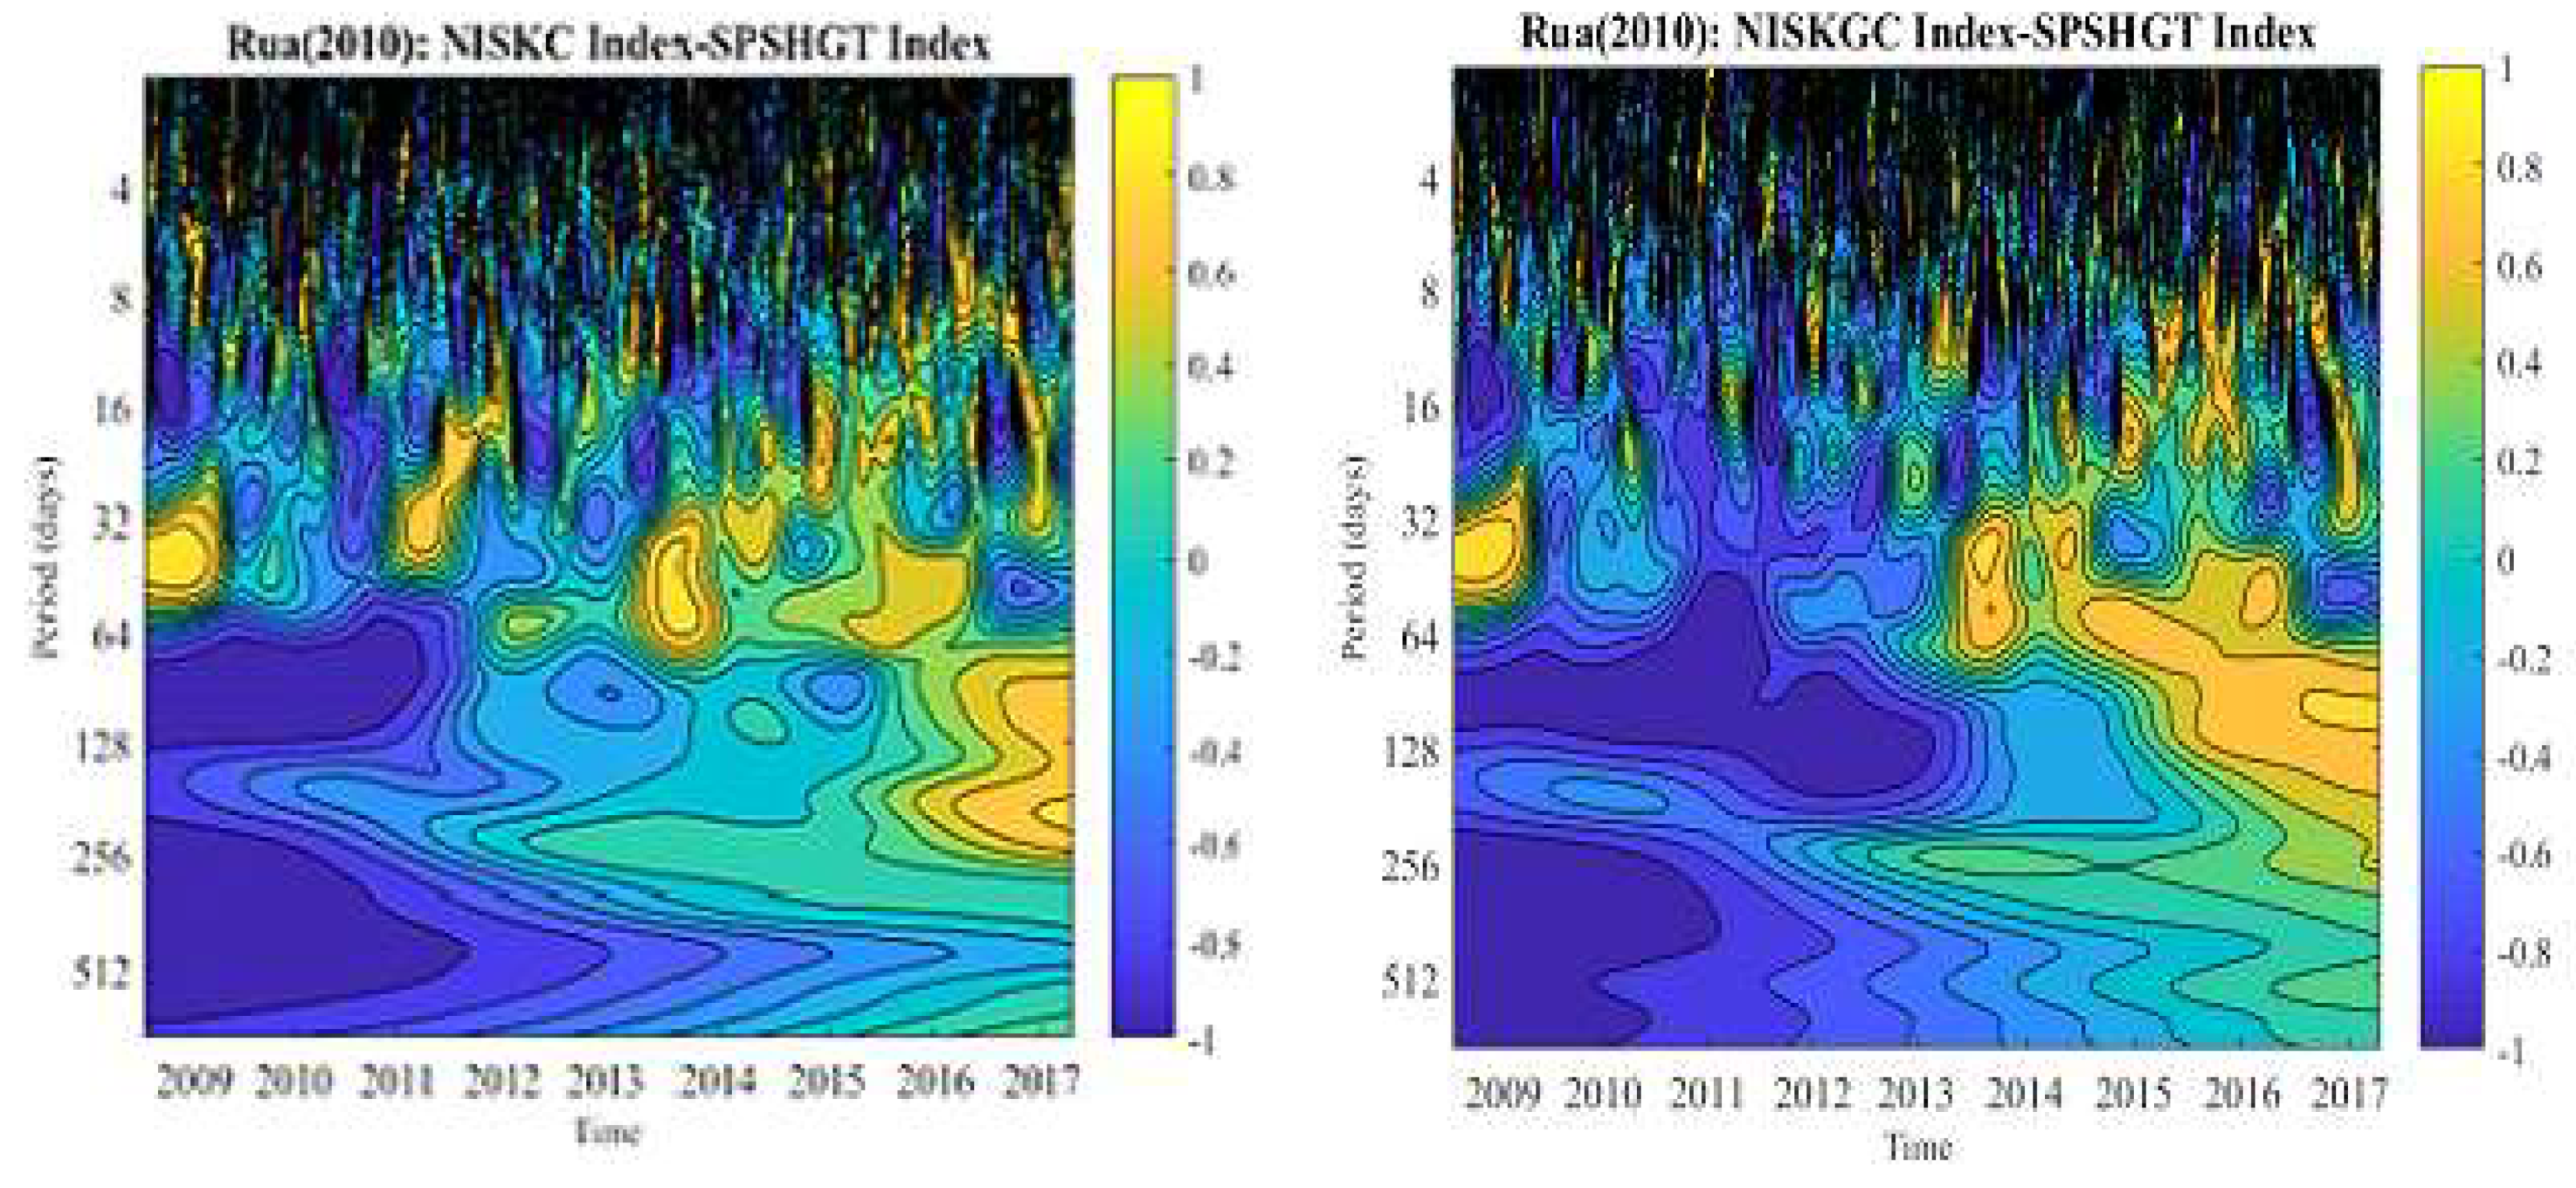
5.1.2. Co-Movement between Sukuk Sub-Indices and Shariah Stocks

Figure 2 displays the WC plots between the pairs of the sukuk sub-indices and the shariah stock indices. A number of conclusions can be predicted from these plots. First, a strong negative association is observed between the sukuk sub-indices and the shariah stock indices at low frequencies (long-time horizon) during the period under study. This result implies that it is beneficial for investors that are interested in investing in the GCC asset market to check diversification opportunities over a long period of time when designing their portfolios. This outcome is consistent with the finding of Aloui et al. (2018). Second, the movement between the sukuk sub-indices and the shariah stock indices varies across time and frequencies. This result supports the argument that investors are heterogenous, i.e., their investment decisions are time-varying.
Following this argument, Kim and In (2010) pointed out that investors perceive that there is less probability of risk in the stocks than the bonds in the long-term investment horizon, which supports the idea of ‘time diversification’. Further, some disparities can be seen in the link between the sukuk and shariah stocks. For example, a variation in the pattern of association is clearly seen during the start of the period 2008–2009, which corresponds to global financial turmoil. The degree of correlation is negative (−0.2), but it turns out to be positive (0.6) between 60 to 32 trading days. A similar pattern of the correlation is observed at the end of sample period 2016–2017 and between 256 to 64 trading days. However, the degree of correlation decreases after the end of 2010. Further, another portion of the negative correlation between the financial sukuk and shariah stock indices is observed at the medium to lower frequencies, ranging between 65 to 512 days during the period 2008–2012.
In contrast, the plots of the corporate sukuk/shariah stock indices and the global sukuk/shariah stock indices show a negative correlation during the whole sample period from the medium- to short-term frequencies. From these results, it can be noted that the structure of Islamic asset markets has an insignificant impact in explaining the dynamic linkages between the shariah stock and sukuk in the GCC markets. Almost similar outcomes are observed for the association between the shariah stock returns and the sukuk indices.
The above-mentioned findings derived from the WC analysis provide various practical suggestions to portfolio investors, banks, and Islamic funds. First, the varying co-movement between the sukuk–shariah stocks over time and frequency suggests that benefits received from portfolio diversification are strongly integrated with investment horizons and time-scales, and investors should consider these two dimensions when designing their hedging strategies.
Second, the variability in the connection between the shariah stocks and sukuk with respect to the time and frequency domain suggests that investors should consider both time and frequency in the prediction of forecasts. In this respect, Aloui et al. (2015a) hypothesized that rational investors may not predict weak correlations between assets at a particular point in time. However, they formulate long-term predictions regarding the potential benefits of portfolio diversification. Our results are supported by the conclusion of Naifar et al. (2016) and Aloui et al. (2018) regarding the strong dependence structure between the sukuk yields and shariah stock indices. However, our outcomes are contradictory to those of Dewandaru et al. (2014), which signify the role of the shariah stocks over the sukuk in both the short-term and long-term investment periods.

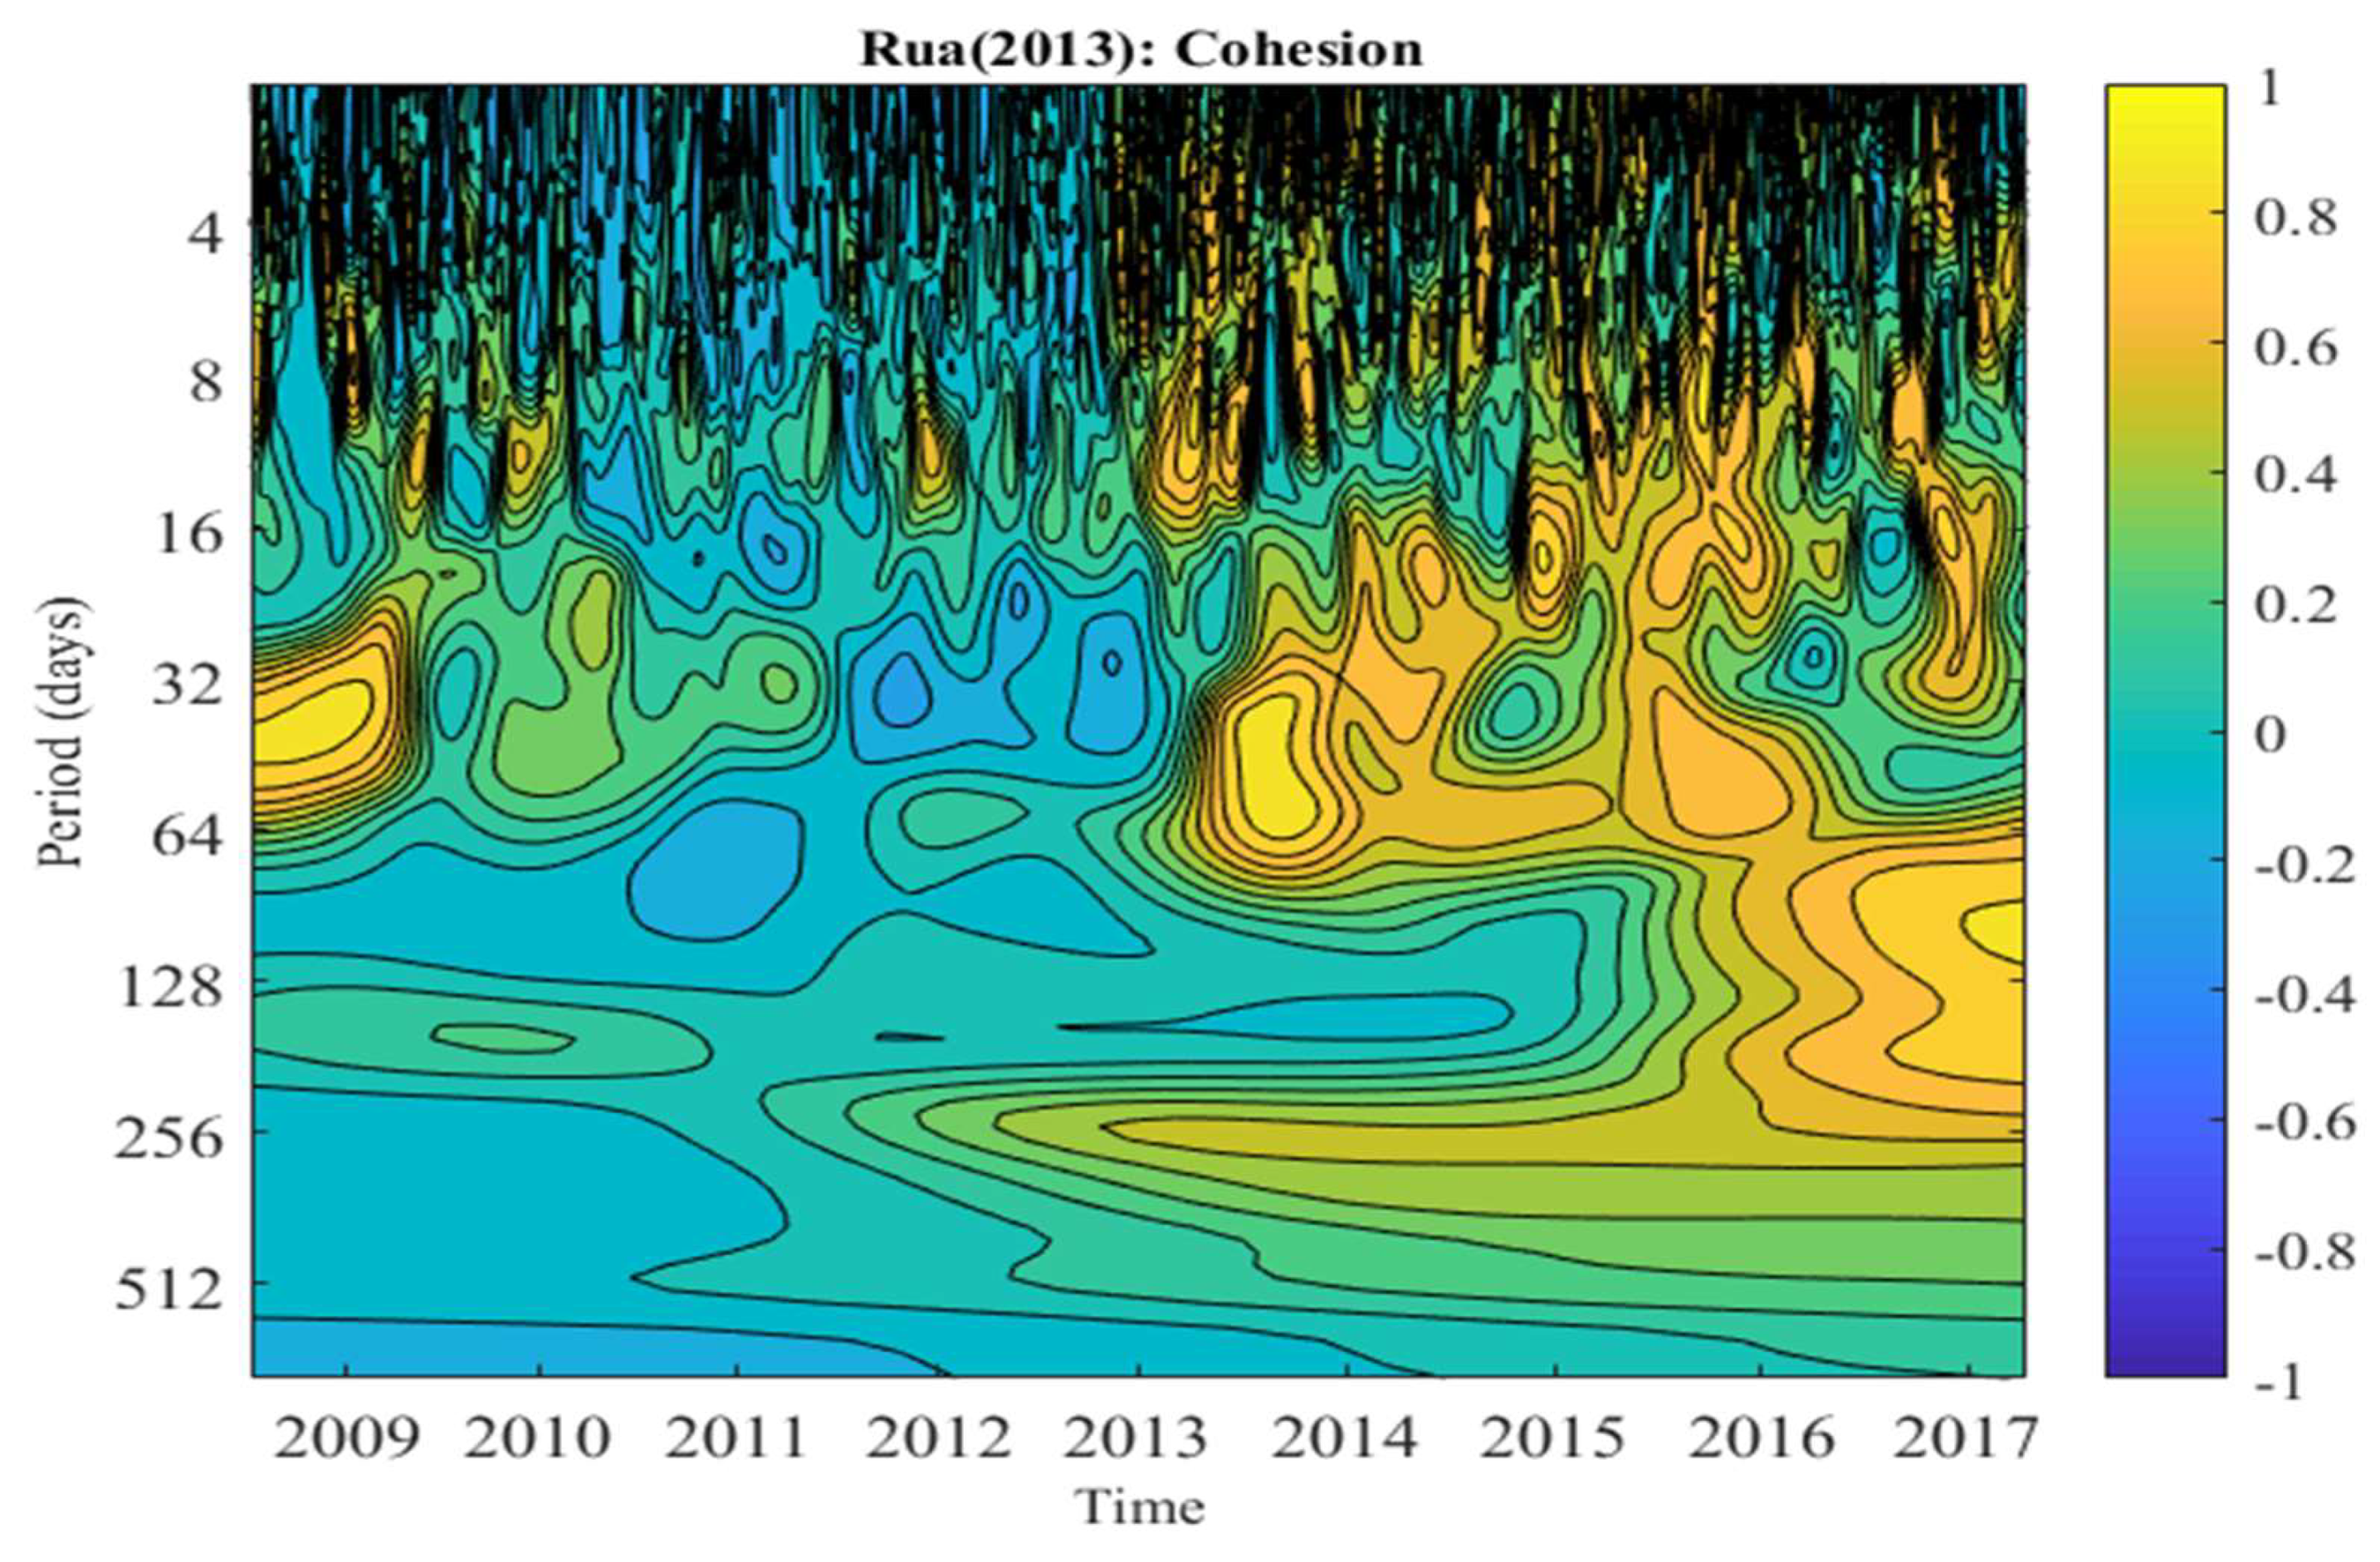
5.2. Wavelet Cohesion Analysis

Figure 3 plots the wavelet cohesion between the sukuk sub-indices and the shariah stock indices. It is clear from this figure that the co-movement pattern of the sukuk–shariah stocks is variable with respect to time and scale. The degree of correlation differs from high frequency to low frequency. At the high frequency (between 2 to 15 days), a series of detached small vortices with color that changes from blue to yellow are clearly seen. These incongruities imply a strong positive correlation that influences their peaks when the color spectrum is dominated by the yellow color. These vortices are sharply dispersed through the whole sample period, reflecting the continuum of adjustments in the Islamic capital markets across the time scale.
Three big vortices are clearly visible, as we move from the medium term to the lower frequencies. The first one is located at the beginning of the sample period and between 32 to 64 days, indicating that sukuk and shariah stocks change in the same direction (indicated by the yellow color of the vortices). The second vortices appear between the mid of 2009 to 2011 and at the medium term frequency, ranging between 20 to 60 days, thereby implying that the co-movement between the sukuk and shariah stocks start to dislocate from each other (i.e., the dominant color is blue yellow showing a correlation of about 0.2). A third zone appears between 2012 to the end of the sample period, and a dominant yellow color describes the same direction of the co-movement between sukuk and shariah stocks in the Islamic financial markets.
Finally, at the lowest frequencies, an inverse direction of co-movement is observed over the whole sample period since the dominant color is blue. In general, the result of the wavelet cohesion supports the findings of the bivariate coherence method, that is, in both methods the varying degree of correlation in both assets and the co-existence of the positive versus negative correlations. We prefer the wavelet cohesion method because it describes the multivariate dimensions of the co-movement, and thus, represents a more accurate pattern of the co-movement within the selected Islamic financial assets.
The results of wavelet cohesion corroborate the hypothesis of heterogenous behavior of investors who make asset allocation decisions for various time horizons and operate for different time-scales. This result has strong implications on the portfolio asset allocation decisions and asset pricing theory. For asset pricing theory, it may offer alternative interpretations of investment behavior from that of the traditional capital asset pricing model (CAPM) and market efficiency. In this perspective, using the wavelet approach, Chen and Li (2016) stated the heterogenous behavior of investors and explained that market trading could be separated into segments, each corresponding to different investment horizons. This result may explain the co-existence of multiple security market lines. For the asset allocation decisions, In et al. (2011) adopt the wavelet methodology to investigate how the investment horizon affects portfolio allocation. The authors show that for portfolios combining bonds, and value and growth stocks, the weight of stocks should be increased as the investment horizon increases (In et al. 2011).

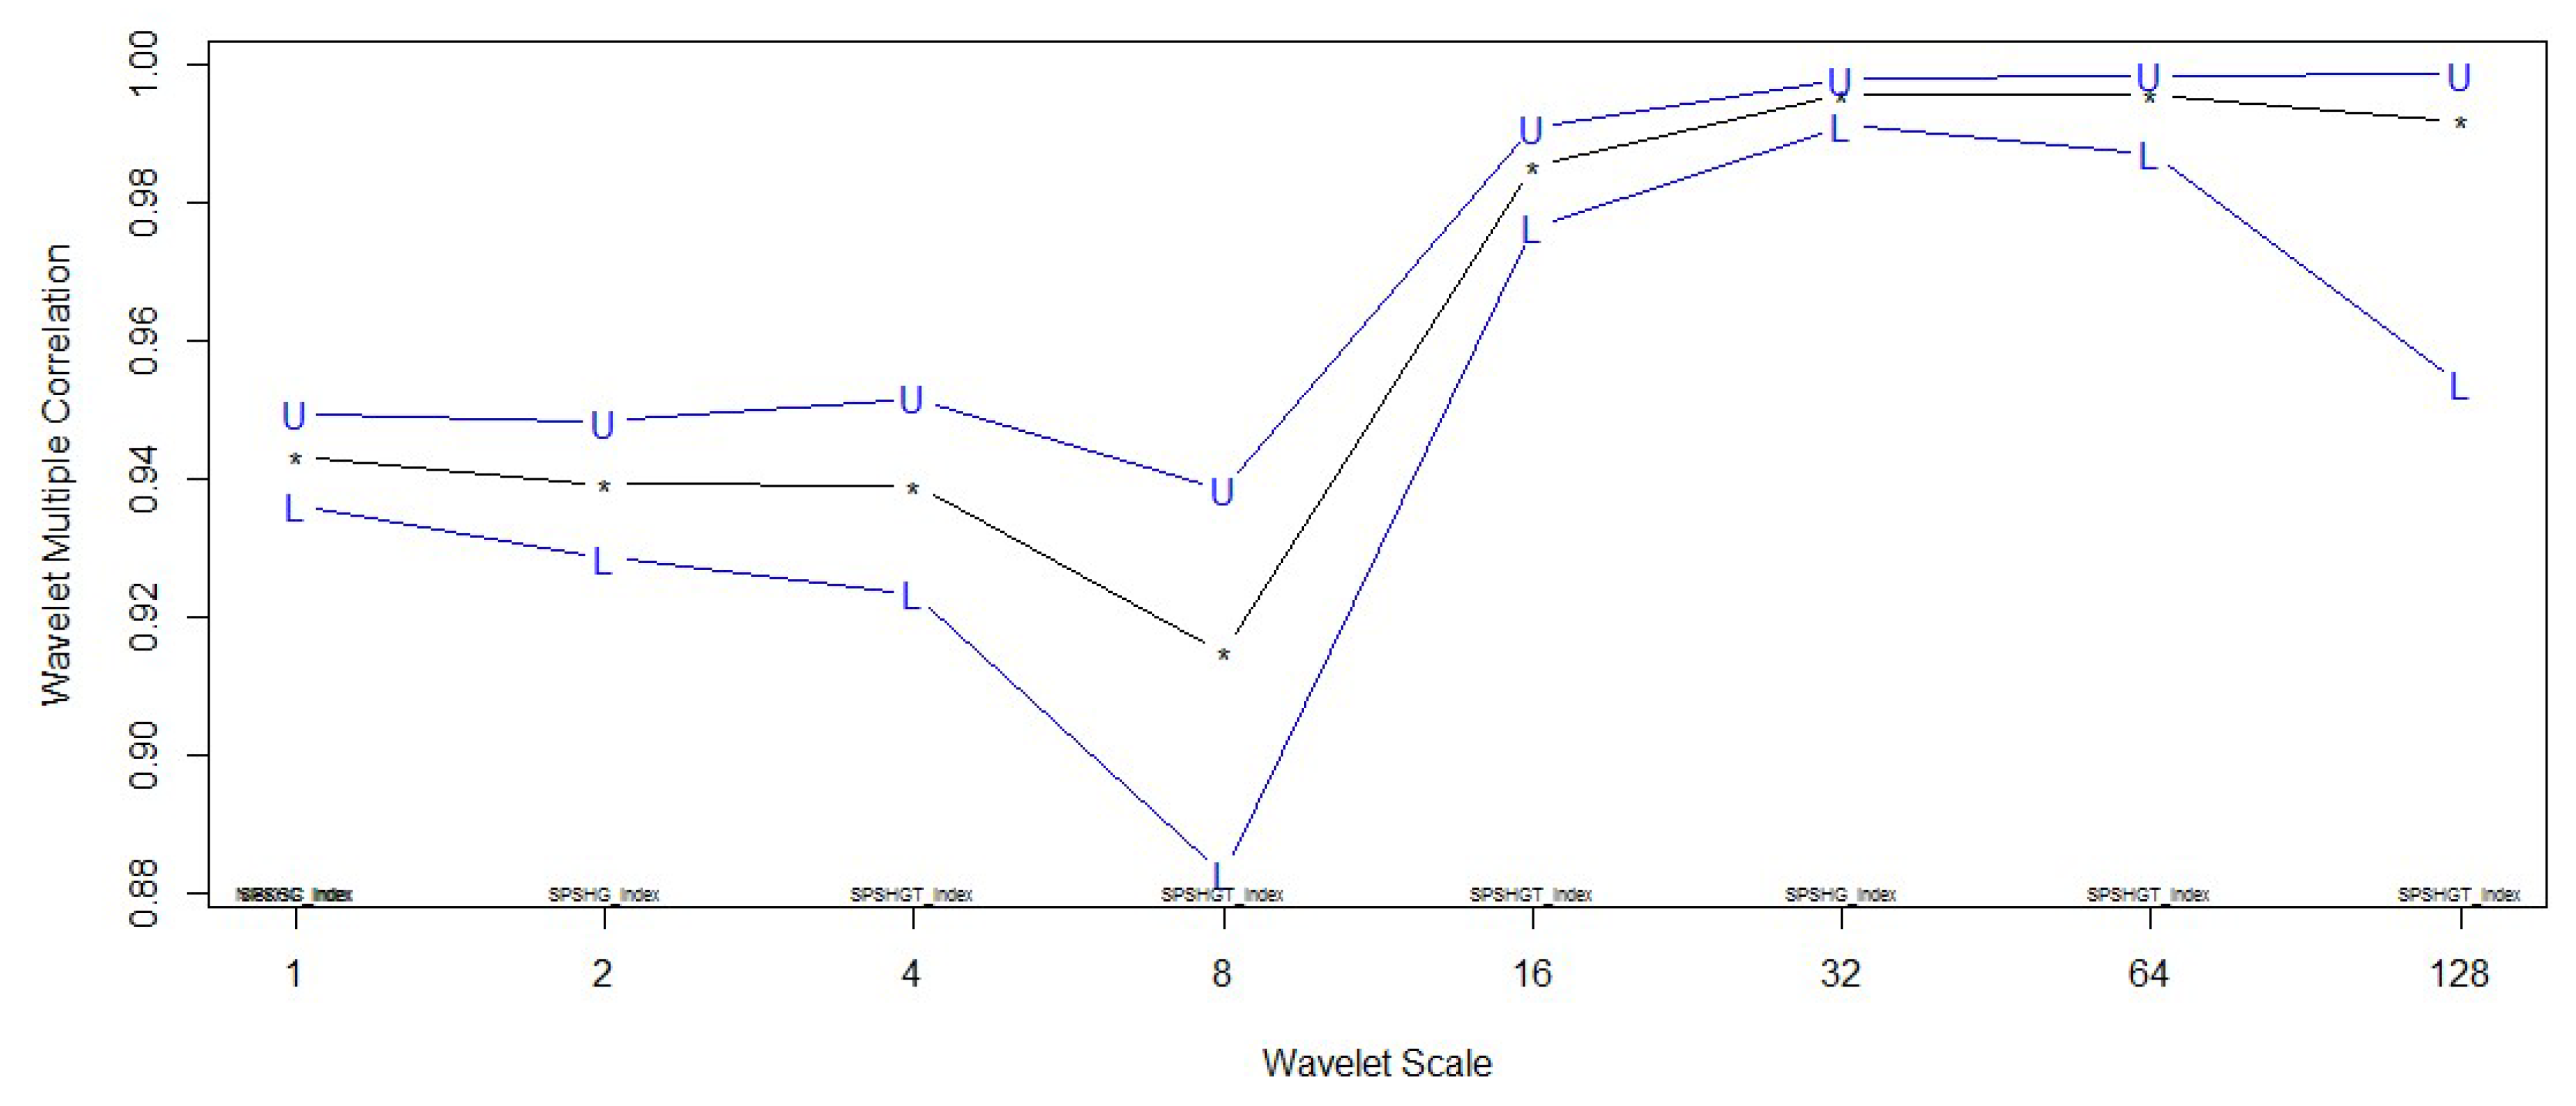
5.3. Wavelet Multiple Correlation Analysis

Figure 4 shows the plot of the wavelet multiple correlation (WMC) between the sukuk and the shariah stock indices. The visual inspection of plots shows that the pattern of the multiple correlation significantly changes with the increase in the time scale. The multiple correlation starts with a level of 0.94 and then converges to its limiting value of 0.88 for a time scale of 8 trading days. The low level of the multiple correlation implies a high level of divergence between the sukuk and shariah stock indices and both may unify at short-time horizons. Such a weak multiple correlation may enhance the ability of financial managers to benefit from their diversification at short-time horizons. Further, we note that the multiple correlation increases when the time scale exceeds 8 trading days and converges to the level of 1.00. Thus, there is the possibility that the benefit of diversification may become less important at long-time horizons (time diversification). In other words, the discrepancies between the sukuk and the shariah stocks tend to decrease from the medium- to the long-time horizons, and this may be due to the heterogenous nature of the Islamic financial markets (Kim and In 2007; Aloui et al. 2018). Our results are inconsistent with the findings of Yang (2005) which show that international diversification benefits can be gained for investors with long-term investment horizons and passive management strategies for their bond investments. Another study, conducted by Paltrinieri et al. (2015), analyzed the diversification opportunities for fixed-income investors and advises that sukuk could provide institutional investors with benefits, especially in the long run, because no significant relationship was found with sovereign exposure. In a recent study, Bhuiyan et al. (2019) found attractive opportunities in terms of diversification benefits, with credit quality and shariah-compliant financial sector exposure for investors who want to invest in fixed-income securities. Thus, our results are similar to the outcome of Kim and In (2007) and Aloui et al. (2018), and contradictory to the findings of Yang (2005), Paltrinieri et al. (2015), and Bhuiyan et al. (2019).

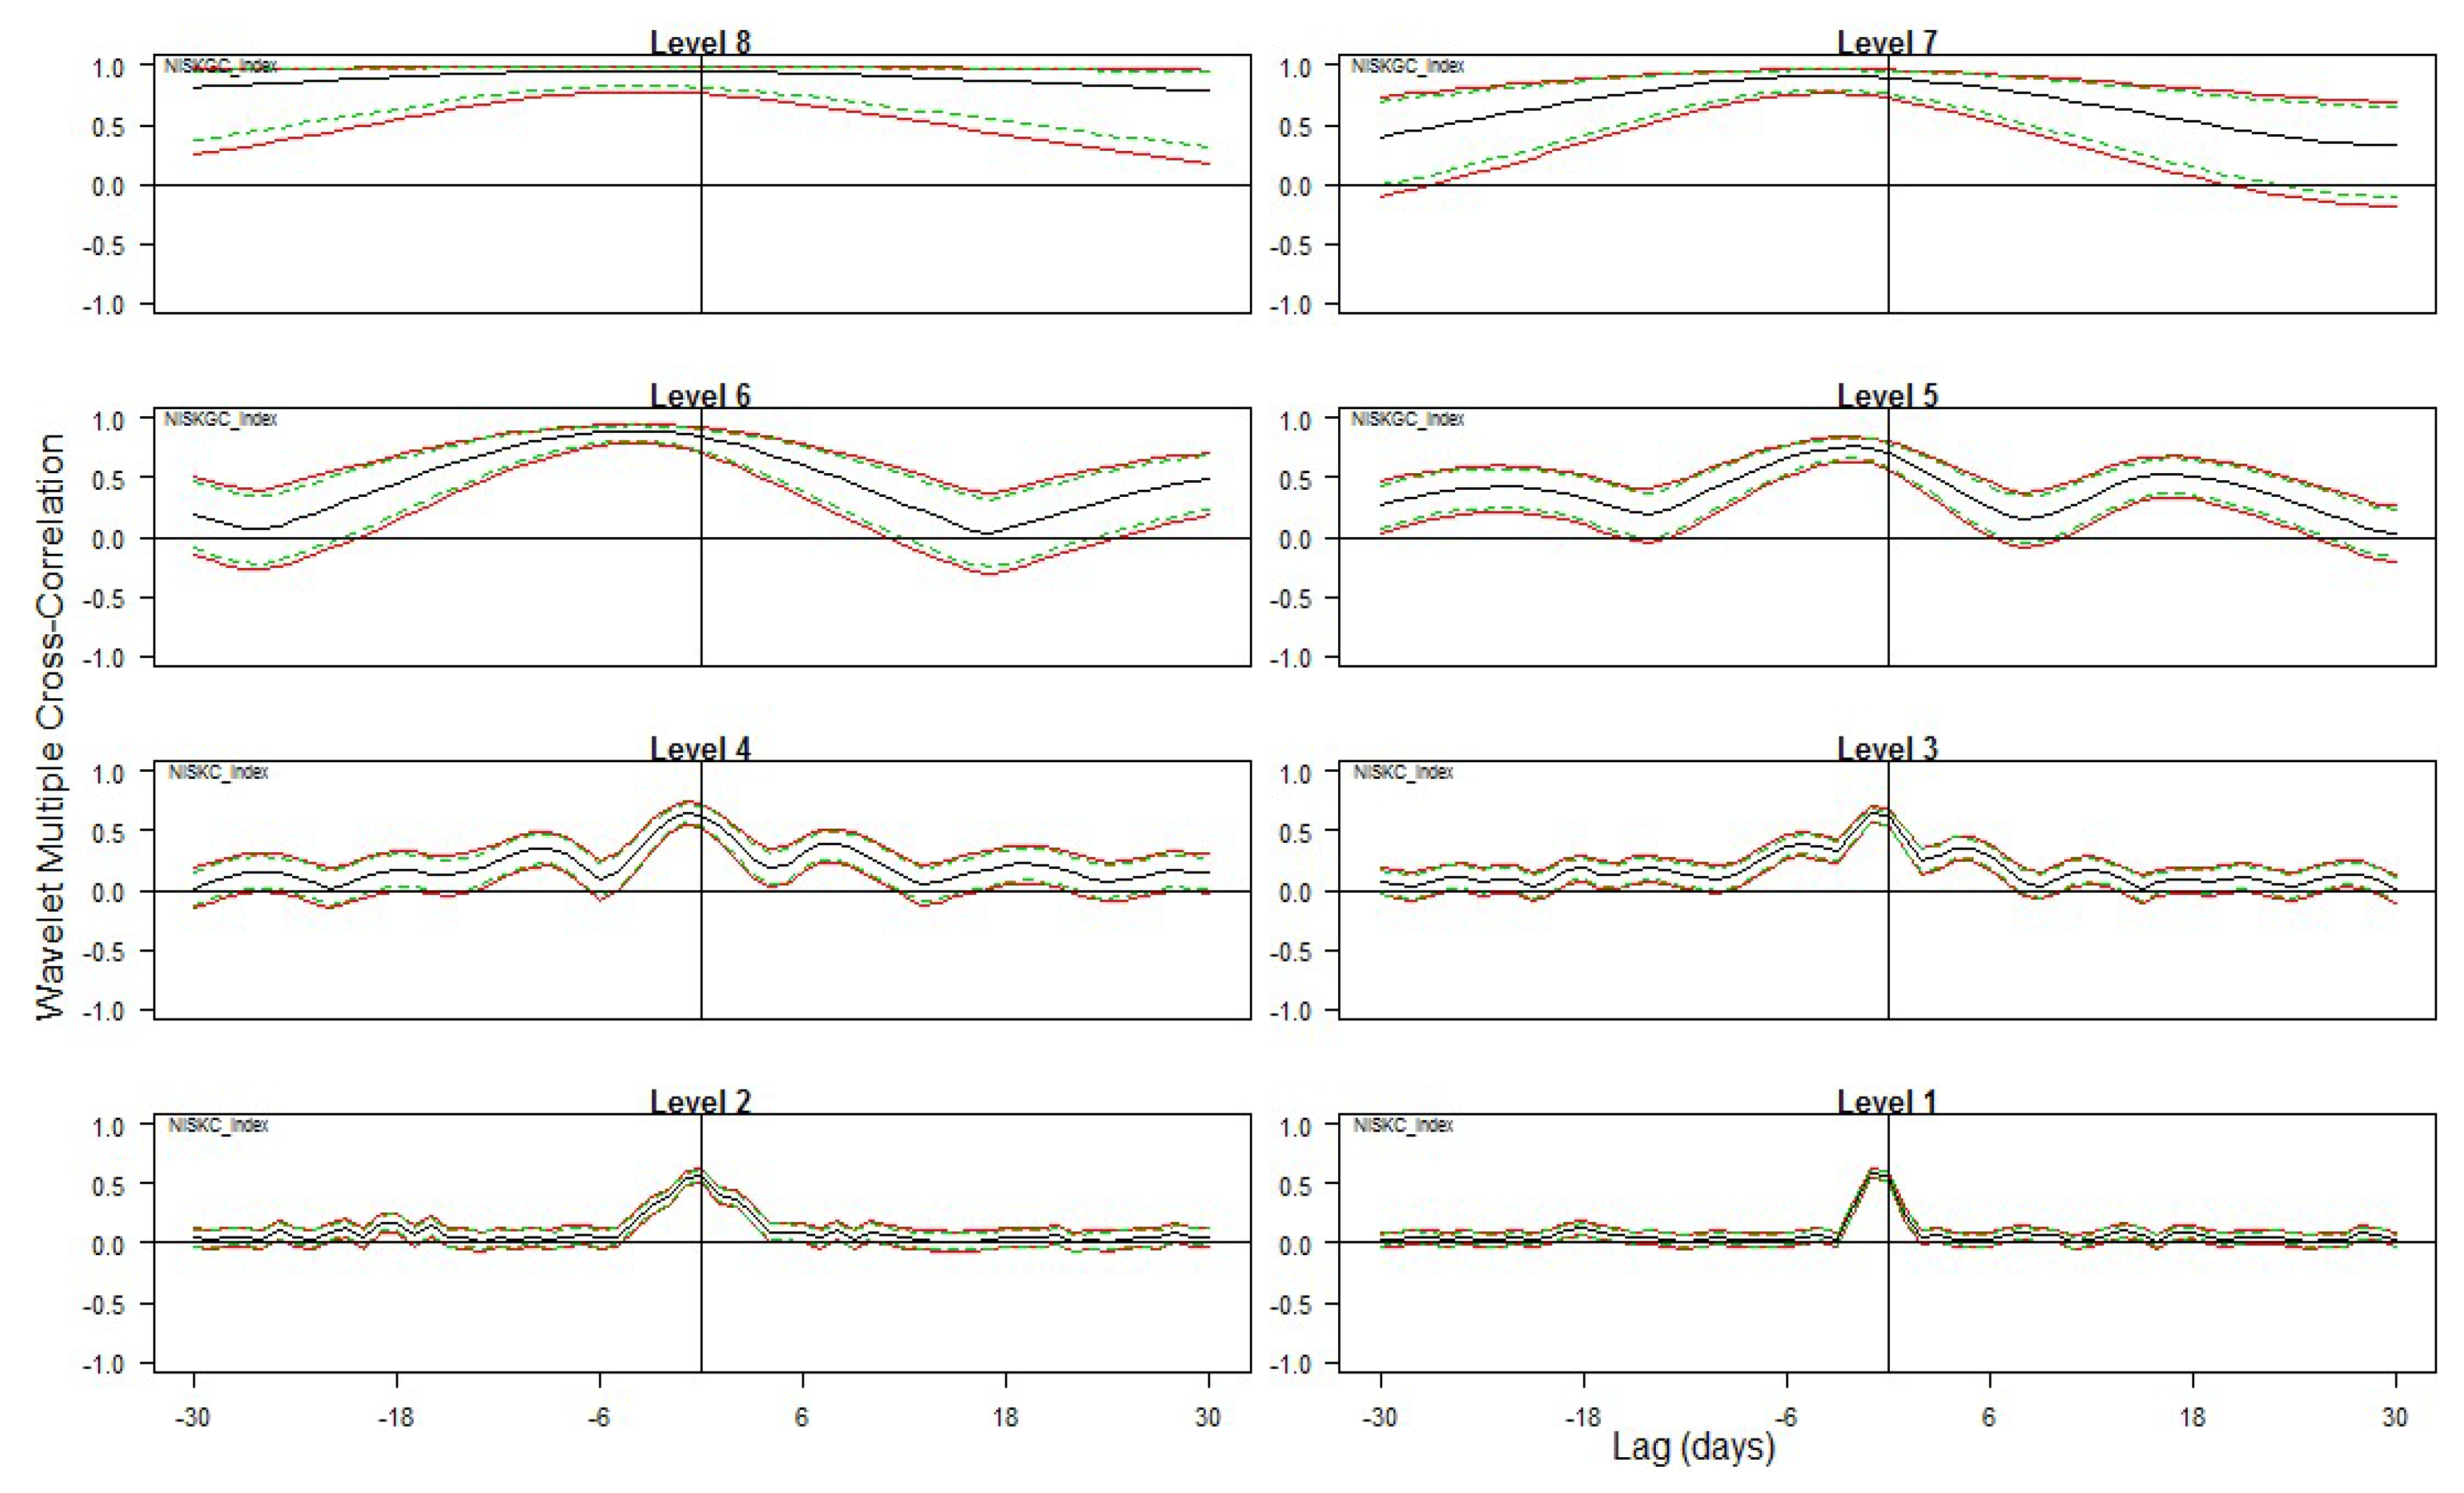
5.4. Wavelet Multiple Cross-Correlation Analysis (WMCC)

This analysis with lags and leads up to 30 units is displayed in Figure 5. The WMCC plots are perfectly symmetrical, which implies that the lead/lag relationship between the sukuk–shariah stock indices have equal forces, irrespective of the time-scale. The cross-correlation is not significantly different from zero at Levels 1 and 2, which signals a weak cross-correlation between the Islamic stock indices in the short run. However, the cross-correlation is slightly increased at Levels 3, 4, and 5 (in the middle run). At Levels 6 to 7, the cross-correlation is clearly discernible, irrespective of positive lags between 18 to 20 days. At Level 8, the cross-correlations reach their maximum level of unity. Thus, we can say that selected markets are fully connected in the long run as signified by Fernandez-Macho (2012) with respect to conventional markets. In other words, WMCC justifies the homogeneity in Islamic assets and proves that the Islamic financial markets are fully integrated. The results further pointed out the fact that the shariah stock and the sukuk markets followed the same trading rules, regardless of the heterogeneity in their investment horizons. Furthermore, the integration in the Islamic financial markets indicates that these markets share common disturbances and these type of assets may not be considered valuable against the inherent risks. The homogenous relation between the shariah stocks and the sukuk intensifies the importance of the neighborhood effect of Haile and Pozo (2008) among the Gulf countries. More specifically, the evidence of WMCC coincides with the results of the wavelet cohesion but is not very similar to the WC approach. Thus, our basic emphasis is on the Fernandez-Macho (2012) multivariate wavelet approach because it has the advantage of finding the key drivers of similarities in the Islamic financial market through time-scales, and thus, allows one to detect the lead/lag impact of the shariah stocks and the sukuk indices.

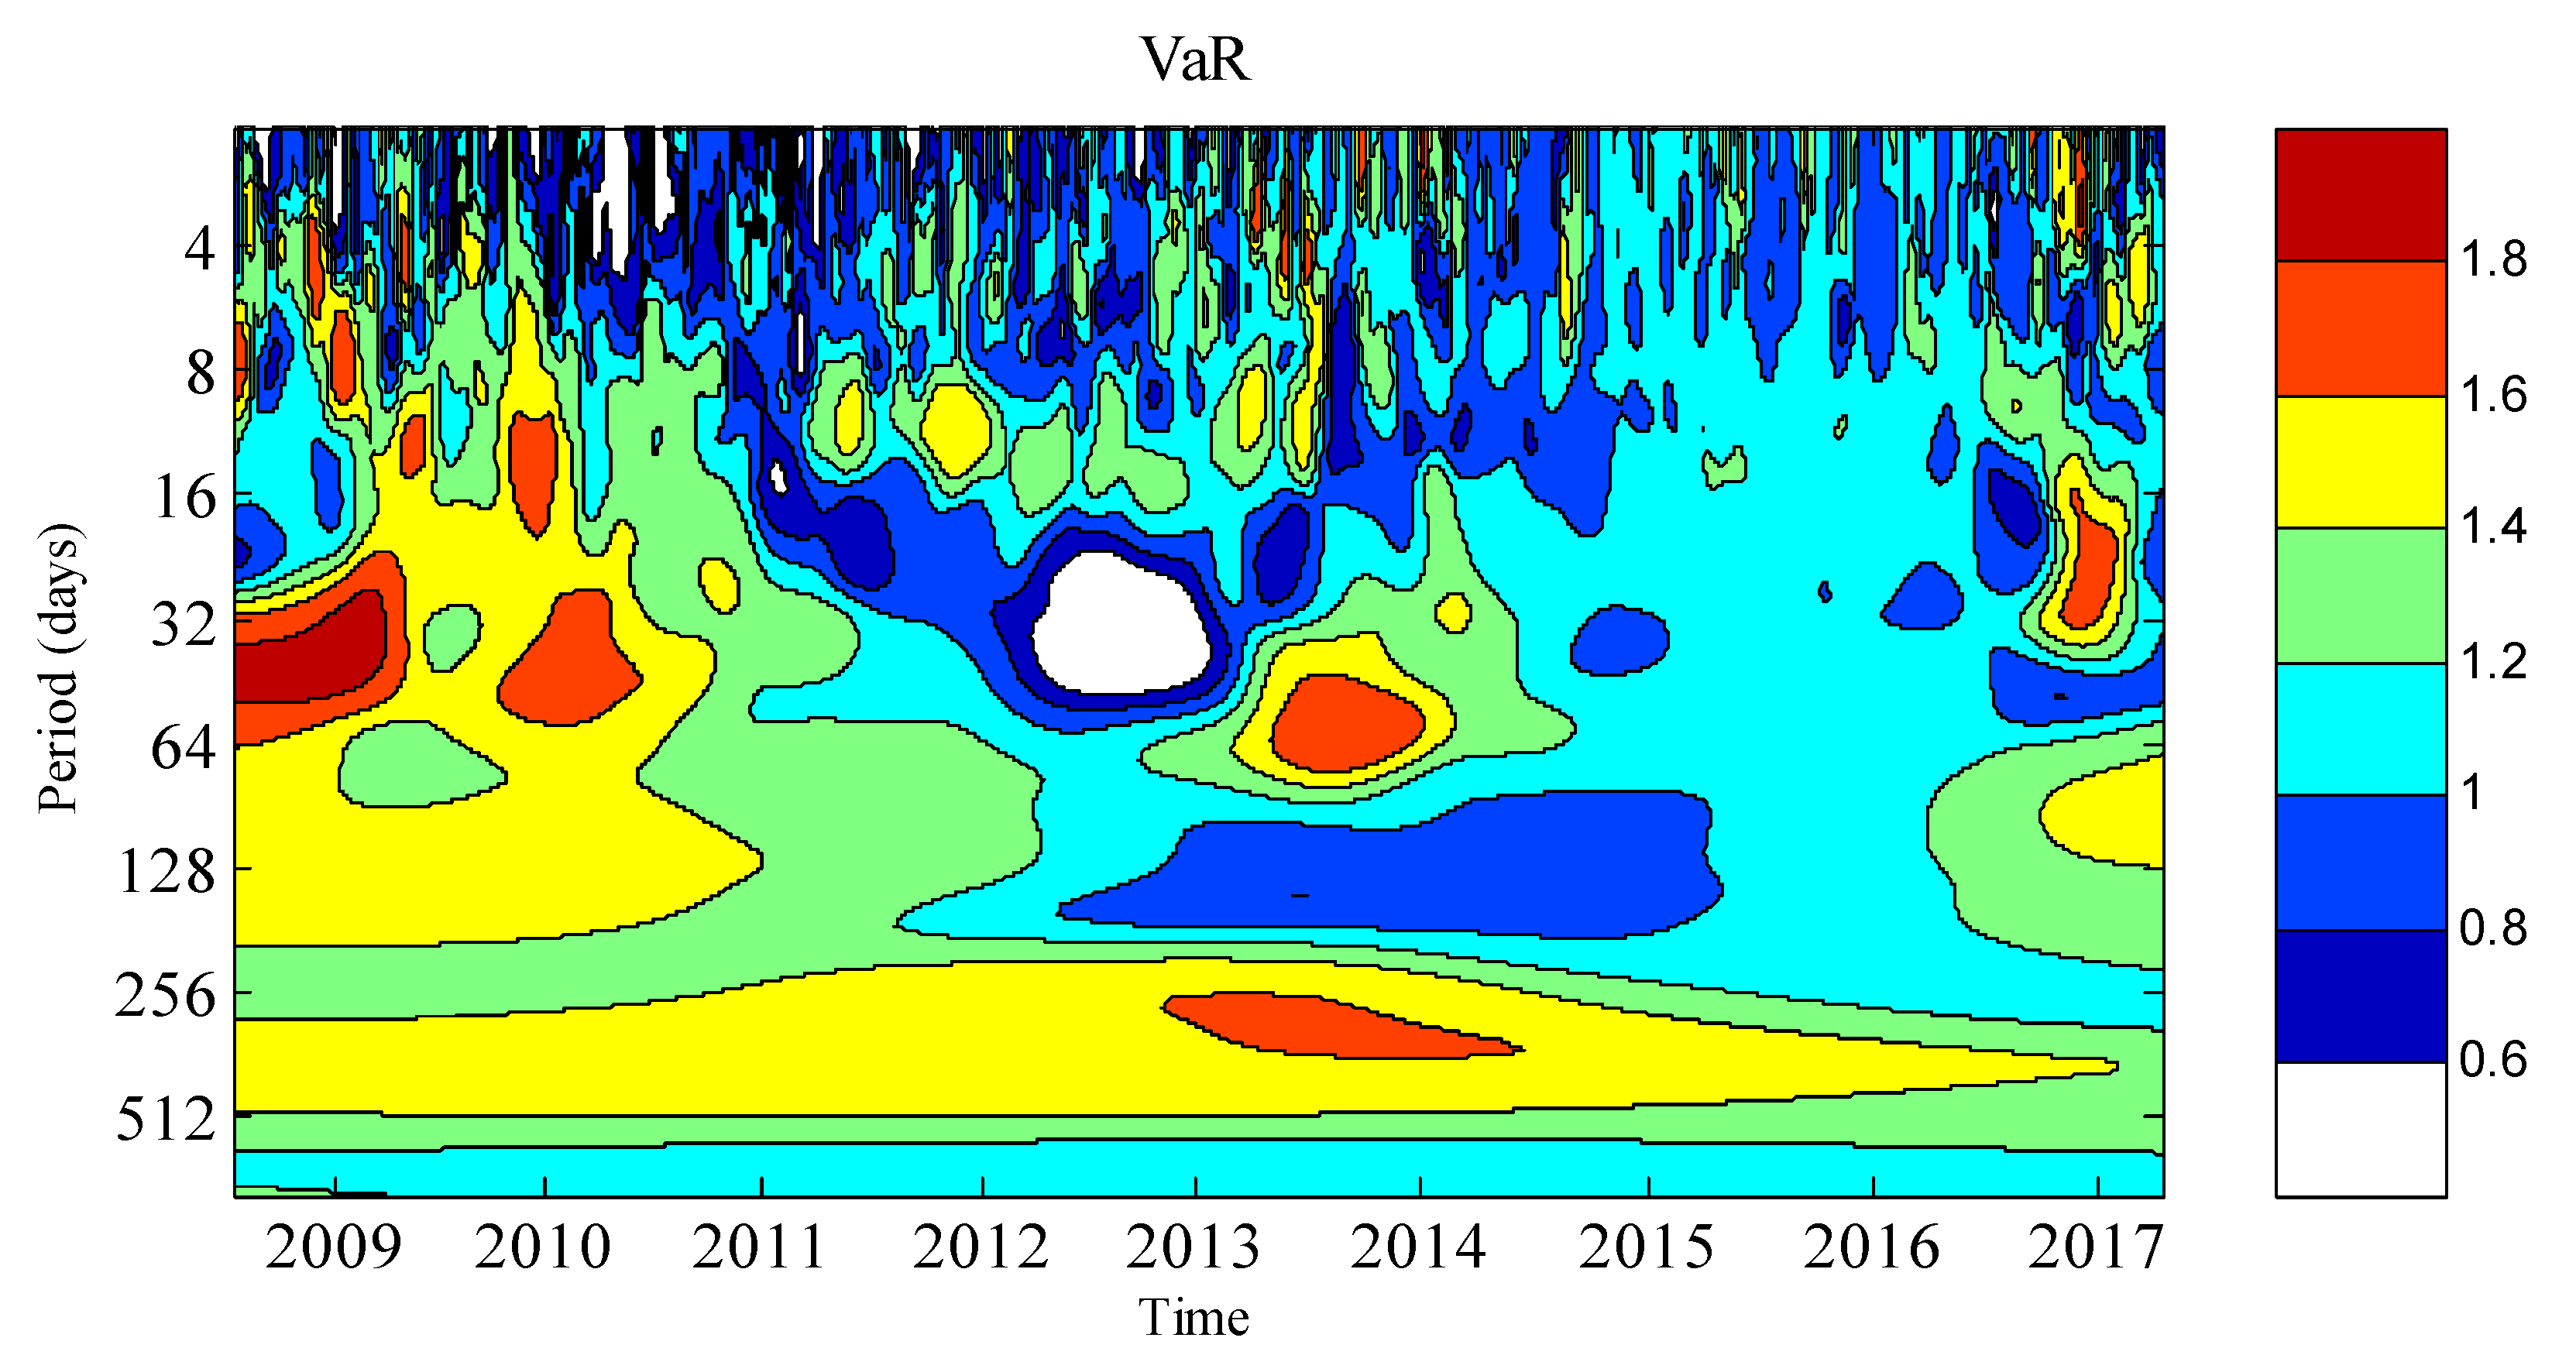
5.5. Value at Risk Sukuk-Shariah Stocks Portfolio Analysis

The plot of the ratio of VaR of the sukuk–shariah stocks behavior over the entire period is presented in Figure 6. A ratio that is equal to unity shows an insignificant effect of the co-movement on the VaR level, while a ratio higher than unity implies a significant impact of the co-movement on the VaR. From this figure, the yellow color highlights the presence of higher levels of co-movement in the portfolio. In other words, in the sample period 2007–2011, the ratio varies between 1.4 to 1.6 from both the short-run and the long-run horizon, and for the rest of the sample period at the medium-term frequency (i.e., indicated by the red color), the VaR ranges between 1.6 to 1.8. In the remaining years of the sample period, the ratio varies between 1 to 1.2 from the highest to the lowest frequency. Thus, from all frequencies and scales, the increase in the co-movement between the sukuk–shariah stock results in higher ratio of the VaR. This result supports the conclusion of the conventional portfolio management theory that risk increases when the highest co-movement is observed between the portfolio assets. Moreover, the sukuk–shariah stock correlations exhibit different impacts on the risk over the entire sample period. Furthermore, the ratio of VaR is high at the low frequencies over the whole sample period, thus indicating that high correlations imply higher risks at long-term investment horizons. In general, the findings imply that the advantages implied from Islamic asset diversification vary across the times/scales. The result is in line with the study of Rua and Nunes (2009) and Aloui et al. (2015b). Finally, the co-movement across the time/scale provides a guiding role to fund managers and Islamic banks of the Gulf countries in their selection of Islamic portfolio assets.

6. Conclusions and Policy Implications

The present study provides linkages between the sukuk–shariah stocks in the GCC region over the period 10 July 2008 to 15 May 2017. The sukuk comprises global, corporate, and financial services, sukuk indices, and shariah stocks consist of the Composite Shariah Total Returns Index and the Composite Shariah Index. We examine the relationship between these Islamic assets by applying bivariate and multivariate wavelet methods and the VaR analysis.
Firstly, the results of the bivariate WC (coherence) show a positive correlation between the sukuk sub-indices at the lower frequencies and negative correlation at the higher frequencies. However, the association between shariah stocks is found to be positive and very strong throughout the sample period. Moreover, a considerable change is observed in the pattern of the correlation between the sukuk–shariah stocks across time and frequencies. This result is valuable for policy makers, Islamic bond issuers, and the corporate sector due to the extensive growth of Islamic bonds in the Gulf countries. Indeed, the main purpose for the issuance of the sukuk and shariah stock indices to help governments and corporates to finance their budget deficits after the prolonged period of low energy prices. Islamic assets have signified their importance in supporting investment, promoting growth, and financing infrastructure development in the Gulf countries. Thus, it is essential for domestic and foreign investors to recognize the varying patterns of the correlation between the sukuk–shariah stocks across time/frequency for designing their portfolios to obtain the diversification benefits.
Secondly, the results of the wavelet cohesion reveal that the co-movement pattern of the sukuk–shariah stocks vary over time and scale. It is worth mentioning that the findings of the bivariate wavelet coherence (WC) are consistent with the findings of the wavelet cohesion, which supports the diversification opportunities at lower frequencies. Thus, both the bivariate and multivariate wavelet approaches signify the varying degree of co-movement and co-existence of strong and negative associations between the Islamic assets. However, the results obtained from the wavelet cohesion approach have the advantage over the bivariate wavelet approach as it involves the multivariate dimensions of the sukuk–shariah stocks, and consequently describes a more accurate pattern of the linkages between the selected Islamic assets. This finding has strong implications for the asset pricing theory because it may offer different interpretations of investment behavior from that of the conventional capital asset pricing method and the market efficiency.
Thirdly, the results from the wavelet multiple correlation (WMC) reveal that the pattern of the multiple correlation significantly changes as the time scale increases. Discrepancies between the sukuk–shariah stocks tend to decrease from the medium- to the long-time horizons, and therefore, the benefits from their diversification remain more significant at the short-time horizon.
Fourthly, the wavelet multiple cross-correlation (WMCC) results imply that the lead/lag relationship between the sukuk and shariah markets have equal forces, irrespective of the time-scale. The cross-correlation reaches their maximum level of unity at Level 8, indicating that the Islamic financial markets are fully connected in the long run, as noted by Fernandez-Macho (2012). From a portfolio management perspective, the integration in the Islamic financial markets implies that these markets share a boom or a crash together during distress periods. As a consequence, these Islamic assets may not prove to be a safe haven for Islamic investors in troublesome periods.
Finally, the results of the VaR analysis demonstrates that the benefits from the Islamic assets portfolio vary within the time/scale. From a policy perspective, the findings are vital for fund managers to draw inferences about the variation in the correlation between sukuk–shariah stocks in the Gulf countries, and consequently, to draw inferences whether such changes are permanent or transitory because VaR also varies across time or scale.
The findings of this study are interesting because they provide a clear view of co-movement over the sample period and make it easy for investors to understand with coherence diagrams. Global investors can allocate their investment in shariah-compliant assets in the short run and may enjoy diversification benefits. Correlation between sukuk and shariah stocks is high because of financial market integration. The evidence on the timely and appropriate measure of correlation changes and the behavior of sukuk and shariah stocks is beneficial in the management of sukuk and shariah stock portfolios. Nowadays, demand for innovative financial instruments is high and shariah-compliant assets can be an attractive option because of their unique characteristics, which are better alternatives for both Islamic and non-Islamic fund holders seeking opportunities for portfolio diversification.
In general, the findings of the present study allow policy makers and market regulators to assess the degree of Islamic financial market integration. There is a possibility that market development may be enhanced by the high degree of financial market integration, which in turn increases the short-term and long-term financial flows in the Gulf countries. Furthermore, the size of short-term speculative flows that are the key reason of contagion can be reduced by this high degree of integration in the Islamic asset markets.

Author Contributions

S.N. worked on the methodology and results; A.K.T. worked on the methodology and the estimations; S.H. worked on all parts of the paper; S.A.A.N. worked on the review of the literature; S.A.R.S. worked on the introduction. All authors have read and agreed to the published version of the manuscript.

Funding

This research received no external funding.

Conflicts of Interest

There is no conflict of interest.

Appendix A

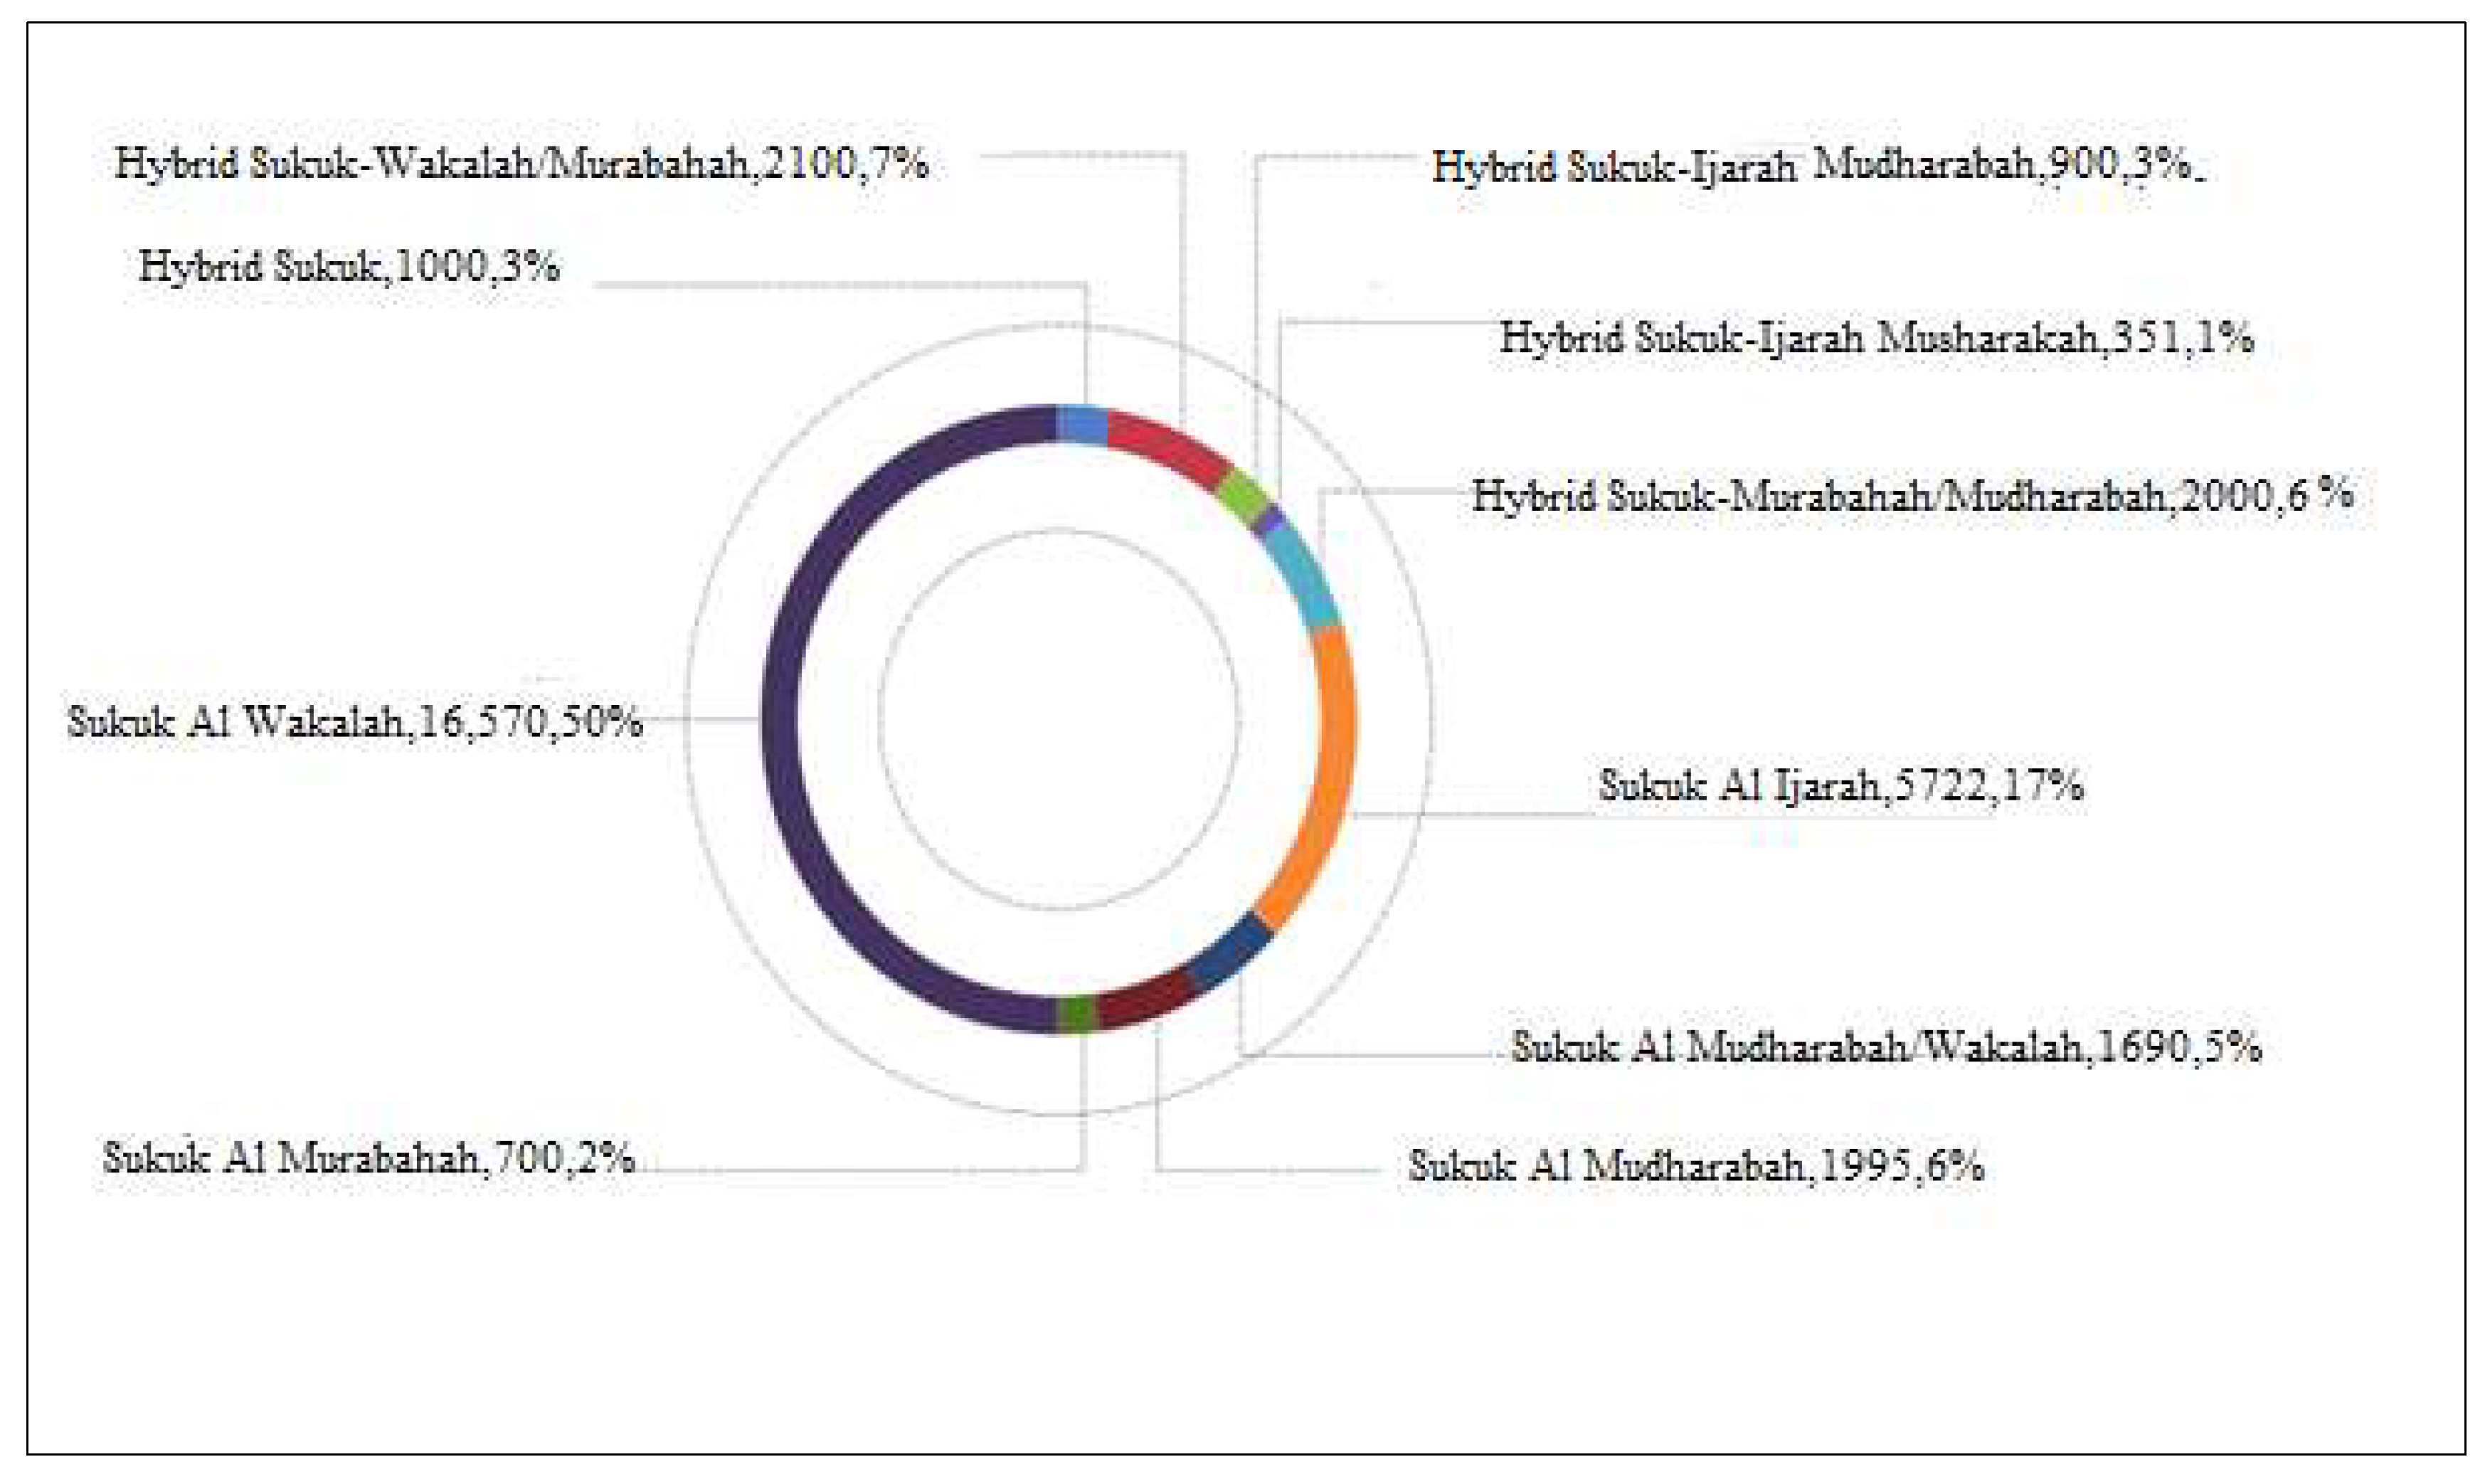
Appendix A.1. Composition of Global Sukuk Market

As far as the international sukuk market is concerned, Sukuk Al Wakalah is the most used structure since 2015. The share of Wakalah among sukuk issuances made up around 50.77% during the 2010–2016 period. The share of Sukuk Al Ijarah continued to decline from 2010 (30.86%) to 2017 (12%). However, in 2018, its share improved to 17%. Then, 2015 was the year when the sudden and major shift from the Ijarah to Wakalah model took place, and this continued in 2018 where the Sukuk Al Wakalah share stood at USD 16.57 billion (50%) of the total international issuances. In 2017, the issuance by Saudi Arabia’s USD 9.00 billion sukuk led to the introduction of a new hybrid structure consisting of Mudarabah and Murabahah, and in 2018, the share of this structure in case of international sukuk issuance dropped to 6% as compared to 24% of total sukuk issuances achieved last year. In terms of structure, the Sukuk Al Wakalah is generally a combination of Ijarah with Murabahah and is like a hybrid structure. The Sukuk Al Wakalah provides flexibility in structuring and the issue of the shortage of available assets is reduced (IIFM Sukuk Report 2019).
Figure A1. International sukuk issuance Jan 2018–Dec 2018. Source: IIFM Sukuk Report, 2019.
Jrfm 13 00063 g0a1

Appendix A.2. Composition of S&P Shariah Indices

In 2006, Standard & Poor’s introduced the S&P Shariah Indices. Shariah is Islamic canonical law, which observant Muslims adhere to in their daily lives. Recognizing the urgent need for indices, which are a real gauge of the global equity markets and well-established standards, Standard & Poor’s initially applied shariah screens to three headline indices—the S&P 500, the S&P Europe 350, and the S&P Japan 500. The results are the S&P 500 Shariah, the S&P Europe 350 Shariah, and the S&P Japan 500 Shariah indices. In 2007, Standard & Poor’s followed with the S&P GCC Shariah and the S&P Pan Asia Shariah Indices, to cater to the demand for a benchmark shariah product for those regions. Currently, Standard & Poor’s boasts the most comprehensive series of shariah indices in the industry. This was accomplished in 2008 with the completion of the review of the S&P Global BMI Equity Indices, which consist of over 11,000 companies worldwide, for shariah compliance. The result is the S&P Global BMI Shariah index, comprised of nearly 6000 constituents, along with 10 sectors and 47 country and regional sub-indices. These are gauges of major markets, sectors, and regions; and by screening out stocks that are not shariah compliant, they become ideal investment vehicles for observant Muslims (S&P Dow Jones).

References

  1. Abdullah, Ahmad Monir, Buerhan Saiti, and Mansur Masih. 2016. The impact of crude oil price on Islamic stock indices of South East Asian countries: Evidence from MGARCH-DCC and wavelet approaches. Borsa Istanbul Review 16: 219–32. [Google Scholar] [CrossRef] [Green Version]
  2. Akhtar, Shumi M., Farida Akhtar, Maria Jahromi, and Kose John. 2017. Intensity of Volatility Linkages in Islamic and Conventional Markets. Available online: https://ssrn.com/abstract=2906546 (accessed on 2 March 2019).
  3. Aloui, Chaker, and Besma Hkiri. 2014. Co-movements of GCC emerging stock markets: New evidence from wavelet coherence analysis. Economic Modelling 36: 421–31. [Google Scholar] [CrossRef]
  4. Aloui, Chaker, Shawkat Hammoudeh, and Hela Ben Hamida. 2015a. Co-movement between sharia stocks and sukuk in the GCC markets: A time-frequency analysis. Journal of International Financial Markets, Institutions and Money 34: 69–79. [Google Scholar] [CrossRef]
  5. Aloui, Chaker, Shawkat Hammoudeh, and Hela Ben Hamida. 2015b. Price discovery and regime shift behaviour in the relationship between shariah stocks and sukuk: A two state markov switching analysis. Pecific Basin Finance Journal 32: 21–35. [Google Scholar]
  6. Aloui, Chaker, Rania Jammazi, and Hela Ben Hamida. 2018. Multivariate Co-movement Between Islamic Stock and Bond Market among the GCC: A Wavelet-Based View. Computational Economics 52: 603–26. [Google Scholar] [CrossRef]
  7. Ariff, Mohamed, and Meysam Safari. 2012. Are sukuk securities the same as conventional bonds? Afro Eurasian Studies 1: 101–25. [Google Scholar]
  8. Batten, Jonathan A., Cetin Ciner, and Brian M. Lucey. 2010. The macroeconomic determinants of volatility in precious metals. Resource Policy 35: 65–71. [Google Scholar] [CrossRef]
  9. Bhuiyan, Rubaiyat Ahsan, Maya Puspa Rahman, Buerhan Saitib, and Gairuzazmi Bin Mat Ghani. 2019. Does the Malaysian Sovereign sukuk market offer portfolio diversification opportunities for global fixed-income investors? Evidence from wavelet coherence and multivariate-GARCH analyses. North American Journal of Economics and Finance 47: 675–87. [Google Scholar] [CrossRef]
  10. Buriev, Abdul Aziz, Ginanjar Dewandaru, Mohd-Pisal Zainal, and Mansur Masih. 2018. Portfolio diversification benefits at different investment horizons during the Arab uprisings: Turkish perspectives based on MGARCH–DCC and wavelet approaches. Emerging Markets Finance and Trade 54: 3272–93. [Google Scholar] [CrossRef]
  11. Cai, Xiao Jing, Shuairu Tian, Nannan Yuan, and Shigeyuki Hamori. 2017. Interdependence between oil and East Asian stock markets: Evidence from wavelet coherence analysis. Journal of International Financial Markets, Institutions and Money 48: 206–23. [Google Scholar] [CrossRef]
  12. Cakir, Selim, and Faezeh Raei. 2007. Sukuk and Eurobonds: Is There a difference in Value at Risk? International Monetary Fund Working Paper, WP/07/237. Washington: International Monetary Fund. [Google Scholar]
  13. Candelon, Bertrand, Jan Piplack, and Stefan Straetmans. 2008. On measuring synchronizing of bulls and bears: The case of East Asia. Journal of Banking and Finance 32: 1022–35. [Google Scholar] [CrossRef]
  14. Chen, W. D., and H. C. Li. 2016. Wavelet decomposition of heterogeneous investment horizon. Journal of Economics and Finance 40: 714–43. [Google Scholar] [CrossRef]
  15. Dewandaru, Ginanjar, Syed Aun R. Rizvi, Rumi Masih, Mansur Masiha, and Syed Othman Alhabshi. 2014. Stock market co-movements: Islamic versus conventional equity indices with multi-timescales analysis. Economic Systems 38: 553–71. [Google Scholar] [CrossRef]
  16. Duqi, Andi, and Hussein Al-Tamimi. 2019. Factors affecting investors’ decision regarding investment in Islamic Sukuk. Qualitative Research in Financial Markets 11: 60–72. [Google Scholar] [CrossRef]
  17. Fathurahman, Heri, and Rachma Fitriati. 2013. Comparative analysis of return on sukuk and conventional bonds. American Journal of Economics 3: 159–63. [Google Scholar]
  18. Fernandez-Macho, Javier. 2012. Wavelet multiple correlation and cross-correlation: A multiscale analysis Eurozone stock markets. Physica A: Statistics Mechanics and Its Applications 391: 1097–104. [Google Scholar] [CrossRef] [Green Version]
  19. Fleming, Jeff, Chris Kirby, and Barbara Ostdiek. 1998. Information and volatility linkage in the stock bond and money market. Journal of Finance and Economics 49: 111–37. [Google Scholar] [CrossRef]
  20. Gencay, Ramazan, Faruk Selçuk, and Brandon J. Whitcher. 2002. An Introduction to Wavelet and Other Filtering Methods in Finance and Economics. San Diego: Academic Press. [Google Scholar]
  21. GIFR. 2019. Global Islamic Finace Report. Cambridge: Institute of Islamic Finance. [Google Scholar]
  22. Godlewski, Christophe J., Rima Turk-Ariss, and Laurent Weill. 2013. Sukuk vs conventional bonds: A stock market perspective. Journal of Comparative Economics 41: 745–61. [Google Scholar] [CrossRef]
  23. Goupillaud, Pierre, Alex Grossmann, and Jean Morlet. 1984. Cycle-octave and related transforms in seismic signal analysis. Geoxploration 23: 85–102. [Google Scholar] [CrossRef]
  24. Haile, Fasika, and Susan Pozo. 2008. Currency crisis contagion and the identification of transmission channels. International Review of Economics and Finance 17: 572–88. [Google Scholar] [CrossRef]
  25. Hassan, M. Kabir, Andrea Paltrinieri, Alberto Dreassi, Stefano Miani, and Alex Sclip. 2018. The determinants of co-movement dynamics between sukuk and conventional bonds. The Quarterly Review of Economics and Finance 68: 73–84. [Google Scholar] [CrossRef]
  26. IIFM Sukuk Report. 2019. A Comprehensive Study of the Global Sukuk Market, 8th ed. Behrain: International Islamic Finance Market. [Google Scholar]
  27. In, Francis, and Sangbae Kim. 2013. An Introduction to Wavelet Theory in Finance: A Wavelet Multiscale Approach. Singapore: World Scientific. [Google Scholar]
  28. In, Francis, Sangbae Kim, and Ramazan Gençay. 2011. Investment horizon effect on asset allocation between value and growth strategies. Economic Modelling 28: 1489–97. [Google Scholar] [CrossRef]
  29. Junaidi, Junaidi, Abd Jamal, and Sofyan Syahnur. 2019. Sukuk and Endogenous Growth in Indonesia: Generalized Method of Moments Approach. Paper presented at 1st Aceh Global Conference (AGC 2018), Banda Aceh, Indonesia, October 17–18. [Google Scholar]
  30. Khartabiel, Ghadeer, Ahmad Abu-Alkheil, Tunku Salha Ahmad, and Walayet Khan. 2019. Shari’ah-compliant Sukuk versus conventional bond announcements: Is there a wealth effect? Review of Quantitative Finance and Accounting, 1–15. Available online: https://link.springer.com/article/10.1007/s11156-019-00799-3 (accessed on 2 March 2019). [CrossRef]
  31. Kim, Sangbae, and Francis In. 2007. On the relationship between changes in stock prices and bond yields in the G7 countries: Wavelet analysis. Journal of International Financial Markets, Institutions and Money 17: 167–79. [Google Scholar] [CrossRef]
  32. Kim, Sangbae, and Francis In. 2010. Portfolio allocation and the investment horizon: A multi-scaling approach. Quantitative Finance 10: 443–53. [Google Scholar] [CrossRef]
  33. Kristoufek, Ladislav. 2015. What are the main drivers of the Bitcoin price? Evidence from wavelet coherence analysis. PLoS ONE 10: e0123923. [Google Scholar] [CrossRef]
  34. Lahsasna, Ahcene, and Lee Sze Lin. 2012. Issues in Islamic capital markets: Islamic bond/Sukuk. Paper presented at 3rd International Conference on Business and Economic Research (3rd ICBER 2012), Bandung, Indonesia, March 12–13. [Google Scholar]
  35. Miller, Neil D., John Challoner, and Aziza Atta. 2007. UK welcomes the sukuk. International Financial Law Review 26: 24–25. [Google Scholar]
  36. Mimouni, Karim, Houcem Smaoui, Akram Temimi, and Moh’d Hasan Al-Azzam. 2019. The impact of Sukuk on the performance of conventional and Islamic banks. Pacific-Basin Finance journal 54: 42–54. [Google Scholar] [CrossRef]
  37. Naifar, Nader, Shawkat Hammoudeh, and Mohamed S. Al-Dohaiman. 2016. Dependence structure between sukuk (Islamic bonds) and stock market conditions: An empirical analysis with Archimedean copulas. Journal of International Financial Markets, Institutions and Money 44: 148–65. [Google Scholar] [CrossRef]
  38. Naifar, Nader, Mourad Mroua, and Slah Bahloul. 2017. Do regional and global uncertainty factors affect differently the conventional bonds and sukuk? New evidence. Pacific-Basin Finance Journal 41: 65–74. [Google Scholar] [CrossRef]
  39. Najeeb, Syed Faiq, Obiyathulla Bacha, and Mansur Masih. 2015. Does heterogeneity in investment horizons affect portfolio diversification? Some insights using M-GARCH-DCC and wavelet correlation analysis. Emerging Markets Finance and Trade 51: 188–208. [Google Scholar] [CrossRef]
  40. Paltrinieri, Andrea, Alberto Dreassi, Stefano Miani, and Alex Sclip. 2015. In search of zero beta assets: Evidence from the sukuk market. International Journal of Social, Behavioral, Educational, Economic and Management Engineering 9: 67–75. [Google Scholar]
  41. Percival, Donald, and Andrew T. Walden. 2000. Wavelet Methods for Time Series Analysis. Cambridge: Cambridge Press. [Google Scholar]
  42. Phillips, Ross C., and Denise Gorse. 2018. Cryptocurrency price drivers: Wavelet coherence analysis revisited. PLoS ONE 13: e0195200. [Google Scholar] [CrossRef]
  43. Qizam, Ibnu, and Michelle Fong. 2019. Developing financial disclosure quality in sukuk and bond market: Evidence from Indonesia, Malaysia, and Australia. Borsa Istanbul Review 19: 228–48. [Google Scholar] [CrossRef]
  44. Rua, António. 2010. Measuring co-movement in the time-frequency space. Journal of Macroeconomics 32: 685–91. [Google Scholar] [CrossRef] [Green Version]
  45. Rua, António. 2013. Worldwide synchronization since the nineteenth century: A wavelet-based view. Applied Economic Letters 20: 773–76. [Google Scholar] [CrossRef]
  46. Rua, António, and Luís C. Nunes. 2009. International co-movement of stock market returns: A wavelet analysis. Journal of Empirical Finance 16: 632–39. [Google Scholar] [CrossRef] [Green Version]
  47. Saad, Noriza Mohd, Mohd Nizal Haniff, and Norli Ali. 2018. Long Term Conventional Bonds versus Long Term Sukuk Issuances and Their Determinants in Malaysia. International Journal of Business and Management 2: 17–25. [Google Scholar]
  48. Suciningtias, Siti Aisiyah. 2019. Macroeconomic Impacts on Sukuk Performance in Indonesia: Co-integration and Vector Error Correction Model Approach. Journal of Islamic Finance 8: 117–30. [Google Scholar]
  49. Thuronyi, Victor. 2007. A level tax playing field in Islamic finance. Paper presented at the International Monetary Fund Spring Meeting, Washington, DC, USA, April 14–15. [Google Scholar]
  50. Tian, Fenghua, Takashi Tarumi, Hanli Liu, Rong Zhang, and Lina Chalak. 2016. Wavelet coherence analysis of dynamic cerebral autoregulation in neonatal hypoxic–ischemic encephalopathy. NeuroImage: Clinical 11: 124–32. [Google Scholar] [CrossRef] [Green Version]
  51. Torrence, Christopher, and Gilbert P. Compo. 1998. A practical guide to wavelet analysis. Bulletin of the American Meteorological Society 79: 61–78. [Google Scholar] [CrossRef] [Green Version]
  52. Torrence, Christopher, and Peter J. Webster. 1999. Inter-decadal changes in the ENSO-monsoon system. Journal of Climate 12: 2679–90. [Google Scholar] [CrossRef] [Green Version]
  53. Wilson, Rodney. 2008. Innovation in structuring of sukuk securities. Humanomics 24: 170–81. [Google Scholar] [CrossRef] [Green Version]
  54. Yang, Jian. 2005. International bond market linkages: A structural VAR analysis. International Financial Markets. Institutions and Money 15: 39–54. [Google Scholar] [CrossRef]
  55. Zin, Mohamad Zaid Mohd, Ahaamad Asmadi Sakat, Nurfahiratul Azlina Ahmad, Mohd Roslan Mohd Nor, Azri Bhari, Saurdi Ishak, and Mohd Sapawi. 2011. The effectiveness of Sukuk in Islamic finance market. Australian Journal of Basic and Applied Sciences 5: 472–78. [Google Scholar]
  56. Zulkhibri, Muhamed. 2015. A synthesis of theoretical and empirical research on sukuk. Borsa Istanbul Review 15: 237–48. [Google Scholar] [CrossRef] [Green Version]
1
Global Islamic Finance Report.
2
3
Oman, Bahrain, Saudi Arabia, Kuwait, Abu Dhabi, and Dubai.
Figure 1. Wavelet coherence (WC) between sukuk sub-indices and between shariah stocks. Notes: The time interval is shown on the horizontal axis, while the time-scales are displayed on the perpendicular axis. The color bar on the right-hand side of each graph shows the range of coherency from the low (dark blue color) to high (yellow color). The dark lines represent the 5% significance level for WC.
Jrfm 13 00063 g001
Figure 2. WC between sukuk sub-indices and shariah stocks. Notes: The time interval is shown on the horizontal axis, while time-scales are displayed on the vertical axis. The color bar on the right-hand side of each graph shows the range of coherency from the low (dark blue color) to the high (yellow color). The dark lines represent the 5% significance level for WC.
Jrfm 13 00063 g002aJrfm 13 00063 g002b
Figure 3. Wavelet cohesion between the sukuk sub-indices and shariah stocks.
Jrfm 13 00063 g003
Figure 4. Wavelet multiple correlation between the sukuk and the shariah stock indices. Notes. The dotted lines show the upper and lower bonds at the 5% significance level.
Jrfm 13 00063 g004
Figure 5. Wavelet multiple cross-correlation between the sukuk and shariah stocks.
Jrfm 13 00063 g005
Figure 6. Value at risk of the sukuk–shariah stock portfolios with and without co-movements.
Jrfm 13 00063 g006
Table 1. Selected indices and their description.
VariablesDescription
NISKGC indexNASDAQ Dubai IdealRatings USD GCC SUKUK index
NISKC IndexNASDAQ Dubai IdealRatings USD Corporate SUKUK index
NISKF IndexNASDAQ Dubai IdealRatings USD Financials SUKUK index
SPSHGT IndexS&P GCC Composite Shariah Total Stock Returns Index
SPSHG IndexS&P GCC Composite Shariah Stock Index

