Article

What Explains the Sovereign Credit Default Swap Spreads Changes in the GCC Region?

College of Economics and Administrative Sciences, Imam Mohammad Ibn Saud Islamic University (IMSIU), P.O. Box 5701, Riyadh 11432, Saudi Arabia
J. Risk Financial Manag. 2020, 13(10), 245; https://doi.org/10.3390/jrfm13100245
Submission received: 25 August 2020 / Revised: 1 October 2020 / Accepted: 14 October 2020 / Published: 16 October 2020
(This article belongs to the Section Economics and Finance)

Abstract

:
This paper aimed to investigate the drivers of sovereign credit risk spreads changes in the case of four Gulf Cooperation Council (GCC) countries, namely Kingdom of Saudi Arabia (KSA), the United Arab Emirates (UAE), Qatar, and Bahrain. Specifically, we explained the changes in sovereign credit default swap (hereafter SCDS) spreads at different locations of the spread distributions by three categories of explanatory variables: global uncertainty factors, local financial variables, and global financial market variables. Using weekly data from 5 April 2013, to 17 January 2020, and the quantile regression model, empirical results indicate that the global factors outperform the local factors. The most significant variables for all SCDS spreads are the global financial uncertainty embedded in the Chicago Board Options Exchange (CBOE) volatility index (VIX) and the global conventional bond market uncertainty embedded in the Merrill Lynch Option Volatility Estimate (MOVE) index. Moreover, the MOVE index affects the various SCDS spreads only when the CDS markets are bullish. Interestingly, the SCDS spreads are not affected by the global economic policy and the gold market uncertainties. Additionally, a weak dependence is observed between oil prices and SCDS spreads. For the country-specific factors, stock market returns are the most significant variable and impact the SCDS spreads at different market circumstances.

Graphical Abstract

1. Introduction

The economic impact of the global pandemic combined with the collapse of US oil prices in April 2020 and the widening of the credit default swap (CDS) spreads in the credit markets have renewed the interest to investigate the determinants of sovereign credit risk in the case of the biggest oil producers in the Middle East. Notably, the economic difficulties around the world and the decline of domestic demand as a result of the lockdown and the decrease in business activity will reduce demand for the Gulf Cooperation Council (GCC)’s oil. Moreover, uncertainty about coronavirus could hurt the domestic investment and consumption, then increasing the sovereign credit risk and sovereign credit rating. The sovereign credit risk represents the probability that a government might be unable to meet its debt obligations in the future. According to Rodríguez et al. (2019), credit default swap (CDS) spreads measure sovereign credit risk better than sovereign credit rating. Using data for 54 countries over twelve years, they found that CDS spread changes can predict sovereign events while rating changes cannot. Additionally, the advantages of using CDS spreads rather than a government bonds premium as a proxy of sovereign credit risk are that the CDS market is more liquid than the underlying government bond markets, and the spread of CDS reflects only the premium of credit risk.
A CDS is a financial contract mainly transacted in over-the-counter (OTC) derivatives markets. The CDS premium represents the cost per annum for protection against a “credit event”1. The buyer of the CDS (protection buyer) makes a series of fee payments to the protection seller and in exchange, receives the face value of the underlying asset in the occurrence of the credit event. Thus, the CDS spreads reflect the riskiness of the underlying credit event. According to the most recent report from the regulator of national banks, the Office of the Comptroller of the Currency (OCC)2, the national amounts of credit derivatives increased from USD 109 billion (2.7%), to USD 4.2 trillion, in the third quarter of 2019. The increased attention to hedging emerging market sovereign risk has fueled the evolution of the sovereign credit derivative markets (Eyssell et al. 2013). A sovereign credit default swap (hereafter SCDS) is a financial contract where the reference entity is a government. This contact is developed to compensate international investors in the event of a sovereign default. A debtor country could default either because it lacks economic resources to repay its debts or because it is unwilling to fulfill its responsibility (Yu 2016). SCDS spreads provide indications of sovereign credit risk. Hence, SCDS can provide a useful hedge instrument to offset the sovereign credit risk and can improve financial stability.
Most of the existing studies focus on SCDS spreads to explain variation in sovereign credit risk. The first group of studies shows the importance of country-specific and domestic fundamentals in explaining the changes in sovereign credit risk (e.g., Hilscher and Nosbusch (2010); Aizenman et al. (2013); Beirne and Fratzscher (2013); Eyssell et al. (2013); and Jeanneret (2018), among others). The second group argues for the importance of global macroeconomic and risk factors in explaining the changes in SCDS spreads (e.g., Pan and Singleton (2008); Longstaff et al. (2011); Wang and Moore (2012); Eyssell et al. (2013); and Ang and Longstaff (2013), among others). Furthermore, the relative importance of global factors and individual country characteristics can change over time and across countries.
Despite the increased interest in explaining the SCDS across the world, there are relatively few papers that isolate bearish and bullish markets. The direction of the SCDS market is an important factor that has an impact on decision making. A bullish market is a market where the SCDS spreads rise and then so does the credit; while a bearish market is a market where SCDS spreads are declining. Understanding the dynamics of SCDS spreads on the bearish and bullish market conditions is vital for international investors seeking portfolio investments and foreign borrowers seeking credit risk management and hedging strategies. In this study, two facts have motivated us to examine the sovereign credit risk for the GCC region: the first fact relates to the alarming spreading of the GCC sovereign CDS spreads in the wake of the recent oil prices collapse and increases in financial and economic uncertainty3. According to credit rating agency Moody, “A prolonged period of oil price volatility and low oil prices will be credit negative for the solvency and liquidity of banks operating in the Gulf Cooperation Council (GCC) states”. The conventional spreads of Saudi Arabia’s five years CDS spreads were at 160 basis points on Monday, 9 March 2020, up from 96 basis points at their previous close level4. The second fact admits that there are no in-depth empirical studies in the GCC region that explain the variation of the sovereign credit risk under different market conditions.
In this study, we add to the existing literature in three ways: First, we investigated the joint effects of global and local financial factors on sovereign credit risk in the case of GCC countries. We combined global uncertainty factors (which included financial, economic, and commodity market uncertainty) with country-specific financial variables. The theoretical literature suggests the possible joint effect between the variables, but few empirical studies have studied this issue. Second, we analyzed the asymmetric effect between SCDS changes and explanatory variables across different quantiles. In particular, we examined whether global financial and economic uncertainty factors and country-specific financial indicators affected sovereign credit risk under various market conditions, including bearish (lower quantile) and bullish (upper quantile) ones. Understanding the determinants of sovereign credit risk has implications for policymakers and international investors in terms of assessing risks of their foreign direct investment, hedging, and the predictability of sovereign credit risk. Third, our sample period corresponds to some significant economic and financial events (e.g., the 2014–2015 oil price crash that impacted the GCC countries’ revenues) that can lead to an asymmetric relationship between SCDS spreads and the explanatory variables. We provide more realistic and reliable findings derived from quantile regression as opposed to conventional linear regression.
In this paper, we first examined the nonlinear relationship between SCDS changes, country-specific financial variables, and global financial, economic and commodity uncertainty factors in a quantile regression framework before the spread of coronavirus (from 5 April 2013, to 17 January 2020, weekly). We ran quantile regressions on changes in sovereign CDS mid-spreads. Quantile regression is a technique that enables us to describe the entire conditional distribution of the dependent variable (SCDS) and to explain the impact of each explanatory variable under different market conditions. Empirical results show that the most significant variables for all SCDS spreads are the global financial uncertainty embedded in the VIX index and the global conventional bond market uncertainty embedded in the MOVE index. However, the SCDS spreads are not affected by the global economic policy and the gold market uncertainties. Besides, the country-specific stock market returns impact the SCDS spreads when CDS markets are bullish.
The remainder of the paper is organized as follows. Section 2 reviews the related literature. Section 3 presents the methodology. Section 4 describes the data. Section 5 presents and discusses the empirical results. Section 6 concludes the paper.

2. Literature Review

The European Sovereign Debt Crisis (hereafter ESD) contributes to the recent rise of uncertainty in the global government bond market. The ESD crisis origin was the global financial crisis, which spilled over into a sovereign debt crisis in numerous European countries at the beginning of 2010. The ESD crisis started with Greece, and it dispersed over other European countries like Portugal and Spain. The ESD crisis demonstrated that government bonds issued by European countries were not free of default risk. Moro (2014) stated that the ESD crisis was the sequence of interactions between sovereign and banking problems. The author identified the main factors that contributed to the spread of the ESD crisis (e.g., the high level of public debt, euro area interbank payment system (TARGET2), the tensions in sovereign debt markets, among others). Gruppe and Lange (2014) found that German and Spanish government bond yields were co-integrated. They justified the existence of a structural break in early 2009. Gómez-Puig and Sosvilla-Rivero (2014) tested for the presence of Granger causal relationships in the evolution of the bond yields. They used a database of yields on 10 years government bonds issued by 11 Economic and Monetary Union (hereafter EMU) countries. They found that the number of causal relationships increased as the financial and sovereign debt crisis unfolded in the euro area. Gruppe and Lange (2017) surveyed the literature on the interest rate convergence in the EMU countries. They showed that the euro’s introduction has caused interest rate convergence among the EMU government bond yields. Sensoy et al. (2019) investigate the dynamic linkages of the EMU sovereign bond markets both before and after the onset of the European debt crisis. They found the perfect integration of the EMU sovereign bond markets in the pre-crisis period. Akyildirim et al. (2020) investigated the impact of European regulatory changes on the structural interdependencies of Economic and Monetary Union sovereign bond markets. They found that regulatory changes have a significant effect on the long-run relationship among sovereign bond yields. Afonso et al. (2020) examined the impact of macroeconomic, fiscal and monetary developments on sovereign bond yield spreads in 10 Economic and Monetary Union countries from 1999 to 2016. They found that a negative fiscal forecast’s announcement contributed to the increase in sovereign bond yield spreads during a positive fiscal announcement.
The literature on the determinants of sovereign credit risk spreads varies widely regarding the choice of variables and methodology. It focuses mainly on country-specific and global factors in explaining changes in sovereign credit risk spreads. Concerning country-specific and domestic fundamentals studies, Hilscher and Nosbusch (2010) found that the variation in country fundamentals explains a large share of the change in emerging market sovereign debt prices for a set of 31 countries over the period 1994–2007. Using a Vector Autoregressive (VAR) and Granger non-causality tests, Liu and Morley (2012) studied the relationship between the domestic economy as represented by the interest rate and the exchange rate on sovereign CDS spreads. They found that the exchange rate had the most important effect on sovereign CDS spreads, with domestic interest rates having only a limited effect. Aizenman et al. (2013) developed a model of pricing of sovereign risk for a large number of countries within and outside of Europe, before and after the global financial crisis. Using a dataset of more than fifty countries over the period 2005–2010, they found that CDS spreads are partly explained by fiscal space and other economic determinants. Beirne and Fratzscher (2013) studied the drivers of sovereign risk for 31 advanced and emerging economies during the European sovereign debt crisis. They found that countries’ economic fundamentals explained most of the level of sovereign risk and the rise during the crisis period, and its underlying fundamentals contagion, while regional contagion explained a much more modest magnitude of sovereign risk. Pires et al. (2013) examined the determinants of CDS spreads using quantile regression. They found that implied volatility, put skew, historical stock return, leverage, profitability, and ratings were associated with an increase in CDS spreads. Galil et al. (2014) explored the determinants of CDS spreads on a broad database of 718 US firms during the period from 2002 to 2013. They found that stock return, the change in stock return volatility, and the change in the median CDS spread in the rating class outperformed the other variables in explaining the CDS spreads changes. Qian and Luo (2015) found that the global bond yields impacted China’s sovereign CDS spread, intensified in a more turbulent market. They also found that domestic stock market returns and volatility were not exogenous variables. They are affected by sovereign CDS spread. Drago and Gallo (2016) investigated the impact of a sovereign rating change announcement on the euro area SCDS market. They found that changes in the sovereign rating introduced “new” information, affecting investors’ riskiness perception. In addition, they found a spillover effect of a downgrade announcement on the euro area CDS market. Drago et al. (2017) investigated the determinants of bank CDS spreads for a sample of European and US banks during the period 2007–2016. They found that capital adequacy, leverage, poor asset quality, stock market returns, and a low bank-specific credit rating are associated with a widening of bank CDS spreads. Lee and Hyun (2019) investigated the effects of firm-level equity volatility, realized semi-variances, and signed jumps on CDS spreads. They conduct individual time-series regressions for CDS spread levels and changes using a sample of 405 firms. The authors found that negative realized semi-variance dominates positively realized semi-variance in explaining both the levels and the changes in CDS spreads.
A growing body of research points to the impact of uncertainty factors on sovereign credit risk. Longstaff et al. (2011) investigated the determinants of CDS spreads of 26 countries over the period October 2000–January 2010. Using local and global financial variables and global risk factors, they found that sovereign CDS can be explained mainly by US equity, volatility, and bond market risk premia. Pan and Singleton (2008) found that the VIX index was statistically significant in explaining the CDS spreads of three countries (Mexico, Turkey, and South Korea) from March 2001 to August 2006. Baum and Wan (2010) studied the impact of macroeconomic uncertainty on the CDS spreads of individual firms using firm-level data. They found that macroeconomic uncertainty has statistically and economically significant effects on CDS spreads. Wang and Moore (2012) studied the integration of the CDS markets of 38 developed and emerging countries with the US market during the subprime crisis period. They found that US interest rates (as a proxy for global interest rates) were the main driving factor behind the higher level of correlation between CDS spreads. Ang and Longstaff (2013) extracted the dependence of CDS spreads written on sovereign states in the United States and European countries on a common component and explained this component as systemic risk. They found that the systemic risk component was mainly influenced by global financial factors and not directly caused by macroeconomic integration. Eyssell et al. 2013 examined the effect of domestic factors (stock market returns and volatility, the real interest rate, the ratio of debts to GDP), and global financial and uncertainty factors (VIX, term structure slope, and default spread, the behavior of China’s CDS spreads). They found that both country-specific variables and global financial, economic and uncertainty factors were important determinants of China’s sovereign CDS for the full sample. When they split the sample into two sub-periods, they found that global factors became essential in recent years, principally during the global crisis. Stolbov (2016) investigated the determinants of sovereign CDS in the case of Russia. The author found that the VIX index and oil prices were the most important factors, followed by the Fitch credit rating changes and the Treasury-EuroDollar rate (TED) spread.
Another class of literature studies the interaction between Sovereign credit risk and other asset markets, including commodity and energy markets. Arezki and Brückner (2012) found that changes in international commodity prices were negatively correlated with the sovereign bond spreads (the proxy of sovereign credit risk) in emerging countries. Wegener et al. (2016) investigated the relationship between oil prices and the sovereign CDS spreads of nine countries (Brazil, Malaysia, Norway, Qatar, Russia, Saudi Arabia, the United Kingdom, the United States of America and Venezuela) using the bivariate VAR–GARCH-in-mean models5. They found that positive oil price shocks led to a decrease in the sovereign CDS spreads and helped improve the fiscal stability of oil-producing countries. Bouri et al. (2017) studied the volatility spillover from commodities to sovereign CDS spreads of emerging and frontier markets. Using daily CDS data from 2 June 2010, to 27 July 2016, they found that energy and precious metals were significant contributors to sovereign spreads’ volatility. Pavlova et al. (2018) studied the dynamic spillover of crude oil prices and volatilities on the SCDS of ten oil-exporting countries (Venezuela, Brazil, Colombia, Mexico, Russia, Malaysia, Kazakhstan, Qatar, Norway and the United Kingdom) from October 2008 to September 2015. They found that Venezuela, Colombia, Russia, and Mexico were the main recipients of crude oil shocks. In addition, they found that spillovers from crude oil uncertainty to SCDS spreads were relatively lower in magnitude compared to the spillovers from changes in crude oil prices. Bouri et al. (2018) studied the dependence between the crude oil implied volatility shocks and the BRICS sovereign risk. They found that the oil exporters (Russia and Brazil) were more sensitive to positive shocks in oil volatility. In contrast, the oil importers (China and India) were more sensitive to negative shocks. Naifar et al. (2020) studied the nonlinear impact of oil price returns on the SCDS spreads for the oil-rich countries of the GCC and other important oil-exporting countries (Venezuela, Mexico, Norway and Russia). They found that the important non-GCC oil exporters, Venezuela, Mexico and Russia, were the countries most affected by oil prices across all quantiles. However, a weak dependence was observed between the oil market returns and volatility and the sovereign credit risk spreads in the case of Saudi Arabia, the UAE and Norway.
Despite the devastating literature on the determinants of sovereign credit risk spreads, results are mixed and sometimes conflicting. SCDS levels typically exhibit structural breaks that can lead to parameter instability in the conventional ordinary least square (OLS) regression models. In such a situation, models incorporating different market circumstances, namely bearish, normal, and bullish markets, can perform better in explaining the interaction between sovereign credit risk spreads and explanatory variables. This paper contributes to the existing literature by studying the co-movement between SCDS spreads and country-specific and global uncertainty factors by using quantile regression analysis. More specifically, we address the following questions. Does dependence exist between the GCC sovereign credit risk spreads, country-specific and global factors under consideration? Is there any symmetric or asymmetric dependence between variables? Does the dependence structure between SCDS spreads and explanatory variables change across quantiles and countries?

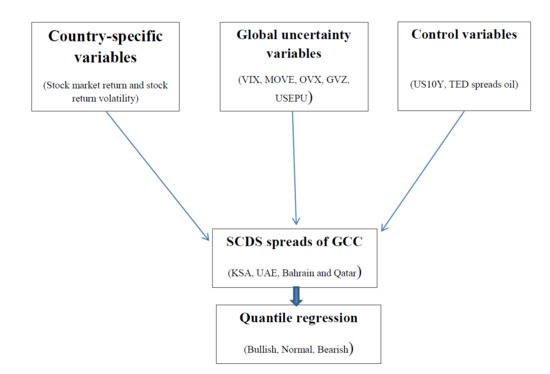
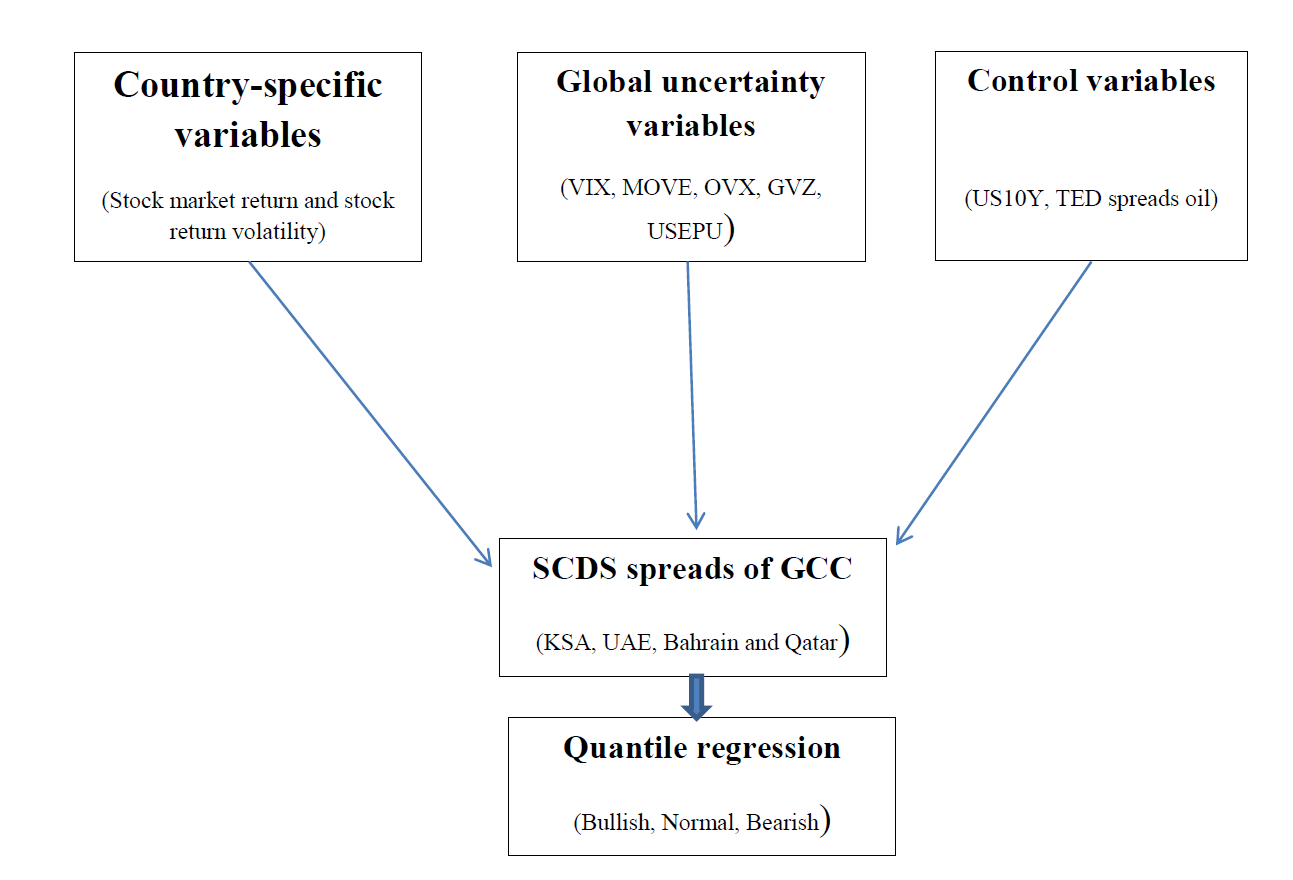
3. Model Specification and Methodology
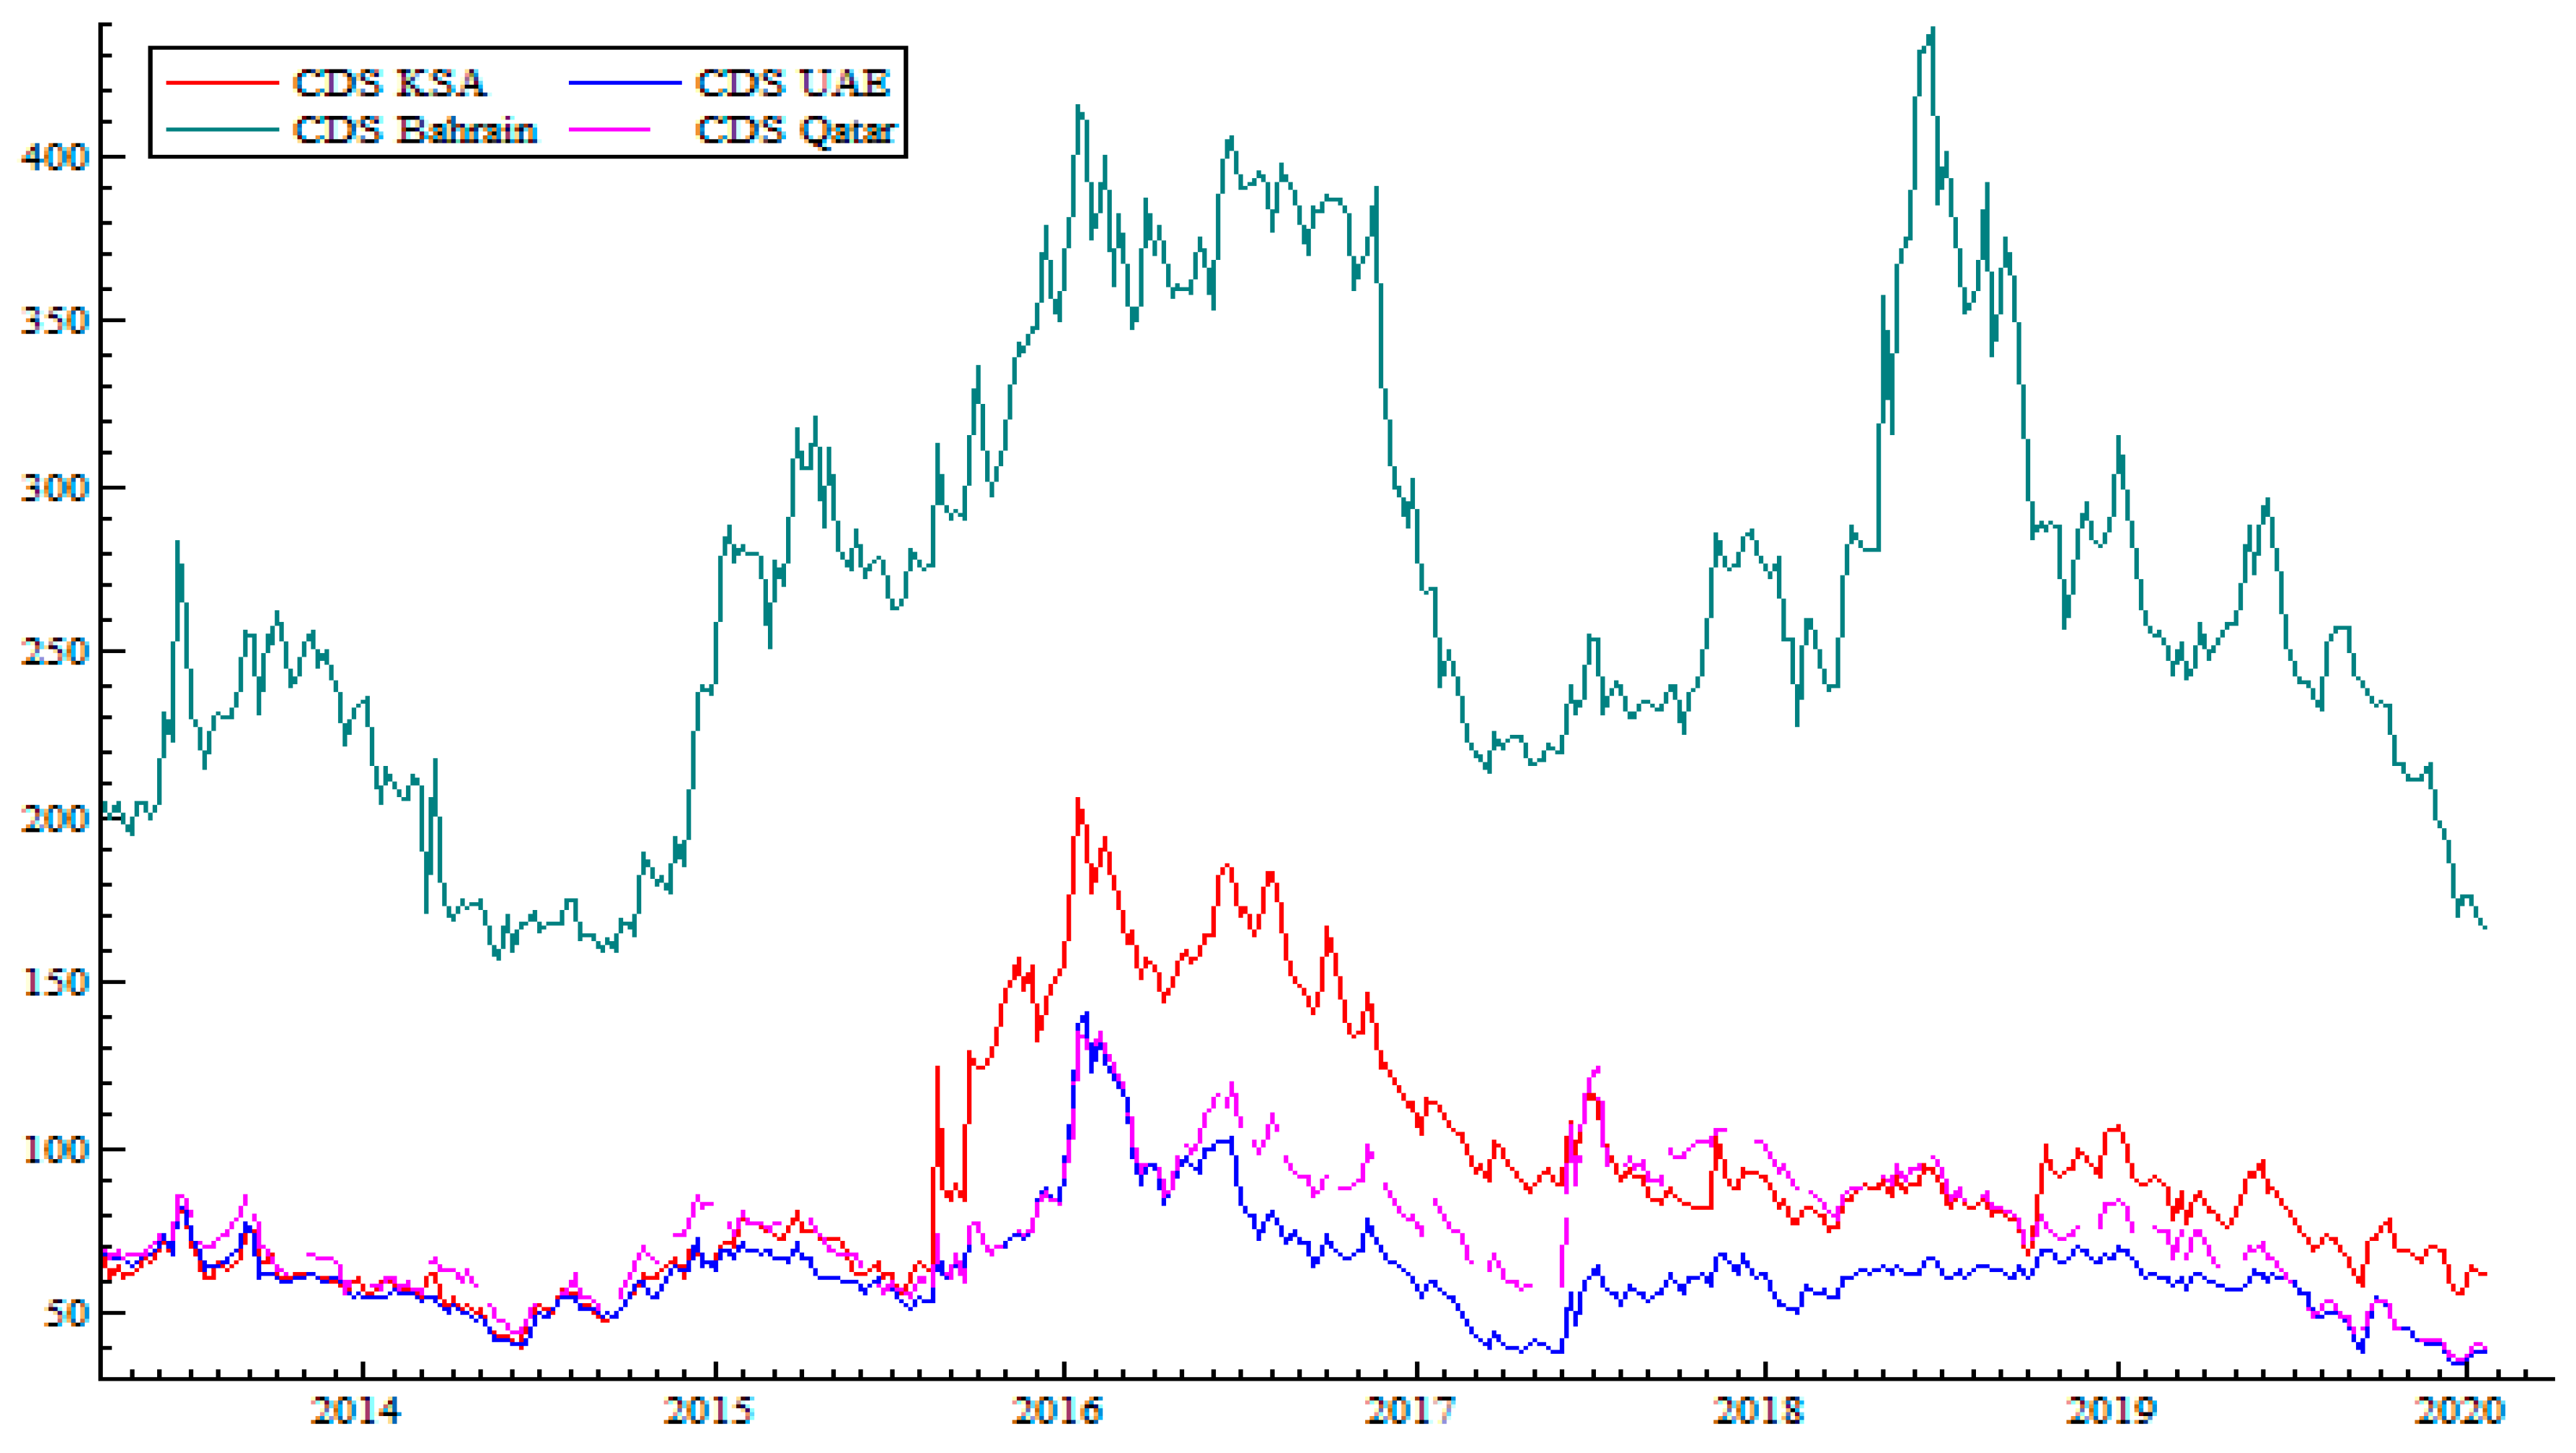
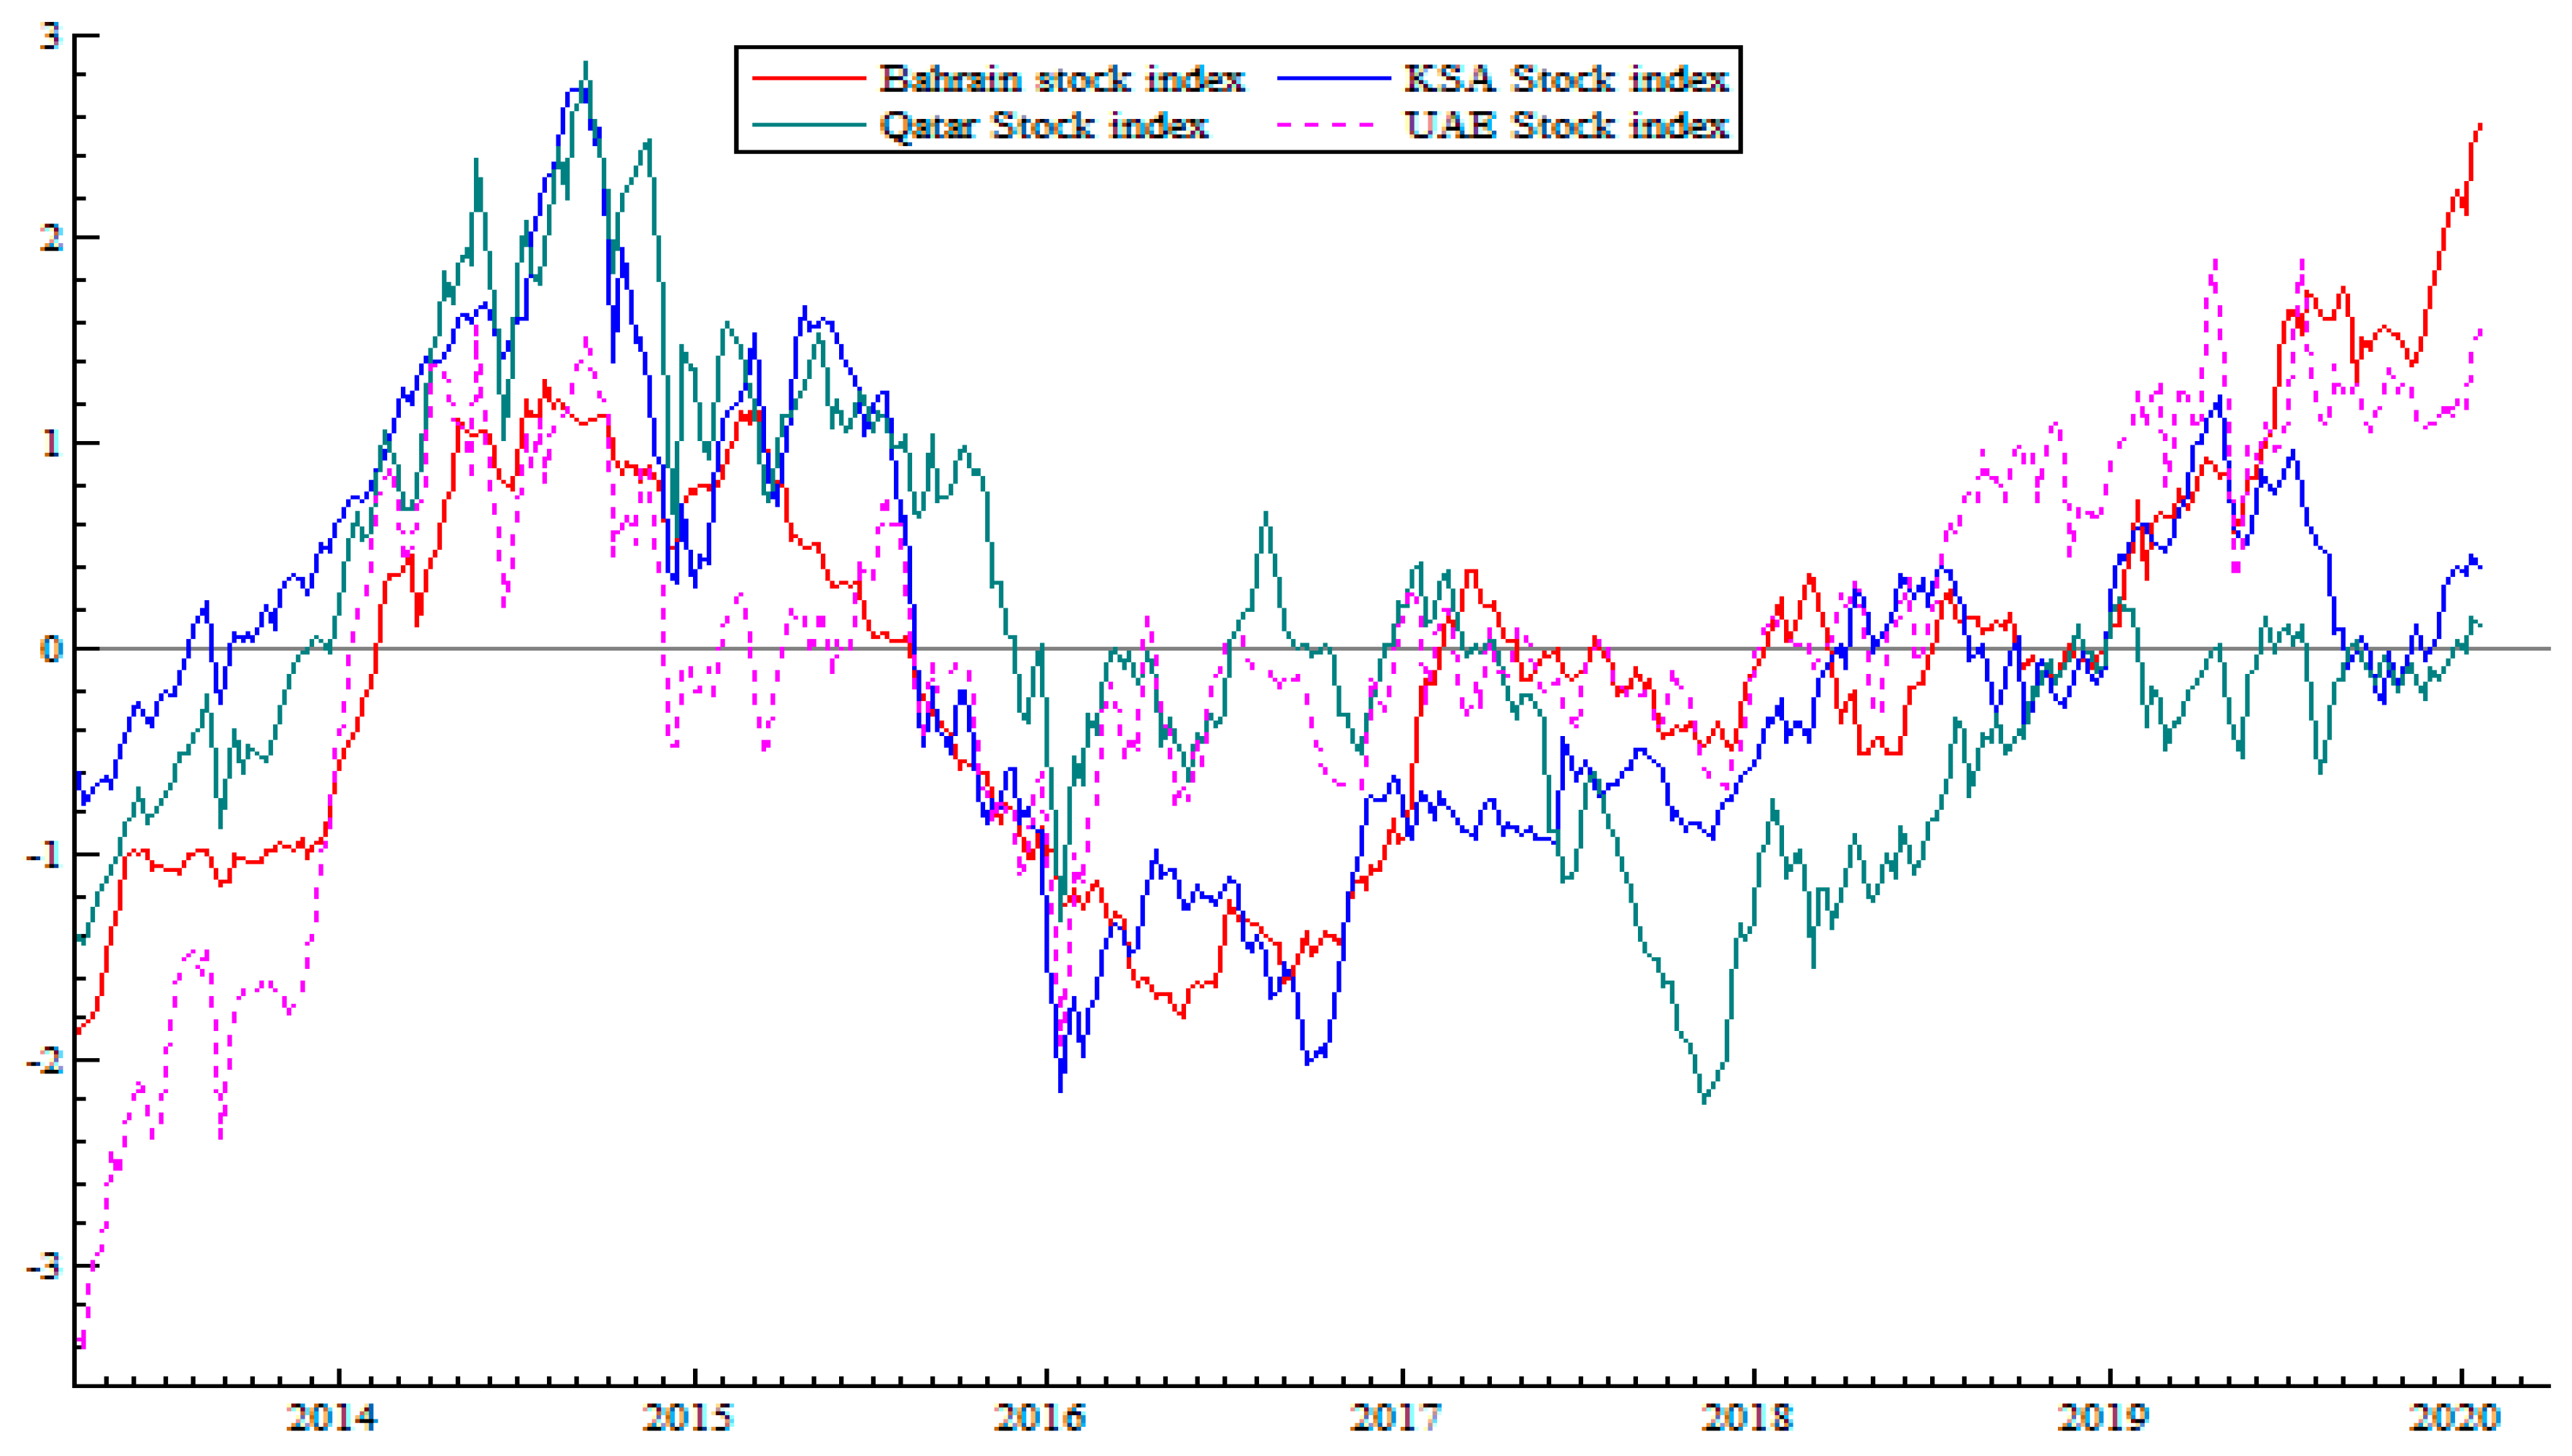
We examined the impacts of country-specific and global factors on SCDS spreads in the GCC region. The following baseline model was applied to incorporating the potential effect of explanatory variables. We conducted both levels and changes of SCDS premiums on key explanatory variables suggested by economic theory:
Δ S C D S i , t = γ i + β 1 S R t + β 2 S V t + β 3 V I X t + β 4 M O V E t + β 5 O V X t +   β 6 G V Z t + β 7 U S E P U t + β 8 U S 10 Y t + β 9 T E D t +   β 10 O I L t + ε i , t
where S C D S i , t denotes the sovereign CDS spreads changes on the ith country in time t, S R t represent the stock market return, S V t is the stock market volatility,   V I X t is the implied volatility on S&P 500 index options, M O V E t is the Merrill Lynch Option Volatility Estimate Index, O V X t represents the crude oil volatility index,   G V Z t is the gold volatility index, U S E P U t the global economic policy uncertainty, US10Y is the 10 years US Treasury rate, O I L t is the US crude oil prices and ε i , t . refers to the random error term. γ i denotes country effects and β i represents the sensitivity of SCDS spreads to the corresponding influential factors.
Equation (1) assumes that the changes in explanatory variables have symmetrical effects on stock returns. To capture the asymmetric impact of country-specific financial variables and global uncertainty factors on SCDS spreads, we used the quantile regression model introduced by Koenker and Bassett (1978). Generally, the model can be formulated as follows:
Q y t ( τ / X t ) = α τ + X t β τ
where Q y t ( τ / X t ) denotes the τ th conditional quantile of y t , X t represents the vector of explanatory variables. β τ and α τ represent the estimated coefficients and unobserved effects at quantile τ, respectively. More formally, any random variable “y” may be characterized by its distribution function F ( y ) = P r o b ( Y y ) , while for any 0 < τ < 1 ,   Q ( τ ) = i n f { y : F ( y ) τ } is called the τ   t h quantile of Y. The quantile function provides a complete characterization of the random variable. The quantiles may be characterized as the solution to a simple optimization problem (e.g., Koenker and Bassett 1978; Koenker 2005). More formally, taking a random sample y1, y2, y3, … yn with the empirical distribution function F ^ y ( α ) = 1 n { y i α } , the empirical unconditional quantile function is defined as
Q ^ y ( τ ) = F ^ y 1 ( τ ) = i n f { α / F ^ y ( α ) τ }
The quantiles can be expressed as the solution to a minimization problem:
Q ^ y ( τ ) = a r g m i n α { i : y i α τ | y i α | + i : y i < α ( 1 τ ) | y i α | }
We evaluated the sensitivity of SCDS spreads across seven quantiles τ = {0.05; 0.1; 0.25; 0.5; 0.75; 0.9; 0.95}, which include the median (50%), the lower quantile τ = {0.05; 0.1; 0.25} and the upper quantiles τ = {0.75; 0.9; 0.95}. It is noteworthy that the values of   β i , t characterize the market co-movement between dependent and explanatory variables.

4. Data Description

4.1. Data Description

The sample of this study consists of CDS data with a 5 years maturity, as these contracts are the most liquid in the CDS market6. The CDS data consist of weekly changes in sovereign CDS mid-spreads. Data were collected from Bloomberg for the period from 5 April 2013, to 17 January 20207. The weekly changes in CDS spreads are expressed in basis points (bps). Figure 1 displays the time trends in the four GCC sovereign CDS spreads during the period of the study.
Figure 1 shows that the SCDS spreads of Bahrain exhibit a remarkable rise starting in mid-2014 when the oil prices declined sharply and peaked during the period 2016–2017. In the case of Saudi Arabia, the UAE, and Qatar, the sudden rise of SCDS spreads started in mid-2015 and peaked at the beginning of 2016. Figure 1 also indicates that the SCDS spreads of Bahrain exhibited a remarkable surge in mid-2018 following the decline of oil prices in June 2018. However, no rise in SCDS spreads is observed for other countries. Thus, the cost of insuring Bahrain’s sovereign credit risk is less resilient to oil market volatility than the other GCC countries8.
The explanatory variables used in this study are country-specific financial and economic variables and global uncertainty and macroeconomic variables, which are available at a weekly frequency and deemed to be relevant in the sovereign credit risk literature. For country-specific financial variables, we used the weekly return of the country’s stock index using the log difference and the volatility of return estimated by using the GARCH (1,1) model9. Figure 2 displays the time trends in the four GCC stock indices during the period of the study.
Figure 2 shows that the stock market indexes exhibit a significant decline starting in mid-2014 when oil prices declined sharply and peaked at the beginning of 2016. To account for the effect of financial uncertainty on SCDS, we used the VIX index (commonly referred to as the “Fear Index”), which measures the implied volatility of a wide range of options based on the S&P 500 index. This index is considered to be the world’s premier barometer of financial market volatility. To account for the effect of global uncertainty on bond markets, we use the Merrill Lynch Option Volatility Estimate (MOVE) index (commonly referred to as the “VIX for Bonds”). This index can be useful to measure the global bond market sentiment. To account for the effect of oil price uncertainty, we used the Crude Oil Volatility Index (OVX) published by the Chicago Board Options Exchange (CBOE). The OVX index measures the market’s expectation of the 30 days volatility of crude oil prices by applying the VIX methodology. To account for the effect of commodity market uncertainty on SCDS, we used the CBOE Gold exchange traded funds (ETF) Volatility (GVZ) index (commonly referred to as the “Gold VIX”). The GVZ index measures the market’s expectation of the 30 days volatility of gold prices by applying the VIX methodology. Figure 3 displays the time trends of global financial and commodity market uncertainty factors.
For the global economic uncertainty, we used the US. The Economic Policy Uncertainty (EPU) index, which is a daily news-based index computed based on the Access World News’ News Bank service. This index reflects the frequency of newspaper articles, which include terms about “economics”, “policy” and “uncertainty” in roughly 2000 US newspapers (Baker et al. 2020). For global market variables, we used the 10 years US Treasury rate as a proxy for the world interest rate, and to capture changes in aggregate liquidity, we use the TED spread10. The 10 years US Treasury rate is the most important long-term interest rate in the world. The TED spread is the difference between the interest rates on interbank loans and on short-term US government debt. It is an indicator of perceived economic risk, monetary liquidity, and the perceived credit risk of the global financial banking system11. We also used the US crude oil prices to explain the SCDS spreads changes. Since GCC countries are major oil exporters in the MENA region, oil prices affect country income and are then expected to affect the SCDS spreads when oil prices fluctuate. In other words, when oil prices are high, the GCC country generates dollar revenue by exporting oil, and these countries are more likely to repay their external debt, which reduces the SCDS spread they face in international capital markets. Table 1 summarizes the dependent variable, the explanatory variables, and the expected sign of coefficients.

4.2. Preliminary Analysis

Table 2 presents the summary statistic of the SCDS spreads changes and the explanatory variables.
Table 2 indicates that the mean value and standard deviation of Bahrain CDS spread changes are higher than the mean value, and the standard deviation of Saudi Arabia, Qatar, and UAE CDS spreads changes. The Kurtosis coefficients for the SCDS spreads > 3, and the skewness coefficients for the SCDS spreads are different to zero. The SCDS spreads changes tend to have heavy tails or outliers. The results show that the unconditional distribution of SCDS is asymmetric and they justify the use of a quantile regression. The Jarque–Bera test confirms the rejection of the normality distribution of all series. Figure 4 shows the non-normality of the SCDS spreads of all countries and provides further motivation for using the quantile regression approach.

5. Empirical Results and Discussion

In this section, we apply the quantile regression approach to investigate the effects of global uncertainty factors, local financial variables, and global financial market variables on SCDS spreads changes under different market circumstances, including the bearish, bullish, and normal states. We estimate the quantile regression model of the sovereign CDS spreads for the GCC countries for the following seven quantiles: ( τ = 0.05 ,   0.10 ,   0.25 ,   0.5 ,   0.75 ,   0.9   a n d   0.95 ) . We reported the results of the ordinary least square (OLS) regressions in the first column of each table12.

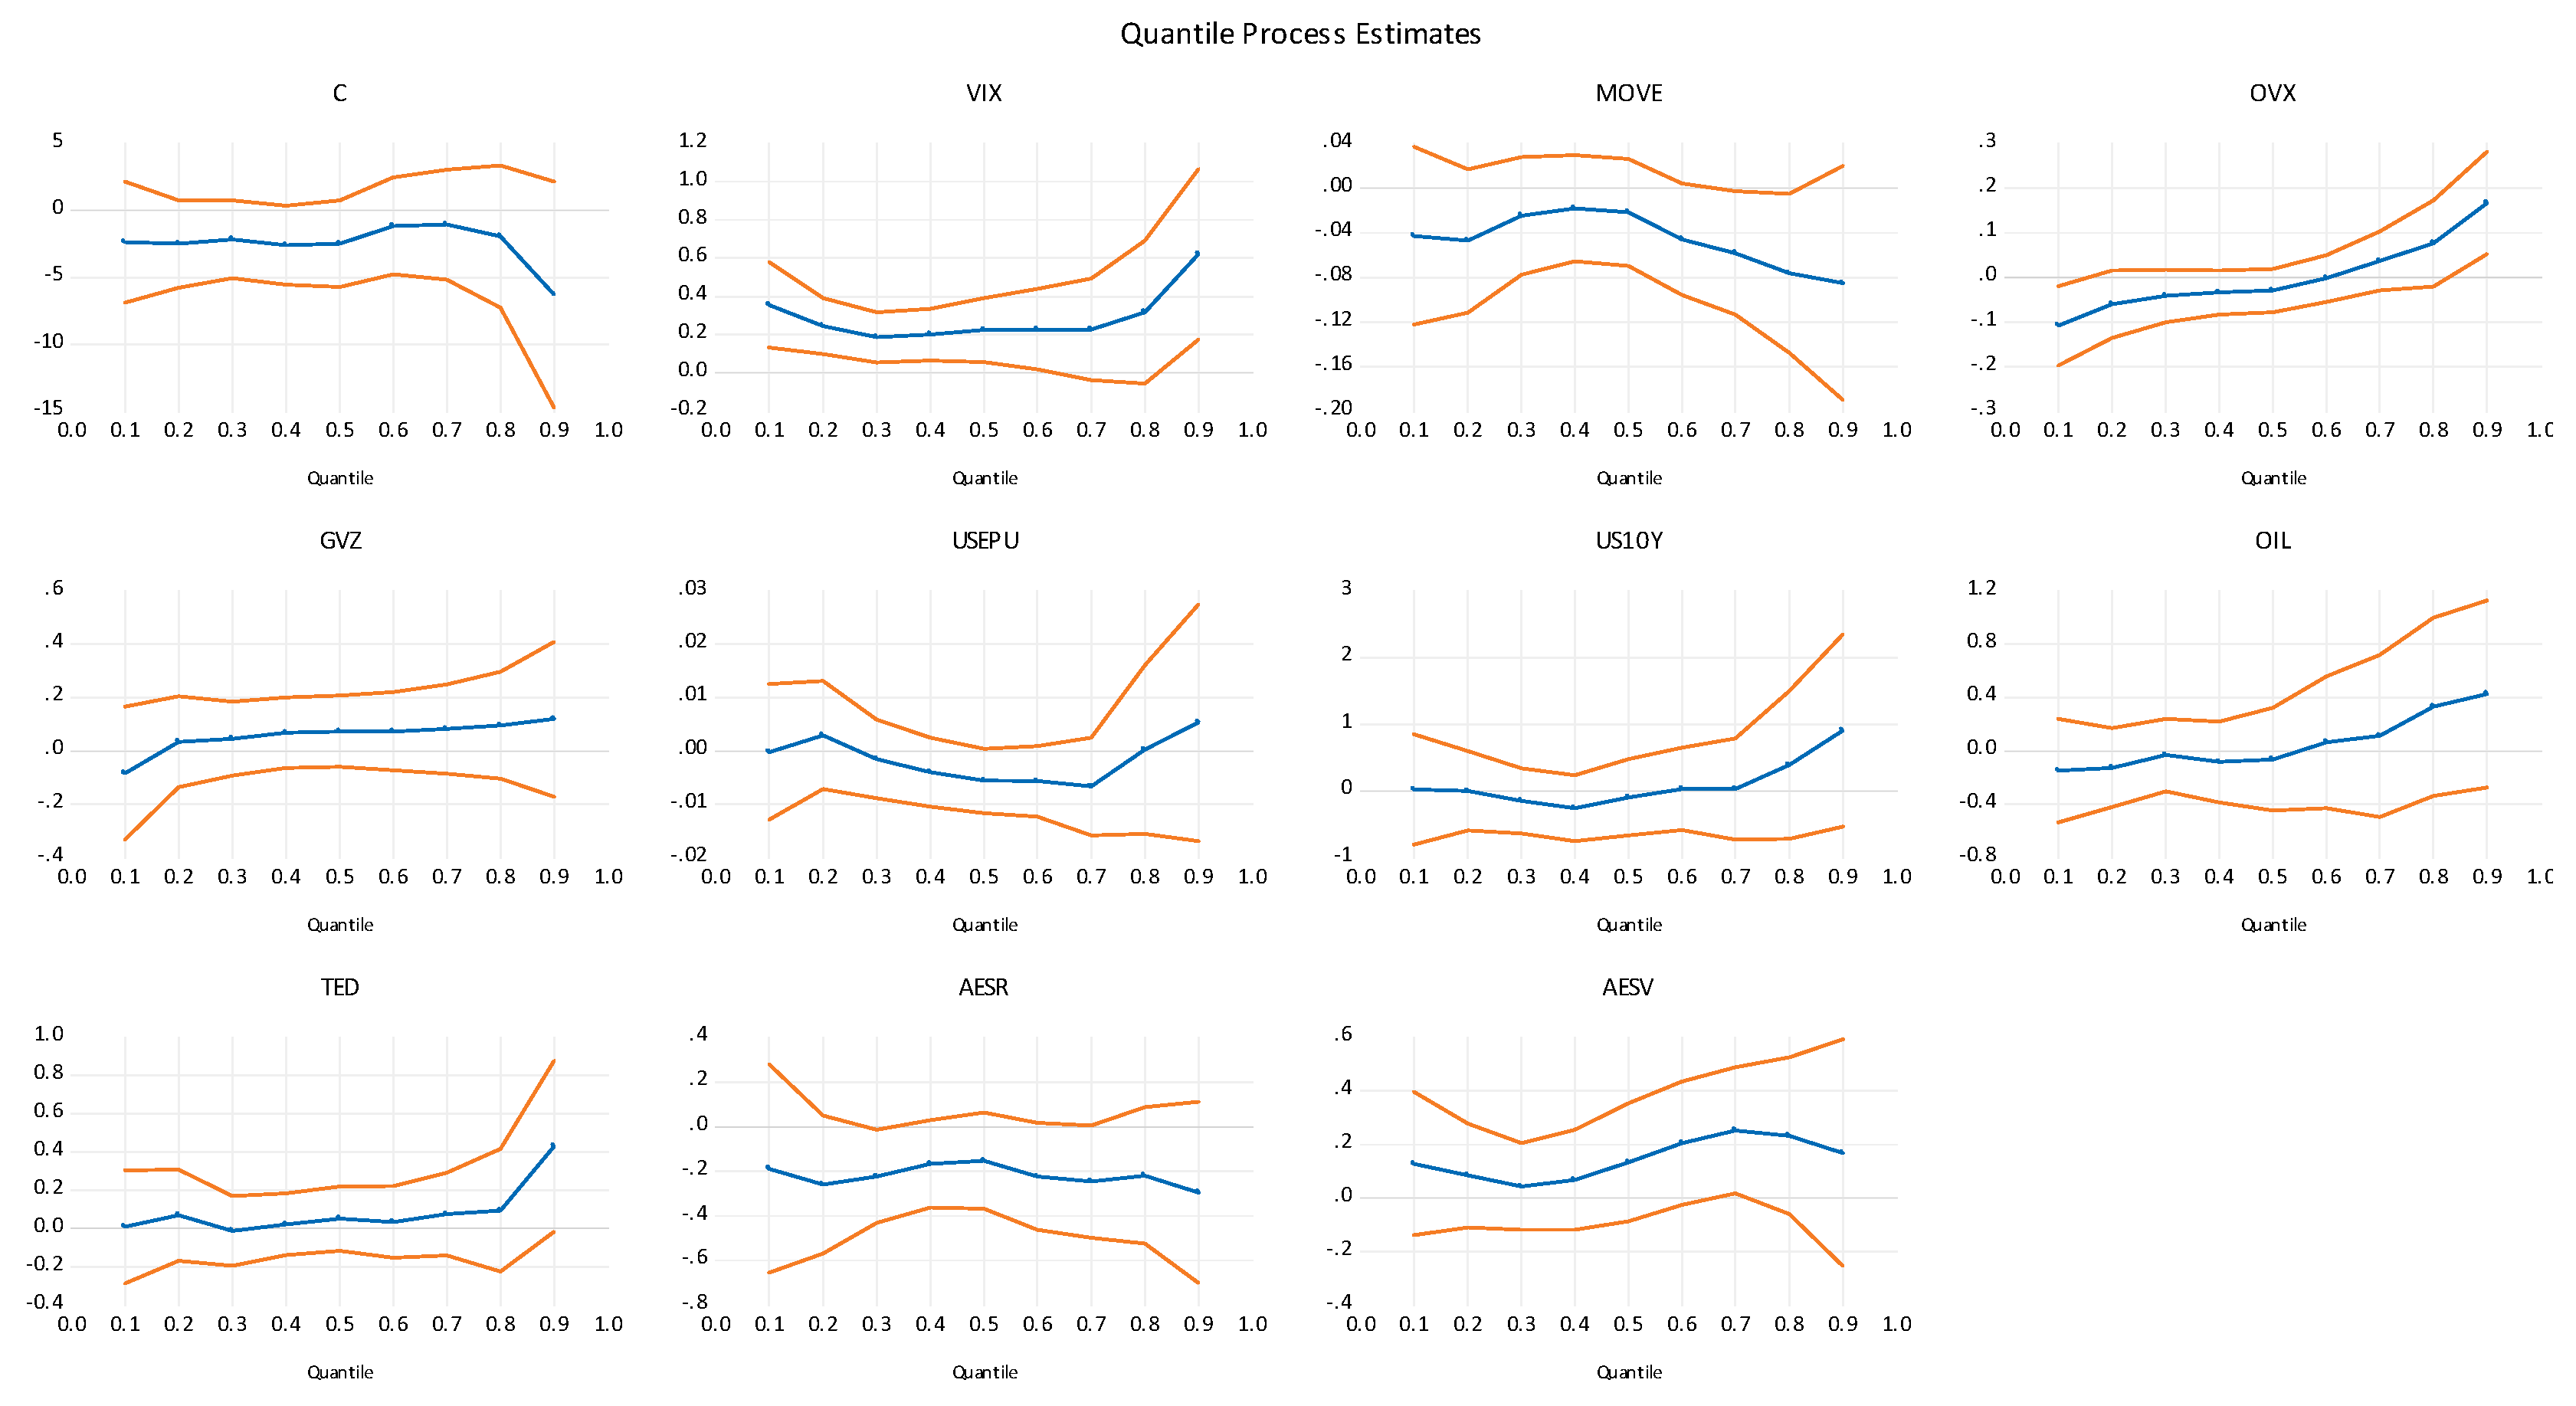
5.1. Empirical Results for UAE

Table 3 reports the quantile estimates in the case of UAE, and Figure 5 depicts the quantile regression parameter estimates along with the 95% confidence intervals (orange lines) for the impact of the explanatory variables on SCDS spread changes.
Figure 5 shows that there are significant slope coefficients when the SCDS spread changes, and global financial uncertainty (VIX and MOVE indexes) are sufficiently close to the tails of the distribution. The first column of Table 3 report the results from the OLS regression. The results show that the VIX index has a positive significant impact on the UAE CDS spread changes. As regards the oil price, the 10 years US Treasury rate, the TED spread, and stock return volatility, the coefficients are significantly positive. However, the OLS regression summarizes the average relationships between the explanatory variables and the dependent variable based on the conditional mean of the SCDS spreads changes, which do not allow the relationships to change across various market conditions. The quantile regression approach offers a complete picture. It provides information on the effects of the multiple explanatory variables on SCDS spread changes in different market conditions, such as bearish, normal, and bullish.
We can draw some exciting results from Table 3. First, we observe the positive effect of the VIX index on the UAE CDS spreads changes at all quantiles (except   τ = 0.75 ). This finding suggests that increasing the global financial uncertainty embedded in the VIX index leads to rising CDS spread changes when the CDS markets are bearish, normal, and bullish. This finding conforms to Merton’s structural model and appears to be similar to the results of Pan and Singleton (2008) and Longstaff et al. (2011). They document a similar strong relation between the sovereign credit risk and the VIX index. This is also consistent with the ‘flight-to-quality’ notion that during economic downturns, investors are more risk-averse and uncertain about future economic prospects, and this translates to higher credit spreads (Chan and Marsden 2014). Second, we note the negative impact of the MOVE index on the UAE CDS spreads changes only at the one upper quantile (τ = 0.75). This result suggests that increasing the global uncertainty in global bond markets leads to declining CDS spread changes when the CDS market is bullish. The impacts of the OVX index are positive and significant for upper quantiles (except for the extreme upper quantile   τ = 0.95 ), but negative and significant for lower quantiles (bearish market). This finding implies that a higher uncertainty level in the oil market appears to increase the UAE CDS spreads changes when the CDS markets are bearish and bullish. For the TED spreads, the effect is negative but not significant at the lower quantile (bearish market), but positive and significant at upper quantiles (including extreme bullish market). TED spreads present an indicator of the liquidity of the interbank credit market. This result suggests that the increase in TED spreads leads to the rise of CDS spread changes when the CDS markets are bullish. The asymmetric effect of the TED spread indicates that bear (bull) markets are often accompanied by tighter (looser) financial market liquidity. Following the ‘flight-to-quality’ effect, fearful investors in bear markets look for selling risky and purchase safe-haven assets (e.g., gold) during market turmoil, which increases liquidity pressure in the financial market.
The US 10 years Treasury bills positively affect CDS spreads changes only at the extreme upper quantiles. This finding suggests that increasing the world interest rates led to the rise in UAE CDS spreads only in a severe bullish market. This finding conforms to Chan and Marsden (2014), who found that an increase in interest rates, which reflects a positive economic shock, reduces credit spreads. Regarding the country-specific factors, we observed a significant and negative impact of stock market returns on CDS spreads changes for the upper and lower quantiles. This finding suggests that increasing the stock market returns leads to a decline in CDS spread changes when the CDS markets are bearish and bullish. This finding can be explained by the fact that the stock market is considered to be the country’s economic barometer and reflects the investors and the economic fundamentals of that country. An increase in the stock market returns conveys a positive message to international investors on the country’s economic fundamentals and then, a decrease in the CDS spreads. In addition, an increase in the sovereign default risk level may cause more taxes and a rise in the cost of capital/higher credit spreads for domestic companies, reducing future earnings and stock prices (Da Silva 2014). Chan-Lau and Kim (2004) extend Merton’s (1974) model to sovereign debt markets. They show that the prices formed in stock markets should convey information regarding sovereign credit risk.
This finding is consistent with Chan et al. (2009), who found a strong negative correlation between the CDS spread and the stock index for most Asian countries. However, the impact of stock return volatility is only limited to one quantile ( τ = 0.75 ) in the case of the UAE. Finally, we found that UAE CDS spreads changes are not affected by global economic policy uncertainty and the market’s expectation of volatility of gold prices (GVZ index). These findings confirm that UAE CDS spreads are independent of the global economic uncertainty and global uncertainty in the gold market.

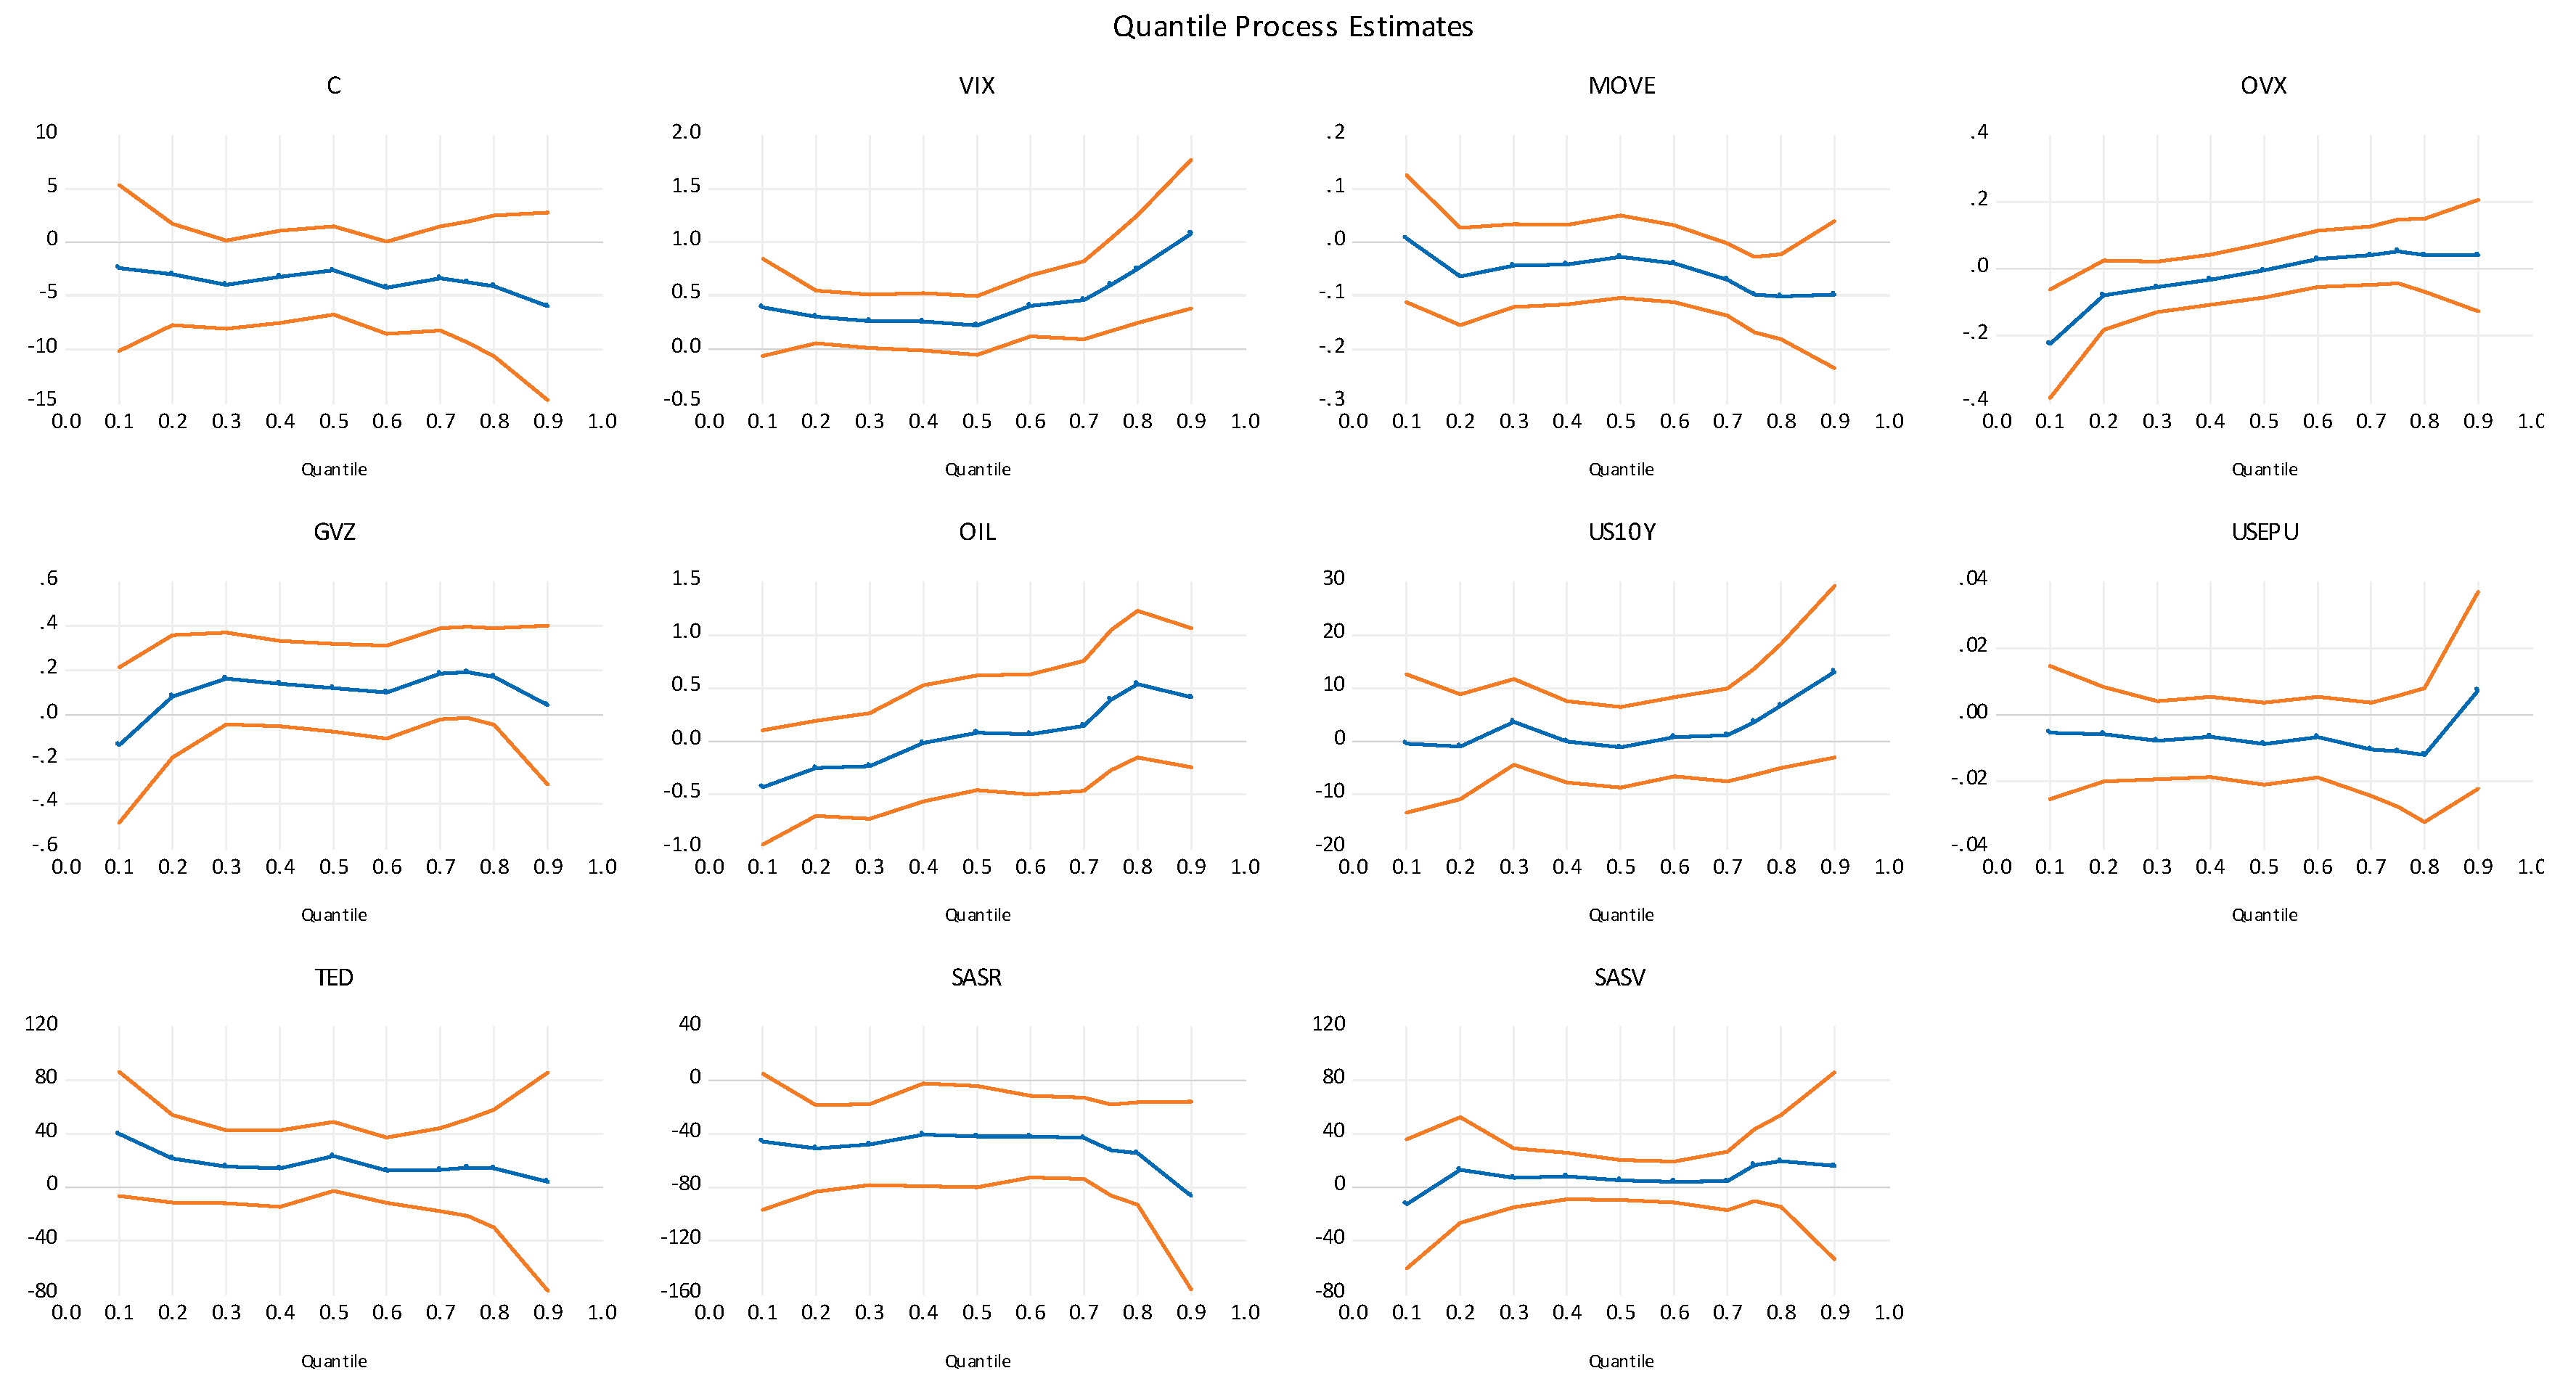
5.2. Empirical Results for Saudi Arabia

Table 4 reports the quantile estimates in the case of Saudi Arabia.
From Table 4, we can draw some interesting findings. The results show that MOVE, OVX, and GVZ are not associated to SCDS in the case of Saudi Arabia using linear regression. However, different findings were obtained when we used quantile regression. First, we observed the positive and significant effects of the VIX index on Saudi Arabia CDS spreads changes at upper and lower quantiles. This finding suggests that increasing the global equity market uncertainty (VIX index) leads to rising CDS spread changes when the CDS markets are bearish and bullish. For intermediate quantiles, there was no impact on CDS spread changes. This result confirms co-movement between Saudi Arabia CDS spreads changes and global financial uncertainty and plays a significant role when it was extremely high or low. Hence, past information on global financial uncertainty can provide useful information for forecasting CDS spread changes, except for intermediate quantiles (normal market conditions). The asymmetric effect of the VIX index on CDS spreads changes indicates that bear (bull) markets are often accompanied by higher (lower) CDS spreads changes. Considering the impact of global bond market uncertainty on CDS spreads changes, our evidence indicates that these had no impact under normal and extreme upper and lower market movements, but had a negative impact only on one quantile ( τ = 0.75 ) at the upper quantiles. This finding confirms that global bond market uncertainty (represented by the MOVE index) is unable to provide useful information for forecasting CDS spread changes. The parameter estimates for the impact of oil prices on CDS spreads are depicted in Figure 6, which shows that there was no co-movement. These results confirm that oil prices play no role in shaping CDS spreads changes. A possible reason is that Saudi Arabia holds a sizeable sovereign wealth fund13, which it uses as a cushion against volatility in the oil markets. Moreover, Saudi Arabia adopts new strategies under the 2030 vision to promote non-oil trade. However, the uncertainty in the oil market (OVX index) affects the sovereign credit risk changes negatively only at the lower quantiles (when CDS markets are bearish). For the TED spreads, the effect is positive but not significant at the upper quantile (bullish market), but significant at the lower and intermediate quantiles (including normal and bearish CDS markets). This result suggests that increasing TED spreads lead to rising CDS spread changes when the CDS markets are bearish and normal. Finally, we found independence between economic policy uncertainty, the US 10 years Treasury bills, stock market return volatility, and CDS spread changes. This finding suggests that global economic uncertainty and the world interest rate local stock return volatility are unable to provide useful information for forecasting CDS spread changes in the case of Saudi Arabia.

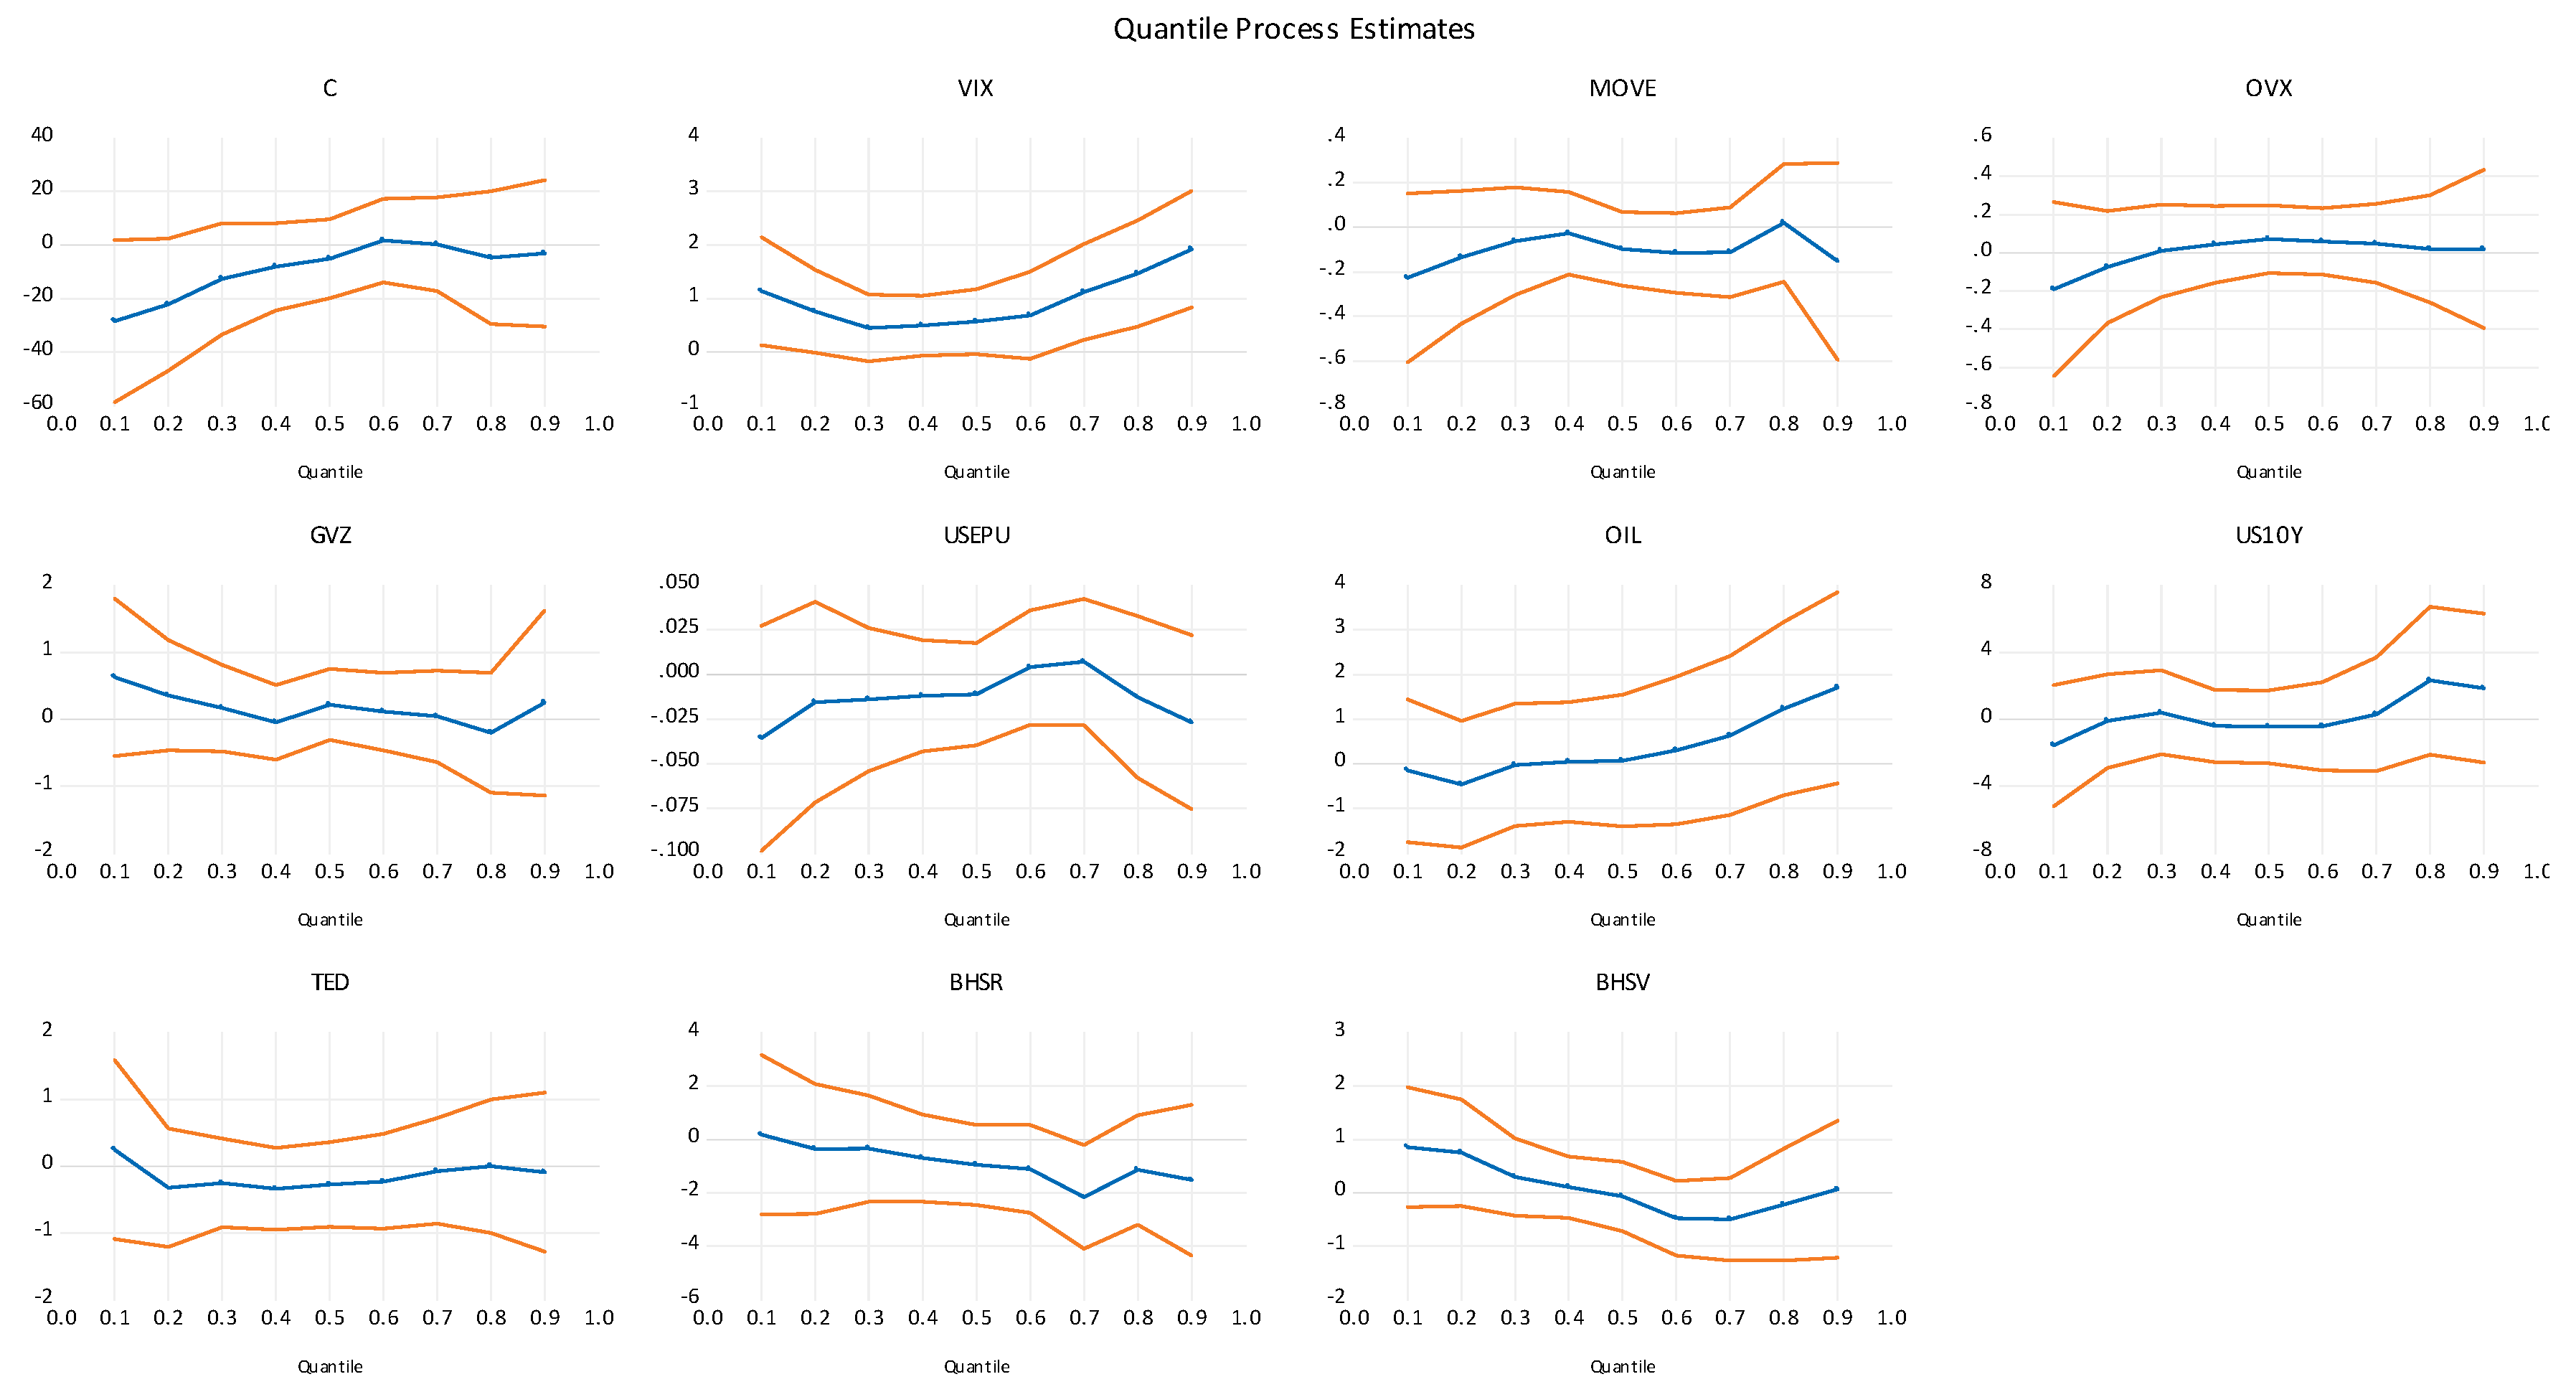
5.3. Empirical Results for Bahrain

Table 5 reports the quantile estimates in the case of Bahrain.
The linear regression results (Table 5, first column) show that the MOVE and OVX indexes are not associated to SCDS in the case of Bahrain. However, different findings were obtained when we used quantile regression. Table 5 demonstrates a positive and significant effect of the VIX index on Bahrain CDS spreads changes at the upper and intermediate quantiles. This finding suggests that increasing the global equity market uncertainty leads to rising CDS spread changes when the CDS markets are normal and bullish. For lower quantiles, there was no impact on CDS spread changes. Regarding the impact of global bond market uncertainty on CDS spreads changes, empirical results indicate that the MOVE index had no impact under lower, normal, and upper quantiles (except extreme upper quantile τ = 0.75 ). This finding confirms that global bond market uncertainty is unable to provide useful information for forecasting Bahrain CDS spread changes except for the extreme market movement (extreme bullish market condition). From Table 5 and Figure 7, we observe no co-movement between the oil price, uncertainty in the oil market, and CDS spreads changes. These results confirm that oil prices and uncertainty in the oil market play no role in shaping CDS spreads changes. A possible reason is that Bahrain is a minor oil producer compared to its GCC neighbors.
Furthermore, we found independence between global factors (volatility of gold prices, economic policy uncertainty, TED spreads, and the US 10 years Treasury bills) and CDS spread changes. This finding suggests that global economic uncertainty, uncertainty in the gold market, the world interest rate, and the word liquidity proxy are unable to provide useful information for forecasting CDS spread changes in the case of Bahrain. Regarding the country-specific factors, we observed a significant and negative impact of stock market returns on CDS spreads changes for the upper and lower quantiles. This result suggests that increasing the stock market returns leads to a decline in CDS spread changes when the CDS markets are bullish. However, we find that Bahrain CDS spreads changes are not affected by local stock return volatility.

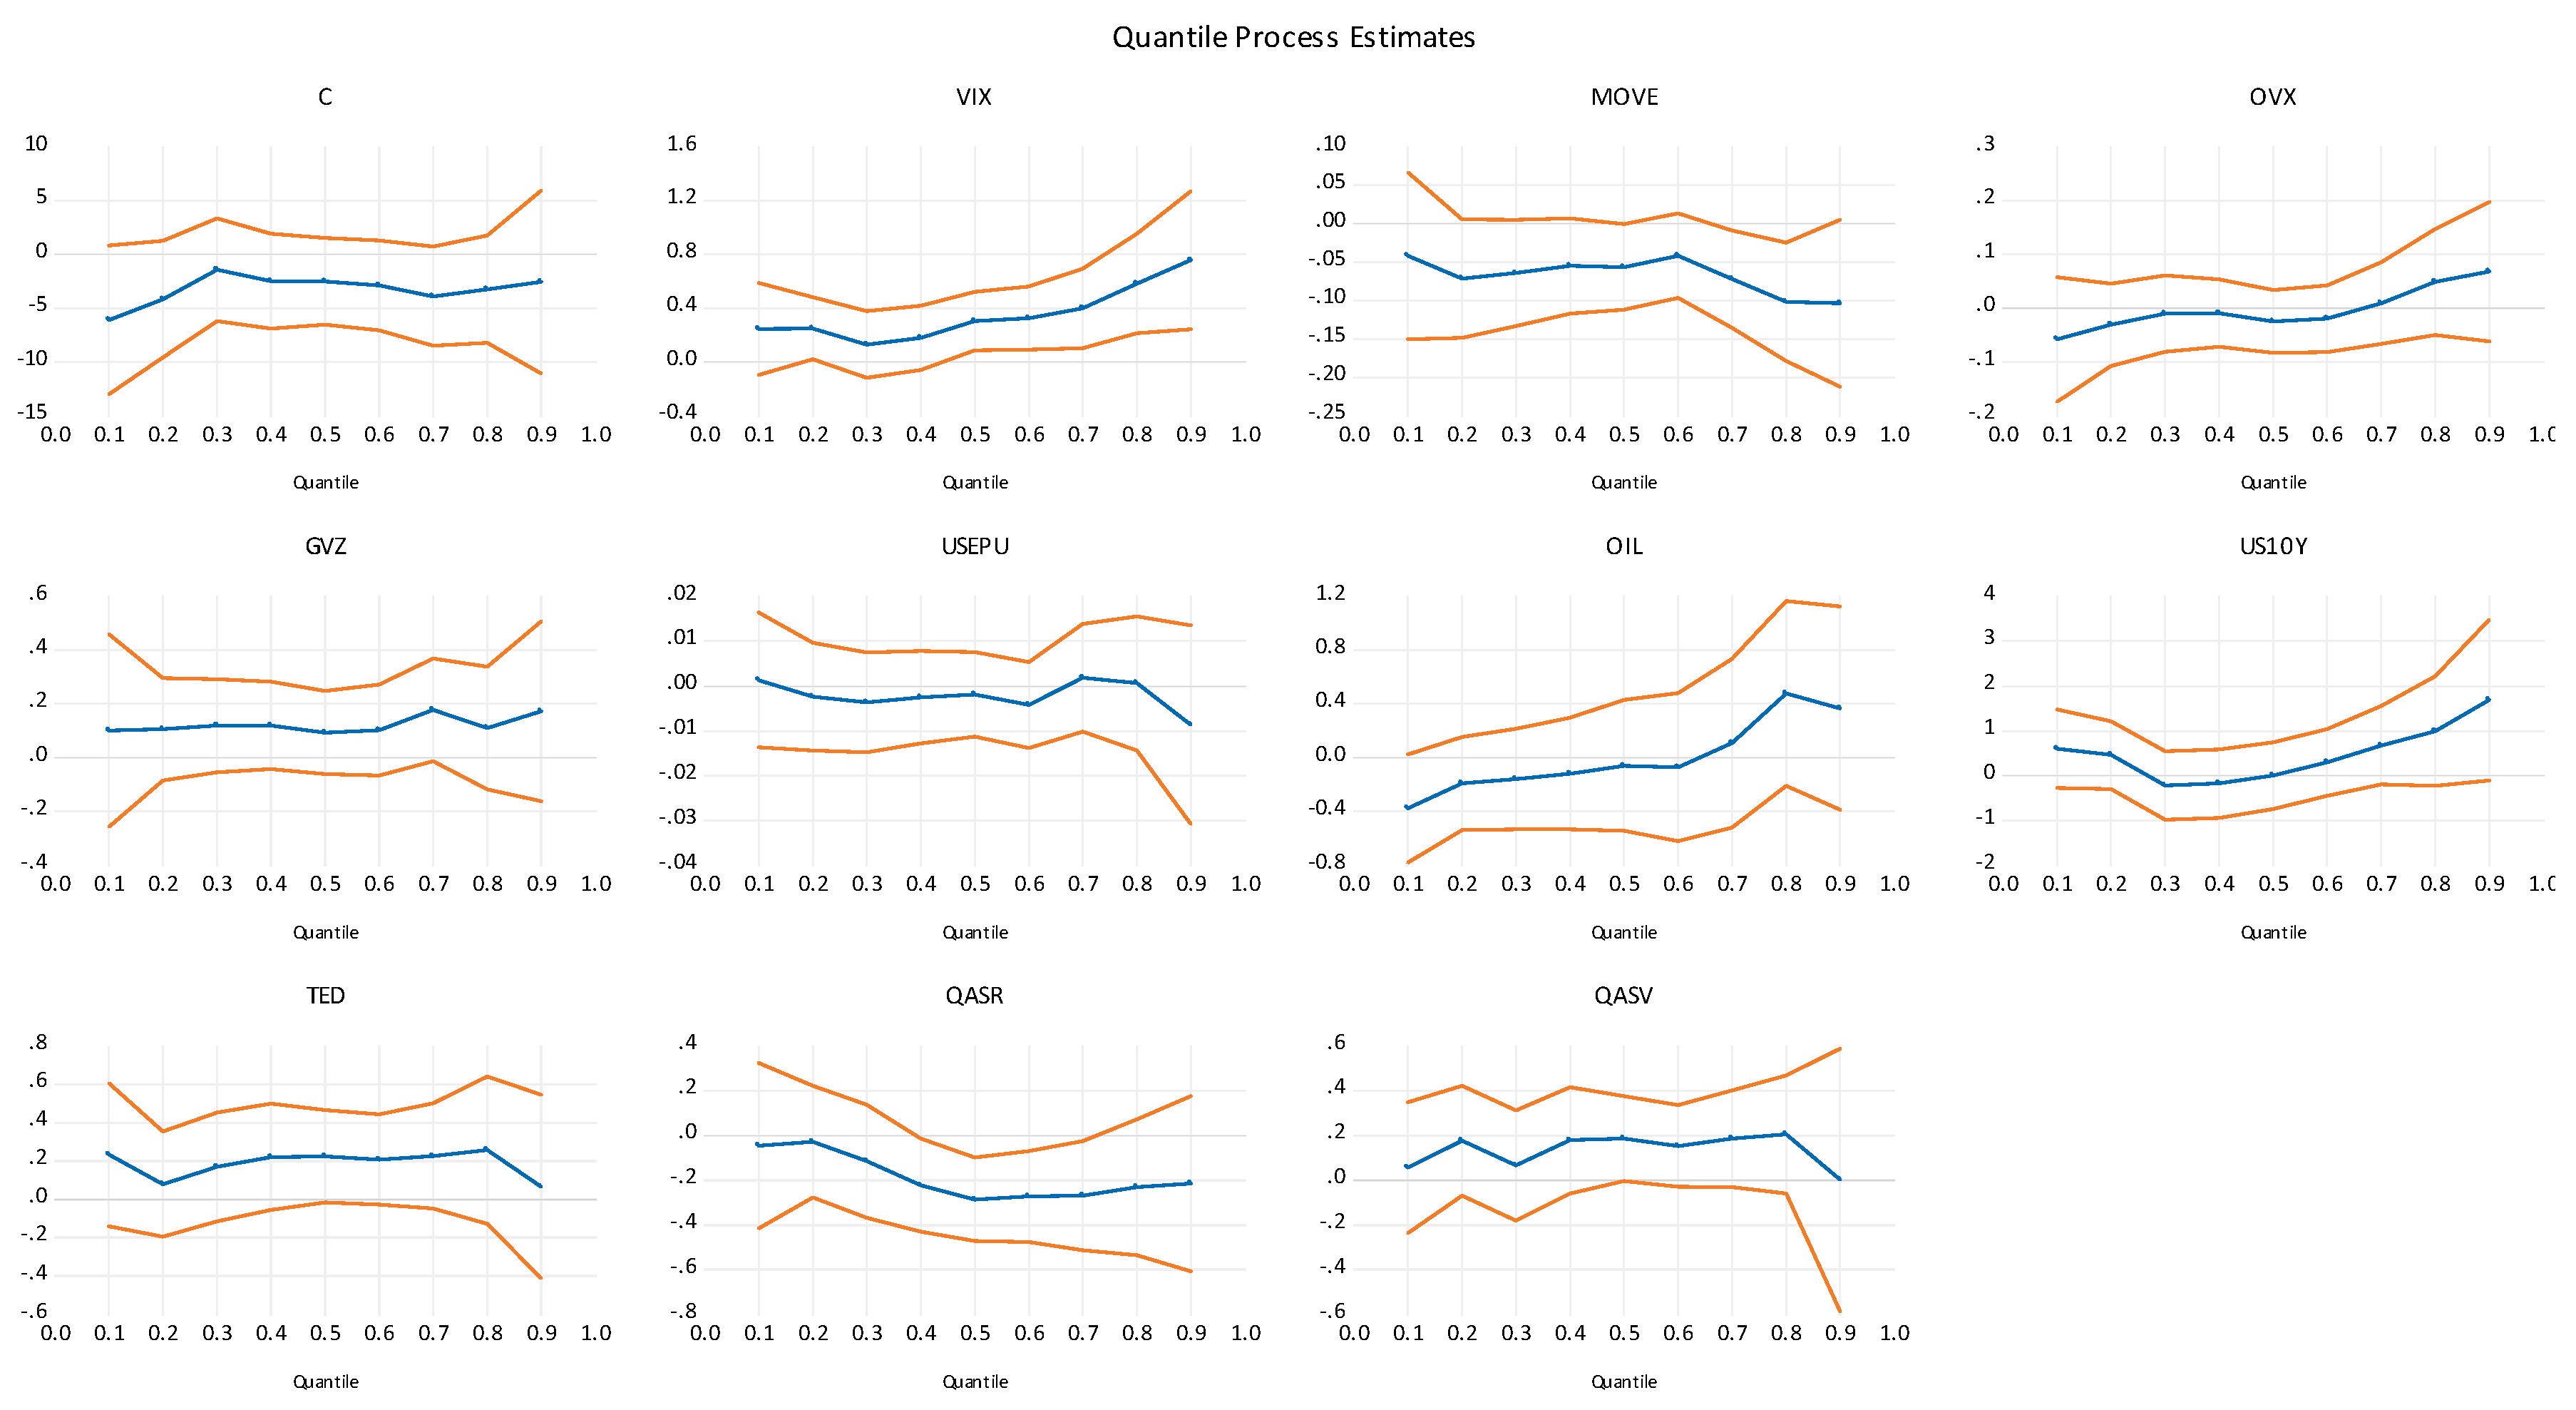
5.4. Empirical Results for Qatar

Table 6 and Figure 8 report the quantile estimates in the case of Qatar.
Table 6 indicates a positive and significant effect of the VIX index on Bahrain CDS spreads changes at the upper and intermediate quantiles. This finding suggests that increasing the global equity market uncertainty leads to rising CDS spread changes when the CDS markets are normal and bullish. For lower quantiles, there was no impact on CDS spread changes. Concerning the effect of the MOVE index on CDS spreads changes, our evidence indicates that the global bond market uncertainty had no effect under lower market movements, but had a negative impact at the intermediate and upper quantiles (when the CDS markets are normal and bullish). This finding confirms that global bond market uncertainty can provide useful information for forecasting CDS spread changes only when the CDS markets are normal and bullish. The impacts of oil prices are negative at lower quantiles. This finding would indicate that investors and policymakers can use the information on oil prices to forecast sovereign credit risk changes when the market is bearish. The US 10 years Treasury bills positively affect CDS spreads changes only at the upper quantile ( τ = 0.90 ). However, the TED spreads positively affect Qatar CDS spreads changes only at the intermediate quantile (normal market conditions).
Regarding the country-specific factors, we noted a significant and negative impact of the stock market returns on CDS spreads changes for the upper and intermediate quantiles. This finding suggests that increasing the stock market returns leads to a decline in CDS spread changes when the CDS markets are normal and bullish. The stock return volatility positively affects the CDS spread changes at the normal and extreme lower quantiles. This finding confirms that local stock return volatility can provide useful information for forecasting CDS spread changes when CDS markets are normal and extremely bearish. Table 7 summarizes the empirical results for Saudi Arabia, Qatar, Bahrain and UAE during the bearish, normal and bullish market conditions.

5.5. Robustness Check

To check the validity of our results, we conducted a series of robustness checks, including the slope equality test and the variation of random seeds. First, we ran the slope equality test across the quantiles, as presented by Koenker and Bassett (1982) 14. The Wald approach was used, and the asymptotic covariance matrix was estimated using the method of Hendricks and Koenker (1991). The results indicate that the coefficients of the majority of the explanatory variables differed across the quantiles and that the conditional quantiles were not identical15. Second, as the bootstrap approach estimates the standard errors for quantile estimate coefficients, the significant level might change by the random seeds. Therefore, we checked the robustness of our empirical results with different seeds. The results are unchanged, and we can deduce that our results are robust to the chosen seed. The results were not reported in the paper to conserve space but are available upon request.

6. Conclusions

The recent collapse in crude prices combined with the economic downturn from coronavirus and the alarming widening of the CDS spreads in the credit markets have renewed the interest to investigate the determinants of sovereign credit risk in the case of the biggest oil producers in the Middle East. Sovereign CDS spreads reflect market participants’ perceptions regarding the creditworthiness and the financial health of creditor countries. In this study, we investigated the joint effects of global and local financial factors on SCDS spreads changes in the case of GCC countries, which are for Saudi Arabia, the UAE, Qatar, and Bahrain. We used country-specific factors, global uncertainty factors, and global financial factors to explain variation in SCDS spreads across different quantiles and different CDS market conditions.
Using daily data from 5 April 2013, to 17 January 2020, our empirical results suggest that the effects of global and local financial factors on the GCC CDS spread changes are related to market conditions. The most significant variables for all SCDS spread changes are the global financial uncertainty embedded in the VIX index and the global conventional bond market uncertainty embedded in the MOVE index. The coefficients of the VIX and MOVE indexes are not the same under different market circumstances and across countries. The VIX index affect CDS spreads changes only in the upper quantiles in the case of Bahrain and Qatar. However, the VIX index impacts UAE CDS spreads in all quantiles (except τ = 0.75 ) and impacts the Saudi Arabia CDS spreads in the lower and upper quantiles (bearish and bullish market conditions). The MOVE index affects all GCC CDS spreads changes only in the upper quantiles (bullish and extreme bullish market conditions). This finding suggests that global bond market uncertainty can provide useful information for forecasting CDS spread changes only when the CDS markets are bullish. Regarding the impact of global economic policy uncertainty and global uncertainty in gold markets, we found no significant co-movement across all quantiles and for all countries.
On the other hand, regarding the impact of local factors on SCDS spreads changes, we found a significant and negative effect of stock returns on SCDS spreads for all countries. However, the coefficients are not the same across countries and under different market circumstances. For the impact of stock return volatility, we found no significant or weak co-movement limited in some quantiles in the cases of UAE and Qatar. The findings in this paper have implications for international investors and borrowers. In particular, GCC countries could diversify their economic activities and try to explicitly hedge exposures to global financial uncertainty factors in international financial and commodity markets. In addition, to gain the maximum benefit, decision-makers and foreign investors must consider not only the effects of the global and local factors on sovereign credit risk in the GCC region but also the asymmetric effects across different market circumstances. Understanding the dynamics of the SCDS spread is vital for international investors seeking portfolio investments and foreign borrowers seeking credit risk management and hedging strategies. For further empirical research, it would be interesting to explore the impacts of global uncertainty factors on SCDS spreads during the COVID-19 period and identifying the most affected country during the coronavirus period.

Funding

This research received no external funding.

Acknowledgments

The researcher acknowledges the Deanship of Scientific Research at Al Imam Mohammad Ibn Saud Islamic University (IMSIU), Saudi Arabia, for financing this project under the grant no. 381112.

Conflicts of Interest

The author declares no conflict of interest.

References

  1. António, Afonso, João Tovar Jalles, and Mina Kazemi. 2020. The effects of macroeconomic, fiscal and monetary policy announcements on sovereign bond spreads. International Review of Law and Economics 63: 105924. [Google Scholar]
  2. Aizenman, Joshua, Michael Hutchison, and Yothin Jinjarak. 2013. What is the risk of European sovereign debt defaults? Fiscal space, CDS spreads and market pricing of risk. Journal of International Money and Finance 34: 37–59. [Google Scholar] [CrossRef] [Green Version]
  3. Akyildirim, Erdinc, Shaen Corbet, Duc Khuong Nguyen, and Ahmet Sensoy. 2020. Regulatory Changes and Long-run Relationships of the EMU Sovereign Debt Markets: Implications for Future Policy Framework. International Review of Law and Economics 63: 105907. [Google Scholar] [CrossRef]
  4. Ang, Andrew, and Francis A. Longstaff. 2013. Systemic sovereign credit risk: Lessons from the US and Europe. Journal of Monetary Economics 60: 493–510. [Google Scholar] [CrossRef]
  5. Arezki, Rabah, and Markus Brückner. 2012. Resource windfalls and emerging market sovereign bond spreads: The role of political institutions. World Bank Economic Review 26: 78–99. [Google Scholar] [CrossRef] [Green Version]
  6. Baker, Scott R., Nicholas Bloom, Steven J. Davis, and Scarlet J. Terry. 2020. COVID Included Economic Uncertainty, Working Paper 26983. Available online: http://www.nber.org/papers/w26983 (accessed on 22 June 2020).
  7. Baum, Christopher F., and Chi Wan. 2010. Macroeconomic uncertainty and credit default swap spreads. Applied Financial Economics 20: 1163–71. [Google Scholar] [CrossRef] [Green Version]
  8. Beirne, John, and Marcel Fratzscher. 2013. The pricing of sovereign risk and contagion during the European sovereign debt crisis. Journal of International Money and Finance 34: 60–82. [Google Scholar] [CrossRef] [Green Version]
  9. Bouri, Elie, Maria E. de Boyrie, and Ivelina Pavlova. 2017. Volatility transmission from commodity markets to sovereign CDS spreads in emerging and frontier countries. International Review of Financial Analysis 49: 155–65. [Google Scholar] [CrossRef]
  10. Bouri, Elie, Syed Jawad, Hussain Shahzad, Naveed Raza, and David Roubaud. 2018. Oil volatility and sovereign risk of BRICS. Energy Economics 70: 258–69. [Google Scholar] [CrossRef]
  11. Chan, Kam Fong, and Alasta Marsden. 2014. Macro risk factors of credit default swap indices in a regime-switching framework. Journal of International Financial Markets, Institutions and Money 29: 285–308. [Google Scholar] [CrossRef]
  12. Chan, Kam C., Hung-Gay Fung, and Gaiyan Zhang. 2009. On the relationship between Asian credit default swap and equity markets. Journal of Asia Business Studies 4: 3–12. [Google Scholar] [CrossRef]
  13. Chan-Lau, Jorge A., and Yoon Sook Kim. 2004. Equity Prices, Credit Default Swaps, and Bond Spreads in Emerging Markets. Washington: International Monetary Fund. [Google Scholar]
  14. Da Silva, Paulo Pereira. 2014. Sovereign credit risk and stock markets: Does the markets’ dependency increase with financial Distress? International Journal of Financial Studies 2: 145–67. [Google Scholar] [CrossRef] [Green Version]
  15. Drago, Danilo, and Raffaele Gallo. 2016. The impact and the spillover effect of a sovereign rating announcement on the euro area CDS market. Journal of International Money and Finance 67: 264–86. [Google Scholar] [CrossRef]
  16. Drago, Danilo, Caterina Tommaso, and John Thornton. 2017. What determines bank CDS spreads? Evidence from European and US banks. Finance Research Letters 22: 140–45. [Google Scholar] [CrossRef] [Green Version]
  17. Eyssell, Thomas, Hung Gay Fung, and Gaiyan Zhang. 2013. Determinants and Price Discovery of China Sovereign Credit Default Swaps. China Economic Review 24: 1–15. [Google Scholar] [CrossRef]
  18. Galil, Koresh, Offer Shapir, Dan Amiram, and Uri Ben-Zion. 2014. The determinants of CDS spreads. Journal of Banking & Finance 41: 271–82. [Google Scholar]
  19. Gómez-Puig, Marta, and Simon Sosvilla-Rivero. 2014. Causality and contagion in EMU sovereign debt markets. International Review of Economics & Finance 33: 12–27. [Google Scholar]
  20. Gruppe, Mario, and Carsten Lange. 2014. Spain and the European sovereign debt crisis. European Journal of Political Economy 34: S3–S8. [Google Scholar] [CrossRef]
  21. Gruppe, Mario, and Carsten Lange. 2017. Interest rate convergence, sovereign credit risk and the European debt crisis: A survey. Journal of Risk Finance 18: 432–42. [Google Scholar] [CrossRef]
  22. Gulf Business. n.d. Available online: https://gulfbusiness.com/bahrains-credit-default-swaps-surpass-2016-peak/ (accessed on 17 June 2020).
  23. Hendricks, Wallace, and Roger Koenker. 1991. Hierarchical spline models for conditional quantiles and the demand for electricity. Journal of the American Statistical Association 87: 58–68. [Google Scholar] [CrossRef]
  24. Hilscher, Jens, and Yves Nosbusch. 2010. Determinants of sovereign risk: macroeconomic fundamentals and the pricing of sovereign debt. Review of Finance 14: 235–62. [Google Scholar] [CrossRef] [Green Version]
  25. Jeanneret, Alexandre. 2018. Sovereign credit spreads under good/bad governance. Journal of Banking and Finance 93: 230–46. [Google Scholar] [CrossRef]
  26. Koenker, Roger. 2005. Quantile Regression. Cambridge: Cambridge University Press. [Google Scholar]
  27. Koenker, Roger, and Gilbert J. Bassett. 1978. Regression quantiles. Econometrica 46: 33–50. [Google Scholar] [CrossRef]
  28. Koenker, Roger, and Gilbert Bassett. 1982. Robust Tests for Heteroscedasticity Based on Regression Quantiles. Econometrica 50: 43–61. [Google Scholar] [CrossRef] [Green Version]
  29. Lee, Hwang, and Jung-Soon Hyun. 2019. The asymmetric effect of equity volatility on credit default swap spreads. Journal of Banking & Finance 98: 125–36. [Google Scholar]
  30. Liu, Yang, and Bruce Morley. 2012. Sovereign credit default swaps and the macroeconomy. Applied Economics Letters 19: 129–32. [Google Scholar] [CrossRef] [Green Version]
  31. Longstaff, Francis A., Jun Pan, Lasse H. Pedersen, and Kenneth J. Singleton. 2011. How sovereign is sovereign credit risk? American Economic Journal 3: 75–103. [Google Scholar] [CrossRef] [Green Version]
  32. Merton, C. Robert. 1974. On the Pricing of Corporate Debt: The Risk Structure of Interest Rates. Journal of Finance 29: 449–70. [Google Scholar]
  33. Moro, Beniamino. 2014. Lessons from the European economic and financial great crisis: A survey. European Journal of Political Economy 34: S9–S24. [Google Scholar] [CrossRef]
  34. Nader, Naifar, Syed Jawad Hussain Shahzad, and Shawkat Hammoudeh. 2020. Dynamic nonlinear impacts of oil price returns and financial uncertainties on credit risks of oil-exporting countries. Energy Economics 88: 104747. [Google Scholar] [CrossRef]
  35. Office of the Comptroller of the Currency. 2019. Quarterly Report on Bank Trading and Derivatives Activities, Third Quarter 2019. [Google Scholar]
  36. Pan, Jun, and Kenneth J. Singleton. 2008. Default and Recovery Implicit in the Term Structure of Sovereign CDS Spreads. Journal of Finance 63: 2345–84. [Google Scholar] [CrossRef] [Green Version]
  37. Pavlova, Ivelina, Maria E. de Boyrie, and Ali M. Parhizgari. 2018. A dynamic spillover analysis of crude oil effects on the sovereign credit risk of exporting countries. The Quarterly Review of Economics and Finance 68: 10–22. [Google Scholar] [CrossRef]
  38. Pires, Pedro, João Pedro Pereira, and Luà s Filipe Martins. 2013. The empirical determinants of credit default swap spreads: a quantile regression approach. European Financial Management 21: 556–89. [Google Scholar] [CrossRef]
  39. Qian, Zongxin, and Qian Luo. 2015. Regime-Dependent Determinants of China’s Sovereign Credit Default Swap Spread. Emerging Markets Finance and Trade 52: 10–21. [Google Scholar] [CrossRef]
  40. Reuters. 2018. Available online: http://fingfx.thomsonreuters.com/gfx/rngs/GULF-QATAR-QIA/010041PS3P9/index.html (accessed on 12 June 2020).
  41. Reuters. 2020. Available online: https://www.reuters.com/article/saudi-credit-oil/saudi-arabia-credit-default-swaps-spike-ihs-markit-idUSD5N29W01B (accessed on 12 June 2020).
  42. Rodríguez, Iván, Dandapani Krishnan, and Lawrence Edward. 2019. Measuring Sovereign Risk: Are CDS Spreads Better than Sovereign Credit Ratings? Financial Management 48: 229–56. [Google Scholar] [CrossRef]
  43. Sensoy, Ahmet, Duc Khuong Nguyen, Ahmed Rostom, and Erk Hacihasanoglu. 2019. Dynamic integration and network structure of the EMU sovereign bond markets. Annals of Operations Research 281: 297–314. [Google Scholar] [CrossRef] [Green Version]
  44. Stolbov, Mikhail. 2016. Determinants of sovereign credit risk: The case of Russia. Post-Communist Economies 29: 51–70. [Google Scholar] [CrossRef]
  45. Wang, Ping, and Tomoe Moore. 2012. The integration of the credit default swap markets during the us subprime crisis: Dynamic correlation analysis. Journal of International Financial Markets, Institutions and Money 22: 1–15. [Google Scholar] [CrossRef] [Green Version]
  46. Wang, Hao, Hao Zhou, and Yi Zhou. 2013. Credit default swap spreads and variance risk premia. Journal of Banking & Finance 37: 3733–46. [Google Scholar]
  47. Wegener, Christoph, Tobias Basse, Frederik Kunze, and Hans-Jörg von Mettenheim. 2016. Oil prices and sovereign credit risk of oil producing countries: an empirical investigation. Quantitative Finance 16: 1961–68. [Google Scholar] [CrossRef]
  48. Yu, Sherry. 2016. The effect of political factors on sovereign default. Review of Political Economy 28: 397–416. [Google Scholar] [CrossRef]
1
The credit events include failure to pay interest or principal on, and the restructuring of, one or more obligations issued by the sovereign.
2
3
The collapse came after Saudi Arabia announced that it would increase production after the OPEC and Russia failed to reach an agreement to address the falling demand caused by the coronavirus crisis.
4
5
Generalized AutoRegressive Conditional Heteroskedasticity (GARCH).
6
The 5 years CDS spread has commonly been used in previous studies, including Wang et al. (2013); Galil et al. (2014); and Lee and Hyun (2019); among others.
7
The end of the period is 17 January 2020, in order to ensure that the global COVID-19 crisis does not overlap with our sample period. We assumed that the coronavirus crisis period started from 24 January 2020, the date at which the World Health Organization (WHO) assessed the risk of coronavirus to be high at the global level.
8
“A decline in oil prices over the past few weeks, from around $80 per barrel in mid-May to $74 on Sunday, has lifted the CDS of Saudi Arabia and Qatar by 7 bps and 10 bps, respectively. Bahrain’s CDS soared 82 points since mid-May”. Source: (Gulf Business n.d.).
9
GARCH models are commonly used to model the volatility of stock returns.
10
Hilscher and Nosbusch (2010) showed that the TED spread is an indicator of aggregated liquidity and used it as explanatory variables to explain the variation of SCDS spreads.
11
Arbor Investment Planner
12
We controlled the autocorrelation problem by using the serial correlation LM test in EViews.
13
According to Reuters (2020), Saudi Arabia holds a sovereign wealth fund “SAMA foreign holdings” of USD 515.60 billion.
14
The test consists of testing the equality of the slope parameters ( α 1 , α 2 ) across two quantiles τ1 and τ2: α2(τ2) − α2(τ1) = (Q2(τ2) − Q1(τ2)) − (Q2(τ1) − Q1(τ1)) = (Q2(τ2) − Q2(τ1)) − (Q1(τ2) − Q1(τ1)) = 0
15
Results of the Wald test statistics which are not reported here (because the limitation of space) but are available upon request.
Figure 1. Time trend of the Gulf Cooperation Council (GCC) sovereign credit default swap (CDS) spreads.
Jrfm 13 00245 g001
Figure 2. Time trend of the GCC stock market indexes.
Jrfm 13 00245 g002
Figure 3. Time trend of the various uncertainty indices (VIX, OVX, GVZ and MOVE indexes).
Jrfm 13 00245 g003
Figure 4. The non-normality of the SCDS spreads.
Jrfm 13 00245 g004
Figure 5. Quantile regression coefficient estimates in the case of UAE, with 95% confidence intervals. Vertical axes show the coefficient estimates of the explanatory variable over the UAE CDS spreads distribution. Horizontal axes show the quantiles of the dependent variable.
Jrfm 13 00245 g005
Figure 6. Quantile regression coefficient estimates in the case of Saudi Arabia, with 95% confidence intervals. Vertical axes show the coefficient estimates of the explanatory variable over the Saudi Arabia CDS spreads distribution. Horizontal axes show the quantiles of the dependent variable.
Jrfm 13 00245 g006
Figure 7. Quantile regression coefficient estimates in the case of Bahrain, with 95% confidence intervals. Vertical axes show the coefficient estimates of the explanatory variable over the Bahrain CDS spreads distribution. Horizontal axes show the quantiles of the dependent variable.
Jrfm 13 00245 g007
Figure 8. Quantile regression coefficient estimates in the case of Qatar, with 95% confidence intervals. Vertical axes show the coefficient estimates of the explanatory variable over the Qatar CDS spreads distribution. Horizontal axes show the quantiles of the dependent variable.
Jrfm 13 00245 g008
Table 1. Data description.
VariablesDefinitionExpected Sign
Dependent variable
Δ SCDS5 years sovereign CDS spread change, in basis points.
Country-specific explanatory variables
SRThe return of the country stock index.
SVVolatility estimated by using GARCH (1,1) model of country stock return+
Global uncertainty factors explanatory variables
VIXImplied volatility on S&P 500 index options.+
MOVEImplied volatility on the global bond market+
OVXThe market’s expectation of 30 days volatility of crude oil prices+
GVZThe market’s expectation of 30 days volatility of gold prices+
USEPUThe Global Economic Policy Uncertainty Index+
Control variables
US10YThe 10 years US Treasury rate. It is considered as the proxy of the world interest rates+
TEDThe TED spread is the difference between the three-month Treasury bill and the three-month LIBOR based in US dollars
OILThe US crude oil prices
Notes: all the data are weekly and sourced from the Bloomberg database (except for the TED spread sourced from Federal Reserve Bank of St. Louis). SCDS: Sovereign credit default Swap; SR: Stock Return; SV: Stock Volatility; TED: Treasury-EuroDollar rate; GARCH: Generalized AutoRegressive Conditional Heteroskedasticity; LIBOR: London Interbank Offered Rate.
Table 2. Descriptive statistics.
Δ S A C D S Δ Q A C D S Δ B H C D S Δ A E C D S VIXMOVEOVXGVZUSEPUOIL
Mean0.1766480.1134370.4701550.10745114.7174965.9980032.4910415.45600114.622864.02631
Median−0.44500−0.410000−0.16000−0.3200013.7600064.6014029.8600014.96000103.720056.74000
Maximum67.5000069.94000205.000068.9450030.11000117.887778.9700031.84000339.3700110.5300
Minimum−36.6650−19.25500−57.4500−18.51009.14000045.7323014.500008.8900004.05000029.42000
Std. Dev.8.2792046.82919919.132275.7868023.80478413.5171511.324634.19419752.2472421.14197
Skewness4.9910184.3263243.5894525.0982681.4619990.6461800.9011420.7609531.2708320.802497
Kurtosis25.7769841.2071339.8479160.040975.4112153.0268893.5768843.2178825.5673622.376500
Jarque-Bera8203.10 *22,700.08 *20,845.9 *49,665.1 *212.463 *24.7156 *52.9693 *34.9626 *193.052 *43.8537 *
ADF test−23.60 *
(0.000)
−24.37 *
(0.000)
−26.58 *
(0.000)
−25.00 *
(0.000)
−3.29 *
(0.069)
−4.61 *
(0.001)
−3.29 *
(0.069)
−5.93 *
(0.000)
−13.56 *
(0.000)
−17.32 *
(0.000)
US10YTEDSASRQASRBHSRAESRSASVQASVBHSVAESV
Mean2.3229870.2996810.0007200.0008990.0012420.0017390.0594800.0655110.0118350.048036
Median2.3418000.2680000.0025880.0023890.0006430.0016790.0467000.0560000.0113000.041500
Maximum3.2328000.6300000.0881930.1133160.0487130.0664990.3515000.2402000.0183000.158400
Minimum1.3579000.147500−0.10093−0.07470−0.03610−0.070990.0259000.0388000.0064400.020000
Std. Dev.0.4181740.1072630.0237240.0250780.0112260.0209320.0388580.0297320.0026840.026098
Skewness−0.100010.977268−0.336410.0666250.094246−0.099932.9322303.0723360.2416671.801075
Kurtosis2.1789103.1527115.1304704.2849134.7110373.97733515.6201214.844082.1573016.677409
Jarque–Bera105.642 *56.854 *73.8342 *24.683 *43.833 *147.76 *2864.54 *2633.49 *139.65 *391.96 *
ADF test−20.71 *
(0.000)
−14.41 *
(0.000)
−16.51 *
(0.000)
−16.99 *
(0.000)
−16.90 *
(0.000)
−17.43 *
(0.000)
−5.12 *
(0.000)
−5.52 *
(0.000)
−17.72 *
(0.000)
−5.91 *
(0.000)
Notes: ∆SACDS is the Saudi Arabia CDS spread changes. ∆QACDS is the Qatar CDS spread changes. ∆BHCDS is the Bahrain CDS spreads changes. ∆AECDS is the UAE CDS spread changes. ADF: Augmented Dickey Fuller. An asterisk (*) indicates the rejection of the null hypotheses of unit root and stationarity at the 1% level.
Table 3. Quantile regression estimates for the UAE.
Bearish MarketNormal MarketBullish Market
OLSQ(0.05)Q(0.10)Q(0.25)Q(0.50)Q(0.75)Q(0.90)Q(0.95)
VIX0.403557 *
(0.000)
0.299196 **
(0.048)
0.355261 *
(0.002)
0.192164 *
(0.008)
0.223908 *
(0.009)
0.198862
(0.227)
0.62065 *
(0.006)
0.627964 *
(0.006)
MOVE−0.066711 *
(0.016)
−0.068831
(0.245)
−0.042818
(0.284)
−0.021443
(0.429)
−0.021807
(0.380)
−0.06096 **
(0.046)
−0.085132
(0.112)
−0.08074
(0.243)
OVX−0.011056
(0.685)
−0.15167 **
(0.032)
−0.10862 **
(0.017)
−0.0567 ***
(0.0919)
−0.029624
(0.227)
0.0770 ***
(0.056)
0.166449 *
(0.004)
0.10632
(0.161)
GVZ0.053892
(0.523)
−0.035950
(0.893)
−0.083687
(0.562)
0.017886
(0.808)
0.074085
(0.324)
0.109426
(0.204)
0.118539
(0.312)
0.110533
(0.536)
USEPU−0.001938
(0.691)
−0.007819
(0.449)
−0.000192
(0.978)
−0.002280
(0.605)
−0.005608
(0.106)
−0.003736
(0.556)
0.005298
(0.648)
0.003176
(0.788)
OIL0.394622 *
(0.000)
−0.285126
(0.342)
−0.149634
(0.476)
−0.066789
(0.641)
−0.0634
(0.742)
0.200708
(0.532)
0.427536
(0.231)
0.267276
(0.501)
US10Y0.648354 **
(0.012)
0.688775
(0.378)
0.234283
(0.954)
−0.1954178
(0.460)
−0.923813
(0.731)
0.2431990
(0.619)
0.982146
(0.206)
0.154541 **
(0.049)
TED0.24417 **
(0.010)
−0.099158
(0.675)
0.923280
(0.952)
0.346184
(0.746)
0.519967
(0.590)
0.9359298
(0.565)
0.4309 ***
(0.059)
0.58748 **
(0.047)
SR−0.49092 *
(0.000)
−0.0253831
(0.941)
−0.188450
(0.479)
−0.2284 ***
(0.072)
−0.15310
(0.250)
−0.161951
(0.296)
−0.49733 **
(0.051)
−0.70991 **
(0.010)
SV0.25207 **
(0.012)
0.156730
(0.384)
0.128522
(0.354)
0.2431400
(0.805)
0.132963
(0.243)
0.25890 **
(0.043)
0.1687529
(0.442)
0.9472227
(0.749)
Cons−0.2925 ***
(0.052)
−0.1804 ***
(0.057)
−2.386325
(0.254)
−1. 693504
(0.284)
−2.499234
(0.100)
−1.8513 **
(0.0396)
−6.301212
(0.105)
−2.51419
(0.529)
Adj .   R 2 0.3545950.1265660.0815820.0226990.0099950.0490280.2196880.347211
Note: This table presents the quantile regression parameter estimates for the model described in Equation (2). The numbers in parentheses are the p-values. The asterisk (*, **, ***) denotes statistical significance at the 1%, 5%, and 10% levels, respectively. Number of observations: 1465.
Table 4. Quantile regression estimates for Saudi Arabia.
Bearish MarketNormal MarketBullish Market
OLSQ(0.05)Q(0.10)Q(0.25)Q(0.50)Q(0.75)Q(0.90)Q(0.95)
VIX0.614607 *
(0.000)
0.126596
(0.733)
0.3915 ***
(0.086)
0.280375 **
(0.022)
0.220379
(0.163)
0.601670 **
(0.013)
0.17932 *
(0.002)
0.165968 **
(0.017)
MOVE−0.079254
(0.705)
0.021085
(0.738)
0.006633
(0.908)
−0.0698
(0.101)
−0.026685
(0.414)
−0.097626 *
(0.007)
−0.0979
(0.166)
−0.18464
(0.137)
OVX−0.023262
(0.603)
−0.23270 *
(0.004)
−0.22483 *
(0.008)
−0.0691
(0.1146)
−0.004285
(0.911)
0.053015
(0.289)
0.040896
(0.589)
0.077236
(0.540)
GVZ0.116505
(0.368)
−0.125584
(0.538)
−0.136307
(0.446)
0.19923 ***
(0.0934)
0.121066
(0.208)
0.19129 ***
(0.0699)
0.043347
(0.803)
0.079957
(0.805)
USEPU−0.008763
(0.252)
0.000432
(0.974)
−0.005346
(0.570)
−0.008643
(0.168)
−0.008739
(0.181)
−0.010961
(0.189)
0.007366
(0.609)
0.024907
(0.246)
OIL0.371513 *
(0.000)
−0.443619
(0.200)
−0.431538
(0.105)
−0.222985
(0.288)
0.080278
(0.756)
0.388657
(0.236)
0.411847
(0.200)
0.275961
(0.444)
US10Y0.4292648
(0.288)
0.840462
(0.298)
−0.421948
(0.946)
0.2578716
(0.520)
−0.115139
(0.760)
0.3705774
(0.459)
0.13105
(0.103)
0.905986
(0.290)
TED0.450843 *
(0.003)
0.331194
(0.160)
0.4004 ***
(0.075)
0.23095 ***
(0.077)
0.23144 ***
(0.060)
0.14669
(0.430)
0.401295
(0.923)
0.74591
(0.120)
SR−0.67018 *
(0.000)
−0.188162
(0.560)
−0.45782 **
(0.041)
−0.519427 *
(0.000)
−0.419634 **
(0.029)
−0.52136 *
(0.001)
−0.86341 **
(0.017)
−0.184567 *
(0.004)
SV0.544869
(0.563)
−0.1691723
(0.592)
−0.1274608
(0.620)
0.8544111
(0.532)
0.5425824
(0.435)
0.1663579
(0.190)
0.160966
(0.578)
0.6348521
(0.249)
Cons−0.1409 *** (0.075)−0.1895153
(0.729)
−0.242412
(0.519)
−0.3207 ***
(0.095)
−0.263138
(0.271)
−0.374841
(0.205)
−0.598677
(0.134)
−0.938339
(0.197)
Adj .   R 2 0.2157240.1373340.0847040.0375610.0301370.0799230.1893390.275252
Note: this table presents the quantile regression parameter estimates for the model described in Equation (2). The numbers in parentheses are the p-values. The asterisk (*, **, ***) denotes statistical significance at the 1%, 5%, and 10% levels, respectively. Number of observations: 1465.
Table 5. Quantile regression estimates for Bahrain.
Bearish MarketNormal MarketBullish Market
OLSQ(0.05)Q(0.10)Q(0.25)Q(0.50)Q(0.75)Q(0.90)Q(0.95)
VIX0.1255761 *
(0.000)
0.12298
(0.138)
0.14142
(0.133)
0.521540
(0.119)
0.56698 ***
(0.071)
0.128753 *
(0.007)
0.192076 *
(0.000)
0.20904 **
(0.010)
MOVE−0.143960
(0.154)
−0.079333
(0.740)
−0.227672
(0.220)
−0.206202
(0.140)
−0.097762
(0.284)
−0.110543
(0.390)
−0.153265
(0.455)
−0.4963 ***
(0.099)
OVX−0.016238
(0.869)
−0.369626
(0.255)
−0.190992
(0.352)
−0.024492
(0.852)
0.070901
(0.424)
0.067166
(0.604)
0.02018 **
(0.924)
0.19729
(0.522)
GVZ0.357137
(0.273)
0.129175
(0.860)
0.625370
(0.306)
0.309764
(0.410)
0.218162
(0.380)
−0.056784
(0.879)
0.242823
(0.698)
1.604163
(0.194)
USEPU−0.023624
(0.182)
−0.013316
(0.717)
−0.035652
(0.216)
−0.006293
(0.789)
−0.010950
(0.474)
0.005890
(0.777)
−0.026769
(0.232)
−0.023628
(0.510)
OIL0.1326370 *
(0.000)
−0.1796350
(0.193)
−0.155873
(0.849)
−0.376219
(0.579)
−0.07120
(0.924)
−0.96555
(0.302)
−0.171069
(0.119)
−0.1575388
(0.216)
US10Y0.16912 ***
(0.066)
−0.1740826
(0.466)
−0.1580101
(0.398)
0.565123
(0.968)
−0.4537271
(0.652)
0.648916
(0.734)
0.1851903
(0.360)
0.88652
(0.230)
TED0.2010183
(0.557)
0.6758793
(0.499)
0.2488100
(0.714)
−0.7979146
(0.838)
−0.2739825
(0.412)
−0.3947647
(0.930)
−0.8821718
(0.868)
−0.555821
(0.516)
SR−0.100955
(0.119)
0.2379357
(0.203)
0.1821272
(0.907)
−0.552687
(0.599)
−0.9506433
(0.143)
−0.21048 **
(0.039)
−0.15193 **
(0.027)
−0.2356
(0.404)
SV0.4342134
(0.275)
0.688286
(0.328)
0.7582168
(0.109)
0.4564775
(0.315)
−0.6411987
(0.821)
−0.4857256
(0.319)
0.708989
(0.896)
0.147812
(0.180)
Cons−16.130 ***
(0.059)
−34.238
(0.138)
−28.4280 **
(0.032)
−10.20636
(0.399)
−5.15431
(0.442)
0.09145 **
(0.043)
−3.075692
(0.818)
−19.2775
(0.411)
Adj .   R 2 0.2405100.0545230.0276350.0231720.0189590.0873240.1679240.234852
Note: this table presents the quantile regression parameter estimates for the model described in Equation (2). The numbers in parentheses are the p-values. The asterisk (*, **, ***) denotes statistical significance at the 1%, 5%, and 10% levels, respectively. Number of observations: 1465.
Table 6. Quantile regression estimates for Qatar.
Bearish MarketNormal MarketBullish Market
OLSQ(0.05)Q(0.10)Q(0.25)Q(0.50)Q(0.75)Q(0.90)Q(0.95)
VIX0.40764 *
(0.000)
0.162880
(0.490)
0.245047
(0.176)
0.120688
(0.278)
0.303683 *
(0.007)
0.450933 *
(0.008)
0.757003 *
(0.007)
0.876437 *
(0.008)
MOVE−0.07826 **
(0.029)
0.063602
(0.493)
−0.041738
(0.490)
−0.047498
(0.235)
−0.0564 ***
(0.060)
−0.0670 **
(0.032)
−0.1037 **
(0.039)
−0.058494
(0.455)
OVX0.002798
(0.935)
−0.124946
(0.108)
−0.058007
(0.298)
−0.024400
(0.470)
−0.024456
(0.407)
0.042208
(0.339)
0.067911
(0.310)
0.073529
(0.443)
GVZ0.108436
(0.301)
−0.194096
(0.497)
0.100982
(0.555)
0.039498
(0.662)
0.093631
(0.243)
0.185015
(0.038)
0.172142
(0.264)
−0.190432
(0.409)
USEPU−0.000130
(0.983)
0.000942
(0.946)
0.001341
(0.852)
−0.002978
(0.598)
−0.001841
(0.690)
0.003180
(0.599)
−0.008621
(0.414)
0.003468
(0.817)
OIL0.32878 *
(0.000)
−0.351817
(0.228)
−0.3756 ***
(0.074)
−0.17387 *
(0.003)
−0.058149
(0.816)
0.274695
(0.422)
0.368764
(0.324)
0.301819
(0.505)
US10Y0.981574 *
(0.002)
0.5474248
(0.491)
0.6015854
(0.187)
−0.1414253
(0.717)
−0.025659
(0.994)
0.7233461
(0.172)
0.16900 *
(0.007)
15.39974
(0.120)
TED0.312085 **
(0.010)
0.260031
(0.278)1
0.2328925
(0.232)
0.1207233
(0.420)
0.22401 ***
(0.068)
0.2408620
(0.162)
0.6698690
(0.782)
0.36681
(0.336)
SR−0.32012 **
(0.013)
0.4205332
(0.895)
−0.4573764
(0.815)
−0.6450515
(0.657)
−0.285719 *
(0.002)
−0.2653 ***
(0.063)
−0.2149 ***
(0.051)
−0.3719 ***
(0.059)
SV0.254085 **
(0.026)
0.36953 **
(0.045)
−0.6095467
(0.695)
0.1080026
(0.337)
0.18551 ***
(0.060)
0.1756954
(0.131)
0.137486
(0.996)
−0.9570934
(0.857)
Cons−4.2393 **
(0.037)
−9.1020 ***
(0.083)
−6.0958 ***
(0. 08)
−1.572784
(0.444)
−2.2503906
(0.185)
−5.4984 **
(0.019)
−2.588255
(0.562)
−0.431895
(0.946)
Adj .   R 2 0.2616240.0636810.0548270.0370460.0493860.0941460.1954870.263636
Note: this table presents the quantile regression parameter estimates for the model described in Equation (2). The numbers in parentheses are the p-values. The asterisk (*, **, ***) denotes statistical significance at the 1%, 5%, and 10% levels, respectively. Number of observations: 1465.
Table 7. Summary of the empirical results.
Saudi ArabiaBahrainQatarUAE
BearishNormalBullishBearishNormalBullishBearishNormalBullishBearishNormalBullish
VIXSNSSNSSSNSSSSSS
MOVENSNSSNSNSSNSSSNSNSS
OVXSNSNSNSNSNSNSNSNSSNSNS
GVZSNSSNSNSSNSNSNSNSNSNS
USEPUNSNSNSNSNSNSNSNSNSNSNSNS
OILNSNSNSNSNSNSSNSNSNSNSNS
US10YNSNSNSNSNSNSNSNSSNSNSS
TEDSSNSNSNSNSNSSNSSNSS
SRSSSNSNSSNSSSNSNSS
SVNSNSSNSNSSSSNSNSNSS
Note: “S” means significant and “NS” means not significant.
Publisher’s Note: MDPI stays neutral with regard to jurisdictional claims in published maps and institutional affiliations.

