Article

The Potential Use of Drones for Tourism in Crises: A Facility Location Analysis Perspective

1
School of Tourism and Hotel Management, Cyprus International University, via Mersin 10, 99258 Lefkosa, Turkey
2
Institut de Recherche en Informatique, Mathématiques, Automatique et Signal|IRIMAS, University of Haute-Alsace, 68100 Mulhouse, France
3
Department of Banking and Finance, Eastern Mediterranean University, via Mersin 10, 99628 Famagusta, Turkey
4
Department of Accounting and Finance, Faculty of Economics and Administrative Sciences, Cyprus International University, via Mersin 10, 99258 Lefkosa, Turkey
*
Author to whom correspondence should be addressed.
J. Risk Financial Manag. 2020, 13(10), 246; https://doi.org/10.3390/jrfm13100246
Submission received: 21 September 2020 / Revised: 8 October 2020 / Accepted: 12 October 2020 / Published: 19 October 2020
(This article belongs to the Special Issue Tourism and Green Economy)

Abstract

:
Considering the recent lockdowns and travel bans due to COVID-19, novel tourism strategies are necessary to face the increasing need for innovative products and services and to ensure long-term sustainable growth. This study looks into the potential use of drones in providing online virtual tours of open-space tourist attractions. To do so, a novel mixed-integer linear mathematical model is developed to optimally determine the number and location of required facilities and the number of drones assigned to each center. The model is applied to a case study of Rome by selecting six historic sites as the tourist attractions and considering several candidate locations for establishing the facilities. The results of different potential scenarios imply that the project is profitable, even if the demand for virtual tours is low.

1. Introduction

The tourism sector has suffered considerable damages due to global catastrophes and crises. Past observations revealed that although not long-lasting, most of these crises had an effect on tourism for only specific durations within identifiable time periods (Ren 2000). However, with the rise of the infectious coronavirus (COVID-19)—a highly infectious disease for which a cure is yet to be found—the prospects are that the tourism sector will likely suffer greater damage than it experienced with previous crises. After reporting an increasing number of local outbreaks by the public health authorities, the World Health Organization officially declared COVID-19 a pandemic threat on the 30th of January 2020 (World Health Organization 2020). Just two months later, the scale of infections spread across 190 countries, with a total number of infected casualties observed to grow at an exponential rate per country. Despite predictions that COVID-19 was still at its early stage, the damage experienced by the tourism industry has so far been tremendous. The tourism sector remains one of the most affected sectors since the crisis began. The heavy impact on the tourism sector has prompted the United Nation World Tourism Organization (UNWTO) to revise its forecasts on international arrivals and receipts while emphasizing the likelihood of modifying these forecasts soon. The ongoing pandemic has stirred tourism destinations into establishing a competitive advantage by promoting innovation in product and service design as well as marketing strategies that will ensure self-differentiation and long-term sustainable growth.
Like many other service industries, in the tourism industry, the key to satisfying customers’ needs resides in identifying and offering comprehensive, personalized and up-to-date products and services (Buhalis and Law 2008). With the evolution of novel technologies, the expectation is for different ways of technological mediation to emerge (Tussyadiah et al. 2018). In proportion to recent advancements, operations in the tourism and travel industries have become very reliant on technology (Drosos et al. 2017). These changing trends have prompted an increase in the mediation of tourist experiences using technology and digital media (Tussyadiah et al. 2017; Tussyadiah and Fesenmaier 2009). To this end, the use of information and communication technologies (ICT) in enhancing innovation in marketing that will provide prospective tourists with the sensation of feeling and experiencing these destinations (rather than the traditional media browsing and print or electronic catalogues) could be applied by the tourism industry (Disztinger et al. 2017; Huang et al. 2016). Advancements in ICT have turned the world into a small-sized village, which can be explored within the premise of our homes. Considering the recent lockdowns and travel bans due to COVID-19, ICT can provide various facilities for the tourism industry, and as a result, several tourism strategies can be shaped to face the increasing need for novel services.
New advances in ICT have paved the way for the replacement of traditional roles such as tour-guiding with digital media and technological devices that will assist tourists with various social, physical and cognitive skill sets at tourism destinations (Wang et al. 2012; Tussyadiah and Fesenmaier 2009). Augmented reality and virtual reality exemplify one of the many ways in which technology mediates the cognitive and learning experiences of tourists (Leue et al. 2014; Leue et al. 2015; Yovcheva et al. 2012; Yovcheva et al. 2014). As such, to better understand the role of ICT in tourism experiences, it is only proper to inquire into the post (phenomenological) approach to technological mediation (Ihde 1990), which offers insights into how technology bridges the gap between people (tourists) and their surroundings (tourism destinations) (Wang et al. 2012; Tussyadiah and Fesenmaier 2009).
With the intention of enhancing better services for tourists, popular destinations often offer high-tech information systems such as those found on mobile apps that assist tourists with location-related services such as directing and finding “hotspot” tourism facilities. Recently, studies have emphasized the positive influence of investments in technologies in terms of bettering tourist tech-facilitated experiences for the travel and tourism industry (Wang et al. 2016). Unmanned aerial vehicles (UAVs), also known as drones, are one of the new emerging technologies that are used mainly for mapping, advertising, delivery, ecological studies, target covering and agriculture (Luppicini and So 2016). Drones are usually controlled with the help of apps found on mobile devices such as tablets and smartphones, and they are also constructed with built-in cameras and sensors that allow for live streaming and recording (King 2014).
As drones drop in price, becoming more portable and popular, demand for drone tourism, drone tourists and taking airborne videos and pictures will grow inevitably. More individuals’ access to drones and producing airborne drone videos/photos is not just hypothetically noteworthy, it is also applicable to destination marketing. Videos and pictures taken from drones can help to distinguish a destination from its rivals (Hay 2016) and if tourism managers and marketers have not yet started to consider drone tourism in marketing and customer engagement strategies, they will do it soon.
Compared to common videography and photography methods, the procedure of drone video/photo capturing is more challenging (Stankov et al. 2019); therefore, providing platforms and facilities, drones could involve more individuals in virtual tourism. The present case study provides different scenarios to optimize the potential drone facilities and appraise the cost of the project, resulting in the acceptance of drones as a feasible innovative technology for virtual tourism. Accordingly, this study develops a better understanding of drone applications that will help researchers and practitioners, especially in terms of virtual tourism and destination marketing.
This case study is not an evaluation of some existing facilities. Instead, it is an application of a new trend in tourism and destination marketing. The goal of this research is to verify the feasibility of drone tourism as a novel attempt. Therefore, this study focuses not only on specifying a potential area or on the design of the possible drone terminals and facilities but on the cost-benefit of the project at the same time since they are closely related. In particular, the specific research goals are to 1. Determine the possible locations for drone facilities inside the ancient city of Rome; 2. Plot the spatial distribution of possible spots for virtual tourism; and 3. Appraise the cost and profit of applying this operation to selected tourism hotspots within the city of Rome in the context of destination marketing.
To the authors’ best knowledge, the present case study is the first attempt to evaluate the application of a drone facility in the tourism industry. In this regard, this paper contributes to the already existing body of literature in two ways. From a tourism perspective, this case study presents an original project to enhance virtual tourism and virtual travel experiences to help the tourism industry in crisis. Drone tourism may never replace traditional travel, but it still offers fascinating opportunities such as virtual tours in times of pandemics and regional or global lockdowns, which have been devastating for the tourism industry. The ultimate goal is to give a chance of a visit to people who are physically unable to visit certain hotspots. Besides this, using drones in the tourism industry will be an unexperienced eco-friendly solution to the problem of over-tourism. Moreover, from a technological perspective, this paper conducts a facility location analysis to determine the locations of launching sites along with the number of each site’s assigned drones. Generally, the facility location problems could introduce two main contributions. The main contribution is to define a new problem and represent it mathematically using a novel model that cannot be found elsewhere in the literature. The second contribution is to propose a new solution method for the previously developed but not optimally solved mathematical models. The developed model is solved by coding it in the GAMS optimization compiler without using or introducing any heuristic or metaheuristic algorithm which is necessary to solve the NP-hard problems.

2. Theoretical Background

Even though augmented reality and virtual reality have been studied in light of touristic intentions, acceptance, requirements and their overall experience (Han et al. 2018; Tscheu and Buhalis 2016; Rauschnabel and Ro 2016; Jung et al. 2016), there remains a need for more academic exploration and empirical evidence in the field of cultural heritage to support the development of a theoretical framework (Jung and Han 2014). A strand of literature that has increasingly gained attention focuses on understanding the effects of the growing use of ICTs on the tourism ecosystem, as mirrored by the vast amount of scholarly reviews. Following the works of Leung and Law (2007) and Frew (2000); Buhalis and Law (2008) made an in-depth inquiry into the state of E-tourism and observed the evolution of ICT in the field of tourism management. Subsequently, new studies following a similar pathway emerged, presenting a compilation of various works that apply ICT to tourism (Leung et al. 2013, 2015; Lu and Stepchenkova 2015; Law et al. 2009, 2010, 2014; Zeng and Gerritsen 2014; Pesonen 2013); alongside these is the review of Ukpabi and Karjaluoto (2017) that specifically inquires into how consumers incorporate ICTs in tourism services.
Drone usage in the tourism sector is a growing field (Mirk and Hlavacs 2015; King 2014). Compared to studies of drones in other sectors such as reforesting (Almeida et al. 2019); ecology (Beadel et al. 2018); mapping (Braitenberg et al. 2016); humanitarian relief (Golabi et al. 2017) and commercial delivery (Stolaroff et al. 2018), the potential role of drones in the tourism sector has received minimal attention (Hay 2016; Stankov et al. 2019; Mirk and Hlavacs 2015). Contrasting the current lack of research, tourism practitioners have specifically seen a surge in the use of innovative practices involving drone use, such as their use to provide live-stream experiences for tourists. Recently, the study of Hay (2016) provided a general summary of the current and potential uses of drones in tourism and hospitality. In the same light, Dinhopl and Gretzel (2016) navigate the social and technological differences regarding the well-grounded conventional practice of tourist photography and novel practice of drone and mobile camera usage in capturing varying perspectives. Meanwhile, Allen (2018) looked into the experiences and motives of tourists that made use of a drone to engage in touristic-related activities and their perceptions about recreational drone use.
It is incontrovertible that selecting proper locations for establishing the facilities can significantly boost long-term performance. The facility location problem (FLP) is one of the prominent branches of operational research that focuses on determining the best number and location of new facilities (Shavarani et al. 2019a). As an extended version of FLP, capacitated facility location problems (CFLP) reflect the restricted capacity of establishing facilities (Chauhan et al. 2019). Since drones can distribute goods in vaster areas and cover more people in a shorter time (Vizvári et al. 2019), many FLP studies have focused on determining the best locations of drones’ launching and/or refueling facilities. Location problems are classified into the center, median and covering models (Golabi et al. 2018). Center problems aim to locate facilities in a way which minimizes the maximum travel distance (Aboolian et al. 2009). Center problems are generally applied to humanitarian logistics for finding the best locations for fire stations, hospitals and other public facilities (Boonmee et al. 2017). Median problems aim to minimize the overall traveling costs (Golabi et al. 2017). Shavarani et al. (2019b) studied a congested capacitated hierarchical location model for a drone-based delivery system. Using the fuzzy variables, the model determines the location of delivery and charging facilities such that the total cost of the system is minimized. As it is reviewed by Farahani et al. (2012), covering location problems could be traditionally classified as the set covering and maximal covering models. While the maximal covering models try to achieve maximum coverage on-demand via a pre-set number of established facilities, set covering models try to minimize the cost of the system according to a fixed level of coverage.
In conventional covering models, each demand point is covered by at most one facility. Murray (2005) introduced the idea of implicit coverage in which potential facilities partially cover each demand area. As an extension to this study, Murray et al. (2010) categorized the covering location problems into implicit and explicit coverage models. The implicit model assumes that more than one facility may be required to cover each demand point so that each facility covers a percentage of the demand. Inspired by the idea of implicit coverage, the current study aims to propose a new mathematical model to determine the number and location of drone launching facilities. The number of drones assigned to each facility is another decision variable of this study. Due to the limited capacity of each facility, the number of assigned drones and, consequently, the number of covered customers is restricted. Thus, the studied facility location problem could be categorized as a capacitated implicit coverage problem in which each demand point may be covered by more than one facility. To check the applicability of the studied location problem, the proposed mathematical model is applied to a case study of Rome, Italy.

3. The Case Study

The United Nations World Tourism Organization (UNWTO) ranked Italy as the fifth highest worldwide in terms of tourist arrivals, with more than 58 million visitors in 2017. In the same year, Rome earned the title of the most visited tourist destination according to the Italian National Institute of Statistics (ISTAT 2016), with 29 million visitors. The centuries-old monuments, cultural heritage, arts and history position Rome as a city that enchants many to pay visits. Therefore, Rome was selected as an ideal location for this case study due to the impact of its cultural richness and popularity among international tourists.
Within Rome, attraction sites are heterogeneous in that some areas are considered more attractive than others. The most attractive sites, usually called “hotspots”, highlight key aspects of Rome’s identity. The current study considers places with the highest numbers of visitors accessible for virtual drone visitations as “hotspots”. Selected hotspots include the Colosseum, Trevi Fountain, Roman Forum, Pantheon, Piazza di Spagna and Navona. Figure 1 demonstrates a triangular zone which comprises top-rated tourist attractions in Rome and candidate locations for drone centers. Candidate locations are selected according to the optimal distance from the hotspots.

4. The Applied Facility Location Problem

Using the idea of implicit coverage, this study develops a novel mixed-integer linear mathematical model to minimize the total cost of the system by determining the number of required drone centers, the location of each center and the number of drones assigned to each center. The number of assigned drones reflects the center’s restricted capacity in covering the customers. Due to the mentioned capacity restriction, more than one center may be needed to cover each demand point. Thus, the model also determines how the demand of each point is partially covered by different sites. The developed model is a discrete location problem in which the facilities are selected among a set of pre-defined candidates.
It is assumed that the established facilities are equipped with several drones and authorized pilots. The centers aim to cover the demand of having a new/different image of a set of historical sites using the drones. Two different types of demand could be considered for the problem: (1) the demand of those who are far away from the historical sites; (2) the demand of those who are currently visiting the historical sites.
The first type reflects the demand of those who cannot afford a trip to the mentioned sites (due to the pandemic lockdowns or restrictions in time and budget), but they would like to have a live private image/video of the mentioned sites. They only need to use an online platform to watch the requested live-stream.
The second type is for those who would like to visit the site from a different perspective that is not possible to capture while visiting the site, or maybe to take photos/videos with a wide image of the site from a different perspective. Whenever the demand occurs, a drone (which is equipped with a high-quality camera) travels to the requested site. After arriving at the requested site, the drone starts capturing the video/photo for a defined period. Thereafter, it heads back to the launching center. The captured video/photo could be sent to the customers via email or any other online platform.
The round-trip, travel times and the photo/video capturing time are restricted by the endurance of drones. Moreover, the number of covered demands is restricted by the total number of drones given to each center. Therefore, the proposed mathematical model accounts for the capacity restrictions associated with each drone’s endurance and each site’s available flying time. It is assumed that at the end of each trip, the drone batteries are swapped with fully charged ones. Each center’s available flying time is a function of the time length of the working shift, the number of assigned drones, the endurance of each drone and a coefficient to account for the effective flying time of each drone, considering the required time for maintenance and battery swapping.
It is noteworthy to mention that as a famous problem in the area of Operational Research, each FLP could be represented by developing a corresponding mathematical model reflecting all the applied assumptions, constraints, objective functions and decision variables. Solving this developed model yields the optimum value of decision variables such that all the considered constraints are satisfied and the objective of the developers is reached. In this study, a novel mathematical model reflecting the applied assumptions and constraints is developed to mathematically represent the proposed capacitated implicit coverage location problem. To do so, a combination of symbols called sets, parameters, scalars, decision variables, constraints and objective function should be introduced in the first step. Sets are the basic building blocks corresponding to the indices in the algebraic representation of the model. A parameter is simply a numerical constant that specifies particular system attributes. A scalar is regarded as a parameter that has no domain. Decision variables are a set of quantities that need to be determined in order to solve the problem. The constraints are the restrictions or limitations on the decision variables. The objective function, which is to maximize or to minimize some numerical value, indicates how much each variable contributes to the value to be optimized in the problem. Using the mentioned items, the mathematical model is developed to represent the problem in a mathematical framework.
The model developed by the authors translates the mentioned assumptions into a mathematical framework. The following notations are used to develop the mathematical model:
Sets:
I : The set of historical sites (demand points) such that i I
J : The set of candidate locations for establishing the facilities such that j J
Scalars:
c 1 : The cost of establishing each facility
c 2 : The price of each drone
E : The flying endurance of each drone (time)
N : The maximum number of drones that can be assigned to each facility
v : The flying speed of drones
τ : The camera capturing time for each customer
φ : The number of missions assigned to each drone in a working shift ( φ = L e n g t h   o f   s h i f t E n d u r a n c e )
ω : A coefficient to account for the percentage of effective flying time for drones
M : A large positive number
Parameters:
d i j : The aerial distance between site i and facility j
λ i : The demand for site i
Decision Variables:
α i j : The percentage of demand of point i that is covered by facility j
x i j : 1 if demand point i is covered by the facility; 0 otherwise
y j : 1 if location j is selected to establish the facility; 0 otherwise
n j : The number of drones assigned to facility j
Using the mentioned notations, the mathematical model is as follows:
Min   j J c 1 y j + c 2 n j
Subject   to :
j J x ij 1 ,     i I   ,     i I
x ij y j ,     i I   ,   j J
n j Ny j ,   i I   ,   j J
j J α ij = 1 ,     i I
α ij y j ,     i I   ,   j J
2 d ij v x ij + τ   E ,     i I   ,   j J
i I ( 2 d ij v + τ ) α ij λ i ω φ En j + ( 1 y j ) M ,     j J
x ij   ,   y j { 0 , 1 } ,     i I   ,   j J
α ij ,   n j   0 ,     i I   ,   j J
The objective function (1) minimizes the total cost of the system as a function of the establishment cost of facilities and the purchasing of drones. Constraint (2) ensures that each point of demand covers at least a facility. Constraint (3) guarantees that demand points are just assigned to established facilities. Constraint (4) sets an upper bound for the number of drones assigned to each established facility. Constraint (5) ensures that for each demand point, the summation of percentages covered by different facilities is equal to one. Constraint (6) guarantees that the fraction of demand assigned to a close facility is set to be equal to zero. Constraint (7) limits the required flying time (as the summation of video capturing time and the round-trip travel time from facility to the site) to the endurance of drones. For each established facility, Constraint (8) guarantees that the required flying time to cover the assigned demands does not violate the capacity restrictions. Constraints (9) and (10) are integral constraints on the decision variables.

5. Numerical Results and Discussion

The first step in solving the mathematical models is to define the utilized scalars and parameters. The annual 29 million actual visits to the city could be translated into a total of 79,500 visits per day. Due to the novelty of this study, the annual number of requests for the virtual tour is not known. Therefore, using some scenarios, the number of requests is estimated in this study. Each scenario considers a fraction of the actual yearly demand as the number of requests for the virtual tour. Here, five different scenarios are generated to assume 5%, 10%, 15%, 20% and 30% of the actual yearly demand as the number of requests for the virtual tour. This means that the considered first, second, third, fourth and fifth scenarios respectively estimate 3975, 7950, 11,925, 15,900 and 23,850 daily requests for the virtual tour. The last two scenarios consider the high demand rates that can represent extraordinary situations in which the actual visit is not possible, such as the COVID-19 lockdown period experienced in 2020. Moreover, they can represent the demand for high seasons, as the real numbers are not available. The next step is to estimate each hotspot’s share of daily demand. To do so, four different strategies, called S1, S2, S3 and S4, are randomly generated to simulate the actual share of each hotspot from the estimated number of daily virtual visits to the city. Each strategy considers different preference rates for the virtual visits of the hotspots. The preference rates shown in Table 1 are considered, concerning the actual visits of the mentioned historical sites. The summation of preference rates related to each strategy is equal to one. According to the first strategy, 22% of the daily requests are recorded for the first historical site (Hotspot 1). Similarly, 20% of those demanding virtual tours prefer to visit Hotspot 2. According to this strategy, 17%, 15%, 14% and 12% are the share of the remaining sites from the total daily demand.
The drone considered for this study is a DJI Phantom 4 Pro Plus Quadcopter equipped with a 4 K camera, having a maximum flying time of 30 min with a fixed flying speed of 50 km/h. Considering extra batteries to be stored at each launching station, the purchasing price is estimated as 3000 USD (Amazon 2020). Considering a working shift of 8 h, each drone can be used for 16 trips per day. Each operator can control 10 drones at the same time (Betters 2016). As explained by Shavarani et al. (2019b), the useful life of each drone could be considered as 3 years and each launching center with an area of 300 m2 could be considered as a flying center of 30 drones. Considering an average renting price of 25 USD/m2 (Statista 2020), the annual cost of each furnished center, excluding the cost of drones and operators, could be estimated at 86,000 USD. The length of each virtual tour is assumed to be 20 min and it is premised that the demand of each 10 customers is satisfied in one tour. Using a lifetime of 3 years, an annual interest rate of 3.8% for Italy (Y-Charts 2020) and an average yearly salary of 30,000 USD for each operator (World Salaries 2020), the annual cost of each procured drone could be calculated according to Equation (11), in which A represents the annual worth and P stands for the present value.
Annual cost of each drone = 3000(A/P, 3.8%, 3) + 30000/10 = 4077 USD
Using this information, the General Algebraic Modeling System, known as the GAMS optimization compiler, is applied to solve the proposed mathematical model for the case study of Rome. The obtained results are shown in Table 2.
The first column of Table 2 represents the different scenarios applied to estimate the potential number of virtual visits of the city, as a fraction of available data of actual visits in 2017. The second column reflects the applied strategies to estimate the demand for each site. Columns 3 to 8 show how the demand for each historical site is covered by the established drone centers. Established centers are shown by capital letters. Single letters indicate that the entire demand of the related site is satisfied by only one established drone center. The decimals show how each historical site is partially covered by different centers. For example, the single letter A shows that the demand for visiting the related historic site (the header of the related column) is entirely satisfied using the drones launching from the established facility called A. In the case of having decimals such as 0.4 A and 0.6 B (in the same cell), 40% of the demand for visiting the related historic site is covered by the facility established in location A and the remaining 60% is satisfied by the facility established in location B. Column 9 represents the number of drones assigned to each established facility. As the drones are just assigned to the established centers, this column also shows the selected locations for establishing the drone centers. For example, A20 indicates that 20 drones should be assigned to the facility established in location A. Finally, Column 10 reflects the total cost of the system.
Just as guidance to read the table, considering 10% of the actual yearly demand for the virtual tours and using the second strategy (Scenario 2), 97% of the requests for Hotspot 1 are satisfied by facility L and the remaining are met by facility J. The demand for the second and third hotspots is entirely met using facility J and, finally, the remaining capacity of facility L is used to satisfy the demand of Hotspots 5 to 7. In total, 21 drones are assigned to facility J, while the number of assigned drones to facility L is set to be 29. In this case, the total cost of the system is 403,850 USD per year.
This project is flagrantly profitable. Considering a trivial price of 5 USD for each customer, the total annual revenue for the first scenario will be 7,254,375 USD, while the annual cost is just 206,000 USD. The net annual profit of the last scenario means having 30% of the actual demand, which is calculated as 43.5 million USD.

6. Summary and Conclusions

The COVID-19 pandemic has significantly affected the global economy and particularly the tourism industry, with large hotel chains, resultants, museums, airlines and travel agencies being forced to suspend their activities. While quarantine policies are tremendously limiting global travel and tourism activities in the short run, the consequences of this pandemic could cause the national and global tourism industry to collapse in the long term. This paper proposes a scheme to support virtual tours in sites with cultural interest using drones and contributes to the growing body of knowledge on drone applications in various fields, specifically in the tourism industry. The proposed project can increase tourism activities and contribute to alleviating the impact of pandemics and crisis.
This study scrutinizes the potential use of drones in providing online virtual tours of open-space tourist attractions. Although the paper mainly focuses on pandemic lockdowns, in which real visits are prohibited, the application of drones for providing the virtual tours in normal situations, for those who cannot visit the site or for those who are present at the site but want to take photos from an aerial perspective, is also considered. As one of the most prominent issues in strategic planning, the paper aims to find the best location(s) for establishing the drone launching stations. To do so, a novel mixed-integer linear mathematical model is developed to optimally determine the number and location of required facilities and the number of drones assigned to each center. The main objective of the model is to minimize the annual operational costs of the whole center. The model is applied to a case study of Rome by selecting six historic sites as the tourist attractions and considering several candidate locations for establishing the facilities. Making a set of assumptions for estimating the demand of each historic site, the GAMS compiler is used to solve the model for the considered case study. The results imply that the project is flagrantly profitable, even if the offered price is so trivial and the demand for virtual tours is so low.
Due to the novelty of the study, the demand for virtual tours is estimated using several simulating scenarios. Providing survey studies to make real predictions of the demand could be of great interest in the future. Moreover, one can use the idea of multi-objective optimization to account for adding other objective functions such as minimizing the traveled distance or customers’ waiting times.

Author Contributions

Conceptualization, S.H.; methodology, M.G. and S.I.; software, M.G. and B.R.; formal analysis, M.G. and S.H.; investigation, S.H.; writing—original draft preparation, S.I., S.H. and M.G.; writing—review and editing, S.H. and M.G and H.R.; supervision, S.I. and H.R. All authors have read and agreed to the published version of the manuscript.

Funding

This research received no external funding.

Conflicts of Interest

The authors declare no conflict of interest.

References

  1. Aboolian, Robert, Oded Berman, and Zvi Drezner. 2009. The multiple server centre location problems. Annals of Operations Research 167: 337–52. [Google Scholar] [CrossRef]
  2. Allen, J. D. 2018. Recreational Drone Use on Public Lands. University of Montana Conference on Undergraduate Research (UMCUR). p. 21. Available online: https://scholarworks.umt.edu/umcur/2018/pmposters/21 (accessed on 13 October 2020).
  3. Almeida, D. R. A., Eben North Broadbent, Angelica M. Almeyda Zambrano, Benjamin E. Wilkinson, Manuel Eduardo Ferreira, R. Chazdon, and P. Meli. 2019. Monitoring the structure of forest restoration plantations with a drone-lidar system. International Journal of Applied Earth Observation and Geoinformation 79: 192–98. [Google Scholar] [CrossRef]
  4. Amazon. 2020. DJI Phantom 4 Pro Plus Quadcopter Drone. Retrieved April 14. Available online: https://www.amazon.com/dp/B01N9XP9W9/ref=as_li_ss_tl?ie=UTF8&linkCode=sl1&tag=aniwaa04-20&linkId=0ba0b49bf5aa5ded1a4e1e1de2cce4e6&language=en_US (accessed on 13 October 2020).
  5. Beadel, Sarah, William Shaw, Roger Bawden, Chris Bycroft, Fiona Wilcox, Joanna McQueen, and Kelvin Lloyd. 2018. Sustainable management of geothermal vegetation in the Waikato Region, New Zealand, including application of ecological indicators and new monitoring technology trials. Geothermics 73: 91–99. [Google Scholar] [CrossRef]
  6. Betters, Elyse. 2016. How Does Amazon Prime Air Work and Where Is Drone Delivery Available? Available online: https://www.pocket-lint.com/drones/news/amazon/139746-how-does-amazon-prime-air-work-and-where-is-drone-delivery-available (accessed on 13 October 2020).
  7. Boonmee, Chawis, Mikiharu Arimura, and Takumi Asada. 2017. Facility location optimization model for emergency humanitarian logistics. International Journal of Disaster Risk Reduction 224: 485–98. [Google Scholar] [CrossRef]
  8. Braitenberg, Carla, Daniele Sampietro, Tommaso Pivetta, David Zuliani, Alfio Barbagallo, Paolo Fabris, Lorenzo Rossi, Julius Fabbri, and Ahmed Hamdi Mansi. 2016. Gravity for detecting caves: Airborne and terrestrial simulations based on a comprehensive karstic cave benchmark. Pure and Applied Geophysics 173: 1243–64. [Google Scholar] [CrossRef]
  9. Buhalis, Dimitrios, and Rob Law. 2008. Progress in information technology and tourism management: 20 years on and 10 years after the Internet—The state of eTourism research. Tourism Management 29: 609–23. [Google Scholar] [CrossRef] [Green Version]
  10. Chauhan, Darshan, Avinash Unnikrishnan, and Miguel Figliozzi. 2019. Maximum coverage capacitated facility location problem with range constrained drones. Transportation Research Part. C: Emerging Technologies 99: 1–18. [Google Scholar] [CrossRef]
  11. Dinhopl, Anja, and Ulrike Gretzel. 2016. Selfie-taking as touristic looking. Annals of Tourism Research 57: 126–39. [Google Scholar] [CrossRef]
  12. Disztinger, Peter, Stephan Schlögl, and Aleksander Groth. 2017. Technology acceptance of virtual reality for travel planning. In Information and Communication Technologies in Tourism 2017. Cham: Springer, pp. 255–68. [Google Scholar]
  13. Drosos, D., M. Chalikias, M. Skordoulis, P. Kalantonis, and A. Papagrigoriou. 2017. The strategic role of information technology in tourism: The case of global distribution systems. In Tourism, Culture and Heritage in a Smart Economy. Cham: Springer, pp. 207–19. [Google Scholar]
  14. Farahani, Reza Zanjirani, Nasrin Asgari, Nooshin Heidari, Mahtab Hosseininia, and Mark Goh. 2012. Covering problems in facility location: A review. Computers & Industrial Engineering 62: 368–407. [Google Scholar] [CrossRef]
  15. Frew, Andrew J. 2000. Information and communications technology research in the travel and tourism domain: Perspective and direction. Journal of Travel Research 39: 136–45. [Google Scholar] [CrossRef]
  16. Golabi, Mahmoud, Seyed Mahdi Shavarani, and Gokhan Izbirak. 2017. An edge-based stochastic facility location problem in UAV-supported humanitarian relief logistics: A case study of Tehran earthquake. Natural Hazards 87: 1545–65. [Google Scholar] [CrossRef]
  17. Golabi, Mahmoud, Gokhan Izbirak, and Jamal Arkat. 2018. Multiple-server facility location problem with stochastic demands along the network edges. Journal of Engineering Research. 6. Available online: http://kuwaitjournals.org/jer/index.php/JER/article/view/4027 (accessed on 13 October 2020).
  18. Han, Dai-In, M. Claudia tom Dieck, and Timothy Jung. 2018. User experience model for augmented reality applications in urban heritage tourism. Journal of Heritage Tourism 13: 46–61. [Google Scholar] [CrossRef]
  19. Hay, B. 2016. Drone tourism: A study of the current and potential use of drones in hospitality and tourism. In CAUTHE 2016: The Changing Landscape of Tourism and Hospitality: The Impact of Emerging Markets and Emerging Destinations. Sydney: Blue Mountains International Hotel Management School. [Google Scholar]
  20. Huang, Y. C., K. F. Backman, S. J. Backman, and L. L. Chang. 2016. Exploring the implications of virtual reality technology in tourism marketing: An integrated research framework. International Journal of Tourism Research 18: 116–28. [Google Scholar] [CrossRef]
  21. Ihde, D. 1990. Technology and the Lifeworld: From Garden to Earth. Bloomington: Indiana University Press. [Google Scholar]
  22. ISTAT. 2016. Rapporto Annuale 2016. La Situazione del Paese. Roma: Istituto Nazionale di Statistica. Available online: https://www.istat.it/en/archivio/tourism (accessed on 13 October 2020).
  23. Jung, T. H., and Dai-In Han. 2014. Augmented Reality (AR) in Urban Heritage Tourism. e-Review of Tourism Research 2014: 5. [Google Scholar]
  24. Jung, Timothy, M. Claudia tom Dieck, Hyunae Lee, and Namho Chung. 2016. Effects of virtual reality and augmented reality on visitor experiences in museum. In Information and Communication Technologies in Tourism 2016. Cham: Springer, pp. 621–35. [Google Scholar]
  25. King, L. M. 2014. Will drones revolutionise ecotourism? Journal of Ecotourism 13: 85–92. [Google Scholar] [CrossRef]
  26. Law, Rob, Rosanna Leung, and Dimitrios Buhalis. 2009. Information technology applications in hospitality and tourism: A review of publications from 2005 to 2007. Journal of Travel & Tourism Marketing 26: 599–623. [Google Scholar]
  27. Law, Rob, Shanshan Qi, and Dimitrios Buhalis. 2010. Progress in tourism management: A review of website evaluation in tourism research. Tourism Management 31: 297–313. [Google Scholar] [CrossRef]
  28. Law, Rob, Dimitrios Buhalis, and Cihan Cobanoglu. 2014. Progress on information and communication technologies in hospitality and tourism. International Journal of Contemporary Hospitality Managemen 26: 727–50. [Google Scholar] [CrossRef]
  29. Leue, M. C., D. Han, and T. Jung. 2014. Google glass creative tourism experience: A case study of Manchester art gallery. WHTF Seoul 2014: 26–29. [Google Scholar]
  30. Leue, M. Claudia, Timothy Jung, and Dario tom Dieck. 2015. Google glass augmented reality: Generic learning outcomes for art galleries. In Information and Communication Technologies in Tourism 2015. Cham: Springer, pp. 463–76. [Google Scholar]
  31. Leung, Rosanna, and Rob Law. 2007. Information technology publications in leading tourism journals: A study of 1985 to 2004. Information Technology & Tourism 9: 133–44. [Google Scholar]
  32. Leung, D., R. Law, H. Van Hoof, and D. Buhalis. 2013. Social media in tourism and hospitality: A literature review. Journal of Travel & Tourism Marketing 30: 3–22. [Google Scholar]
  33. Leung, Xi Yu, Lan Xue, and Billy Bai. 2015. Internet marketing research in hospitality and tourism: A review and journal preferences. International Journal of Contemporary Hospitality Management 27. [Google Scholar] [CrossRef]
  34. Lu, Weilin, and Svetlana Stepchenkova. 2015. User-generated content as a research mode in tourism and hospitality applications: Topics, methods, and software. Journal of Hospitality Marketing & Management 24: 119–54. [Google Scholar]
  35. Luppicini, Rocci, and Arthur So. 2016. A technoethical review of commercial drone use in the context of governance, ethics, and privacy. Technology in Society 46: 109–19. [Google Scholar] [CrossRef]
  36. Mirk, David, and Helmut Hlavacs. 2015. Virtual tourism with drones: Experiments and lag compensation. In Proceedings of the First Workshop on Micro Aerial Vehicle Networks, Systems, and Applications for Civilian Use. New York: Association for Computing Machinery, pp. 45–50. [Google Scholar]
  37. Murray, A. T. 2005. Geography in coverage modeling: Exploiting spatial structure to address complementary partial service of areas. Annals of the Association of American Geographers 95: 761–72. [Google Scholar] [CrossRef]
  38. Murray, Alan T., Daoqin Tong, and Kamyoung Kim. 2010. Enhancing Classic Coverage Location Models. International Regional Science Review 33: 115–33. [Google Scholar] [CrossRef]
  39. Pesonen, Juho Antti. 2013. Information and communications technology and market segmentation in tourism: A review. Tourism Review 68. [Google Scholar] [CrossRef]
  40. Rauschnabel, Philipp A., and Young K. Ro. 2016. Augmented reality smart glasses: An investigation of technology acceptance drivers. International Journal of Technology Marketing 11: 123–48. [Google Scholar] [CrossRef]
  41. Ren, Chiang H. 2000. Understanding and managing the dynamics of linked crisis events. Disaster Prevention and Management 9: 12–17. [Google Scholar] [CrossRef]
  42. Shavarani, Seyed Mahdi, Mahmoud Golabi, and Gokhan Izbirak. 2019a. A capacitated biobjective location problem with uniformly distributed demands in the UAV-supported delivery operation. International Transactions in Operational Research. [Google Scholar] [CrossRef]
  43. Shavarani, Seyed Mahdi, Sam Mosallaeipour, Mahmoud Golabi, and Gökhan İzbirak. 2019b. A congested capacitated multi-level fuzzy facility location problem: An efficient drone delivery system. Computers & Operations Research 108: 57–68. [Google Scholar] [CrossRef]
  44. Stankov, Uglješa, James Kennell, Alastair M. Morrison, and Miroslav D. Vujičić. 2019. The view from above: The relevance of shared aerial drone videos for destination marketing. Journal of Travel & Tourism Marketing 36: 808–22. [Google Scholar]
  45. Statista. 2020. Italy: Price of Properties for Rent in Rome by Area 2020. Retrieved April 15. Available online: https://www.statista.com/statistics/907660/average-price-of-properties-for-rent-in-rome-by-area-italy/ (accessed on 13 October 2020).
  46. Stolaroff, Joshuah K., Constantine Samaras, Emma R. O’Neill, Alia Lubers, Alexandra S. Mitchell, and Daniel Ceperley. 2018. Energy use and life cycle greenhouse gas emissions of drones for commercial package delivery. Nature Communications 9: 1–13. [Google Scholar]
  47. Tscheu, Frances, and Dimitrios Buhalis. 2016. Augmented reality at cultural heritage sites. In Information and Communication Technologies in Tourism 2016. Cham: Springer, pp. 607–19. [Google Scholar]
  48. Tussyadiah, Iis P., and Daniel R. Fesenmaier. 2009. Mediating tourist experiences: Access to places via shared videos. Annals of Tourism Research 36: 24–40. [Google Scholar] [CrossRef]
  49. Tussyadiah, Iis P., Dan Wang, and Chenge Helen Jia. 2017. Virtual reality and attitudes toward tourism destinations. In Information and Communication Technologies in Tourism 2017. Cham: Springer, pp. 229–39. [Google Scholar]
  50. Tussyadiah, Iis P., Timothy Hyungsoo Jung, and M. Claudia tom Dieck. 2018. Embodiment of wearable augmented reality technology in tourism experiences. Journal of Travel Research 57: 597–611. [Google Scholar] [CrossRef] [Green Version]
  51. Ukpabi, Dandison C., and Heikki Karjaluoto. 2017. Consumers’ acceptance of information and communications technology in tourism: A review. Telematics and Informatics 34: 618–44. [Google Scholar] [CrossRef] [Green Version]
  52. Vizvári, Béla, Mahmoud Golabi, Arman Nedjati, Ferhat Gümüşbuğa, and Gokhan Izbirak. 2019. Top-down approach to design the relief system in a metropolitan city using UAV technology, part I: The first 48 h. Natural Hazards 99: 571–97. [Google Scholar] [CrossRef]
  53. Wang, Dan, Sangwon Park, and Daniel R. Fesenmaier. 2012. The role of smartphones in mediating the touristic experience. Journal of Travel Research 51: 371–87. [Google Scholar] [CrossRef] [Green Version]
  54. Wang, Dan, Zheng Xiang, and Daniel R. Fesenmaier. 2016. Smartphone use in everyday life and travel. Journal of Travel Research 55: 52–63. [Google Scholar] [CrossRef]
  55. World Salaries. 2020. Italy Average Salary Income. Retrieved April 15. Available online: http://www.worldsalaries.org/italy.shtml (accessed on 13 October 2020).
  56. World Health Organization. 2020. Coronavirus Disease (COVID-19) Outbreak. Available online: https://www.who.int/emergencies/diseases/novel-coronavirus-2019 (accessed on 16 March 2020).
  57. Y-Charts. 2020. Italy Long Term Interest Rate. Retrieved April 15. Available online: https://ycharts.com/indicators/italy_long_term_interest_rates (accessed on 13 October 2020).
  58. Yovcheva, Zornitza, Dimitrios Buhalis, and Christos Gatzidis. 2012. Smartphone augmented reality applications for tourism. E-Review of Tourism Research (Ertr) 10: 63–66. [Google Scholar]
  59. Yovcheva, Z., D. Buhalis, C. Gatzidis, and C. P. van Elzakker. 2014. Empirical evaluation of smartphone augmented reality browsers in an urban tourism destination context. International Journal of Mobile Human Computer Interaction (IJMHCI) 6: 10–31. [Google Scholar] [CrossRef] [Green Version]
  60. Zeng, Benxiang, and Rolf Gerritsen. 2014. What do we know about social media in tourism? A review. Tourism Management Perspectives 10: 27–36. [Google Scholar] [CrossRef]
Figure 1. Hotspot Triangular Zone. Note: Jrfm 13 00246 i001 
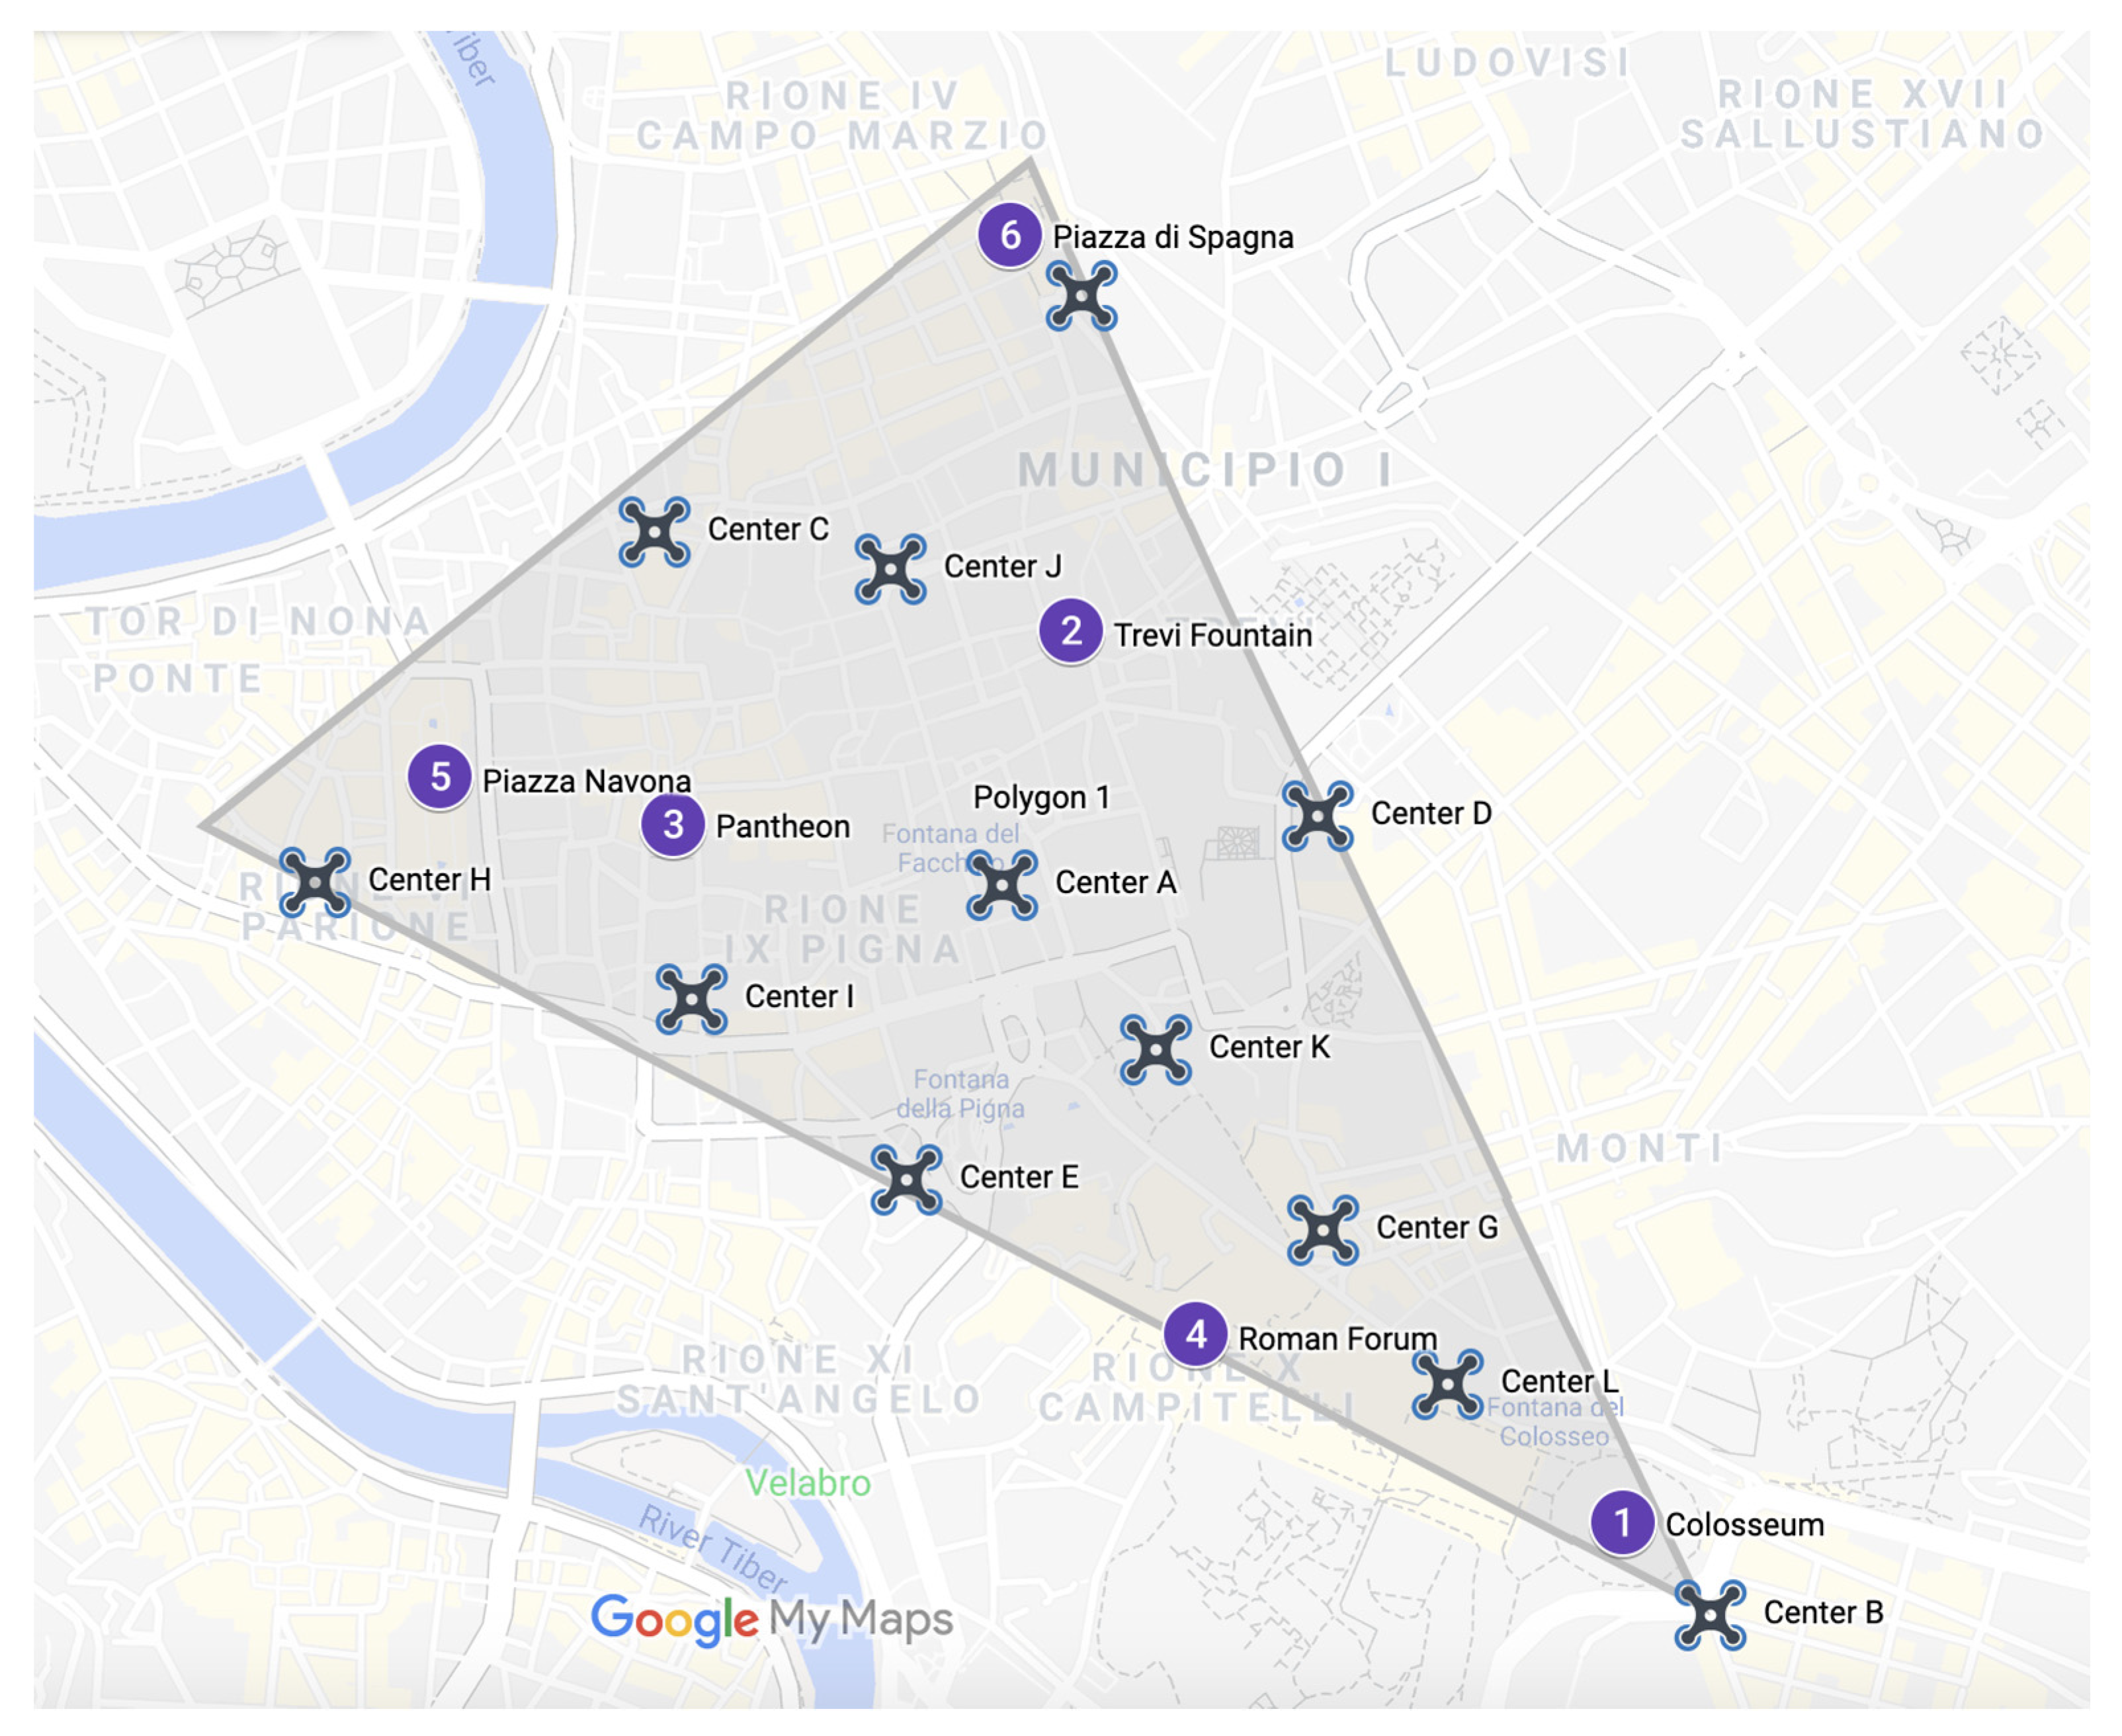
Numbers in blue circles represent selected touristic hotspots in Rome, Italy, including 1. Colosseum; 2. Trevi Fountain; 3. Roman Forum; 4. Pantheon; 5. Piazza di Spagna; 6. Navona. Jrfm 13 00246 i002 pinpoints the candidate drone locations, indicated by capital letters from A to L. Source: Google Maps, 2020.
Jrfm 13 00246 g001
Table 1. The estimated preference rates of the historical sites.
Hotspot 1Hotspot 2Hotspot 3Hotspot 4Hotspot 5Hotspot 6
Strategy 10.220.200.170.150.140.12
Strategy 20.280.230.190.140.090.07
Strategy 30.400.200.160.120.080.04
Strategy 40.460.190.140.090.070.05
Table 2. Numerical results.
ScenarioStrategySite 1Site 2Site 3Site 4Site 5Site 6Number of DronesCost (USD)
5%S1AAAAAAA26206,002
S2AAAAAAA26206,02
S3GGGGGGG26206,002
S4GGGGGGG26206,002
10%S1LJ0.78 JLJJJ30  L20403,850
0.22 L
S20.03 JJJLLLJ21  L29403,850
0.97 L
S3BJJ0.94 BJJB25  J24399,773
0.06 J
S4LJJLJ0.9 JJ22  L27399,773
0.1 L
15%S1G0.1 GCGC0.78 CC30 G29 J15601,698
0.9 J0.22 J
S2LJ0.99 I0.93 LIJI21 J22 L30597,621
0.01 J0.07 I
S3BJ0.95 I0.97 IIJB29 I26 J18597,621
0.05 J0.03 B
S40.91 BAAL0.75 LAA30 B30 L14601,698
0.09 L0.25 A
20%S10.95 B0.94 F0.98 IGIFB20 F30 G17 I30795,469
0.05 G0.06 G0.02 G
S20.99 B0.98 J0.99 IGIJB27 G14 I27 J29795,469
0.01 G0.02 B0.01 J
S30.78 BJ0.95 I0.97 LIJB30 I23 J24 L20795,469
0.22 L0.05 J0.03 I
S40.68 BJ0.95 I0.75 LIJB30 I22 J24 L21795,469
0.32 L0.05 J0.25 I
30%S10.95 B0.44 F0.5 HGHFB30 F30 G26 1,095,242
0.05 G0.56 J0.5 JH30 J30
S20.74 B0.53 F0.52 C0.96 LCFB30 C28 F281,095,242
0.26 L0.47 J0.48 J0.04 JJ30 L30
S30.52 B0.83 J0.77 I0.87 KIJB30 I26 J301,095,242
0.48 L0.17 K0.23 K0.13 LK26 L30
S40.56 B0.82 J0.96 IGIJB30 G26 I301,095,242
0.44 L0.18 G0.04 GJ30 L30
Publisher’s Note: MDPI stays neutral with regard to jurisdictional claims in published maps and institutional affiliations.

