Abstract
The objective of the study was to predict the future performance of banks based on the contextual information provided in annual reports. The European Central Bank has observed that performance prediction models in earlier studies mainly rely on quantitative financial data, which are insufficient for the comprehensive assessment of banks’ performance. There is a need to incorporate the qualitative information along with numerical data for better prediction. In this context, this study employed the attribution theory for understanding the contextual information of behavioral biases of management towards the expected outcomes. The sample consisted of 58 banks of 16 emerging economies, and the period covered from 2007–2015. Unsupervised hierarchical clustering was performed to identify the latent groups of banks within the data. For performance prediction, system GMM was employed, because it helped to deal with the endogeneity and heterogeneity problems. The results of the study were consistent with the attribution theory that management took credit for favorable expected outcomes and distanced from bad outcomes. An important policy implication of the study is that the prevalence of self-attribution bias of management in annual reports provides an additional source of information for the regulators to identify the banks at risks and take preventive measures to avoid the expected cost of failure. It can also help investors, and gives analysts a better tool for a comprehensive analysis of the profitability of prospective investments.
1. Introduction
Banks are important financial intermediaries within the financial system, and play a significant role in the economic growth of a country by mobilizing the savings of depositors and making them available to the borrowers for productive ventures (). Bank failures led to contagious effects, as witnessed in the global banking crisis of 2007–2008 that affected many sectors of major economies of the world (; ; ; ). Therefore, prediction of bank performance is important, because bank failures cause vulnerabilities to the financial system (). The Federal Deposit Insurance Corporation of the US reported that almost 400 commercial banks were bankrupted in the US during 2008 to 2012. Furthermore, 10 large banking groups survived with the help of government bailout packages. The total estimated cost of the financial crisis that the US economy had to face ranged between $10 trillion to $20 trillion ().
In this context, a large body of literature has emerged to deal with investigating bank future performance from traditional econometric models to advanced machine learning methods (see () for more details). However, these models were exclusively built on quantitative financial data (). In addition, the focus of the earlier studies was to classify the banks into two groups, ‘failed’ and ‘non-failed’ (). In response to that, the European Central Bank advised using both the business data as well as qualitative information for the extensive and comprehensive assessment of bank’s performance (). This was earlier mentioned by the Securities and Exchange Commission (1987) of the US that numerical presentations and brief notes were insufficient for investors to assess expected profitability of banks. It is already evident from the research on non-financial firms that qualitative information not only helps in understanding the financial statement, but also contains incremental information about future financial performance (, ). Therefore, () proposed that qualitative data should also be considered for examining the firm’s future performance. This view was also endorsed by () who asserted that narratives could be used to assess the future financial performance of firms. Thus, qualitative data seems a valuable additional information source to be used for supplementing the quantitative financial data provided in corporate financial statements.
Researchers in non-financial firms have already incorporated qualitative data to empirically testing the hypothesis of interest, including the relationship between stock market returns and media discussions (), the relationship between firm performance and complexity of corporate textual documents (; ), press releases and future financial performance (), the language of CEO letter to shareholders and firm performance (), speculative forecast of investment and behavior of investors (), and the relationship between self-attribution bias of managers and firms’ future performance ().
Self-attribution bias (SAB) of management based on attribution theory1 has become a well-recognized qualitative text analysis technique in corporate finance research. It is a tendency of individuals taking credit for successful outcomes, but blaming unsuccessful outcomes to external factors (; ; ; ; ; ).
The prevalence of self-attribution bias is likely in annual reports, press releases, conference calls, and the President’s letter to shareholders, because managers try to attribute favorable outcomes to their abilities to get rewards, and unfavorable outcomes to external factors to avoid penalties. Accounting literature has widely analyzed CEO’s self-attribution bias from different perspectives, especially linking it with the firm’s future financial performance. () argued that self-attribution behavior of the managers could alert the misleading information related to financial performance, especially during bad times of firms.
Research on non-financial firms has already started to investigate the possibilities of using self-attribution bias of managers for testing hypothesis of interest. However, the banking sector has not benefited from this line of research. () maintained that banks are different from non-financial firms in many important ways: (a) banks have a unique role of creating credit for economy, (b) they are highly regulated due to contagious effects, and (c) banks are highly leveraged. Likewise, banks act as delegated monitors of resources, share risk of the economy, and ensure that firms efficiently use the resources extended to them in terms of loans (). Therefore, the studies conducted on non-financial firms cannot be generalized to the banking sector.
In addition, () explained that a substantial body of economic theory also emphasized the comparative importance of banks, and concluded that banks are important in early stages of economic development of a country. The authors suggested that in the transition stage of economies, banks have a comparative advantage in financing collateralized, and standardized endeavors than those of other financial institutions. () also suggest that banks are more important in the majority of the emerging economies. Similarly, () also argue that when the economies are in the early transition stage, the share of banks towards whole financial system and GDP growth are relatively high.
The ‘immeasurably important’ place of banks as central of economic activities in the emerging economies underscore the merit for studies that exclusively investigate the bank future financial performance. To the best of my knowledge, there is no study that has used self-attribution bias of management focusing on the emerging economies to predict the future performance of banks. This study attempts to fill this gap.
This study poses the research question, does the self-attribution of management in annual reports offer incremental predictive power, over and above the models based on the traditional quantitative financial data alone?
The study contributes in two important ways. First, it contributes toward a comprehensive performance prediction models of banks in which contextual information using self-attribution bias of management is leveraged with the traditional numerical data to predict the future performance of banks. This could help potential, as well as existing, investors with a comprehensive information about future profitability. Second, management of banks have the advantage of superior information, and are aware that regulators mostly focus on few financial ratios, which can be distorted (). This study helps in reducing the information asymmetry between the management and shareholders about expected future performance by getting signals with the help of self-attribution of management in annual reports of the banks (Principal-Agent model).
The remaining part of the paper has been organized as follows: the next section shed lights on existing literature, taking up each issue under scope of attribution theory. Section 3 provides the research methodology that describes the sample selection, how managerial attribution bias was measured, and describes the econometric models. Section 4 explores the data with the help of descriptive statistics, correlation matrix and scatter plot matrix. Section 5 presents the exploratory data analysis with agglomerative hierarchal cluster analysis to find the latent groups within the data. Section 6 provides the estimates of the model that leads to the discussion of results. Section 7 concludes the research findings.
2. Literature Review
() have explained that it is important to predict the future performance of banks, so that the regulators could take timely actions to mitigate the disastrous outcomes resulting from banking crisis. In this context, a large body of the literature emerged that dealt with investigating the future performance of banks. Methods developed earlier for manufacturing firms were also adopted in financial firms with some modifications. The methods included an analysis of financial ratios, discriminant analysis ((; ), and logistic models, data envelopment analysis or DEA, (), and machine learning algorithms, particularly, the neural networks (). These methods provide the foundation for researchers to predict the future financial performance of banks from more than two decades (). In addition to the earlier models, stress test which has become more widespread after the financial crisis of 2007–2008 that is performed under hypothetical bad economic conditions to observe that a bank has required capital to bear the impact of adverse conditions (). However, this test is performed by management, and based on hypothetical situations which may be strategically manage by the managers to show a better financial condition of the bank (principals-agent problem).
() criticized earlier developed models on the basis that these models exclusively relied on quantitative financial data. The () also observed that researchers were developing models based only on the financial data for predicting the bank’s performance. However, there is a large quantity of unstructured qualitative information that should also be used in conjunction with numerical data for a comprehensive performance prediction model. In this perspective, () augmented that qualitative sections of annual report provide “nearly twice the quantity of information as do the basic financial statements”. Moreover, the qualitative information could also help in understanding financial statement, and signals about future financial performance (, ). This was earlier suggested by () that the textual data should also be considered in examining whether firms are healthy or at risk.
Earlier studies on non-financial firms have empirically evidenced that future performance could be predicted using qualitative information in corporate documents (, ; ). Thus, the qualitative data seems to be a valuable additional information source to supplement the financial data available in corporate financial statements. Research in the manufacturing sector has already begun to explore the narratives in textual disclosures in many ways, including complexity of text, sentiment analysis, and self-attribution bias. In this study, self-attribution bias of management is used to predict the future financial performance of banks.
Managerial attribution bias can be understood in the context of attribution theory (; ; ). Attribution theory was first proposed by Heider in 1958, but Weiner and colleagues developed a theoretical framework that has become a major research paradigm in social psychology (; ; ; ; ; ; ). The theory explains that achievers believe success was attained due to their abilities, and efforts (internal attribution), whereas, failure would be considered due to bad luck, and was not their fault (external attribution). Therefore, () claims that attribution theory in psychology predicts that using internal attribution or external attribution in textual disclosures is an import indication of a firm’s future performance.
Literature has witnessed that attribution of management provides involuntary signals about the expected outcomes of firms in the textual sections of annual reports, especially, in the CEO’s letter to the shareholders, and management discussion and analysis (; ; ). () provided that when the outcomes of firms were good, the CEO took credit, and attributed to internal factors (their ability, skills, vision and foresightedness). In contrast, if the outcomes were unfavorable, they made external attributions (bad economic, and market situations) in an attempt to distance from bad performance, so that they would not be held personally accountable.
Accounting literature has widely analyzed management’s self-attribution bias from different perspectives. For instance, () analyzed the bankrupted Indian firm ‘Satyam’, and found that there was a shift in first-person singular pronouns to first-person plural pronouns in the CEO’s letter to shareholders. It also showed blame shifting signals about the bad outcomes of the firm. Similarly, () examined the chairman’s letter to shareholders of the 50 top and bottom UK companies, and found that management took credit for good news, and blamed the external environment for bad outcomes. Likewise, () analyzed the managements’ tendency towards self-serving attribution with the help of computational linguistic technique in management discussions and analysis (MD&A), and found that the inclination of attributional words by management was positively related to firms’ future performance. More recently, () examined how top management communicate the bad or good firm performance to the stakeholders. The authors found a significant and positive relationship between subsequent good performance and internal attribution, while bad performance was attributed to external factors.
Researchers also used self-attribution biases from many other aspects other than firm performance. For instance, () analyzed whether the past speculative forecast of managers increased more investments by testing the data of 92 North American gold mining firms over a period of 1989 to 1999. The results of the study demonstrated that bad forecast did not reduce investments, because managers attributed successful outcomes to their abilities, while losses were attributed to bad luck or some other external factors.
From the investors’ perspective, () analyzed the behavior of investors for their investment decisions using behavioral biases. The authors used 1290 stocks traded in the Bombay Stock Exchange of the India during 2004 to 2012 examining whether the self-attribution bias existed among investors about their earnings’ forecasts. The results of the study revealed that when the forecast was accurate, the investors took credit, while the wrong forecast was attributed to external factors, especially the excessive volatility in the stocks. Likewise, () investigated the relationship between attribution of managers for their earnings forecast, and investors’ utilization of that attribution. The study found that investors followed the internal attribution of management for their investments. In another study, () investigated the attribution with the help of personal pronouns of CEO for the prediction of winning law suits or good/bad news of CEO. Results clearly indicated that participants’ likelihood of winning law suits or good performance was associated with the use of more personal pronouns.
3. Methodology
3.1. Data
The author selected all the emerging economies which were reported in IMF emerging economies list. Specialized banks were excluded to keep the sample homogeneous. Annual reports were downloaded from the websites of banks, and the financial data were obtained from Bureau van Dijk (BvD)2. Another condition to the sample selection was the availability of CEO letters to shareholders, and management discussion and analysis in annual reports. Moreover, banks were who published annual reports in their national language excluded from the sample, because this could create reliability problems in the construction of self-attribution bias indices.
After accounting for all changes, the data consisted of 58 banks from 16 emerging economies, and the period covered 2007 to 2015. The list of banks is provided in Appendix A.
3.2. Variables and Their Definitions
3.2.1. Bank Performance Indicator
Return on Average Equity (ROAE): Return on average equity was taken as a performance indicator of banks. It was calculated as the net income divided by average total equity. ROAE is an internal performance measure of shareholder value and has been widely used for performance prediction of banks (; ; ; ; ). It is a fundamental ratio that tells the investors, how effectively management uses their money. It proposes a direct assessment of the financial return of shareholders’ investment. This ratio shows whether the management is growing banks’ value at an acceptable rate.
3.2.2. Performance Determinants
Self-Serving Attribution Bias (CEO letter to shareholders): In the corporate context, more use of first, and second-person pronouns is an indication of taking credit for good outcomes, compared to third-person pronouns. Researchers have widely analyzed corporate narrative to explore the relationship between CEO’s self-attribution bias in letters to the shareholders and the firm’s future financial performance (; ; ; ). In this study, a positive relationship is expected between self-attribution bias of CEO in letter to shareholders and bank’s future performance.
Self-Serving Attribution Bias (Management Discussions and Analysis): This section of annual report explains the firm’s overall performance, challenges face by the management, internal and external risks involved in the operations, and indications about the future prospects. A similar methodology was adopted to calculate the self-attribution bias of management in management discussions and analysis as described in CEO letter to shareholders. Earlier studies have evidenced the positive relation between self-attribution of management in management discussions and analysis and firm’ future financial performance (; ; , ). Similarly, a relationship is also expected in the bank’s financial performance.
Total Assets: In this study, total assets represent the size of bank with the absolute values in million US dollars. There was huge variation in the assets of the banks in the emerging economies. Thus, the logarithm of total assets (Log_Assets) was employed as a proxy for bank size. The size of assets could provide higher profit up to a certain level, thereafter, the profitability could be lowered as compared to small banks. Thus, the relationship between total assets and banks performance could be negative, because percentage of profit does not increase with the equivalent proportion of assets (; ; ; ). Some other studies have also shown an insignificant relationship of total assets and firms’ performance (; ).
Assets Growth Ratio: The assets growth ratio was calculated by current year assets minus last year assets divided by last year assets. Assets growth ratio indicates the percentage increase or decrease over the prior year. The increase in profitability of the bank depends upon the increase in quality of assets. Higher quality assets would increase the profitability of the banks. The earlier studies suggested that as the assets increased, profitability of the bank were also increased (; ; ; ). Thus, the relations between assets growth and banks future performance is expected to be positive.
Non-Performing Loans to Gross Loans Ratio: Non-performing loans to gross loans was calculated as total non-performing loans divided by gross loans of the bank. The loans are classified as nonperforming when the borrower defaults or declares bankruptcy. It measures the effectiveness of a bank in receiving repayments on its loans. The higher the ratio, lower the profitability of the banks (; ; ).
Tier1Capital Ratio: Tier1capital ratio was calculated as total tier1capital3 divided by total risk-weighted assets4. The tier1capital ratio measures a bank’s core capital. In 2015, under Basel III, the minimum tier 1 capital ratio was 6 percent. The regulators use this ratio to determine, whether a bank is well capitalized, undercapitalized or adequately capitalized relative to the minimum requirements. Since, net income is spread over increased equity, the relationship between performance of banks and tier1capital is expected to be negative ().
Loans to Asset Ratio: Loans to asset ratio was calculated as total loans held by bank’s borrowers divided by total assets of the bank. The loans included cash deposits at other banks, financial assets, securities, advances to the borrowers. This ratio indicates to what extent assets are devoted to loans. Literature has shown that the relationship between loans to assets ratio and bank performance could be either positive or negative. Higher the ratio, lower the liquidity position of bank, and may face a higher risk of failure (). In addition, a bank holding more liquid assets (lower loan to asset ratio) may suffer from lower profitability (; ). On the other hand, higher loans to borrowers could provide more interest income to the banks ().
GDP Growth Rate: GDP growth is the rate of change in gross domestic products of a country. Positive relationship between bank’s performance and GDP growth rate is expected, because increase in economic activities would lead to demand for bank’s transactions, resulting higher profitability of the banks (; ; ; ). Other studies showed that there was no relationship between GDP growth and banks profitability, and was more country specific (; ).
Interest Rate Spread: Interest rate spread is the country level variable that refers to the difference between the borrowing and the lending rates of banks. Higher spread shows that banks are advancing loans at a higher premium. Thus, the relationship between interest rate spread and bank’s performance is expected to be negative.
Exchange Rate (1 $ equals local currency): The exchange rate is the price of one country’s currency in terms of foreign currency. The financial data for this study was obtained from Bureau van Dijk (BvD), which was available in US dollar. Exchange rate has indirect impact on the profitability of the banks. There is a tendency among some countries to keep local currency weaker to stimulates exports. Because the export transactions are executed through banking channels, it increases the non-interest income of the banks (; ). Thus, a positive relationship is expected between exchange rate and return on average equity.
The list of variables and their definitions are provided in Table 1.

Table 1.
Variables and Definitions.
3.3. Measurement of Managerial Self-Attribution Bias
Text preprocessing is an exhaustive process, especially when someone needs to analyze unstructured qualitative information. The purpose of preprocessing is to convert qualitative text in a usable form to get insight for further analysis. There are different software programs which have built-in functions that convert text into predefined objects. Many of those software programs do not provide customized options to the users to process text according to specific requirements. For instance, two software programs are commonly used in literature; (i) Diction, and (ii) Linguistic Inquiry and Word Count (LIWC) that contain predefined built-in functions for text analysis. Our text analysis required customized functions, because annual reports of selected sample countries did not follow any standard pattern to measure the managerial self-attribution bias. Therefore, an open source R software is used for measurement of attribution bias indices, because it provides a rich selection of text preprocessing packages.
I also used SAS software for agglomerative hierarchical clustering, and estimation of system GMM.
After downloading the annual reports from the websites of the banks, two sections namely, CEO’s letter to shareholders, and the management discussions and analysis (MD&A)5 were extracted.
At an initial stage, all the documents were converted from pdf to plain, UTF-8 encoded text using “pdftools” of R, and were stored in a “Corpus”. A corpus is considered to be a “library” of all the original documents that have been converted to plain, UTF-8 encoded text. Figure 1 exhibits the whole process for the measurement of self-attribution bias indices. Self-attribution bias was constructed by first and second-person pronouns minus third-person pronouns. To construct the self-attribution bias from the CEO’s letter to shareholders (CEO SAB), two separate dictionaries of first and second-person pronouns, and third-person pronouns were constructed. These two dictionaries were employed to obtain the score by matching with the corpus of CEO letter to shareholders. Each term of pronoun was counted as many times it appeared in the document, which reflected the stress made by management to take credit of good performance and vice versa.
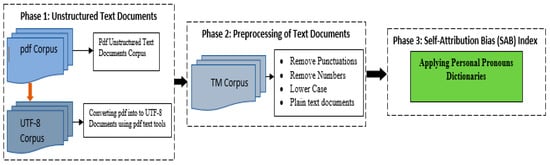
Figure 1.
Construction of self-attribution bias (SAB) Indices using Natural Language Processing (NLP).
A similar process was adopted to obtain the score of first and second-person pronouns and third-person pronouns of management discussions and analysis (MD&A SAB).
3.4. Econometric Model Using System GMM
For performance prediction, three models were estimated. First, prediction of banks performance using only two self-attribution bias (SAB) indices. Second, the model was estimated with the help of SAB indices along with bank level quantitative financial variables. Third model was estimated with full set of SAB indices, bank level variables, and macroeconomic indicators. The notion behind estimating three models was to observe the predictive power of SAB indices, over and above the models that were based on quantitative financial data alone.
Dynamic panel models are linear regression models that consist of individual effects, yield individual-level errors, and overall model residual errors. It allows for dependent variables to depend on its own value from its previous time, thus making the model dynamic. The following Equation (1) is specified for model 1.
where is the return on average equity one year ahead taken as a performance indicator of banks. CEO_SAB is the self-attribution bias calculated from CEO letter to shareholders, and MD&A_SAB is the self-attribution bias calculated from management discussions and analysis. The is individual effects, and the observation-level regression errors.
ROAEi,t+1 = β1 ROAEi,t + β2 CEO_SABi,t + β3 MD&A_SABi,t + vi + εi,t (I = 1, …., N, t = 1, …., T)
The second model is shown in Equation (2):
ROAE i,t+1 = β1 ROAEi,t + β2 CEO_SABi,t + β3 MD&A_SABi,t + β4 Assets(log)i,t + β5 Assets_Growthi,t + β6 NPL/GLoansi,t + β7 Tier1Capitali,t + β8 Loans/Assetsi,t + vi + εi,t
The second model consisted of SAB indices, bank level quantitative financial variables that includes log of assets, assets growth ratio, ratio of non-performing loans to gross loans, tier1captial ratio, and loans to assets ratio.
The third model is shown in Equation (3):
ROAEi,t+1 = β1 ROAEi,t + β2 CEO_SABi,t + β3 MD&A_SABi,t + β4 Assets(log)i,t + β5 Assets_Growthi,t + β6 NPL/GLoansi,t + β7 Tier1Capitali,t + β8 Loans/Assetsi,t + β9 Interest_Spreadi,t + β10 GDP_Growthi,t + β11 Exchange_Ratei,t + vi + εi,t
The third model consists of a full set of SAB indices, bank level quantitative financial variables, and macroeconomic indicators that includes interest rate spread, GDP growth, and exchange rate.
Diagnostic Checks
Initially, the model was estimated using fixed effects, and random effects, and observed the individual effects using F-test. The Hausman test was estimated for model’s selection either to use the fixed effects or the random effects. The problem with the fixed effects and the random effects are that the error term being correlated with the lagged dependent variable created an endogeneity problem, and even the error term is not autocorrelated (). Both models are presented in Appendix C. Thus, the regressors are said to be endogenous when random errors are correlated to the regressors. In fact, endogeneity is a major methodological concern in many areas of research in corporate finance (). If endogeneity is present in the model, then the statistical inference from the analysis may be biased (). Endogeneity may occur due to omitted variables, which may result in the error term being correlated with the explanatory variables. Alternatively, the endogeneity may be of the dynamic type, whereby the past realizations of the dependent variable influence current realizations of one or more of the explanatory variables. Finally, endogeneity can be of the simultaneous type, where the contemporaneous realizations of both the dependent variable and the explanatory variables affect each other (; ).
The model in this study potentially faces two types of endogeneity issues, i.e., omitted variable bias, and the past realization of dependent variable in terms of earning persistence. For example, SAB indices were developed from the textual data to capture the private information of the management. Nevertheless, these indices may not necessarily present a perfect proxy of private information, and is affected by the agency problem. This is referred to as endogeneity of omitted variable bias. Moreover, lagged dependent variable is included in the right-hand side of the model, making it dynamic. The reason to include the lagged dependent variable is the performance persistence of the banks, which was the continuity of the current earnings affected by the magnitude of the accruals. The higher persistent earnings are accompanied with more ability to maintain the current earnings (). Hence, failure to address the endogeneity may lead to poor statistical inference ().
Some of researchers have mentioned that there should be a theoretical reasoning for considering the regressor as endogenous. However, for a robustness check, the Durbin-Wo-Hausman test was used to test whether the theoretical reasoning justify the empirical reason of endogeneity problem.
Similarly, the model could also face heteroscedasticity problem. The White test was used for detecting the heteroscedasticity of residuals, and the null hypothesis is that the variances for the errors are homoscedastic, where for all i. In presence of the heteroscedasticity, estimates are still unbiased, but become inefficient. However, the standard errors of estimates are wrong, leading to incorrect inferences ().
() and () proposed system GMM that could help deal with the endogeneity problems (), and heterogeneity problems (). System GMM consists of two sets of equations, each with its own internal instruments, i.e., the first set is levels equations, and second set is the difference equations ().
A generalization of the linear regression model is an autoregressive (AR) model. The AR test was conducted to identify the serial correlation in residual. The null hypothesis is that there is no serial correlation within residuals.
The validity of the instruments was confirmed via a the Sargan test that checks for overidentifying restrictions, and it is asymptotically distributed as a χ2 (n) with n degrees of freedom under the null hypothesis that the instrument set is appropriate for the data at hand.
In addition, robust standard errors were calculated, which are more reliable than conventional standard errors ().
The estimates of all models were conducted with the help of SAS ‘proc panel’ procedure.
4. Descriptive Statistics
Table 2 provides the descriptive statistics of 58 banks of 16 emerging economies. Furthermore, detailed descriptive statistics were calculated at country level, so that insight could be obtained in depth about how one country’s statistics were different from another. Country level statistics are shown in Appendix B. The Mean of ROAE was 16 percent, which was close to median, whereas the lowest value was −27 percent, and the highest was 41 percent, and the standard deviation was 6.75. It was found that the highest ROAE belonged to the NDB bank of Sri Lanka in 2012, because in that year NDB bank became the first investment bank. It made divestment of AVIVA insurance, and made new investment with A/A corporation. Further, economic growth, and the post war period in Sri Lanka also helped to increase profitability. Lowest ROAE −27.80 belonged to an Askari bank of Pakistan due to huge non-performing loans, and the bank written-off non-banking assets.
Table 2.
Descriptive Statistics of SAB, Financial, and Macroeconomic Variables.
SAB of CEO ranged between −139 to 181 that means there was polarity of managerial attribution, because in some of the banks, the CEO used more first and second-person pronouns, and in other cases, the CEO used more third-person pronouns. SAB of MD&A also showed a greater dispersion, and ranged between −191 to 1128. The highest values of SAB of MD&A related to those banks who had published annual reports of more than 700–1000 pages, meaning that a large number of pages were also allocated to MD&A section.
Financial variables also presented greater variability in the data. Absolute values were reported in millions of US dollars converted from local currency on the last day of the financial year of the respective country. The mean value of total assets was 187,225 US dollars, and ranged between 143 million US dollars to 3,421,363 million US dollars, having a standard deviation of 486,273. Largest value belonged to the ICBC, because it was one of the largest banks in the China, whereas, lowest assets were reported by the PABC bank of the Sri Lanka. It was important to notice that the Chinese banks were much larger than any other banks in selected samples. The lowest value of assets growth was −22% belonged to the Bank Alfalah of the Pakistan in 2008, which was year of financial crisis, and 56% belonged to the ThanaChart bank of the Thailand. The PABC bank of the Sri Lanka has the highest non-performing loans with the value of 27%, whereas, an average value was 4% close to median.
In the macroeconomic indicators, the Do-Brazil bank had the highest interest rate spread ranged between 30–35 percent. The high interest rate spread was due to the Brazil’s large public debt, and debt services. Another reason of high interest rate spread was the history of default that’s the government had to pay a high default risk premium to attract foreign capital. Moreover, the exchange rate was lowest in the Indonesia for 1 dollar equals 13,389 Indonesian Rupiah. The GDP Growth rate was lowest in Hungary in 2009 with −6.56, and highest in Singapore with 15.24 in 2010.
The author provides the correlation matrix in the Table 3 showing that there was no multicollinearity between the variables. Figure 2 provides the scatter plot matrix of all the SAB indices, quantitative financial variables, and macroeconomic indicators.
Table 3.
Correlation Matrix of SAB, Financial and Macro-Economic variables.
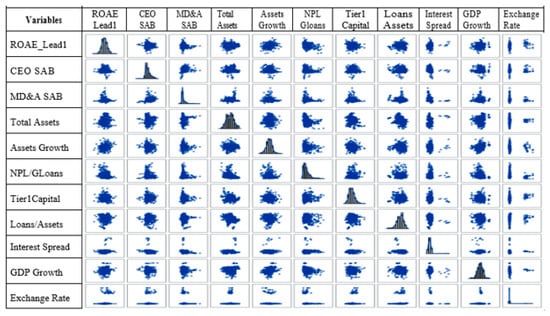
Figure 2.
Scatter Plot Matrix of Independent and Dependent Variables.
5. Agglomerative Hierarchical Clustering Analysis
Cluster analysis is an important form of exploratory data analysis that tries to explore hidden groups within the data. It is an unsupervised machine learning method, which is widely used for classification problems, and exploring the data based on some similarity of features6 through a structed pattern (; ). As a result, observations in the same cluster are more analogous than those in other clusters (). More importantly, clustering helps to discover latent natural group, and categorize data into a hierarchical set of clusters organized in a tree structure ().
There are different clustering techniques, including k-mean clustering, k-mode clustering, but the underlying study adopted the hierarchical clustering, because it is mainly used for small data sets, where each observation forms hierarchy. SAS ‘proc cluster’ procedure was used for agglomerative hierarchical cluster analysis.
To calculate the similarities between observations, it is required to normalize all the variables, so that the distance between these observations are computed to prevent disproportionate weights, and biases. The data used in this study consisted of total assets reported in million in the dollar, and other financial variables are in percentage. Therefore, the whole dataset was normalized using the following formula:
where is the standardized value of observation n, is the original value of observation n, and are the mean, and standard deviation of the variable X. The sample data consisted of a panel of 58 banks, and the time period covers from 2007–2015. Directly making clusters of the panel data could match the observation of one bank’ year with another bank. This could distort the whole data, and understanding of clusters. Therefore, the mean of each bank was taken, where each bank represented a single observation. Moreover, the data consisted of 11 variables that could also create problems for differentiating variables for making the clusters. Principal component analysis was performed to identify the variables that were loaded on the first factor (see Appendix C). Hence, four variables: assets growth, total assets, NPL to gross loans, and GDP growth, were loaded on factor-1 that were taken to form clusters.
5.1. Measurement of Distance between Observations
The distance between observations was calculated using Euclidean distance matric (). It is shown as follows.
where d is the distance between p, and q the observations of n variables. Thus, the Euclidean method calculates the distance of each combination of all the observations. Then, the linkage rule creates clusters by comparing the distance between the clusters, and observations. This process continues until a diagram called dendrogram is created, which explains how the observations are connected to each other based on similarities of observations. The dendrogram is shown in Figure 3.
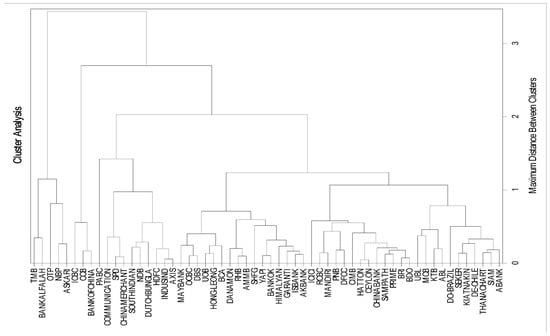
Figure 3.
Dendrogram of Hierarchical Clustering.
To determine the optimum number of clusters, cubic clustering criterion (CCC), (b) pseudo T statistic, and (c) pseudo F statistics were used. The highest peak of CCC is considered as the optimum number of clusters. In our case, the peak of the plot at 4 CCC provided 9 optimal number of clusters, as shown in Figure 4.
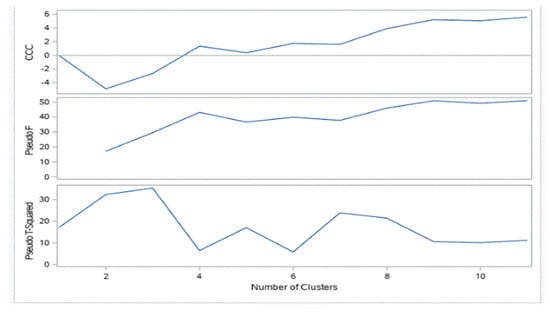
Figure 4.
Criteria for Selecting number of Clusters.
Pseudo F statistic (PSF) also supplemented the selection of 9 clusters by showing the highest peak (middle graph). In pseudo t2 statistic, observing the graph from right to left, until the first height gave the indication of about 9 as the number of clusters. Table 4 shows the number of banks in each cluster, percent frequency, and cumulative percent frequency.
Table 4.
Frequency of Banks in Each Cluster.
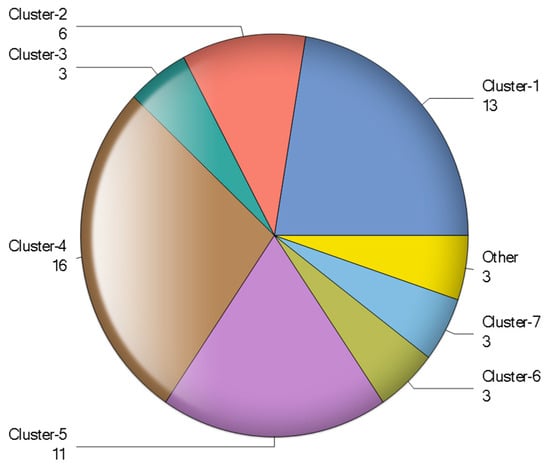
Figure 5.
Pie Chart of Clusters.
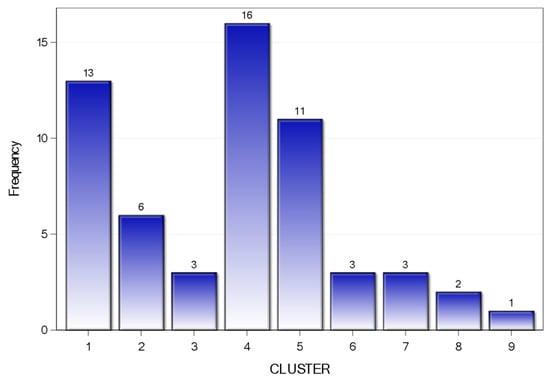
Figure 6.
Bar Chart of Clusters.
5.2. Cluster Profile
To profile the clusters, descriptive statistics were calculated on the unstandardized dataset based on the clusters’ distribution of banks to explore the reasons of similarities, and differences between clusters.
It helps to understand the patterns between clusters, and the rationale behind how these clusters were formed. Statistics included mean, median, standard deviation, skewness, and kurtosis shown in the Table 5.
Table 5.
Profile.
Observing the mean statistic of four variables used in cluster analysis, the mean value of assets growth was 10 percent, and GDP growth at 5.16 percent. However, Natural Language Processing (NLP) to gross loans were only 4.24 percent. These values were also close to median, meaning that the distribution of these variables was symmetrical. These statistics were compared with cluster statistics.
Table 5 shows that cluster-1 included those banks which had a smaller mean value, and median as compared to the whole dataset, except total assets. It included 13 banks: four banks of Philippines, four banks of the Sri Lanka, two banks of Indonesia, and one bank each from the India, Bangladesh, and the Malaysia. Cluster-2 consisted those banks which had high assets growth, banks belonged to those countries with a better GDP growth rate, less NPL, and low averaged total assets as compared to whole sample statistics. This cluster consisted 6 banks: four Indian banks, and one bank each from the Sri Lanka, and Bangladesh. Cluster-3 comprised of banks with highest assets growth, and banks belonged to those countries with the highest GDP growth rate, lowest NPL, and largest banks in the selected sample. It was interesting to notice that all the three banks in cluster-3 belonged to the China.
Cluster-4 included 16 banks where five from Turkey, three each from Malaysia and Singapore, and one bank each from Thailand, Indonesia, and Nepal. Banks included in this cluster had lower assets growth which was also manifested in countries with lower GDP growth.
Banks included in cluster-4 had low averaged NPL, and total assets as compared to whole sample statistics. Cluster-5 carried those banks having low averaged assets, GDP growth, and low NPL, as compared to total sample statistics, which was also supplemented by other statistics. Banks included in this cluster were relatively small banks. Three Chinese banks also constructed the cluster-6 without including any other bank from emerging economies. Cluster-3 and cluster-6 carried the Chinese banks, but the major differentiators between both were assets growth, and the size of banks. Cluster-3 banks were small sized, but the highest assets growth as compared to the banks of cluster-6.
Cluster-7 included banks which had the highest non-performing loans with second lowest assets growth. The data also revealed that the Askari bank and NBP bank from the Pakistan, and the OTP bank from Hungary had persistent high non-performing loans. In cluster-8, the major differentiator was the assets growth, having the lowest mean value and highest coefficient of variation. Finally, cluster-9 carried only one bank that did not merge in any other cluster. The reason being that the separated bank was the highest mean value of assets growth of 18.14 percent, and smallest bank in terms of total assets. The list of banks in each cluster along with their belonging to the country are shown in Table 6.
Table 6.
List of Banks in Each Cluster.
6. Econometric Analysis
6.1. Pre-Diagnostics Checks
Initially, fixed effects and random effects were estimated. The results of both models, fit statistics and diagnostics tests are reported in Appendix D. The Hausman test was used to select the fixed effects or random effects model. Based on the results, we reject the null hypothesis, and suggested to employ fixed effects model. In addition, F-test was also performed to observe the bank effects in the model, and the null hypothesis is that bank effects are all zero. Based on the results, we rejected the null hypothesis at 1 percent (p-value < 0.01), and suggest that bank effects exist in the data. In both models, fixed effects and random effects, CEO SAB and MD&A SAB indices were insignificant. However, assets growth was significant at 1 percent, NPL to gross loans and tier1capital ratios, and exchange rate from macroeconomic indictor were negative and significant at 5 percent. Assets growth was positive and significant at 5 percent.
Although, the Hausman test suggested for fixed effects model, but the problem with the fixed effects was that the error term was correlated with the lagged dependent variable, creating an endogeneity problem (). Moreover, the model could also face the heterogeneity problem. The White test was used for detecting the heteroscedasticity of residuals. Based on the results, the null hypothesis was rejected at 1 percent significance (p < 0.01), and suggested that the variances of error were heteroscedastic7. Thus, the results produced could be biased, and lead to poor statistical inferences.
In addition, self-attribution bias indices were also theoretically endogenous, which were further tested using Durbin-Wu-Hausman test, known as the Hausman specification test. The null hypothesis is that there is no measurement error. The results of the test rejected the null hypothesis at 5 percent (p < 0.026, and suggested for use as the instrumental variable8.
To deal with the endogeneity and heterogeneity problem, the author used the GMM system, developed for dynamic panel models by (), and (). System GMM helps to deal endogeneity problem using instrumental variables. It also deals the heteroskedasticity using the orthogonality conditions to allow for efficient estimation in the presence of heteroskedasticity, even of unknown form ().
Table 7 shows the results of model-1 (Equation (1)) of system GMM, parameter estimates, fit statistics such as means squared error (MSE), Root MSE, and r-squared.
Table 7.
Model-1.
6.2. Post Diagnostics Checks
Post diagnostic checks were conducted to determine the robustness of the empirical results. The Sargan test provided the test of overidentification restrictions. Therefore, the null hypothesis was rejected, and suggest that the instrument set is appropriate for the data (p-value < 0.4695). Similarly, the AR test was conducted to identify the serial correlation in residual, and the null hypothesis that there is no serial correlation, and the results suggested no serial correlation at the second-order (p-value < 0.6918).
Observing the model-1, lagged ROAE was positive and statistically significant at 1 percent (p-value < 0.01). The relationship between CEO SAB and MD&A SAB with ROAE was positive and statistically significant at 1 percent (p-value <0.01). This suggested that these variables could be used for the prediction of banks performance at least one-year prior to the announcement of the results. These results were consistent with the attribution theory that management took credit for expected favorable outcomes, and distance itself when expected outcomes were poor ().
Table 8 provides the results of model-2 which is a combination of SAB indices, and five financial ratios. Fit statistics showed little improvement in MSE, RMSE, and SSE as compared to model-1. In addition, there was no serial correlation within the residuals at second-order (p < 0.9051). The Sargen test also showed that the instruments set was appropriate (p-value < 5275).
Table 8.
Model-2.
Observing the Table 8, MD&A SAB was positive, and highly significant at 1 percent (p-value < 0.01) without major change in coefficients. It means that the self-attribution bias of management provided additional information, over and above the traditional bank level quantitative variables. However, CEO SAB became insignificant by adding the financial ratios in the model-2. This suggested that CEO managerial attribution provided indications about future performance, when it was used without financial variables. All the bank level financial variables were significant at 1 percent (p-value < 0.01). For example, the size of banks in terms of total assets was negative and statistically significant at 1 percent. Non-performing loans to Gross Loans showed a negative relationship with future ROAE and was significant at 1 percent. Likewise, the tier1Capital ratio, and Loans to assets ratio were negative and significant at 1 percent. Nevertheless, assets growth was positive and statistically significant at 1 percent (p-value < 0.01).
Finally, Table 9 demonstrates the results of model-3 using the full set of SAB indices, quantitative financial variables, and macroeconomic indicators. Fit statistics were further improved in MSE, RMSE, and SSE from previous both model-1 and model-2. The AR test provided no serial correlation at the second order within the residual (p-value < 0.9422), and the Sargen test demonstrated that instruments used in the model were appropriate (p-value < 0.3189).
Table 9.
Model-3.
Adding macroeconomic indicators within the model, CEO attribution bias index became positive and significant at 5 percent (p-value <0.05). Management discussions and analysis persistently remained positive and significant at 1 percent (p <0.001). Adding the macroeconomic indicators did not make any change in the bank level financial variables as compared to model-2. Some of the coefficient values were changed, but all the financial variables remained significant at 1 percent (p-value < 0.01). However, all the macroeconomic indicators were insignificant in model-3.
6.3. Discussions
Observing model-1 and model-3, the results suggested that managerial self-attribution bias in CEO letter to shareholders predicted the future ROAE, either alone or in combination of quantitative financial variables and macroeconomic indicators. This suggests that CEO of banks use more first and second-person pronouns in the letter to shareholders to take credit for expected positive outcomes. Thus, it also suggests that the self-attribution bias of CEO provides additional predictive power, over and above the traditional quantitative financial data that researchers have been using from many decades. The results produced in this study were consistent with prior studies conducted on non-financial firms (; ; ; ).
Similarly, self-attribution bias of management discussions and analysis also had predictive power, over and above quantitative financial and macroeconomic indicators. This index was positive and statistically significant in all the three models. Management discussions and analysis is a comprehensive document, where management discusses about overall bank performance, challenges faced by management, future plans, and expected outcomes. Thus, the results were supported by previous studies who had evidenced the positive relationship between self-attribution of management and firm’ future financial performance (; ; , ). The results of both indices were also consistent with the attribution theory that managerial attribution bias provided contextual information for understanding the behavioral bias of management that could be linked to the expected outcomes of the banks (; ; ).
In financial variables, the size of the banks in terms of assets was negative and statistically significant at 1 percent and 5 percent in model-2, and model-3 respectively, meaning that as the size of banks increased, future ROAE of the bank decreased. Thus, the size of banks in terms of assets could stipulate higher profit up to a certain level, thereafter, the profitability could be lower. Moreover, this also shows higher unproductive, non-interest earning assets in the balance sheet of the banks. Contrary to the study of () and (), the results of both models were support by earlier studies that there was an inverse relationship between total assets and ratio of future ROAE, because the percentage of profit did not increase with the same proportion of assets (; ; ; ). Likewise, the ratio of asset growth was positive and significant at 1 percent in model-2 and model-3. This is directly proportional to the banks’ profitability, i.e., as the assets of the bank increases, banks have more loanable investments to earn profits. Positive relationship also shows that banks have higher interest earning assets. Thus, an increase in customer borrowing means an increase in the interest income of the banks. These results were in line with the earlier studies that an annual increase in assets, profitability of the banks also increased (; ; ; ).
Non-performing loans to gross loans was also negative and the significant at 1 percent in model-2 and model-3 that means profitability decreases with an increase in non-performing loans, either used with self-attribution bias of management or in combination of macroeconomic indicators. Earlier discussed in the methodology section that loans were classified as non-performing, if the borrower defaulted or declared bankruptcy. Our results were supported by previous studies that higher the ratio, lowered the ROAE of the banks (; ; ).
The relationship between the performance of banks and Tier1capital was negative, because return on average equity was calculated by dividing the net income over equity. Thus, net income is spread over increased equity. The coefficient of tier1capital was highest in all the variables used in models. The results supported the view that the higher the ratio, the lower the future performance of banks (). Finally, the loans to assets ratio also showed a negative and significant relationship with future ROAE. This ratio indicates to what extent assets were devoted to loans as opposed to other assets, including cash, securities, and equipment. The results presented in this study are consistent with () that higher the ratios, lower the liquidity position of the bank, and may face a higher risk of failure.
In economic indicators, it was expected that there would be a positive relationship between banks future performance in terms of ROAE and GDP growth rate. However, the author failed to find any relationship as witnessed by (; ). The reason of insignificance would be the direction of dependent and independent variables. It was argued in the introduction that banks promote economic growth. However, the present study considered GDP growth as determinant of future ROAE. Similarly, the relationship between interest rate spread and future banks performance was also insignificant. Finally, contrary to the studies of (; ), this study failed to find any relationship between future ROAE and exchange rate.
Based on the analysis, the study answers the research question that self-attribution bias of management in annual reports of banks provided additional predictive power, over and above the quantitative financial variables. The results provided in this study were more robust, because models were estimated in a way that reduced the endogeneity and heterogeneity problems along with valid instruments.
7. Conclusions
Banks are important financial intermediaries within the financial system because they help to promote the economic growth of a country. Nevertheless, the banking sector crisis had a history for their role in the financial turmoil, especially in the 2007–2008 sub-prime crisis. Such a banking crisis had not only reduced the industrial production, entrepreneurial innovation, trade, but also had knock-on effects to the rest of the world. Therefore, the prediction of bank performance is important for regulators to take pre-emptive actions to avoid huge losses. However, developed models for performance prediction of banks were only based on quantitative financial data.
In this research, self-serving attribution bias, which is a text analysis technique based on attribution theory, was used for a contextual understanding of managerial behavioral bias towards the outcomes of banks. The notion behind self-attribution was that management uses more first and second-person pronouns as compared to third person pronouns in annual reports if they anticipate better future performance.
The sample consisted of 58 banks of 16 emerging economies for a period from 2007–2015. For exploratory data analysis, hierarchical clustering from unsupervised machine learning was performed to detect latent groups within the data. It was observed that some of the banks joined the clusters based on asset growth, other banks formed clusters due to high NPL. GDP growth also worked as a differentiator for grouping the banks into the cluster. Finally, the size of the banks in terms of assets distinguished the small banks with medium and large banks.
To predict the future performance of banks, system GMM proposed by () was used to estimate the models. System GMM helps to deal with the endogeneity and heterogeneity problems within the data. The results of the study have shown that there existed a strong relationship between managerial attribution bias and the future performance of banks in emerging economies. The results were consistent with the attribution theory, which predicted that managers took credit for good outcomes and distanced from bad outcomes. Therefore, the study concludes that self-attribution bias of management signals about the future performance of banks, over and above the quantitative financial data provided in financial statements.
7.1. Policy Implications
Regulators: Any technique that could even marginally improve the ability of regulatory authorities to make an assessment of overall bank performance would be beneficial, because supervisors may intervene in a timely manner to avoid bank failure (). The findings of the study have shown that self-attribution bias of management in annual reports provides incremental information, over and above the quantitative data provided in financial statements of banks. Such information could be used as indications of early warnings, and help the regulatory authorities of emerging economies to differentiate the bad performing banks. As a result, the banks could be supervised more efficiently, and take preventive, and corrective measures to avoid huge losses to the investors, and government.
Investors and Analysts: The findings also show that the contextual information of management in emerging economies’ banks can help reduce information asymmetry between shareholders and management (principal-agent theory). It can provide the existing as well as potential investors with a better tool for a comprehensive assessment of banks profitability for prospective investments.
Researchers: Use of textual information from the textual information of banks is a relatively unexplored area where researchers may yield rich insights for testing further hypotheses of interest.
7.2. Limitation of the Study
Sample data was relatively small, because the author had to follow certain criteria for inclusion of banks in the sample. For example, annual reports of banks must include CEO letter to shareholders, and management discussions and analysis (MD&A). The CEO letters were mainly available in the annual reports; however, MD&A was not regulatory requirement in emerging economies. In addition, the banks in emerging economies were either state owned or family owned or became public limited only recently. Therefore, most of the banks did not have these two sections. These issues reduced the sample size of banks.
Cultural differences of countries may hold individual effects, while using first-person pronouns, and second person pronouns by management in annual reports. For instance, it might be the convention in some sample countries that management uses more plural pronouns in these two sections.
Likewise, English was not the first-language in annual reports of banks in emerging economies. Therefore, use of pronouns, while writing annual reports may hold some implications for construction of self-attribution bias indices.
Finally, the literature on textual analysis was mainly focused on developed economies. Most of the banks in emerging economies are either state owned or family owned. Thus, management might not necessarily take credit for good performance, and bad performance attributed to external factors, due to restricted power of management over the board of directors and shareholders.
Author Contributions
All the work related to problem identification, analytical solution, interpretation and writing was done by J.I. This article is from PhD dissertation.
Funding
This research received no external funding.
Acknowledgments
Author is very grateful to two anonymous referees for their helpful suggestion. Author is responsible for any remaining errors.
Conflicts of Interest
The author declares no conflict of interest.
Appendix A. List of Banks in Sample
| Country | Bank Name | Country | Bank Name |
| Bangladesh | Dutch Bungla Bank | Singapore | DBS |
| Prime Bank | OCBC | ||
| Brazil | Do-Brazil Bank | UOB | |
| Chile | De-Chile | Sri Lanka | Ceylon Bank |
| China | Bank of China | DFCC Bank | |
| CCB | Hatton Bank | ||
| China Merchant Bank | NDB Bank | ||
| Communication bank | PABC Bank | ||
| ICBC | Sampath Bank | ||
| SPD Bank | Thailand | Bangkok Bank | |
| Hungary | OTP Bank | Kiatnakin | |
| India | Axis Bank | KTB Bank | |
| HDFC | Siam Bank | ||
| ICICI Bank | Thana Chart Bank | ||
| Indusind Bank | TMB Bank | ||
| South Indian Bank | Turkey | ABank | |
| Indonesia | BCA Bank | AKBank | |
| BRI Bank | Garanti Bank | ||
| Danamon Bank | ISBank | ||
| Mandiri Bank | Seker Bank | ||
| Korea | SHFG Bank | Yapi | |
| Malaysia | AMMB Bank | ||
| CIMB Bank | |||
| Hong-Leong | |||
| May Bank | |||
| RHB Bank | |||
| Nepal | Himalayan Bank | ||
| Pakistan | ABL Bank | ||
| Askari Bank | |||
| Bank Alfalah | |||
| MCB | |||
| NBP | |||
| UBL | |||
| Philippines | BDO Bank | ||
| China Bank | |||
| PNB | |||
| RCBC Bank |
Appendix B. Descriptive Statistics by Country
| Country | N Obs | Variable | Mean | Median | Minimum | Maximum | CV | Std Dev |
| Bangladesh | 18 | ROAE_LEAD1 | 19.75 | 19.71 | 8.45 | 35.33 | 4.40 | 8.77 |
| CEO SAB | 28.94 | 28.50 | 8.00 | 57.00 | 48.26 | 3.97 | ||
| MD&A SAB | 23.72 | 25.00 | −17.00 | 58.00 | 93.34 | 22.14 | ||
| Total Assets | 2084.23 | 2058.43 | 719.95 | 3288.66 | 41.15 | 857.72 | ||
| Assets Growth | 14.11 | 15.39 | −4.85 | 26.42 | 60.42 | 8.53 | ||
| NPL/GLoans | 3.19 | 2.82 | 1.15 | 7.67 | 57.97 | 1.85 | ||
| Tier1Capital | 8.64 | 9.44 | 4.65 | 10.95 | 21.20 | 1.83 | ||
| Loans/Assets | 66.57 | 66.19 | 59.63 | 77.61 | 8.39 | 5.58 | ||
| Interest Spread | 4.24 | 4.48 | 1.87 | 5.64 | 29.24 | 1.24 | ||
| GDP Growth | 6.14 | 6.06 | 5.05 | 7.06 | 9.37 | 0.58 | ||
| Exchange Rate | 73.98 | 74.15 | 68.60 | 81.86 | 6.66 | 4.93 | ||
| Brazil | 9 | ROAE_LEAD1 | 20.72 | 18.41 | 15.44 | 29.61 | 25.26 | 5.23 |
| CEO SAB | 34.89 | 39.00 | 12.00 | 52.00 | 41.52 | 14.49 | ||
| MD&A SAB | 17.00 | 4.00 | 3.00 | 67.00 | 142.58 | 24.24 | ||
| Total Assets | 426,310.40 | 481,190.04 | 200,340.00 | 554,609.90 | 30.44 | 129,776.38 | ||
| Assets Growth | 9.70 | 7.61 | −12.33 | 46.31 | 169.32 | 16.43 | ||
| NPL/GLoans | 4.48 | 4.17 | 2.30 | 8.61 | 51.63 | 2.31 | ||
| Tier1Capital | 8.83 | 8.84 | 5.83 | 11.39 | 24.74 | 2.18 | ||
| Loans/Assets | 45.15 | 43.13 | 40.38 | 50.90 | 9.24 | 4.17 | ||
| Interest Spread | 29.97 | 31.34 | 19.58 | 35.59 | 18.87 | 5.66 | ||
| GDP Growth | 2.69 | 3.00 | −3.77 | 7.53 | 129.89 | 3.49 | ||
| Exchange Rate | 2.11 | 1.95 | 1.67 | 3.33 | 23.72 | 0.50 | ||
| Chile | 9 | ROAE_LEAD1 | 22.50 | 22.48 | 18.61 | 27.11 | 12.11 | 2.72 |
| CEO SAB | 53.89 | 57.00 | 26.00 | 82.00 | 30.79 | 16.59 | ||
| MD&A SAB | 121.44 | 133.00 | 45.00 | 182.00 | 43.98 | 53.41 | ||
| Total Assets | 29,227.61 | 21,741.00 | 12,583.00 | 49,514.80 | 49.27 | 14,399.67 | ||
| Assets Growth | 12.81 | 12.77 | −8.78 | 38.98 | 132.54 | 16.98 | ||
| NPL/GLoans | 5.02 | 3.53 | 1.34 | 9.92 | 62.91 | 3.16 | ||
| Tier1Capital | 10.03 | 8.92 | 7.25 | 13.32 | 24.38 | 2.45 | ||
| Loans/Assets | 79.00 | 79.13 | 75.29 | 83.06 | 3.08 | 2.44 | ||
| Interest Spread | 3.91 | 4.09 | 1.91 | 5.77 | 29.88 | 1.17 | ||
| GDP Growth | 3.63 | 3.98 | −1.04 | 5.84 | 63.14 | 2.29 | ||
| Exchange Rate | 533.99 | 522.46 | 483.67 | 654.12 | 10.17 | 54.31 | ||
| China | 54 | ROAE_LEAD1 | 19.31 | 19.84 | 11.71 | 27.90 | 17.44 | 3.37 |
| CEO SAB | 17.87 | 8.00 | −3.00) | 123.00 | 124.97 | 22.33 | ||
| MD&A SAB | 14.00 | 2.00 | −19.00) | 100.00 | 209.31 | 29.30 | ||
| Total Assets | 1,285,860.17 | 996,974.44 | 153,270.17 | 3,421,363.16 | 72.79 | 936,017.03 | ||
| Assets Growth | 15.75 | 16.78 | 1.55 | 33.35 | 40.78 | 6.42 | ||
| NPL/GLoans | 1.40 | 1.13 | 0.44 | 3.17 | 51.05 | 0.72 | ||
| Tier1Capital | 9.81 | 10.08 | 4.02 | 13.48 | 18.03 | 1.77 | ||
| Loans/Assets | 52.78 | 53.27 | 44.52 | 59.58 | 6.38 | 3.37 | ||
| Interest Spread | 3.03 | 3.06 | 2.85 | 3.33 | 4.44 | 0.13 | ||
| GDP Growth | 9.26 | 9.40 | 6.92 | 14.23 | 23.10 | 2.14 | ||
| Exchange Rate | 6.61 | 6.46 | 6.14 | 7.61 | 6.90 | 0.46 | ||
| Hungary | 9 | ROAE_LEAD1 | 9.07 | 8.36 | −7.37 | 26.25 | 101.55 | 9.22 |
| CEO SAB | 38.56 | 41.00 | 18.00 | 70.00 | 52.12 | 20.09 | ||
| MD&A SAB | −5.22 | −6.00 | −23.00 | 9.00 | −192.63 | 10.06 | ||
| Total Assets | 45,631.94 | 46,948.80 | 37,396.11 | 51,701.50 | 9.34 | 4264.13 | ||
| Assets Growth | 0.52 | 3.97 | −13.69 | 16.13 | 2071.80 | 10.75 | ||
| NPL/GLoans | 13.95 | 15.72 | 6.90 | 19.57 | 37.99 | 5.30 | ||
| Tier1Capital | 13.12 | 13.30 | 10.03 | 17.40 | 19.07 | 2.50 | ||
| Loans/Assets | 71.27 | 72.06 | 59.93 | 79.49 | 8.95 | 6.38 | ||
| Interest Spread | 2.80 | 2.67 | 0.26 | 5.21 | 49.83 | 1.39 | ||
| GDP Growth | 0.55 | 0.89 | −6.56 | 4.05 | 571.95 | 3.13 | ||
| Exchange Rate | 214.20 | 207.94 | 172.11 | 279.33 | 14.62 | 31.32 | ||
| India | 45 | ROAE_LEAD1 | 15.83 | 17.11 | 6.24 | 21.60 | 24.29 | 3.85 |
| CEO SAB | −1.09 | 6.00 | −139.00 | 71.00 | −4428.10 | 48.31 | ||
| MD&A SAB | 19.07 | −3.00 | −191.00 | 323.00 | 651.83 | 124.29 | ||
| Total Assets | 49,115.58 | 33,227.81 | 3115.59 | 138,506.86 | 89.84 | 44,125.07 | ||
| Assets Growth | 15.13 | 13.89 | −7.37 | 38.70 | 73.36 | 11.10 | ||
| NPL/GLoans | 1.88 | 1.36 | 0.81 | 5.65 | 63.26 | 1.19 | ||
| Tier1Capital | 11.23 | 11.54 | 6.70 | 14.92 | 16.73 | 1.88 | ||
| Loans/Assets | 58.18 | 58.54 | 47.33 | 68.01 | 9.22 | 5.37 | ||
| Interest Spread | 6.93 | 7.10 | 4.40 | 8.40 | 17.72 | 1.23 | ||
| GDP Growth | 7.19 | 7.18 | 3.89 | 10.26 | 24.90 | 1.79 | ||
| Exchange Rate | 51.29 | 48.41 | 41.35 | 64.15 | 14.89 | 7.64 | ||
| Indonesia | 36 | ROAE_LEAD1 | 21.81 | 22.54 | 7.39 | 36.44 | 33.88 | 7.39 |
| CEO SAB | 49.44 | 33.00 | −1.00 | 160.00 | 97.38 | 48.15 | ||
| MD&A SAB | 55.28 | 7.50 | −86.00 | 360.00 | 182.63 | 100.95 | ||
| Total Assets | 37,175.34 | 38,368.90 | 9492.49 | 68,826.61 | 51.07 | 18,986.62 | ||
| Assets Growth | 8.01 | 8.38 | −15.63 | 33.35 | 148.74 | 11.92 | ||
| NPL/GLoans | 2.90 | 2.97 | 0.01 | 8.64 | 68.02 | 1.97 | ||
| Tier1Capital | 14.58 | 14.53 | 10.11 | 18.40 | 14.52 | 2.12 | ||
| Loans/Assets | 60.76 | 63.18 | 38.44 | 74.55 | 14.84 | 9.02 | ||
| Interest Spread | 5.26 | 5.39 | 3.85 | 6.24 | 13.85 | 0.73 | ||
| GDP Growth | 5.64 | 6.01 | 4.63 | 6.35 | 11.28 | 0.64 | ||
| Exchange Rate | 10,243.69 | 9698.96 | 8770.43 | 13,389.41 | 14.13 | 7.81 | ||
| Korea | 9 | ROAE_LEAD1 | 10.28 | 10.93 | 7.13 | 16.77 | 28.54 | 2.94 |
| CEO SAB | 30.89 | 27.00 | 8.00 | 48.00 | 42.26 | 13.05 | ||
| MD&A SAB | 272.00 | 284.00 | 3.00 | 566.00 | 72.98 | 198.51 | ||
| Total Assets | 262,576.90 | 250,079.69 | 221,996.06 | 316,025.25 | 14.25 | 7424.60 | ||
| Assets Growth | 3.69 | 4.08 | −3.30 | 11.01 | 107.78 | 3.97 | ||
| NPL/GLoans | 1.34 | 1.33 | 0.77 | 1.76 | 25.62 | 0.34 | ||
| Tier1Capital | 9.43 | 8.56 | 8.21 | 11.40 | 15.07 | 1.42 | ||
| Loans/Assets | 66.95 | 66.88 | 65.78 | 68.04 | 0.97 | 0.65 | ||
| Interest Spread | 2.97 | 2.60 | 2.00 | 5.00 | 36.11 | 1.07 | ||
| GDP Growth | 3.37 | 2.90 | 0.71 | 6.50 | 50.98 | 1.72 | ||
| Exchange Rate | 0.28 | 0.28 | 0.27 | 0.30 | 3.06 | 0.01 | ||
| Malaysia | 45 | ROAE_LEAD1 | 14.35 | 14.46 | 7.26 | 23.29 | 21.31 | 8.97 |
| CEO SAB | 76.73 | 73.00 | 10.00 | 155.00 | 47.57 | 36.50 | ||
| MD&A SAB | 330.82 | 213.00 | 2.00 | 1128.00 | 84.61 | 279.91 | ||
| Total Assets | 131,320.86 | 105,154.00 | 23,156.10 | 489,782.86 | 87.28 | 114,615.41 | ||
| Assets Growth | 7.49 | 8.29 | −12.80 | 35.21 | 118.19 | 8.86 | ||
| NPL/GLoans | 2.99 | 2.82 | 0.83 | 8.84 | 53.39 | 1.60 | ||
| Tier1Capital | 9.46 | 8.90 | 5.11 | 14.47 | 25.54 | 2.42 | ||
| Loans/Assets | 52.40 | 62.19 | 16.21 | 68.70 | 33.20 | 17.40 | ||
| Interest Spread | 2.24 | 2.00 | 1.45 | 3.24 | 29.63 | 0.66 | ||
| GDP Growth | 4.85 | 5.29 | −2.53 | 9.43 | 63.84 | 3.09 | ||
| Exchange Rate | 3.33 | 3.27 | 3.06 | 3.91 | 7.59 | 0.25 | ||
| Nepal | 9 | ROAE_Lead1 | 21.07 | 22.13 | 5.18 | 26.49 | 20.76 | 4.37 |
| CEO SAB | 15.22 | 11.00 | 7 | 47.00 | 105.20 | 16.01 | ||
| MD&A SAB | 25.56 | 17.00 | 8.00 | 74.00 | 83.84 | 21.42 | ||
| Total Assets | 19.99 | 7.78 | 494.33 | 818.68 | 17.47 | 108.29 | ||
| Assets Growth | 35 | 9.30 | −6.06 | 23.29 | 130.47 | 9.59 | ||
| NPL/GLoans | .79 | 2.89 | 1.74 | .65 | 26.91 | 0.75 | ||
| Tier1Capital | 9.14 | 9.03 | 8.68 | 9.64 | 3.89 | 0.36 | ||
| Loans/Assets | 63.99 | 6.16 | 53.09 | 70.54 | 9.11 | 5.83 | ||
| Interest Spread | 6.58 | 7.00 | 4.38 | 8.00 | 20.14 | 1.33 | ||
| GDP Growth | 4.43 | 4.53 | 2.73 | 6.10 | 25.89 | 1.15 | ||
| Exchange Rate | 13 | 77.57 | 66.42 | 102.41 | 15.77 | 12.95 | ||
| Pakistan | 54 | ROAE_Lead1 | 16.00 | 17.69 | −7.80 | 27.32 | 47.49 | 7.60 |
| CEO SAB | 23.52 | 15.00 | −94.00 | 120.00 | 175.78 | 41.34 | ||
| MD&A SAB | 27.81 | 14.00 | −54.00 | 275.00 | 204.05 | 56.76 | ||
| Total Assets | 7404.19 | 6655.89 | 2605.97 | 16,324.48 | 46.45 | 3438.88 | ||
| Assets Growth | 5.36 | 7.86 | −22.32 | 22.67 | 213.15 | 11.43 | ||
| NPL/GLoans | 9.62 | 8.64 | 2.68 | 18.47 | 39.48 | 3.80 | ||
| Tier1Capital | 12.70 | 11.91 | 5.91 | 21.01 | 34.77 | 4.42 | ||
| Loans/Assets | 48.92 | 49.81 | 32.69 | 72.65 | 19.34 | 9.46 | ||
| Interest Spread | 6.18 | 5.81 | 4.30 | .30 | 22.08 | 1.36 | ||
| GDP Growth | 3.45 | 3.51 | 1.61 | 4.83 | 35.49 | 1.22 | ||
| Exchange Rate | 87.03 | 86.34 | 60.74 | 102.77 | 15.94 | 13.87 | ||
| Philippines | 36 | ROAE_Lead1 | 1.34 | 11.90 | 3.76 | 18.72 | 32.19 | 3.65 |
| CEO SAB | 37.44 | 34.50 | −10.00 | 98.00 | 69.98 | 26.20 | ||
| MD&A SAB | 77.00 | 72.50 | −35.00 | 269.00 | 84.63 | 65.16 | ||
| Total Assets | 13,040.79 | 9076.78 | 4243.65 | 43,066.06 | 79.86 | 10,414.92 | ||
| Assets Growth | 11.11 | 9.78 | −2.23 | 42.09 | 76.53 | 8.50 | ||
| NPL/GLoans | 5.09 | 4.97 | 1.21 | 16.06 | 64.77 | 3.30 | ||
| Tier1Capital | 13.23 | 12.92 | 8.31 | 17.43 | 16.64 | 2.20 | ||
| Loans/Assets | 49.34 | 49.85 | 26.82 | 62.98 | 19.16 | 9.45 | ||
| Interest Spread | 4.19 | 4.26 | 2.52 | 5.83 | 21.47 | 0.90 | ||
| GDP Growth | 5.45 | 6.22 | 1.15 | 7.63 | 36.37 | 1.98 | ||
| Exchange Rate | 44.57 | 44.40 | 42.23 | 47.68 | 3.79 | 1.69 | ||
| Singapore | 27 | ROAE_Lead1 | 11.57 | 11.59 | 6.72 | 15.76 | 16 | 1.85 |
| CEO SAB | 109.44 | 105 | 15 | 181 | 33.36 | 36.51 | ||
| MD&A SAB | 214.52 | 208 | −1 | 568 | 64.3 | 137.93 | ||
| Total Assets | 2,13,055.8 | 2,13,544.7 | 1,21,154.1 | 3,33,509.4 | 31.28 | 66,637.83 | ||
| Assets Growth | 9.22 | 9.18 | −10.03 | 22.26 | 83.98 | 7.74 | ||
| NPL/GLoans | 1.37 | 1.33 | 0.61 | 2.91 | 38.12 | 0.52 | ||
| Tier1Capital | 13.55 | 13.8 | 8.86 | 16.6 | 14.12 | 1.91 | ||
| Loans/Assets | 54.64 | 54.06 | 41.68 | 65.62 | 13.06 | 7.13 | ||
| Interest Spread | 5.12 | 5.18 | 4.8 | 5.24 | 2.81 | 0.14 | ||
| GDP Growth | 5.04 | 3.67 | −0.6 | 15.24 | 90.08 | 4.54 | ||
| Exchange Rate | 1.35 | 1.36 | 1.25 | 1.51 | 6.86 | 0.09 | ||
| Sri Lanka | 54 | ROAE_Lead1 | 16.16 | 16.12 | 2.75 | 41.02 | 36.19 | 5.85 |
| CEO SAB | 55.35 | 45.5 | 0 | 145 | 70.09 | 38.8 | ||
| MD&A SAB | 81.07 | 46 | −30 | 396 | 129.44 | 104.94 | ||
| Total Assets | 2072.02 | 1639.06 | 142.81 | 6123.62 | 74.18 | 1537.06 | ||
| Assets Growth | 12.84 | 12.66 | −0.92 | 32.93 | 58.96 | 7.57 | ||
| NPL/GLoans | 5.23 | 4.44 | 1.2 | 21.89 | 73.33 | 3.83 | ||
| Tier1Capital | 13.87 | 12.91 | 7.23 | 26.7 | 33.02 | 4.58 | ||
| Loans/Assets | 66.19 | 67.28 | 51.4 | 78.3 | 8.84 | 5.85 | ||
| Interest Spread | 3.31 | 3.11 | 0.15 | 7.54 | 73.41 | 2.43 | ||
| GDP Growth | 6.1 | 5.95 | 3.4 | 9.14 | 32.98 | 2.01 | ||
| Exchange Rate | 120.07 | 114.94 | 108.33 | 135.86 | 8.36 | 10.04 | ||
| Thailand | 54 | ROAE_Lead1 | 12.72 | 12.31 | 1.15 | 21.73 | 33.14 | 4.22 |
| CEO SAB | 11.81 | 8.5 | −7 | 48 | 122.12 | 14.43 | ||
| MD&A SAB | 22.8 | 0 | −82 | 251 | 322.22 | 73.45 | ||
| Total Assets | 39,542.5 | 33,997.39 | 2586.96 | 84,614.34 | 67.76 | 26,794.25 | ||
| Assets Growth | 7.91 | 5.83 | −13.05 | 52.85 | 151.74 | 12 | ||
| NPL/GLoans | 5.48 | 4.5 | 2.3 | 16.64 | 61.28 | 3.36 | ||
| Tier1Capital | 11.8 | 11.25 | 7.5 | 15.83 | 17.91 | 2.11 | ||
| Loans/Assets | 69.94 | 70.07 | 55.33 | 79.14 | 6.65 | 4.65 | ||
| Interest Spread | 4.62 | 4.64 | 4.08 | 5.15 | 7.6 | 0.35 | ||
| GDP Growth | 3.15 | 2.7 | −0.74 | 7.51 | 88.83 | 2.8 | ||
| Exchange Rate | 32.54 | 32.48 | 30.49 | 34.52 | 4.72 | 1.54 | ||
| Turkey | 54 | ROAE_LEAD1 | 14.46 | 14.95 | −2.92 | 26.53 | 39.94 | 5.77 |
| CEO SAB | 42.24 | 33 | 4 | 134 | 73.43 | 31.02 | ||
| MD&A SAB | −9.85 | −6 | −130 | 82 | −407.5 | 40.15 | ||
| Total Assets | 56,503.58 | 67,250.35 | 2253.28 | 1,17,689.8 | 69.99 | 39,547.92 | ||
| Assets Growth | 8.32 | 5.1 | −8.62 | 45.14 | 148.34 | 12.34 | ||
| NPL/GLoans | 3.53 | 3.4 | 1.17 | 7.31 | 40.37 | 1.43 | ||
| Tier1Capital | 13.5 | 12.9 | 9.52 | 19.89 | 17.56 | 2.37 | ||
| Loans/Assets | 62.6 | 63.12 | 43.57 | 78.95 | 13.9 | 8.7 | ||
| Interest Spread | 6.42 | 6.2 | 5 | 8.3 | 15.29 | 0.98 | ||
| GDP Growth | 3.53 | 3.97 | −4.83 | 9.16 | 113.46 | 4 | ||
| Exchange Rate | 1.77 | 1.67 | 1.3 | 2.72 | 24.56 | 0.43 |
Appendix C. Principal Component Analysis for Clustering
| Variables | Standardized Scoring Coefficients | |||
| Factor 1 | Factor 2 | Factor 3 | Factor 4 | |
| GDP Growth | 0.29403 | 0.01737 | −0.04448 | 0.00861 |
| Assets Growth | 0.22054 | −0.08433 | 0.00653 | −0.08169 |
| Total Assets | 0.17464 | −0.00418 | −0.13046 | −0.04752 |
| ROAE | 0.22968 | −0.14158 | 0.31266 | −0.13597 |
| NPL/Gross Loans | −0.28315 | −0.10349 | −0.08393 | −0.09274 |
| CEO SAB | −0.02437 | 0.33124 | 0.04707 | −0.01532 |
| MD&A SAB | 0.00450 | 0.36246 | −0.07034 | 0.08208 |
| Exchange Rate | 0.01936 | 0.00823 | 0.34408 | 0.02595 |
| Tier1Captial | −0.07521 | 0.00212 | 0.19086 | 0.01110 |
| Loans/Assets | −0.04309 | −0.03043 | 0.05416 | 0.30824 |
| Interest Rate Spread | −0.03976 | −0.16266 | 0.06292 | −0.29118 |
Appendix D. Fixed Effects and Random Effects Models
| Variable | Model 1 | Model 2 |
| Fixed Effects | Random Effects | |
| ROAE | 0.233 | 0.4315 *** |
| (0.046) | (0.0409) | |
| CEO SAB | −0.0054 | −0.0443 |
| (0.0479) | (0.0412) | |
| MD&A SAB | 0.0546 | −0.0021 |
| (0.0502) | (0.0425) | |
| Assets (log) | −0.9233 *** | −0.0918 |
| (0.2041) | (0.0588) | |
| Assets Growth (%) | 0.0678 ** | 0.0650 * |
| (0.0341) | (0.0337) | |
| NPL/Gross Loans (%) | −0.1420 ** | −0.0670 |
| (0.0623) | (0.0484) | |
| Tier1Capital (%) | −0.0858 ** | −0.1405 *** |
| (0.0529) | (0.0415) | |
| Loans/Assets (%) | −0.0937 | −0.1198 * |
| (0.069) | (0.0472) | |
| Interest Rate Spread (%) | 0.0244 | 0.0497 |
| (0.0846) | (0.0494) | |
| GDP Growth (%) | −0.0454 | −0.0059 |
| (0.036) | (0.0352) | |
| Exchange Rate (%) | −0.4464 ** | 0.1550 *** |
| (0.2003) | (0.0551) | |
| Fit Statistics | ||
| Cross Sections | 58 | 58 |
| Time Series Length | 9 | 9 |
| MSE | 0.3939 | 0.4231 |
| Root MSE | 0.6276 | 0.6504 |
| R-Square | 0.6575 | 0.2974 |
| Diagnostics Tests | ||
| F-Test for Fixed Effects (p > F) | 3.32 | |
| (0.001) | ||
| Hausman Test for Random Effects (p > m) | 114.66 | |
| (0.001) | ||
| Variance Component for Cross Sections | 0.11634 | |
| Variance Component for Error | 0.393914 |
***/**/* means significance at 0.01, 0.05, and 0.10 level, respectively. Return on average equity (ROAE) is the dependent variable. Standard error in Parenthesis.
References
- Abdallah, Wissam, Marc Goergen, and Noel O’Sullivan. 2015. Endogeneity: How Failure to Correct for It Can Cause Wrong Inferences and Some Remedies. British Journal of Management 26: 791–804. [Google Scholar] [CrossRef]
- Adam, Tim R., Chitru S. Fernando, and Evgenia Golubeva. 2015. Managerial Overconfidence and Corporate Risk Management. Journal of Banking and Finance 60: 195–208. [Google Scholar] [CrossRef]
- Aerts, Walter. 1994. On the Use of Accounting Logic as an Explanatory Category in Narrative Accounting Disclosures. Accounting, Organizations and Society 19: 337–53. [Google Scholar] [CrossRef]
- Aerts, Walter. 2001. Inertia in the Attributional Content of Annual Accounting Narratives. European Accounting Review 10: 3–32. [Google Scholar] [CrossRef]
- Aerts, Walter. 2005. Picking up the Pieces: Impression Management in the Retrospective Attributional Farming of Accounting Outcomes. Accounting, Organizations and Society 30: 493–517. [Google Scholar] [CrossRef]
- Ahamed, M. Mostak. 2017. Asset Quality, Non-Interest Income, and Bank Profitability: Evidence from Indian Banks. Economic Modelling 63: 1–14. [Google Scholar] [CrossRef]
- Akhisar, İlyas, K. Batu Tunay, and Necla Tunay. 2015. The Effects of Innovations on Bank Performance: The Case of Electronic Banking Services. Procedia—Social and Behavioral Sciences 195: 369–75. [Google Scholar] [CrossRef]
- Allen, Franklin, and Elena Carletti. 2012. The Roles of Banks in Financial Systems: The Oxford Handbook of Banking. Oxford: Oxford University Press. [Google Scholar]
- Altman, Edward I. 1968. The Prediction of Corporate Bankruptcy: A Discriminant Analysis. The Journal of Finance 23: 193–94. [Google Scholar]
- Amernic, Joel, and Russell Craig. 2006. CEO Speak: The Language of Corporate Leadership. Montreal: McGill-Queen’s University Press. [Google Scholar]
- Arellano, Manuel, and Olympia Bover. 1995. Another Look at the Instrumental Variable Estimation of Error-Components Models. Journal of Econometrics 68: 29–51. [Google Scholar] [CrossRef]
- Asay, H. Scott, Robert Libby, and Kristina M. Rennekamp. 2018. Do Features That Associate Managers with a Message Magnify Investors’ Reactions to Narrative Disclosures? Accounting, Organizations and Society 68–69: 1–14. [Google Scholar] [CrossRef]
- Athanasoglou, Panayiotis P., Sophocles N. Brissimis, and Matthaios D. Delis. 2008. Bank-Specific, Industry-Specific and Macroeconomic Determinants of Bank Profitability. Journal of International Financial Markets, Institutions and Money 18: 121–36. [Google Scholar] [CrossRef]
- Baginski, Stephen P., John M. Hassell, and William A. Hillison. 2000. Voluntary Causal Disclosures: Tendencies and Capital Market Reaction. Review of Quantitative Finance and Accounting 15: 371–89. [Google Scholar] [CrossRef]
- Baum, Christopher F., Mark E. Schaffer, and Steven Stillman. 2003. Instrumental Variables and GMM: Estimation and Testing. The Stata Journal 3: 1–31. [Google Scholar] [CrossRef]
- Beattie, Vivien. 2014. Accounting Narratives and the Narrative Turn in Accounting Research: Issues, Theory, Methodology, Methods and a Research Framework. The British Accounting Review 46: 111–34. [Google Scholar] [CrossRef]
- Beaver, William H. 1966. Financial Ratios as Predictors of Failure. Journal of Accounting Research 4: 71–111. [Google Scholar] [CrossRef]
- Beccalli, Elena, Mario Anolli, and Giuliana Borello. 2015. Are European Banks Too Big? Evidence on Economies of Scale. Journal of Banking & Finance 58: 232–46. [Google Scholar] [CrossRef]
- Billett, Matthew T., and Yiming Qian. 2008. Are Overconfident CEOs Born or Made? Evidence of Self- Attribution Bias from Frequent Acquirers. Management Science 54: 1037–51. [Google Scholar] [CrossRef]
- Bloomfield, Robert. 2008. Discussion of ‘Annual Report Readability, Current Earnings, and Earnings Persistence’. Journal of Accounting and Economics 45: 248–52. [Google Scholar] [CrossRef]
- Blundell, Richard, and Stephen Bond. 1998. Initial Conditions and Moment Restrictions in Dynamic Panel Data Models. Journal of Econometrics 87: 115–43. [Google Scholar] [CrossRef]
- Board, John, Charles Sutcliffe, and William T. Ziemba. 2003. Applying Operations Research Techniques to Financial Markets. Interfaces 33: 12–24. [Google Scholar] [CrossRef]
- Bougatef, Khemaies. 2017. Determinants of Bank Profitability in Tunisia: Does Corruption Matter? Journal of Money Laundering Control 20: 70–78. [Google Scholar] [CrossRef]
- Canbas, Serpil, Altan Cabuk, and Suleyman Bilgin Kilic. 2005. Prediction of Commercial Bank Failure via Multivariate Statistical Analysis of Financial Structures: The Turkish Case. European Journal of Operational Research 166: 528–46. [Google Scholar] [CrossRef]
- Chen, Wei, Jun Han, and Hun Tong Tan. 2016. Investor Reactions to Management Earnings Guidance Attributions: The Effects of News Valence, Attribution Locus, and Outcome Controllability. Accounting, Organizations and Society 55: 83–95. [Google Scholar] [CrossRef]
- Clarke, Robert L. 1988. Bank Failure: An Evaluation of the Factors Contributing to the Failure of National Banks; Washington, DC: Comptroller of the Currency, Administrator of National Banks.
- Clatworthy, Mark, and Michael John Jones. 2003. Financial Reporting of Good and Bad News: Evidence from Accounting Narratives. Accounting and Business Research 33: 171–85. [Google Scholar] [CrossRef]
- Craig, Russell, Tony Mortensen, and Shefali Iyer. 2013. Exploring Top Management Language for Signals of Possible Deception: The Words of Satyam’s Chair Ramalinga Raju. Journal of Business Ethics 113: 333–47. [Google Scholar] [CrossRef]
- Daniel, Kent D., David Hirshleifer, and Avanidhar Subrahmanyam. 2001. Overconfidence, Arbitrage, and Equilibrium Asset Pricing. The Journal of Finance 56: 921–65. [Google Scholar] [CrossRef]
- Davis, Angela K., Jeremy M. Piger, and Lisa M. Sedor. 2012. Beyond the Numbers: Measuring the Information Content of Earnings Press Release Language. Contemporary Accounting Research 29: 845–68. [Google Scholar] [CrossRef]
- De Haan, Jakob, and Razvan Vlahu. 2016. Corporate Governance of Banks: A Survey. Journal of Economic Surveys 30: 228–77. [Google Scholar] [CrossRef]
- Demirgüç-Kunt, Ash, and Harry Huizinga. 1999. Determinants of Commercial Bank Interest Margins and Profitability: Some International Evidence. The World Bank Economic Review 13: 379–408. [Google Scholar] [CrossRef]
- Demirgüç-kunt, Asli, Erik Feyen, and Ross Levine. 2012. The Evolving Importance of Banks and Securities Markets. National Bureau of Economic Research Working Paper Series 18004; Cambridge: National Bureau of Economic Research. [Google Scholar]
- Djalilov, Khurshid, and Jenifer Piesse. 2016. Determinants of Bank Profitability in Transition Countries: What Matters Most? Research in International Business and Finance 38: 69–82. [Google Scholar] [CrossRef]
- Edey, Malcolm. 2009. The Global Financial Crisis and Its Effects. Economic Papers 28: 186–95. [Google Scholar] [CrossRef]
- European Central Bank. 2010. Beyond ROE—How to Measure Bank Performance. Frankfurt: European Central Bank. [Google Scholar]
- Fethi, Duygun Meryem, and Fotios Pasiouras. 2010. Assessing Bank Efficiency and Performance with Operational Research and Artificial Intelligence Techniques: A Survey. European Journal of Operational Research 204: 189–98. [Google Scholar] [CrossRef]
- Fink, Gerhard, Peter Haiss, and Mantler Hans Christian. 2005. The Finance-Growth Nexus: Market Economies vs. Trasition Countries. EI Working Papers/Europainstitut, 64. Vienna: Europainstitut, WU Vienna University of Economics and Business. [Google Scholar]
- Gaganis, Chrysovalantis, Fotios Pasiouras, and Constantin Zopounidis. 2006. A Multicriteria Decision Framework for Measuring Banks’ Soundness around the World. Journal of Multi-Criteria Decision Analysis 14: 103–11. [Google Scholar] [CrossRef]
- Gandhi, Priyank, Tim Loughran, and Bill McDonald. 2019. Using Annual Report Sentiment as a Proxy for Financial Distress in U.S. Banks. Journal of Behavioral Finance 7560: 1–13. [Google Scholar] [CrossRef]
- Gervais, Simon, and Terrance Odean. 2001. Learning to Be Overconfident. The Review of Financial Studies 14: 1–27. [Google Scholar] [CrossRef]
- Goddard, John, Hong Liu, and Phil Molyneux. 2013. Do Bank Profits Converge? European Financial Management 19: 345–65. [Google Scholar] [CrossRef]
- Greene, William H. 1996. Econometric Analysis. New York: Pearson Education, Inc. [Google Scholar]
- Gutierrez, Roberto G., and A. Rachid El-khattabi. 2017. Using a Dynamic Panel Estimator to Model Change in Panel Data. SAS Paper Series; Cary: SAS Institute. [Google Scholar]
- Hooghiemstra, Roggy. 2001. Cultural Differences in Self-Serving Behaviour in Accounting Narratives. Paper present at the APIRA Conference 2001, Adelaide, Australia, July 15–17. [Google Scholar]
- Horváthová, Jarmila, and Martina Mokrišová. 2018. Risk of Bankruptcy, Its Determinants and Models. Risks 6: 117. [Google Scholar] [CrossRef]
- Hsu, Chung-Chian, Chin-Long Chen, and Yu-Wei Su. 2007. Hierarchical Clustering of Mixed Data Based on Distance Hierarchy. Information Sciences 177: 4474–92. [Google Scholar] [CrossRef]
- Jasevičienė, Filomena, Bronius Povilaitis, and Simona Vidzbelytė. 2013. Commercial Banks Performance 2008–2012. Business, Management and Education 11: 189–208. [Google Scholar] [CrossRef][Green Version]
- Keusch, Thomas, Laury H. H. Bollen, and Harold F. D. Hassink. 2012. Self-Serving Bias in Annual Report Narratives: An Empirical Analysis of the Impact of Economic Crises. European Accounting Review 21: 1–26. [Google Scholar] [CrossRef]
- Laeven, Luc, and Fabian Valencia. 2010. Resolution of Banking Crises: The Good, the Bad, and the Ugly. IMF Working Paper WP/10/146. Washington, DC: International Monetary Fund. [Google Scholar]
- Leary, Mark R., and Robin M. Kowalski. 1990. Impression Management: A Literature Review and Two-Component Model. Psychological Bulletin 107: 34–47. [Google Scholar] [CrossRef]
- Lehmberg, Derek, and Chanchai Tangpong. 2018. Do Top Management Performance Attribution Patterns Matter to Subsequent Organizational Outcomes? A Two-Country Study of Attribution in Economic Crisis. Journal of Management & Organization, 1–20. [Google Scholar] [CrossRef]
- Li, Feng. 2008. Annual Report Readability, Current Earnings, and Earnings Persistence. Journal of Accounting and Economics 45: 221–47. [Google Scholar] [CrossRef]
- Li, Feng. 2010a. Managers’ Self-Serving Attribution Bias and Corporate Financial Policies. SSRN. [Google Scholar] [CrossRef][Green Version]
- Li, Feng. 2010b. Textual Analysis of Corporate Disclosure: A Survey of Literature. Journal of Accounting Literature 29: 143–65. [Google Scholar]
- Libby, Robert, and Kristina Rennekamp. 2012. Self-Serving Attribution Bias, Overconfidence, and the Issuance of Management Forecasts. Journal of Accounting Research 50: 197–231. [Google Scholar] [CrossRef]
- Lin, Shih Wei, Yeou Ren Shiue, Shih Chi Chen, and Hui Miao Cheng. 2009. Applying Enhanced Data Mining Approaches in Predicting Bank Performance: A Case of Taiwanese Commercial Banks. Expert Systems with Applications 36: 11543–51. [Google Scholar] [CrossRef]
- Lipe, Robert. 1990. The Relation Between Stock Returns and Accounting Earnings Given Alternative Formation. The Accounting Review 65: 49–71. [Google Scholar]
- Loewenstein, Yaniv, Elon Portugaly, Menachem Fromer, and Michal Linial. 2008. Efficient Algorithms for Accurate Hierarchical Clustering of Huge Datasets: Tackling the Entire Protein Space. Bioinformatics 24: 41–49. [Google Scholar] [CrossRef]
- Malmendier, Ulrike, and Geoffrey Tate. 2008. Who Makes Acquisitions? CEO Overconfidence and the Market’s Reaction. Journal of Financial Economics 89: 20–43. [Google Scholar] [CrossRef]
- Mathuva, D. M. 2009. Capital Adequacy, Cost Income Ratio and the Performance of Commercial Banks: The Kenyan Scenario. The International Journal of Applied Economics & Finance 3: 35–47. [Google Scholar]
- Medura, Jeff. 2006. International Financial Management, 6th ed. Mason: Thomson South-Western. [Google Scholar]
- Merkl-davies, Doris M., Niamh M. Brennan, and Petros Vourvachis. 2014. Text Analysis Methodologies in Corporate Narrative Reporting Research. Paper presented at the 23rd CSEAR International Colloquium, St Andrews, UK, August 26–29. [Google Scholar]
- Moosa, Imad A., and Vikash Ramiah. 2017. Overconfidence and Self-Serving Bias. In The Financial Consequences of Behavioural Biases: An Analysis of Bias in Corporate Finance and Financial Planning. Basingstoke: Palgrave Macmillan, pp. 45–69. [Google Scholar] [CrossRef]
- Mushinada, Venkata Narasimha Chary, and Venkata Subrahmanya Sarma Veluri. 2018. Investors Overconfidence Behaviour at Bombay Stock Exchange. International Journal of Managerial Finance 14: 613–32. [Google Scholar] [CrossRef]
- Myatt, Glenn J., and Wayne P. Johnson. 2014. Making Sense of Data: A Practical Guide to Exploratory Data Analysis and Data Mining, 2nd ed. West Hoboken: John Wiley & Sons, Inc. [Google Scholar]
- Pagratis, Spyros, Eleni Karakatsani, and Helen Louri. 2014. Bank Leverage and Return on Equity Targeting: Intrinsic Procyclicality of Short-Term Choices; Athens: Bank of Greece, ISSN 1109-6691.
- Panta, Bishop. 2018. Non-Performing Loans & Bank Profitability: Study of Joint Venture Banks in Nepal. International Journal of Sciences: Basic and Applied Research 42: 151–65. [Google Scholar]
- Petrella, Giovanni, and Andrea Resti. 2013. Supervisors as Information Producers: Do Stress Tests Reduce Bank Opaqueness? Journal of Banking & Finance 37: 5406–20. [Google Scholar] [CrossRef]
- Petria, Nicolae, Bogdan Capraru, and Iulian Ihnatov. 2015. Determinants of Banks’ Profitability: Evidence from EU 27 Banking Systems. Procedia Economics and Finance 20: 518–24. [Google Scholar] [CrossRef]
- Ravi Kumar, P., and V. Ravi. 2007. Bankruptcy Prediction in Banks and Firms via Statistical and Intelligent Techniques—A Review. European Journal of Operational Research 180: 1–28. [Google Scholar] [CrossRef]
- Roberts, Michael R., and Toni M. Whited. 2012. Endogeneity in Empirical Corporate Finance. In Handbook of the Economics of Finance. Amsterdam: Elsevier, pp. 493–572. [Google Scholar] [CrossRef]
- Seamans, Michael A. 2013. When Gauging Bank Capital Adequacy, Simplicity Beats Complexity. Economic Letter 8: 1–4. [Google Scholar]
- Shehzad, C. T., J. De Haan, and B. Scholtens. 2013. The Relationship Between Size, Growth and Profitability of Commercial Banks. Applied Economics 45: 1751–65. [Google Scholar] [CrossRef]
- Smith, Malcolm, and Richard J. Taffler. 2000. The Chairman’s Statement—A Content Analysis of Discretionary Narrative Disclosures. Accounting, Auditing & Accountability Journal 13: 624–47. [Google Scholar] [CrossRef]
- Sparck Jones, Karen. 1972. A Statistical Interpretation of Term Specificity and Its Application in Retrieval. Journal of Documentation 28: 11–21. [Google Scholar] [CrossRef]
- Stovrag, Arijan. 2017. Capital Requirements and Bank Failure: A Comparison between the Large Swedish Banks and Niche Banks. Jönköping: Jönköping University. [Google Scholar]
- Terraza, Virginie. 2015. The Effect of Bank Size on Risk Ratios: Implications of Banks’ Performance. Procedia Economics and Finance 30: 903–9. [Google Scholar] [CrossRef]
- Tetlock, Paul C. 2007. Giving Content to Investor Sentiment: The Role of Media in the Stock Market. Journal of Finance 62: 1139–68. [Google Scholar] [CrossRef]
- Trujillo-Ponce, Antonio. 2013. What Determines the Profitability of Banks? Evidence from Spain. Accounting and Finance 53: 561–86. [Google Scholar] [CrossRef]
- White, Halbert. 1980. A Heteroskedasticity-Consistent Covariance Matrix Estimator and a Direct Test for Heteroskedasticity. The Economic Journal 48: 817–38. [Google Scholar] [CrossRef]
- Wu, Junjie, Hui Xiong, and Jian Chen. 2009. Towards Understanding Hierarchical Clustering: A Data Distribution Perspective. Neurocomputing 72: 2319–30. [Google Scholar] [CrossRef]
- Yao, Hongxing, Muhammad Haris, and Gulzara Tariq. 2018. Profitability Determinants of Financial Institutions: Evidence from Banks in Pakistan. International Journal of Financial Studies 6: 53. [Google Scholar] [CrossRef]
- You, Haifeng, and Xiao Jun Zhang. 2009. Financial Reporting Complexity and Investor Underreaction to 10-k Information. Review of Accounting Studies 14: 559–86. [Google Scholar] [CrossRef]
- Zheng, Changjun, Mohammed Rahman, Munni Begum, and Badar Ashraf. 2017. Capital Regulation, the Cost of Financial Intermediation and Bank Profitability: Evidence from Bangladesh. Journal of Risk and Financial Management 10: 9. [Google Scholar] [CrossRef]
| 1 | Attribution theory has been discussed in detail in literature review section. |
| 2 | Bureau van Dijk (BvD) is a Moody’s Analytics company that has database for business information. |
| 3 | Tier1capital consists of shareholders’ common equity and retained earnings. |
| 4 | Risk-weighted assets are calculated by adjusting category of asset class for risk to determine a bank’s real exposure to the potential losses. |
| 5 | Some countries use the term Directors’ reports to shareholders, or financial and operational review, instead of management discussions and analysis. |
| 6 | Features in a sense of variables, which is named in machine learning. |
| 7 | White Test for Heteroscedasticity, 182.6 (p < 0.01). |
| 8 | Hausman’s Specification test, OLS efficient under Ho, 2SLS Consistent under H1, 14.74 (p < 0.026). |
© 2019 by the author. Licensee MDPI, Basel, Switzerland. This article is an open access article distributed under the terms and conditions of the Creative Commons Attribution (CC BY) license (http://creativecommons.org/licenses/by/4.0/).