1. Introduction
Responding to the financial meltdown in 2008, the United States Federal Reserve (US Fed)—the US monetary authority—utilized unconventional monetary policies by purchasing trillions of long-term Treasury bonds and mortgage-backed securities (MBS). The aim of the Fed’s balance sheet enlargement and restructuring via quantitative easing (QE) and credit easing (CE) was to boost the US market-based economy, but these measures also resulted in exerting cash flow pressures on a non-negligible number of emerging countries.
Although effects on some African countries have been considered by recent studies (
Burns et al. 2014), the limited number of these countries under scrutiny and the lack of focusing on impactson other continents have restricted the estimation of the global impact of such unconventional monetary policies. To the best of our knowledge, until now, no study has investigated unconventional US monetary policy impacts on African and Middle Eastern countries to an adequate degree.
This paper fills this gap in the relevant literature by focusing on the causality impacts of the US Fed’s balance sheet enlargement and restructuring on six African and nine Middle Eastern economies by employing not only conventional, but also innovative Granger causality specifications. The majority of academic papers that have examined the spillover effects of the Fed’s unconventional practices on emerging markets (
Park et al. 2014;
Bouraoui 2015;
Tillmann 2016;
Kiendrebeogo 2016) have focused on Asian economies. The motivation of this study is to examine the spillover effects of US QE tapering on the economies of countries that have not yet been adequately investigated. Therefore, in this study, we test whether such trends are indeed a global phenomenon. The responses of the stock markets in Africa and the Middle East reveal whether the easing of monetary measures by the US Fed has a significant effect on the markets of regions that are not so tightly connected to the US economy. Thereby, we intend to detect the strength of the effect of actions by the US monetary authorities on stock markets in a global level.
For these reasons, our methodology is focused on discerning the degree to which US monetary policies can be influential in countries that are not closely related to its economy. For the purposes of estimation, powerful causality dynamics tests that can identify non-conventional causality apart from the common linear causal linkages should be adopted. The precision of significance in causality measurement is assured in our study by the non-linear character of the methodologies we employ. These methodologies permit us to detect the causality between the Fed’s actions and stock indices in emerging markets in cases where classical estimations would fail. Studies such as this could contribute to a better and deeper understanding of the global character of US monetary policy. Furthermore, in this paper, we cast light on the spillover dynamics that monetary practices in economies with sophisticated and advanced financial sectors exert on less developed markets. We focus on countries that have not been investigated frequently or in great depth in the literature. The lack of attention to African and Middle Eastern countries in the literature thus far has deprived policymakers and investors of useful information about decision-making and has led to a limited understanding about the impacts of well-developed economies on emerging economies.
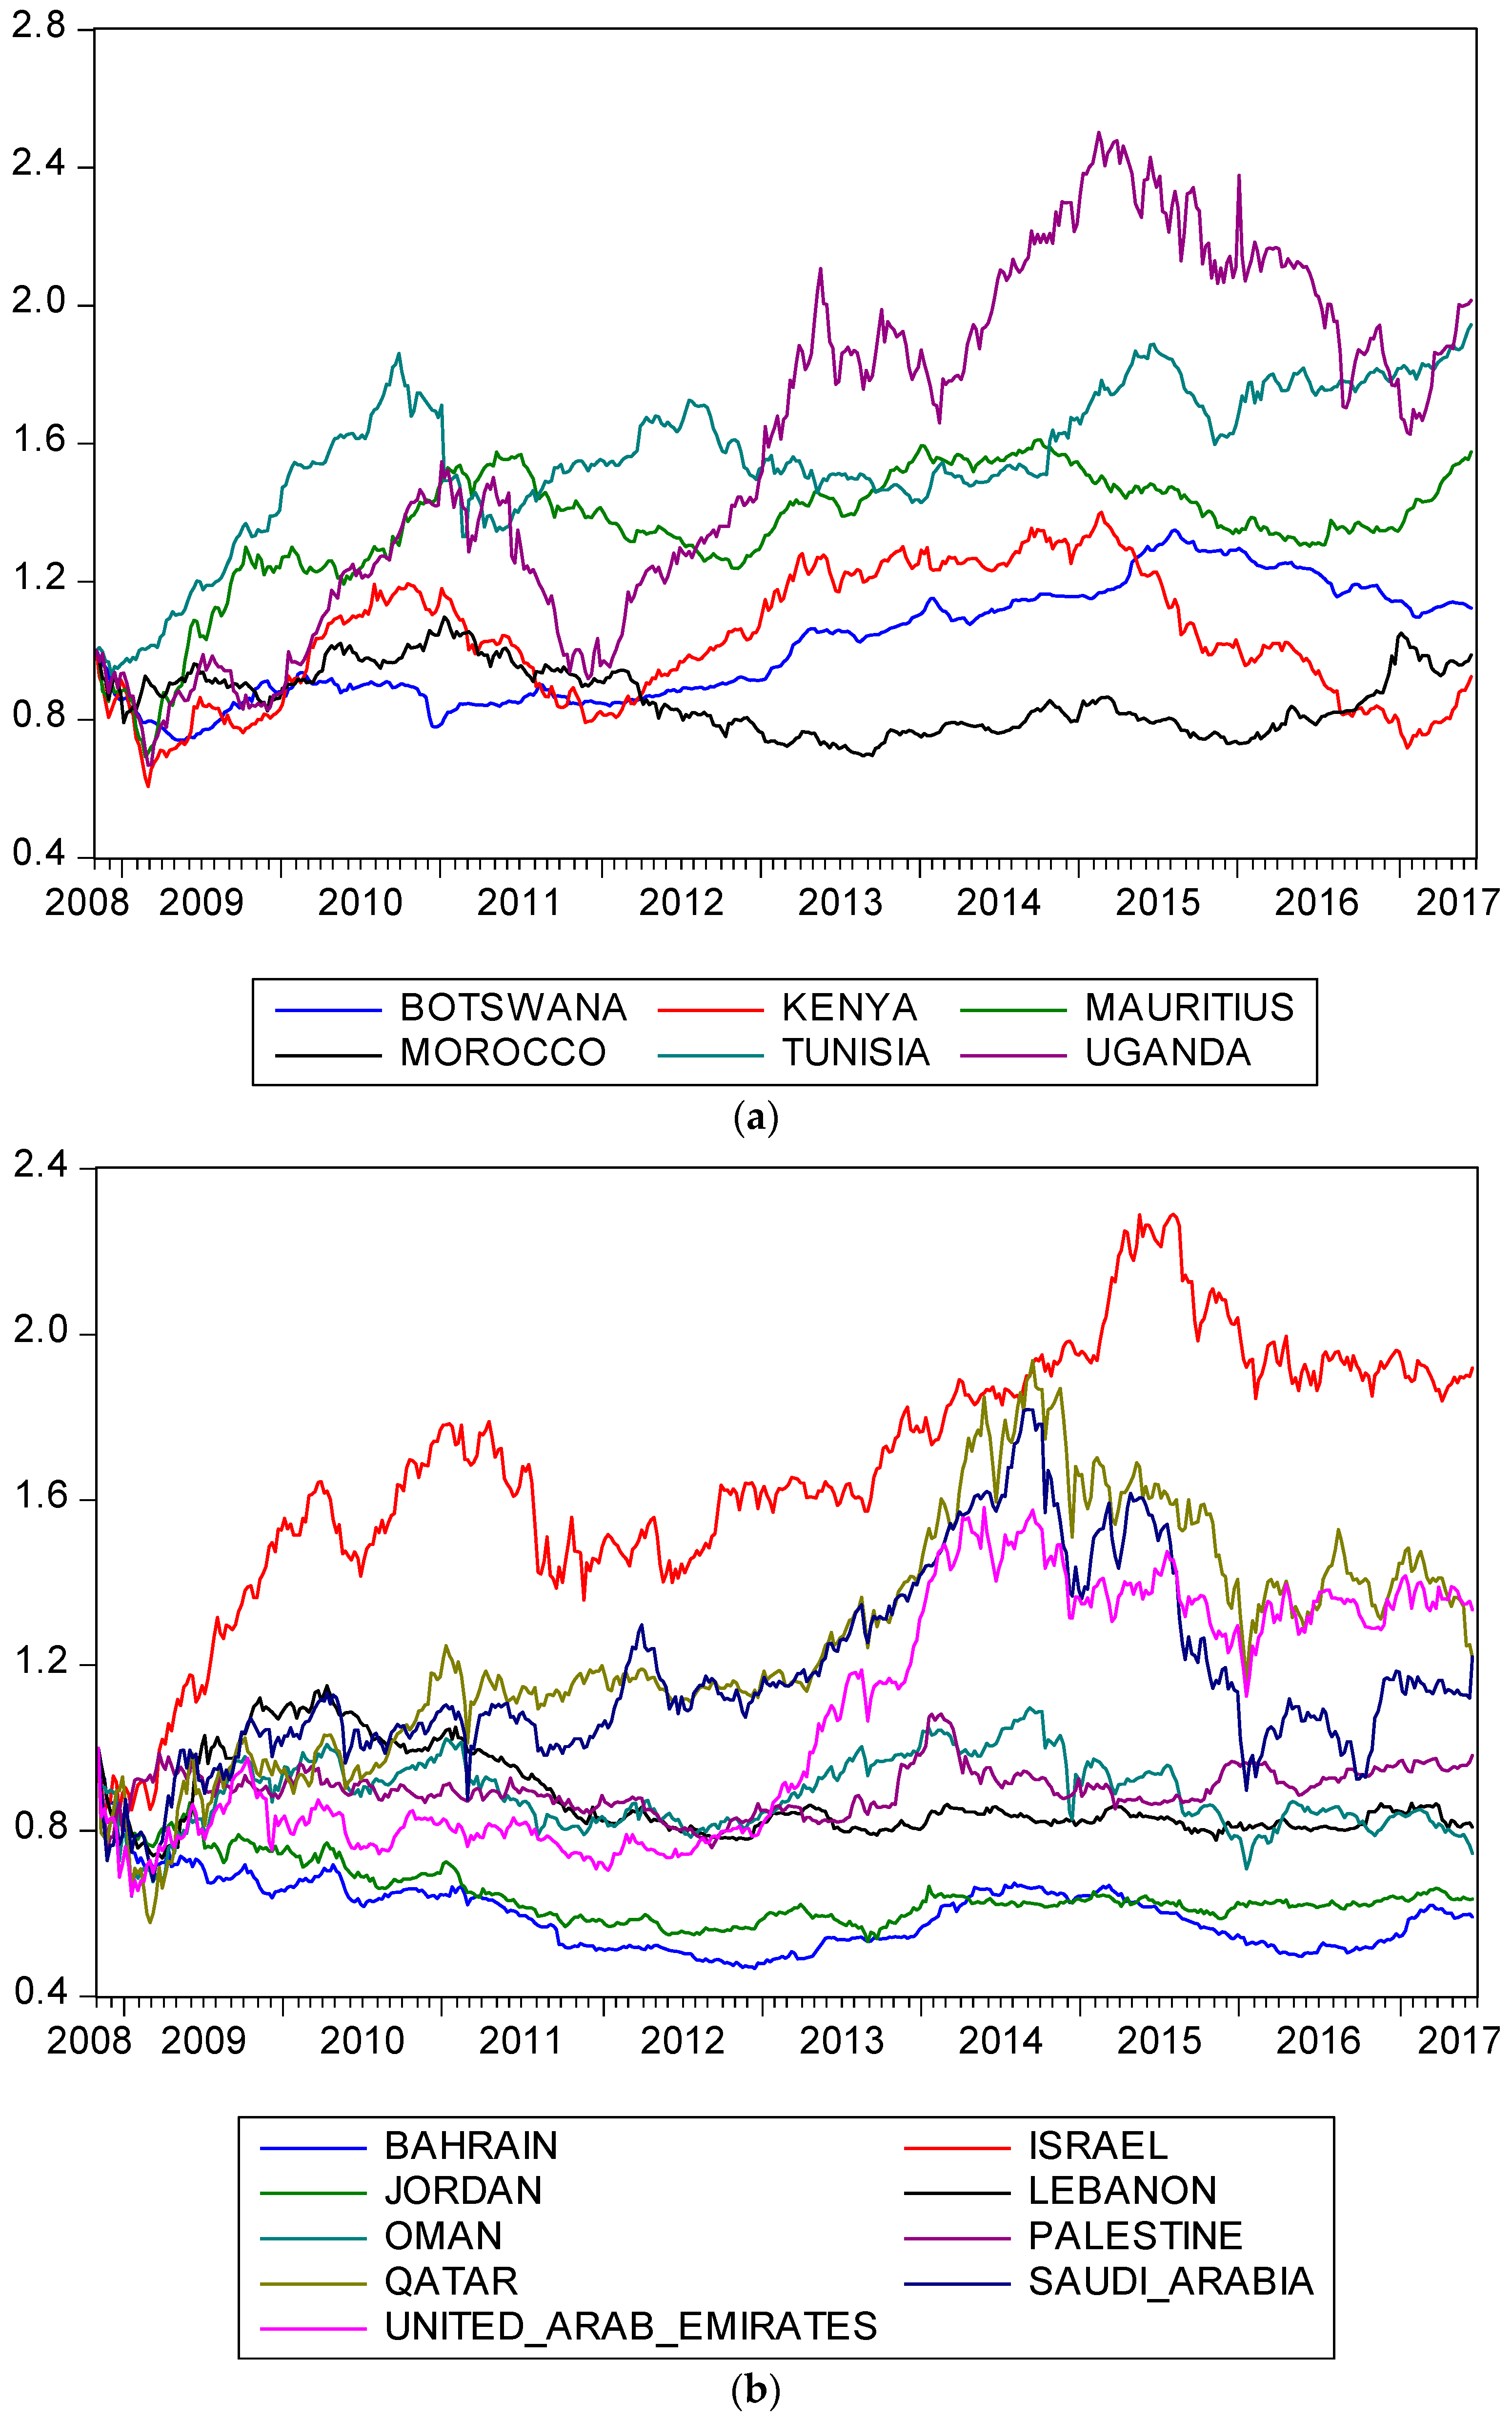
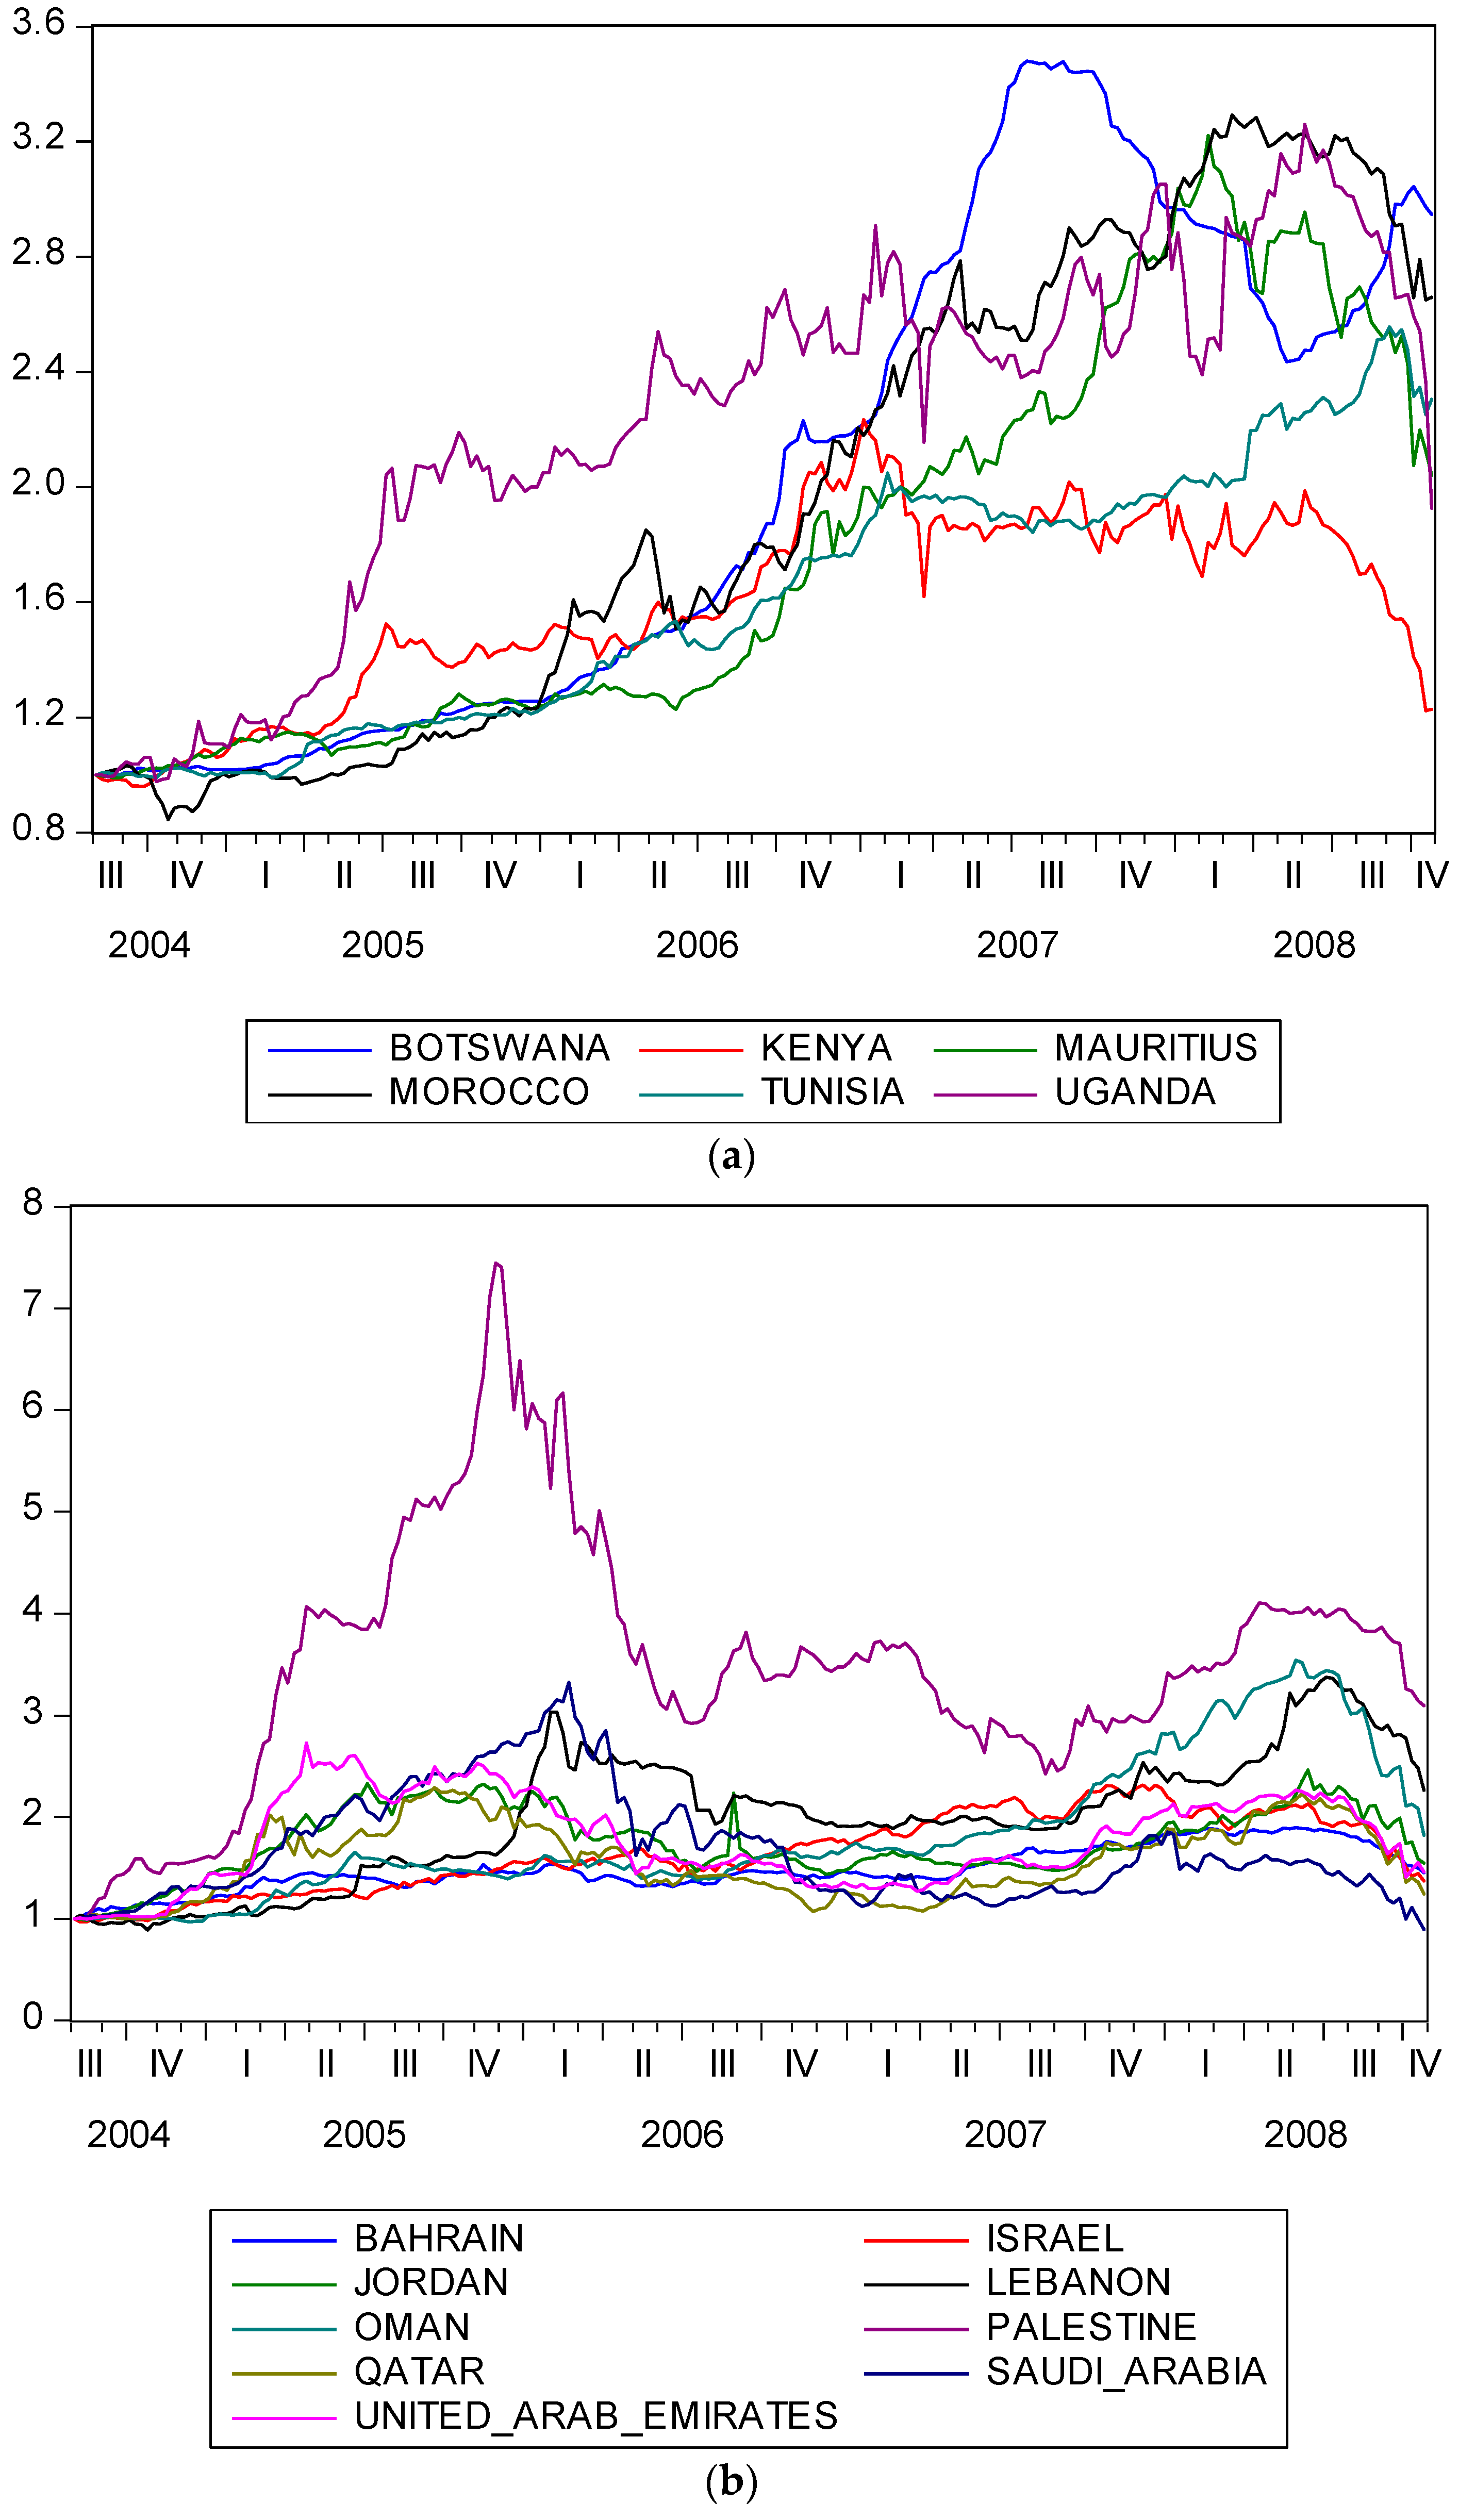
The African emerging economies and the corresponding indices considered in our paper are as follows: Botswana (BSE Domestic Company (DCIBT)), Kenya (Kenya NSE 20 (NSE20)), Mauritius (Semdex (MDEX)), Morocco (Moroccan All Shares (MASI)), Tunisia (Tunindex (TUNINDEX)), and Uganda (Uganda All Share (ALSIUG)). Furthermore, Bahrain (Bahrain All Share (BAX)), Israel (TA35), Jordan (Amman SE General (AMGNRLX)), Lebanon (BLOM Stock (BLSI)), Oman (MSM 30 (MSI)), Palestine (Al-Quds (PLE)), Qatar (QE General (QSI)), Saudi Arabia (Tadawul All Share (TASI)), and the United Arab Emirates (ADX General (ADI)) constitute the Middle Eastern countries examined.
In this paper, we utilized weekly data and examined five different time periods: the period before the implementation of the QE policy, the QE periods (QE1, QE2, and QE3), and the period after the end of the QE policy. We employed three different specifications of Granger causality tests in order to estimate whether unconventional US monetary practices have an effect on the returns of the stock indices of six African and nine Middle Eastern economies. By this manner, we assessed the strength of spillovers from policies exerted by the US, which is a country with an extremely powerful and sophisticated economy. The main finding from our study is that in the period before the implementation of the non-conventional US easing action taking, the US Fed’s monetary policies had a significantly higher effect on the majority of the economies investigated. Apart from that, some of the countries examined were found to have been significantly affected during one of the three unconventional policy periods or in the post-QE period, but smaller effects were detected overall during these subsequent periods. Interestingly, two African and three Middle Eastern economies were found to be affected by US monetary policies after the collapse of Lehman Brothers. Moreover, the outcomes on these countries were not similar based on the estimations of the different specifications used in our methodologies.
The remainder of this paper is structured as follows.
Section 2 provides a literature review with the main findings about the effects and spillover impacts of the Fed, the European Central Bank (ECB), and the Bank of England.
Section 3 introduces the data and methodology for estimation. In
Section 4, a thorough analysis of the empirical results and the relevant economic implications is presented. Finally,
Section 5 concludes the paper.
2. Literature Review
Up to now, most the of academic papers with interesting findings have provided empirical estimates about the effects of the Fed’s unconventional monetary practices on emerging markets.
Glick and Leduc (
2012) documented the large-scale asset purchases (LSAPs) by the Federal Reserve and the Bank of England that led to decreases in long-term interest rates and lower currency values of the US dollar and the British pound. Furthermore, declines in the values of commodities have mostly been detected during positive monetary shocks.
Moore et al. (
2013) revealed that lower yields in the US during non-conventional policy eras have occurred in tandem with lower falls in yields in emerging markets.
Chinn (
2013) revealed that higher volatility has emerged in worldwide markets due to the Fed’s QE. Moreover,
Fic (
2013) investigated the impact of QE announcements by advanced economies on emerging markets by employing event study methodologies. The evidence revealed that both advanced and developing markets have been affected by such QE policies. Medium impacts on yields and GDP have been traced in the United States, the United Kingdom, the European Union, and Japan. Lower effects have been detected in Brazil, Russia, India, and China.
Chen et al. (
2014) argue that the signaling channel significantly affects the yields of long-term bonds and that structural factors, such as asset purchases, are the main determinants of spillover impacts. Effects on asset prices and capital flows are important but tend to be significantly weaker in developing economies.
Berge and Cao (
2014) argue that emerging markets do not significantly differ from advanced ones when they react to US monetary shocks, except in the case that strong links between them and the US exist. In a somewhat similar vein,
Lavigne et al. (
2014) demonstrated that non-conventional monetary policies of advanced countries have exerted positive impacts on asset prices and currency values. They argue that this is mainly due to the spur in confidence that QE-adoption brings about in developing countries. They also argue that the signaling channel is of major importance for fighting uncertainty in markets and volatility in capital flows.
Park et al. (
2014) showed that the first round of large scale asset purchases (LSAP1) had an important impact on developing Asian economies, especially on issuing corporate bonds. Similarly, by employing a global vector error correction model (VECM),
Chen et al. (
2016) provide evidence that emerging economies have been recipients of greater impacts from unconventional US monetary policies than developed economies.
Kiendrebeogo (
2016) has also shown that the US Fed has exerted greater effects in terms of net portfolio flows on emerging economies than on developed economies. Furthermore,
Brana and Prat (
2016) demonstrated that excess capital flows affect stock prices in emerging markets in a positive direction.
Fratzscher et al. (
2017) revealed that non-conventional US monetary practices affected Emerging Market Economies (EMEs) only modestly. Furthermore,
Miyakoshi et al. (
2017) showed that unconventional monetary practices implemented by the US, the Euro Area and Japan positively and significantly affected equity prices in developing Asian countries. Moreover,
Gagnon et al. (
2017) provided evidence of higher equity quotes and lower currency values for foreign countries during periods of US extraordinary monetary policies.
Fassas and Papadamou (
2018) studied the risk-taking channel of monetary policy in the major European and U.S. equity markets. To be more precise, they focused on the impact of non-conventional monetary policy news on market uncertainty and risk perception. They showed that easing monetary policies could significantly lower the variance premium. By employing a Bayesian panel-VAR framework,
Bhattarai et al. (
2018) provided evidence that an expansionary US QE shock exerted significant influence on financial variables in developing countries. They argue that QE leads to higher currency values in emerging markets and lower long-term bond yields, higher stock prices, and larger capital inflows to these markets. Furthermore,
Feldkircher and Huber (
2018), by adopting a time-varying vector autoregression with stochastic volatility methodology, argue that leaving the US policy rate unchanged for a long time can lead to very high effectiveness of non-conventional practices on output. Moreover, a spread shock was found to significantly increase consumer wealth during the crisis but not later.
Papadamou et al. (
2018b) used a threshold cointegration approach and revealed a non-linear nexus between gilt and commercial banks’ yield responses to asset purchases by the Bank of England (BoE) in unconventional eras. They provided evidence that the momentum-threshold autoregression (M-TART) approach is preferable. Their estimations led to the conclusion that there was a uni-directional long-run causality from the BoE’s assets to government as well as commercial bank liability curves.
Wang (
2019) employed an Integrated-Generalized Autoregressive Conditional Heteroskedatsicity (I-GARCH) approach and examined 35 unconventional US events, and he provided evidence that news of larger mortgage-backed security purchases lowered the mortgage rate more than the Treasury rate and decreased the credit risk of holding mortgage securities over Treasury securities.
There have also been a significant number of academic papers focusing on the spillover effects of the ECB’s unconventional monetary practices on European countries that have not adopted the Euro. By employing event-study techniques,
Falagiarda et al. (
2015) found strong evidence of spillover impacts on the bond yields of the Czech Republic, Hungary, Poland, and Romania. Securities market purchases (SMPs) have been found to be more influential than outright monetary transactions (OMTs) and the public sector purchase program (PSPP). SMPs announcements mainly have an effect via the portfolio rebalancing and the signaling channels.
Ciarlone and Colabella (
2016) showed that spillovers from the ECB’s non-conventional policies have influenced central and south-eastern European countries, both in the short- and the long-term. Portfolio rebalancing and the liquidity channels have been the main drivers of long-term effects.
Georgiadis and Gräb (
2016) provided evidence that the ECB’s asset purchase program (APP) led to the depreciation of the Euro but increased stock prices and boosted investor confidence in the Euro Area. Moreover, they argue that APP resulted in the rebalancing of capital flows out of emerging markets into developed financial markets.
Potjagailo (
2017) adopted a factor augmented vector autoregressive (FAVAR) methodology and detected a positive impact of the ECB’s unconventional practices on GDP in 14 European countries outside the Euro Area. Furthermore, the impact on yields and uncertainty was negative. Spillovers are not of the same magnitude across countries, as they appear to be more intense in regions with higher trade openness.
Van Riet (
2017) argues that common policymaking by the 19 members of the Euro Area could have proven effective in terms of balance sheet improvement and faster economic recovery and could have achieved higher productivity growth after the launch of unconventional monetary policies by the ECB.
Kolasa and Wesołowski (
2018) developed a two-country model with asset market segmentation and showed that quantitative easing leads to higher domestic demand in small countries but weakens their competitive advantage and lowers output, at least in the short term. Furthermore,
Angelovska-Bezhoska et al. (
2018) conducted panel estimations about 14 central and south-eastern European countries for the 2003–2015 period. The empirical evidence revealed the existence of negative or insignificant impacts of the ECB’s unconventional monetary policy on capital inflows in these countries.
Bergant et al. (
2018) argue that the ECB’s APP triggered significant rebalancing effects during the first six quarters of the program. Nevertheless, large differences in impacts across sectors and country groups have been detected in the Euro Area.
3. Data and Methodology
This section describes the data and provides a detailed description of the methodology specifications adopted. The sample period ran from August 2004 to June 2017. The sample period was further divided into five subperiods in order to better capture the effects of the unconventional US monetary policies (i) before the implementation of the non-conventional practices, (ii) during each of the LSAPs rounds, and (iii) after the Fed’s extraordinarily easing measures ended. Thereby, the first subperiod ran from August 2004 to October 2008. LSAP1 (also known as QE1) is defined as the period from November 2008 to March 2010, QE2 ran from November 2010 to June 2011, and QE3 represents the period from September 2012 to October 2014. Furthermore, the post-QE period ran from November 2014 to June 2017. All data employed are expressed in weekly frequencies and derived from the Datastream database.
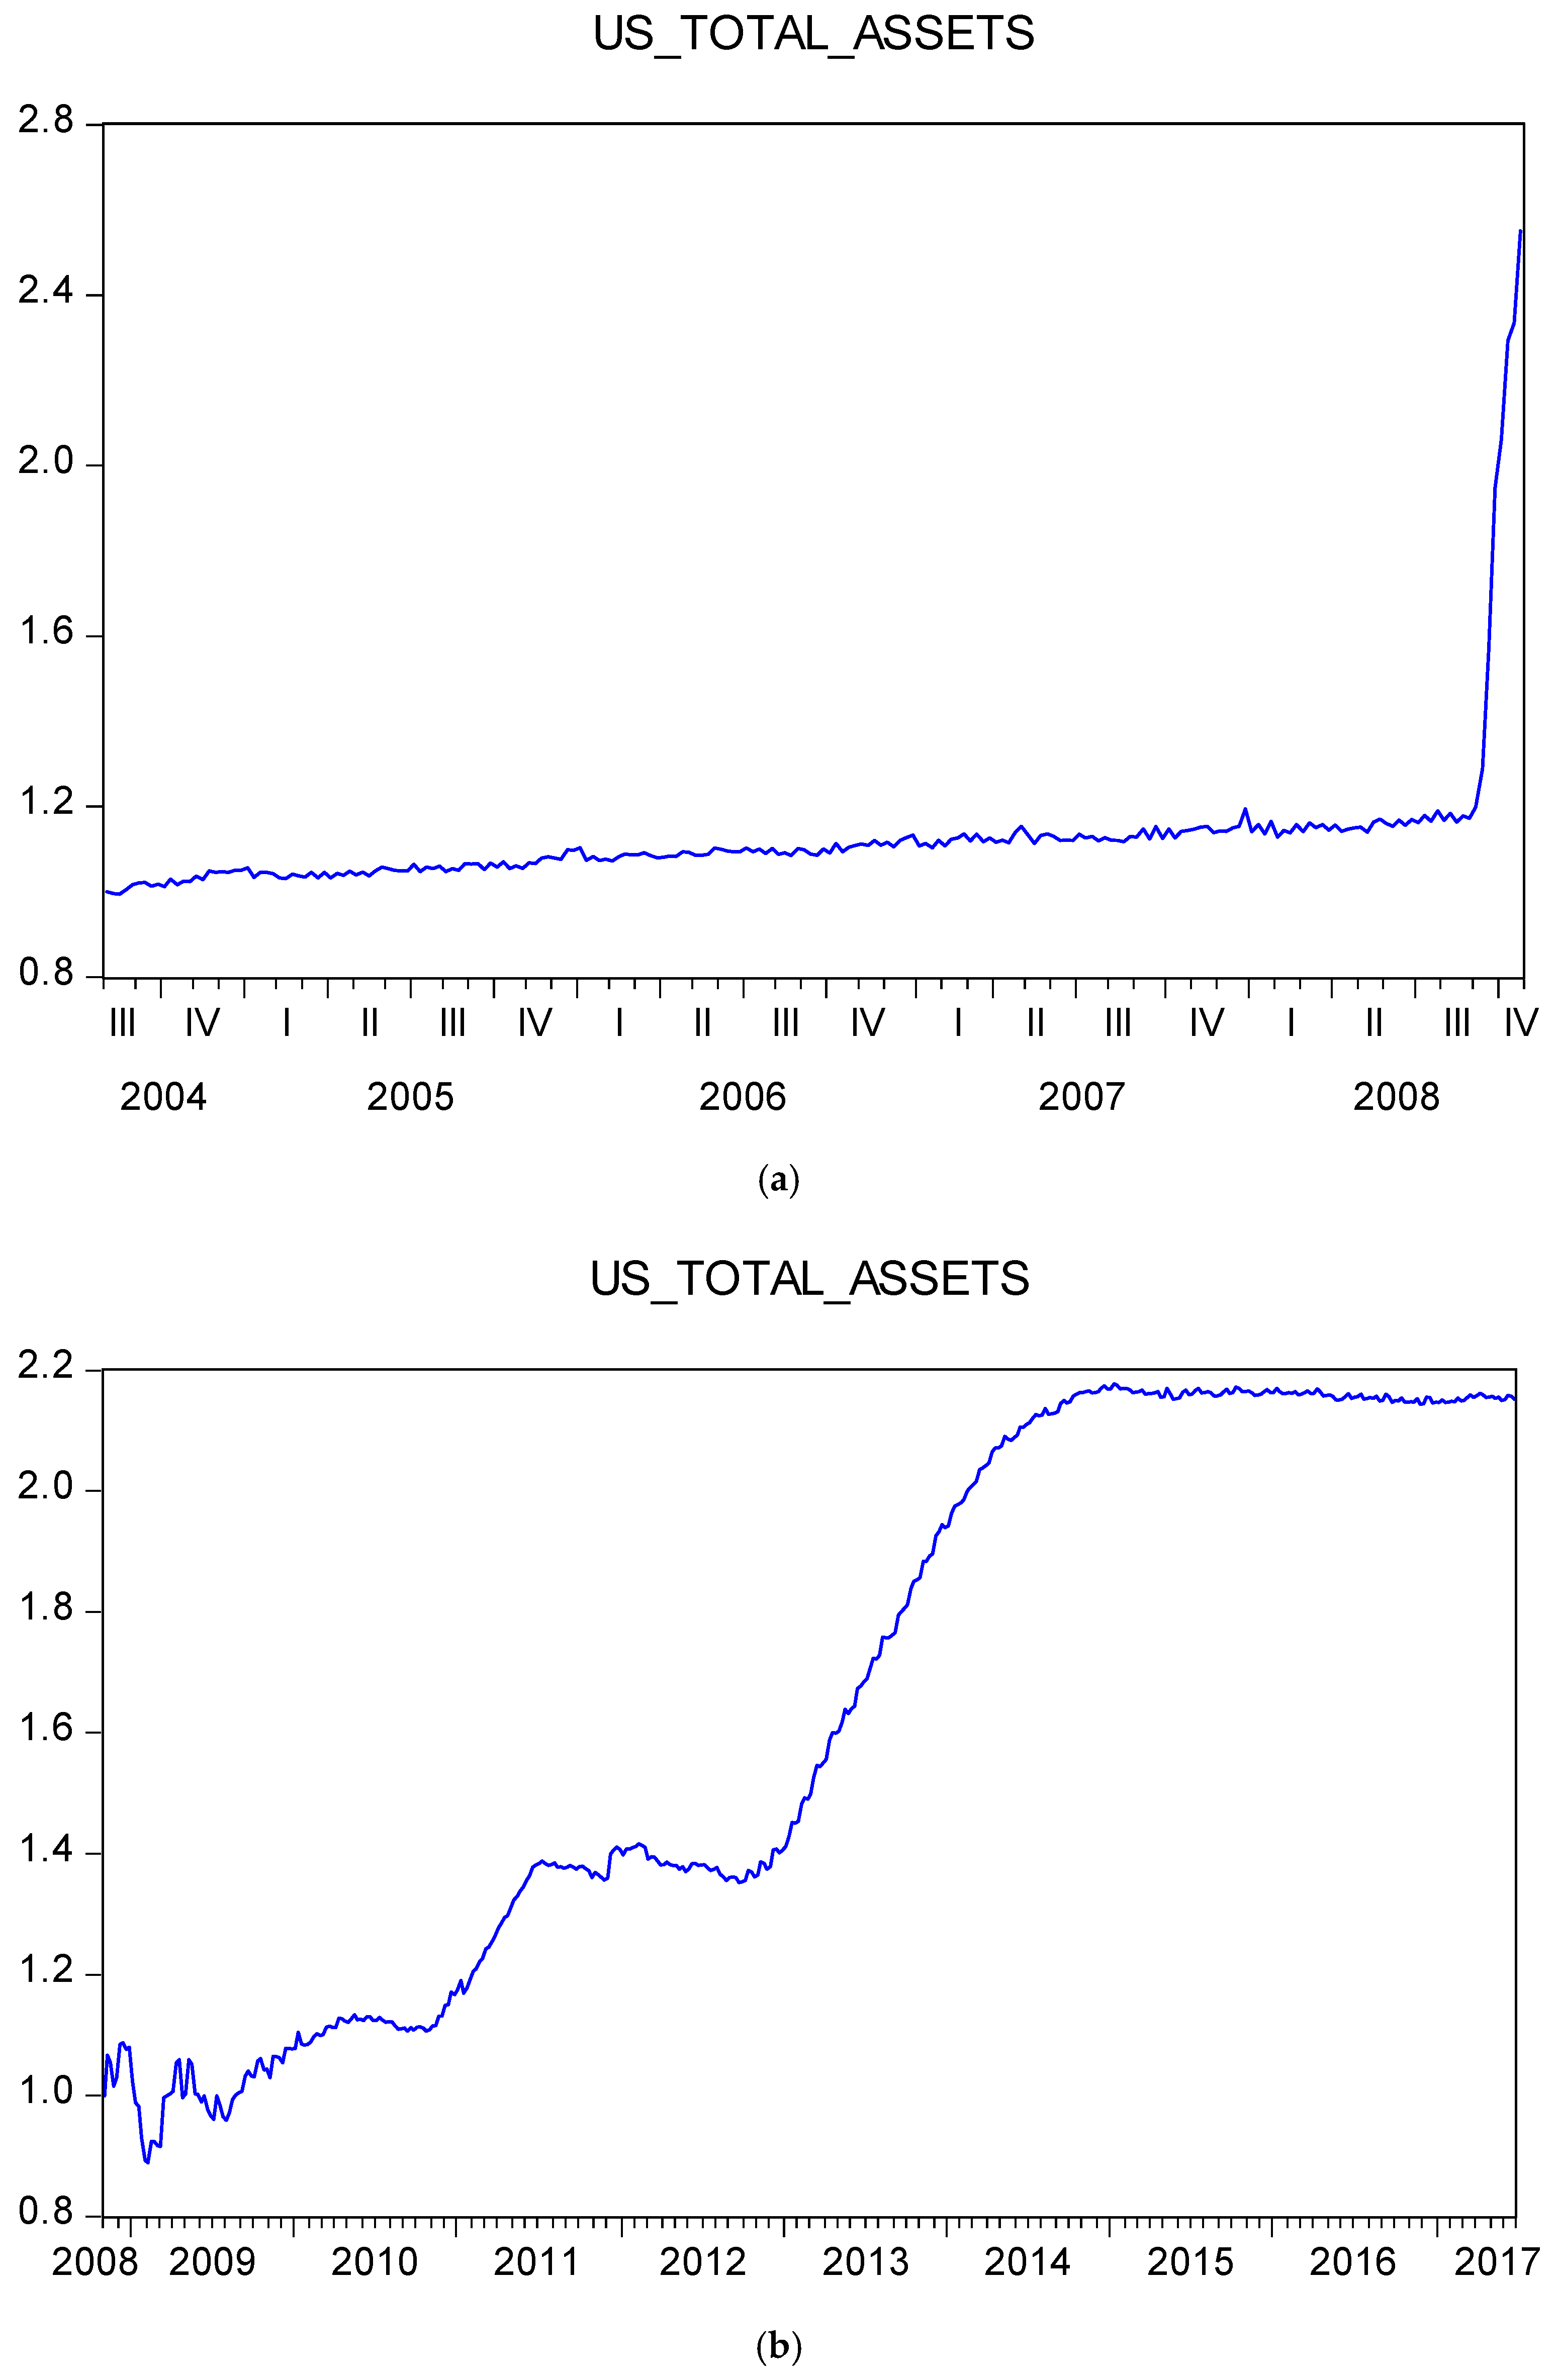
Figure 1a,b depicts the Fed’s total assets before and after the launch of QE, respectively. It can be seen that during the QE periods, the total assets were skyrocketing. This is in contrast to the period before QE, when the Fed’s total assets showed very weak increases. All the diagrams were adjusted to assign 1 as the starting value in order to better represent the fluctuations in values.
Figure 2a and
Figure 3a present the weekly returns of African stock indices before the launch and after the launch of QE, respectively. It can be observed that the returns of the DCIBT (Botswana), MASI (Morocco), TUNINEDX (Tunisia), and ALSIUG (Uganda) indices rose significantly, whereas the BLSI (Lebanon), MSI (Oman), and ADI (United Arab Emirates) increased by a more modest level. Moreover,
Figure 2b and
Figure 3b depict the Middle Eastern stock indices before and after the launch of QE, respectively. Significant increases in the PLE (Palestine) index can be observed in the pre-QE period. Notably, the AMGNRLX (Jordan) index was almost stable. In the period after the launch of QE, the TA35 (Israel) and QSI (Qatar) indices showed the highest increases.
Table 1 and
Table 2 provide the descriptive statistics of these returns. It can be seen that the standard deviations of the Fed’s balance sheet, as well as of every index under scrutiny, were positive during the whole sample period. Moreover, all the African indices and four Middle Eastern indices ((TA35 (Israel), BLSI (Lebanon), PLE (Palestine) and QSI (Qatar)) exhibited negative values of skewness, so quotes of stock indices tended to be lower than their mean. Notably, kurtosis was found to be high only in half of the stock indices examined, and the highest excess kurtosis was detected in the Palestinian index. This suggests that there were no large deviations in the values of seven out of 14 indices under scrutiny over time.
By focusing on the different vector autoregressive (VAR) patterns, we applied an extension of Granger causality test based on
Sato et al. (
2007). This enabled us to capture dynamic patterns based on the theoretical framework of locally stationary processes (
Dahlhaus et al. 1999). Therefore, with a dynamic VAR framework (DVAR) having a bivariate case of two time series
and
, the computational representation of the function is as follows:
and
In Equations (1) and (2), the random variables with variance equal to
and expectations equal to zero are represented by
and
, respectively. Furthermore, the time-varying intercepts are represented by
and
whereas
denote the time-varying autoregressive coefficients. This methodology was based on the work by
Ajmi et al. (
2015). The use of M- and B-spline functions was adopted (
Eilers and Marx 1996) for estimating the DVAR using a multiple linear regression model.
Additionally, the testing for time-varying Granger causality between
and
took place by testing whether
. Furthermore, by testing the significance of
for every B-spline, we were able to check whether the Granger causality was constant or time varying. We adopted a pairwise pattern following
Ajmi et al. (
2015) and set a DVAR to an order of (
p = 1) and
M = 3. Lastly, in accordance with
Shahbaz et al. (
2016), we applied a lag 1 bivariate VAR model.
4. Empirical Study and Economic Implications
For preliminary testing, we investigated the level of integration among our variables by applying several unit root tests (i.e., augmented Dickey and Fuller—ADF (
Dickey and Fuller 1979); Phillips and Perron—PP (
Phillips and Perron 1988); and Kwiatkowski et al.—KPSS (
Kwiatkowski et al. 1992)). To elaborate these, the Akaiki Information Criterion (AIC) statistic was applied to indicate the proper time length while the tests were applied to both the trend and the drift of the data. As a result (
Table 3,
Table 4 and
Table 5), the tests suggest that the variables were integrated to an order of one (1).
Table 6 depicts the outcomes of classical (conventional) causality tests for the five separate time periods examined. Interestingly, it is obvious that the majority of countries were influenced by the US monetary policy before the Lehman Brothers collapse. The results probe 11 bidirectional causalities between the Fed’s total assets (TA) and stock markets in the case of the pre-QE and QE3 periods. Specifically, three African (Mauritius, Morocco, and Tunisia) and seven Middle Eastern countries (Bahrain, Israel, Jordan, Oman, Qatar, Saudi Arabia, and United Arab Emirates) showed Granger causality. It should be emphasized that the corresponding reverse causal impacts were also evident for all these relations, mostly at the same level or a lower level of statistical significance. Thereby, in most hypotheses, we detected strong linkages between the two variables, which were significant at the 1% and 5% levels. Moreover, regarding the African countries, there is evidence that the Fed’s unconventional monetary practices had Granger effects on the Mauritian index during QE1, the Kenyan index during QE3, and the Tunisian index in the post-QE period. Notably, concerning the Middle Eastern countries, there is evidence that only the Omani index was affected by US policies during the QE3 period.
Table 7 illustrates the results of the dynamic Granger causality tests. In a somewhat similar vein, the outcomes of the dynamic Granger causality tests were close to those from the classical causality tests. Interestingly, significant results from other countries were also found, whereas some indices with previously robust Granger estimates presented a lower level of robustness. When examining the African countries, Kenya, Mauritius, Morocco, Tunisia, and Uganda, as well as Botswana, although to a lesser extent, were found to be impacted by the US Fed’s policy before QE. Therefore, all the African countries were significantly affected by US monetary policy before the QE periods. Furthermore, there is evidence of reverse causality in the cases of Mauritius and Tunisia. Perhaps not surprisingly though, these overall effects were weaker during the unconventional policy periods, as no effect was found on the African countries. Moreover, there is evidence that the Fed’s balance sheet alterations affected Bahrain, Jordan, Palestine, Qatar, Saudi Arabia, and United Arab Emirates at the highest level of statistical significance (1%) before QE. Nevertheless, there is no evidence of reverse causality. Interestingly, the Fed’s assets were found to impact the Omani index during the QE3 and post-QE periods, although not intensely. The same is valid when examining the impacts on the index of the United Arab Emirates in the post-QE period. Furthermore, we argue that the Palestinian index was impacted but also exerted dynamic Granger causality towards the US monetary authority in the post-QE period.
From another innovative perspective, the results from the time-varying Granger causality tests are presented in
Table 8. In a high level of accordance with evidence from the classical and dynamic specifications, the results indicate that before non-conventional US policymaking, the Botswanan, Kenyan, Mauritian, Moroccan, Tunisian, and Ugandan indices were impacted by the Fed’s practices with significant levels of Granger causality. It should be emphasized that all six African indices showed robust evidence at the 1% statistical significance level. Interestingly, the indices of Mauritius, Morocco, and Tunisia showed reverse causality on the US Fed’s balance sheet. Furthermore, a Granger causality effect towards Kenya by the US Fed was detected during QE3 along with reverse causality. Notably, the US impact on the stock index of Uganda was statistically significant both during QE3 and in the post-QE period. When examining the causality of the US Fed’s policies towards the Middle Eastern indices, Bahrain, Jordan, Palestine, Qatar, Saudi Arabia, and United Arab Emirates were found to be impacted before QE. Notably, all the estimations showed the highest level of statistical significance, whereas no reverse causality was detected. It should be emphasized that US total assets impacted the Israeli and Omani indices during QE3 with significant Granger causality, showing more robust estimation results. It can be seen that the Palestinian index was impacted with statistically significant time-varying Granger causality and showed reverse causality towards the Fed’s assets in the post-QE period.
It should be noted that the three Granger causality specifications that have been adopted present significant differences in findings. More specifically, the results from the classical Granger estimations reveal that the Fed’s balance sheet exerted impacts on the African stock indices of Mauritius, Morocco, and Tunisia before the launch of QE. Furthermore, the Fed’s total assets were found to be influential on the stock indices of the Middle Eastern countries of Bahrain, Israel, Oman, Qatar, Saudi Arabia, and United Arab Emirates during the same period. Furthermore, the Mauritian index was impacted by the Fed during QE1, the indices in Kenya and Oman were influenced by the Fed during QE3, and the index of Uganda was influenced by the Fed in the post-QE period.
The outcomes derived by the dynamic Granger causality estimations were somewhat different. There is evidence that the Fed’s total assets affected the African stock indices of Botswana, Kenya, Mauritius, Morocco, Tunisia, and Uganda. Moreover, the Fed’s balance sheet restructuring had impacts on the stock indices of Bahrain, Jordan, Lebanon, Oman, Palestine, Qatar, Saudi Arabia, and the United Arab Emirates in the Middle East. Moreover, the findings indicate that the Fed’s total assets influenced the stock indices of Lebanon and Oman in the Middle East during QE3. Furthermore, the US Fed’s effects were detected on the equity indices of Oman, Palestine, and the United Arab Emirates in the post-QE period.
Similar but not identical results were found by conducting time-varying Granger causality estimations. In accordance with findings based on the dynamic Granger causality methodology, the evidence indicates that all the African stock indices were impacted by the Fed’s balance sheet before the launch of QE. When examining stock indices in the countries of the Middle East, causal effects of US Fed’s total assets on the indices of Bahrain, Jordan, Palestine, Qatar, Saudi Arabia, and United Arab Emirates were revealed. It should be noted that no effects of the Fed’s unconventional policies on any index were identified during QE1 and QE2. Nevertheless, significant impacts of the Fed on the stock indices of Kenya and Uganda were detected during QE3. Furthermore, there is evidence of effects on the stock indices of Israel and Oman during the same period. Moreover, it can be seen that the African stock index of Uganda and the stock index of Palestine in the Middle East were influenced by the Fed’s total assets in the post-QE period.
Estimations of the causal effects exerted by the studied stock indices on the Fed’s balance sheet (i.e., reverse causality) have also been calculated. These results provide evidence that the stock indices of Kenya, Morocco, and Uganda affected the US Fed’s total assets before the launch of QE. Furthermore, the indices of Jordan, Lebanon, and the United Arab Emirates were found to influence the Fed’s balance sheet during the same period. It should be emphasized that no reverse causal linkages were detected during QE1. Nevertheless, it can be seen that during QE2, the indices of Botswana and Morocco influenced the Fed’s balance sheet. Moreover, outcomes indicate that the African stock indices of Botswana, Kenya and Uganda and the Lebanese index in the Middle East affected the Fed’s total assets during QE3. Only the African stock index of Morocco influenced the size of the Fed’s total assets in the post-QE period.
The reverse causality investigations by dynamic Granger causality tests also led to a number of interesting findings. The African stock indices of Mauritius and Tunisia were found to influence the Fed’s total assets before the launch of QE. Interestingly, there is no evidence that indices of countries in the Middle East exerted effects on the Fed’s total assets during the same period. It should be noted that only the Israeli index in the Middle East was found to influence the Fed’s balance sheet during QE1, and only the African index of Botswana presented similar impacts during QE2. Moreover, evidence indicates that the stock indices of Oman, Saudi Arabia, and the United Arab Emirates in the Middle East affected the Fed’s total assets during QE3. It should also be underlined that only the Palestinian index in the Middle East influenced the Fed’s balance sheet in the post-QE period.
Outcomes about reverse causality by time-varying Granger estimations also provide some interesting findings. The African indices of Morocco and Tunisia were the only ones affecting the Fed’s total assets before the launch of QE. It can be seen that only the Israeli index in the Middle East influenced the size of the Fed’s balance sheet during QE1, while the African equity index of Botswana and the equity index of Jordan in the Middle East affected it during QE2. Furthermore, evidence reveals that the African stock index of Kenya and the Lebanese stock index in the Middle East impacted the size of the Fed’s balance sheet during QE3. Moreover, only the African index of Morocco was found to significantly impact the Fed’s total assets in the post-QE period.
In order to provide a bird’s-eye view of the Granger causality empirical outcomes, we argue that US monetary policy was more influential on the African and Middle Eastern countries studied here before the implementation of its non-conventional policies. The high level of robustness concerning the estimations of this period leaves little space for statistical ambiguity on these results. Nevertheless, in the four periods examined after the launch of the unconventional policies, there is clear evidence that QE3 was substantially more influential than QE1 and QE2. That is, news about efforts to sweep up the extra liquidity injected into the market led to alterations in the stock indices in the emerging markets under consideration. Evidence provided by the classical Granger causality test reveals that African countries were mostly influenced by QE3. Intriguingly, results from the dynamic Granger impacts estimations show that the Middle East was significantly more affected during the QE periods. Interestingly, the time-varying Granger causality specification corroborates these split findings, as two African and three Middle Eastern capital markets were found to be impacted significantly by QE3. These findings are in accordance with those of previous studies that indicated that the last round of QE was very influential on emerging markets.
Although the results across the Granger specifications differed, there were not great differences in the findings. The dynamic Granger causality methodology better captures dynamic patterns in values of stock indices with large fluctuations. On the other hand, time-varying Granger causality captures more accurately the time evolution of the causal nexus between the Fed’s balance sheet and each index. This is the reason the results varied according to the special characteristics of the linkage between the Fed’s total assets and each index.
It is noteworthy that reverse causality from indices of emerging markets towards the Fed’s balance sheet was detected. The rationale underlying these findings is that the US QE policy promoted cash flows towards developing economies, providing a significant spur towards these stock markets, though to an unequal extent. The development of stock markets in emerging economies strengthens the existence of available and attractive alternative investments. This makes it more difficult for the US economy to recover and necessitates additional restructuring of the US Fed’s balance sheet.
It can be observed that the Fed’s monetary policy during the pre-QE period had a strong impact on the African and Middle East indices even though the Fed’s total assets only slightly increased. This can be attributed to the central role that the US economy plays in the international stock markets under typical circumstances. Thus, even slight increases of the Fed’s balance sheet during periods of conventional monetary policy could be seen as a very positive sign for growth in international markets. Nevertheless, during turbulent financial eras, even ample liquidity infusions could be considered to be inadequate for providing a sufficient spur on a worldwide level.
There are valuable economic implications that can be derived by the above analysis. Alterations in the US Fed’s balance sheet were found to be most influential on stock indices in Africa and the Middle East during the period before the launch of QE, as well as in the later rounds of QE and the post-QE period. This is in accordance with existing findings in the relevant literature which show the great influence of the size of the Fed’s balance sheet on emerging markets during QE3 and the post-QE period. Among the African countries, Kenya and Uganda were found to be the most affected by unconventional US monetary policies, whereas Israel and Oman were the most affected Middle Eastern countries. Evidence reveals that stock indices in Africa and the Middle East are more influenced by conventional US policies or late rounds of unconventional US policies when there is a tendency towards normalization. All in all, non-conventional monetary practices are more effective during their late stages in contrast with more conventional ones. It could be argued that conventional monetary policies are preferable because unconventional US monetary measures are not very effective on economies in Africa and the Middle East.
5. Conclusions
This paper studies the Granger causality impacts generated by the US Fed’s unconventional monetary policy on the stock indices of several African and Middle Eastern economies. The procedures employed for examining causality and reverse causality relations between the Fed’s balance sheet and each index were conventional, dynamic, and time-varying Granger causality tests. The novel impact of this study lies in the focus on the pre-QE, QE1, QE2, QE3, and post-QE eras, using two innovative specifications. Moreover, this study offers an in-depth investigation of previously overlooked QE dynamics in less studied, emerging countries. This is also the first academic work providing access to estimations regarding not only African, but also Middle Eastern stock markets to a large extent, analyzing these markets before, during, and after the implementation of unconventional US monetary policies.
The evidence shows that the US Fed’s practices impacted the countries under scrutiny most significantly before QE and during or after QE3. Specifically, the conventional Granger tests indicate that African countries were mainly affected by US practices during and after QE3, whereas the dynamic Granger specifications show that Middle Eastern countries responded in a more significant manner during these times. Notably, the time-varying Granger causality estimations showed split results, as two African and three Middle Eastern stock indices were found to be impacted by US QE practices. It should be highlighted that before the non-conventional US policies were implemented, effects on the majority of the indices examined were found to be statistically significant at the 1% level.
Moreover, it should be emphasized that, of the African countries, Kenya and Uganda were found to be the most Granger affected during and after QE3. Interestingly, Kenya was also found to exert a reverse causal effect towards the US. Moreover, it should be highlighted that Oman, Israel, and Palestine, as well as Lebanon and the United Arab Emirates in a lesser extent, were affected by the Fed’s balance sheet due to causality stimulatory dynamics. Furthermore, Palestine was found to exert reverse causality.
It is worth noting that the results of the Granger causality tests undertaken here are in accordance with the majority of the empirical research on QE3 effects on emerging economies. Nevertheless, we filled a gap of high importance in the relevant literature by extending our research to Middle Eastern countries and conducting a thorough investigation of African capital markets. We analyzed time periods in which the US monetary authority appeared to have little or no ability to impact the domestic and global economy via managing domestic rates. The purpose of this study was to examine Granger-causal monetary impacts by using highly innovative specifications. Thereby, we facilitate future comparative investigations regarding the nexus between unconventional monetary policies and global capital markets during periods of normal or extraordinary policies or during the tapering of such extraordinary policies.
Notably, we tested whether spillover impacts from unconventional practices are indeed a global phenomenon and if conventional or unconventional US practices influence stock markets on a worldwide level with emphasis on developing markets It should be noted that unconventional US monetary policies were found to be significantly less influential than conventional policies with respect to the stock markets in Africa and the Middle East. Only the conventional period, QE3, and the post-QE period showed significant effects from the restructuring of the Fed’s balance sheet. The majority of countries were not influenced by the US Fed’s unconventional policy as strongly as by its conventional policy. This reveals the weakness of the transmission of shocks and the creation of spillover effects caused by unconventional monetary policies. Thereby, conventional monetary policies should constitute a preferable solution for the US Fed if the goal is to influence these emerging economies.
This study casts light on the spillover effects caused by policymaking in highly sophisticated economies on less developed markets by focusing on countries that are not tightly connected to the US economy. Academic research of these countries has been embryonic thus far, depriving policymakers and investors of useful information. Even though many lines of academic work will still follow, this paper can strengthen the knowledge base of monetary policymakers and market practitioners, providing a better understanding of the dynamics and profit-making opportunities concerning US spillover impacts on global markets.


