Abstract
Camelina [(Camelina sativa (L.) Crantz], an oilseed species of Brassicaceae, does not have approved herbicides for weed control, which limits its expansion as a commercial crop. To evaluate agronomic traits and ecosystem services of non-transgenic cultivars of sulfonylurea-resistant camelina and canola (Brassica napus L.), a field study was conducted near Fargo, North Dakota. Two replicated locations (NDSU and NW22) were set up in a randomized complete block design including four blocks of camelina, canola, and fallow per location. Camelina and canola were seeded (18 May) at 4.9 and 2.9 kg ha−1, respectively, using 19-cm row spacing. Data was collected mid- and late-season (29 June and 22 July 2020 respectively) for crop and weed stem count (no. m−2), biomass dry matter (kg m−2), and nutrient (N, P, K, S) content (kg ha−1), as-well-as final season (7 August) seed yield (kg ha−1) for camelina and canola treated with and without sulfonylurea. Using Prefer 90 (NIS) at 0.25% v/v, camelina was treated with thifensulfuron at 6.3 g a.i. ha−1, and canola was treated with thifensulfuron at 10.5 g a.i. ha−1 and tribenuron at 5.3 g a.i. ha−1. Sulfonylurea-resistant camelina and canola reduced late-season dry weight biomass of weeds by >75% and ≥60%, respectively, compared with fallow plots. Application of sulfonylurea herbicides to camelina or canola prior to mid-season analyses was not a significant factor (p ≤ 0.05) for reducing weed pressure and generally had little impact on altering crop biomass, seed yield, and nutrient retention. However, in some cases, herbicide treatment had an additive effect of reducing weed pressure over that of camelina or canola alone. Depending on the rotational cropping system, sulfonylurea-resistant camelina and canola should provide additional options for integrated weed management approaches and reducing nutrient leaching in the upper Midwest and northern Great Plains of the USA.
1. Introduction
Meeting the global demand for food, feed, fiber, and energy resources by an increasing population continues to drive agricultural intensification efforts [1,2]. However, efforts to increase U.S. agricultural production by 40% while cutting the environmental footprint in half by 2050 [3] or attaining a 50% reduction in herbicide use by 2030 as part of the European Union’s Green Deal [4], presents challenges to future agricultural intensification approaches. Although past agricultural intensification practices have helped to meet the increasing demand for agricultural resources and products, some have also negatively impacted soil quality. For example, in the Midwest Corn Belt ~35% of cultivated areas have lost topsoil, resulting in crop yield losses up to 6% and $2.8 billion annually [5]. To meet government directives aimed at reducing our impact on agroecosystems, innovative and sustainable approaches to agricultural intensification are needed that focus on increasing both yield and beneficial ecosystem services. These targeted ecosystem services should include reducing weed pressure and soil nutrient losses, while increasing carbon sequestration and habitat and nutrient sources for pollinators [2,6].
One practice gaining popularity for enhancing sustainable agricultural intensification without increasing our agricultural footprint is multi-cropping [7]. Multi-cropping (double- and relay-cropping, or inter-seeding) practices allow opportunities for incorporation of cover crops that provide beneficial ecosystem services and/or the potential to harvest two cash crops in a single growing season [8]. Several oilseed species of the Brassicaceae family such as camelina and canola are being evaluated for developing multi-cropping systems [9,10,11]. Camelina and canola include both spring- and winter-biotypes [12,13,14] and this diversity in growth habits provides excellent options for maintaining landscape cover across temperature gradients. It also provides potential economic incentives when incorporated into multi-cropping systems for harvest as cash crops [15].
In the upper Midwest and northern Great Plains, oilseed cover/cash crops in the Brassicaceae family not only provide opportunities for increased biomass production, but also provide beneficial ecosystem services including reduced agricultural runoff and weed pressure, and increased nutrient retention, carbon sequestration, and pollinator habitat [16,17,18,19,20,21,22,23,24,25,26]. The ability of these cover/cash crops to scavenge soil nutrients also helps to reduce nutrient leaching into aquatic ecosystems and the associated environmental consequences [25,26]. In a study conducted in North Dakota, the canopy cover and biomass of field pennycress (Thlaspi arvense L.), another oilseed species of Brassicaceae, was tightly correlated with suppression of weeds and retained significant levels of nutrients (N, P, K, S)—similar to that retained by alfalfa [19]. Indeed, the recent domestication and commercialization of field pennycress for multi-cropping in corn (Zea mays L.) and soybean (Glycine max (L.) Merr.) rotations (CoverCress Inc., St. Louis, MO, USA) provides economic incentives for incorporating this cash cover crop into cropping systems of the upper Midwestern USA. Thus, it should not be surprising that there is an increased trend in cover crop adoption on harvested acres, with decreased United States Department of Agriculture (USDA) funding requested for conservation tillage programs and a shift to increased funding of cover crop programs [27].
Regardless of the increased trend in adoption of and government funding for cover crops, there is still room for improvement, particularly in the central and western USA [28]. For instance, land managers and taxpayers expend hundreds of millions of dollars annually on chemical, mechanical, and cultural measures to control weeds [29,30,31]. Incorporation of cover crops into integrated weed management programs helps to reduce the spread of weeds, evolution of herbicide resistance, and the negative impacts of herbicides on agro-ecosystems, while meeting the goal of reducing herbicide applications. The value-added ecosystem benefits associated with incorporation into rotational cropping systems [32,33,34] resulted in U.S. cover crop acreage increasing by an average of 50% between 2012–2017, representing 6.23 million ha in 2017 [15]. In North Dakota alone, cover crop acreage increased by 89% (from 86,526 to 163,601 ha) during this same 5-year period. However, current integrated weed management approaches still recognize the benefits of incorporating herbicide resistant crops and chemical control measures into rotational cropping systems [35]. Thus, naturally occurring, and non-genetically modified organism (GMO) resistance of cover crops to herbicides could be beneficial.
In this study, spring-biotypes of sulfonylurea-resistant camelina and canola were used to evaluate their agronomic traits and weed suppressing activity under field conditions. Sulfonylurea herbicides inhibit acetolactate synthase (ALS), which is a plastid-localized enzyme required for the synthesis of branched-chain amino acids such as valine, leucine, and isoleucine [36,37]. This class of herbicide works on a broad range of grasses and broadleaf weeds by impeding production of proteins needing these branched-chain amino acids, which effectively inhibits cell division and new plant growth. Plant resistance to this class of herbicide generally occurs through an alteration at the herbicide binding site of ALS or by metabolic conversion to a non-phytotoxic form [38]. Additionally, because the activities of sulfonylurea herbicides are effective at exceptionally low application rates and some are known to have relatively short post-application half-lives relative to other classes of herbicides [38], their environmental impact is also reduced [39]. Outcomes from this study may support the use of sulfonylurea-resistant crops for increasing diversity and agroecosystem benefits among rotational cropping systems of the upper Midwest and northern Great Plains.
2. Materials and Methods
2.1. Plant Material, Field Plots, and Harvest
A non-transgenic cultivar of sulfonylurea-resistant camelina (experimental breeding line 17CS1115, Smart Earth Seeds Inc., Vancouver, BC, Canada) and a non-transgenic cultivar of sulfonylurea-resistant canola (68K, Falco Seed, Winnipeg, MB, Canada) were planted at the North Dakota State University (NDSU) campus experiment station (longitude −96.8139260130, latitude 46.9046113940) and at the NW22 field site (longitude −96.8603538380, latitude 46.9306082370). Field plots were set up in a randomized complete block design including four blocks of camelina, canola, and fallow per location. Seeding of camelina and canola occurred 18 May 2020 using a Great Plains 3P600 drill (Great Plains Ag, Salina, KS, USA) with 19-cm row spacing. For camelina, seeding rate was 4.92 kg ha−1 of pure live seed (PLS). For canola, the seeding rate was 2.91 kg ha−1 of PLS.
All plots were treated with a pre-planted incorporated herbicide and half of all camelina, and canola plots were treated with post-emergence herbicide. The herbicide trifluralin (2,6-dinitro-N,N-dipropyl-4-(trifluoromethyl)aniline) Treflan® HFP (Gowan Company, Yuma, AR, USA) was applied at 383.3 mL ha−1 on 15 May 2020 and incorporated the same day. Post-emergence herbicide application occurred 12 June 2020. Using a non-ionic surfactant at 0.25% v/v (Prefer 90), camelina was treated (prior to bolting) with or without thifensulfuron (N-((4-methoxy-6-methyl-1,3,5-triazin-2-yl)carbamoyl)sulfamoyl)thiophene-2-carboxylic acid) at 6.3 g a.i. ha−1, and canola (3-4 leaf stage) was treated with or without thifensulfuron at 10.5 g a.i. ha−1 and tribenuron (2-[[(4-methoxy-6-methyl-1,3,5-triazin-2-yl)-methylcarbamoyl] sulfamoyl] benzoic acid) at 5.3 g a.i. ha−1. Canola planted at both locations was also treated with the insecticide lambda-cyhalothrin (Warrior II) at 0.14 L ha−1 (34.9 g a.i. ha−1) with 0.25% v/v Prefer 90 on 29 May 2020.
Data collection for crop and weed stem count (no. m−2), biomass dry weight (kg m−2), and nutrient concentration [nitrogen (N), phosphorus (P), potassium (K), sulfur (S) kg ha−1] occurred mid-season (29 and 30 June 2020) at NW22 and NDSU, respectively, and at both locations late-season data collection occurred 22 July 2020. At both locations, final seed harvest (kg ha−1) occurred 7 August 2020 from camelina, and 13 August 2020 from canola. Data for daily temperature and precipitation during the 2020 growing season (Figure S1) at both field sites was obtained from North Dakota Agricultural Weather Network station located in Fargo, ND (https://ndawn.ndsu.nodak.edu/station-info.html?station=23, accessed on 18 October 2022). The weather station is located approximately 0.8 km South of the NDSU and 5.2 km South-East of the NW22 study sites.
2.2. Statistical Analysis
The Mixed Procedure of SAS was used to analyze data collected from mid-season (after post-emergence herbicide application) and late-season (at full maturity), which included five treatments (trt), four replicates (rep), two sampling times and two locations. Data collected for evaluation included plant stem counts (crop and weeds), dry weight biomass (crop and weeds), nutrient analysis of crop (N, P, K, S), and seed yield of crop. For the ANOVA, location, crop, time, and herbicide were fixed and independent variables and stem count, biomass, nutrient content, and seed yield were dependent variables (Table 1). When ANOVA showed significant differences (p ≤ 0.05), an F-protected LSD at α = 0.05 was used to differentiate treatment means. Locations were analyzed separately.

Table 1.
ANOVA table showing level of significance (p-values) on stem counts, dry weights (DW), nutrient content (N, P, K, S) and final season crop seed yield (yield) at NDSU and NW22. Stem count and DW were analyzed with and without fallow included.
2.3. Soil and Nutrient Analysis
Soil samples (0–15 and 15–60 cm) were collected on 1 June 2020 (early season; Table 2) and 27 July 2020 (late season; Table 3) and analyzed for soil nutrient content by the NDSU soil testing lab. Tissue samples collected from camelina and canola, mid- and late-season, were placed in paper bags and dried at 90 °C for two weeks and then ground to a powder using a Wiley Mill Model 3 equipped with a 2-mm screen. A subsample of the ground tissue samples was analyzed by AGVISE Laboratories (Northwood, ND, USA) for nutrient content.
Table 2.
Baseline early season (1 June 2020) soil tests at 0–15 cm and 15–60 cm for nitrogen (NO3-N), phosphorus (P), potassium (K), sulfur (SO4-S), pH and electrical conductivity (EC) included six randomly pooled soil samples taken at each location (NDSU and NW22).
Table 3.
Analysis of late season (27 July 2020) soil tests at 0–15 cm and 15–60 cm for nitrogen (NO3-N), phosphorus (P), potassium (K), sulfur (SO4-S), and pH at two locations (NDSU and NW22). Samples were pooled from all four replicates of sulfonylurea-resistant camelina or canola treated with (Yes) or without (No) herbicide (Herb) at each location.
3. Results and Discussion
3.1. Factors Impacting Weed Pressure
In this study, the variance of weed stem counts and biomass dry weights of fallow (control plots) at each location were not homogenous; thus, locations were analyzed separately (Table 1). The difference in weed species at each location (Table 4) may have been a contributing factor influencing homogeneity. Additionally, because the experimental design did not include herbicide treatment, nutrient retention, and seed yield of fallow, ANOVA was conducted with and without fallow. With fallow included in the analysis, crop was a significant variable for weed and crop stem counts and biomass dry weights at NDSU (p ≤ 0.05), but it was not a significant variable for weed stem counts at NW22 (Table 1). Without fallow included in the analysis, crop was not a significant variable for weed biomass dry weights at either location or for weed stem counts at NW22 (Table 1). Herbicide was not a significant variable for crop or weed stem counts or biomass dry weights at either location with fallow included in the analysis but was significant for weed stem counts (p ≤ 0.05) and biomass dry weights (p ≤ 0.05) at NDSU without fallow included. Time of the evaluation (mid- and late-season) was a significant factor (p ≤ 0.05), as expected, for weed and crop biomass dry weights at both locations with fallow included in the analysis but was not significant for weed biomass dry weights at NW22 without fallow included. Crop by herbicide (C × H) interaction was significant (p ≤ 0.05) for weed stem counts at both locations without fallow, but not with fallow included in the analysis. Crop by time (C × T) interaction was significant (p ≤ 0.05) for both weed and crop stem count and biomass at NDSU but was only significant for crop biomass at NW22 (Table 1; Tables S1 and S2). Herbicide by time (H × T) and crop by herbicide by time (C × H × T) interactions were not significant (p ≤ 0.05) at either location, with or without fallow included (Table 1).
Table 4.
List of weed species that were predominant, moderate, or occasionally observed in fallow plots by location (NDSU and NW22).
3.2. Stem Count and biomass
3.2.1. Fallow
Mean weed stem counts in fallow plots decreased between mid- and late-season, respectively, at NDSU (177.7 ± 80.4 and 117.7 ± 38.4 no. m−2) and at NW22 (105.5 ± 54.8 and 39.5 ± 8.4 no. m−2) but the decrease was only significant at NW22 (Figure 1A,B). In contrast to the decreased trend in weed stem counts over time, mean weed biomass dry weights increased significantly from mid- to late-season at both NDSU (0.13 ± 0.02 and 0.46 ± 0.13 kg m−2) and NW22 (0.32 ± 0.1 and 0.94 ± 0.35 kg m−2) (Figure 1C,D). Overall, the results indicate that, over time, a similar inverse relationship exists between decreasing weed stem counts and increasing weed biomass in fallow plots at each location. Regardless of this similar trend, the biomass per plant between mid- and late-season at NDSU (0.73 and 3.03 g plant−1, respectively) was less than at NW22 (3.91 and 23.79 g plant−1, respectively). The biomass per plant results observed among fallow plots likely indicates a greater number of smaller weeds at the NDSU location and/or a difference in soil weed seed bank dynamics at each location, as indicated by Table 4.
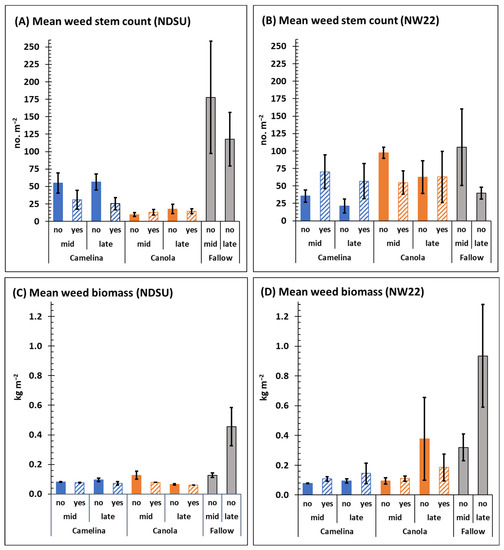
Figure 1.
Mean weed stem counts (A,B) and biomass dry weights (C,D) mid- and late-season from field plots of fallow and sulfonylurea-resistant camelina and canola at NDSU (A,C) and NW22 (B,D) treated with (yes) or without (no) sulfonylurea. Fallow plots were not treated with sulfonylurea herbicide. Error bars represent the standard error of the mean.
3.2.2. Crop (Camelina and Canola)
Mean crop stem counts of camelina mid- and late-season (C × T interaction), respectively, at NDSU (215.5 ± 26.8 and 189 ± 15.3) and at NW22 (313.5 ± 24.5 and 301.5 ± 38.3) were not significantly different (Figure 2A,B), with or without herbicide treatment (Table 1 and Table S2). Camelina mean biomass dry weights mid- and late-season, respectively, was 0.22 ± 0.02 and 0.44 ± 0.07 kg m−2 at NDSU, and 0.37 ± 0.03 and 0.75 ± 0.02 kg m−2 at NW22 (Figure 2C,D). Although mid- and late-season mean biomass dry weights of camelina at each location were significantly different (Table S2), herbicide treatment was not a significant factor (Table 1).
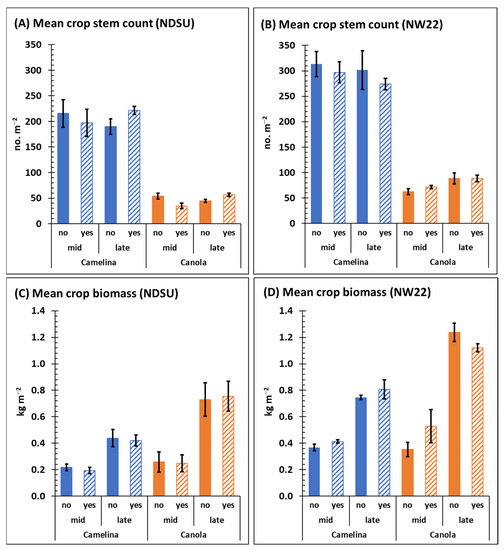
Figure 2.
Mean crop stem counts (A,B) and biomass dry weights (C,D) mid- and late-season from field plot of sulfonylurea-resistant camelina and canola at NDSU (A,C) and NW22 (B,D) treated with (yes) or without (no) sulfonylurea. Error bars represent the standard error of the mean.
Mean stem counts of canola mid- and late-season (C × T), respectively, at NDSU (54.0 ± 5.5 and 44.5 ± 2.8 stems) and at NW22 (62.5 ± 5.8 and 88.5 ± 10.8 stems) were not significantly different (Figure 2A,B), with or without herbicide application (Table 1 and Table S2). Mean canola biomass dry weights were significantly different between mid- and late-season (C × T) at both locations (Table S2); at NDSU it was 0.26 ± 0.08 and 0.73 ± 0.13 kg m−2 and at NW22 was 0.35 ± 0.05 and 1.24 ± 0.07 kg m−2 (Figure 2C,D). Similar to the minimal impact of herbicide treatment on camelina mean biomass dry weights, herbicide treatment was also not a significant factor for canola mean biomass dry weights (Table 1). Although canola stem counts were significantly less compared with camelina stem counts at each location (Figure 2A,B), late-season crop biomass dry weights of canola were significantly greater compared with late-season camelina at each location (Figure 2C,D, Table S2).
The results presented here suggest that herbicide treatment of sulfonylurea-resistant camelina and canola plots several weeks prior to mid-season had little impact on mid- or late-season growth and development of these crops, regardless of location. The difference in stem counts observed for camelina compared with canola (Figure 2A,B) is likely a reflection of the greater seeding rate and planting density for camelina, which follow recommendations of Berti et al. [17]. However, the significantly greater biomass dry weights observed for canola late-season compared with camelina (Table S2) likely reflects the known differences in morphology (biomass plant−1) during growth and development of these two divergent Brassicaceae species. Based on the experimental design used in this study, both cultivars of non-transgenic sulfonylurea-resistant camelina and canola demonstrated good resistance to our applied rates of sulfonylurea herbicide.
3.3. Effect of Sulfonylurea-Resistant Camelina and Canola on Weed Pressure
3.3.1. Camelina
Except for late-season weed stem counts at NW22 (Figure 1B), sulfonylurea-resistant camelina alone (without herbicide treatment) significantly reduced mid- and late-season weed stem counts (Figure 1A) and weed biomass dry weights (Figure 1C,D) at NDSU and NW22 compared with fallow. Based on the mean weed stem counts in sulfonylurea-resistant camelina mid- and late-season, respectively, weed pressure was reduced by 69.2 and 52% at NDSU and 66.4 and 46.2% at NW22 compared with fallow mid- and late-season at each location (Figure 3A). Based on the mean weed biomass dry weights from sulfonylurea-resistant camelina plots mid- and late-season, respectively, weed pressure was reduced by 38.5 and 78.3% at NDSU and 75 and 89.3% at NW22 compared with fallow mid- and late-season at each location (Figure 3C). Herbicide treatment had an additive effect on lowering weed stem counts mid- and late-season in camelina plots at NDSU (Figure 1A and Figure 3A) but did not further reduce weed stem counts at NW22 (Figure 1B and Figure 3A). In fact, mean weed stem counts and weed biomass dry weights mid- and late-season at NW22 appear to have increased weed pressure with herbicide treatment (Figure 1B,D and Figure 3A,C).
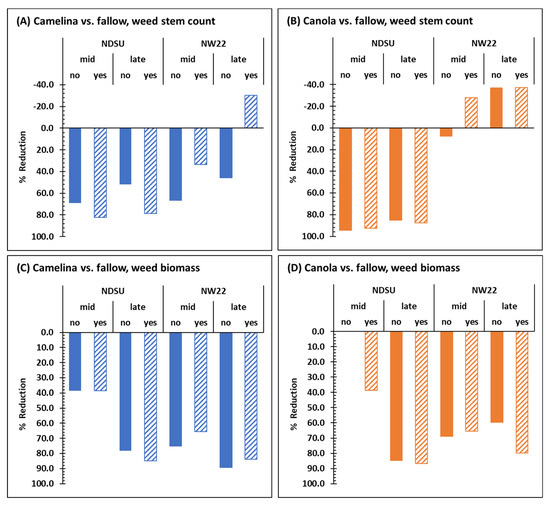
Figure 3.
Summary comparison of mid- and late-season reduction (%) based on mean weed stem counts (A,B) and biomass dry weights (C,D) in field plots of sulfonylurea-resistant camelina (A,C) and canola (B,D) treated without (no) or with (yes) herbicide with that of mid- and late-season mean weed stem counts and biomass dry weights of fallow plots at NDSU and NW22. Fallow plots were not treated with herbicide.
3.3.2. Canola
Compared with fallow, sulfonylurea-resistant canola significantly reduced mid- and late-season mean weed stem counts at NDSU (Figure 1A) but not at NW22 (Figure 1B) with or without herbicide treatment. At NDSU, mid- and late-season, respectively, mean weed stems counts were reduced in sulfonylurea-resistant canola by 94.5 and 85% (Figure 3B) compared with fallow mid- and late-season. At NW22, sulfonylurea-resistant canola had little impact on reducing weed stem counts with or without herbicide treatment (Figure 1B and Figure 3B). However, based on the mean weed biomass dry weights in sulfonylurea-resistant canola plots, weed pressure was reduced by 84.8% at NDSU late-season and by 68.8 and 59.6% at NW22 mid- and late-season (Figure 1C,D and Figure 3D) compared with fallow at each location. Herbicide treatment appeared to have an additive effect on lowering mean weed stem counts mid-season in canola plots at NW22 (Figure 1B and Figure 3B), and lowering mid-season weed biomass dry weights at NDSU and late-season weed biomass dry weights at NW22 (Figure 1C and Figure 3D).
Overall, sulfonylurea-resistant camelina and canola were very efficient at reducing weed stem counts (Figure 3A,B), except for canola at NW22 (Figure 3B), and weed biomass dry weights at both locations without herbicide treatment (Figure 3C,D). Herbicide treatment did enhance weed stem reduction in sulfonylurea-resistant camelina at NDSU (Figure 1A and Figure 3A) and weed biomass dry weight reduction in sulfonylurea-resistant canola mid- and late-season, respectively at NDSU and NW22 (Figure 1C,D and Figure 3D). Indeed, without fallow included in the ANOVA, herbicide was a significant factor for mean weed stem counts and biomass dry weights at NDSU, and for C × H interaction at both locations (Table 1). However, the effect of herbicide treatment on weed stem counts and biomass dry weight, particularly in camelina, at each location (Figure 1A,B) were not consistent. Whereas herbicide treatment reduced mean weed stem counts in camelina at NDSU, herbicide treatment increased mean stem counts in camelina at NW22 both mid- and late-season. Although sulfonylurea-resistant camelina and canola had different effects on weed stem counts at each location (Figure 3A,B), they had a similar trend for reducing weed biomass at each location, except for weed biomass dry weights mid-season in canola plots at NDSU, with or without herbicide treatment (Figure 1C,D and Figure 3C,D).
Environment and soil properties, such as pH, electrical conductivity (EC), and soil microbes, have the potential to impact sulfonylurea-herbicides half-life [39,40,41]. Faster degradation generally occurs in acidic soils; however, at NDSU average soil pH early- and late-season, respectively, was 7.3 and 6.8 (Table 2), whereas at NW22 average soil pH was 7.7 and 7.5 (Table 3). Thus, factoring in these relatively neutral soil pH averages does not appear to explain the differences observed for the effect of herbicide treatment on weed stem counts at each location. The reported average field half-life for thifensulfuron is 12 d (less for aerobic vs. longer for non-anerobic conditions), and transformation by soil microbes or non-microbial hydrolysis can reduce half-life to less than one week [38]. The study by Zhao et al. [40] demonstrated that Ochrobactrum sp. accelerated the degradation of thifensulfuron-methyl and tribenuron-methyl; for example, strain ZWS16 reduced 99.5% of thifensulfuron-methyl (50 mg) over 10 days in liquid medium and removed 58% of the herbicide from sterilized soil over 35 days. However, because we did not access the level of microbial activity or the half-life of herbicide at each field site, it would not be appropriate to speculate further. Finally, soil EC values ranging from 0.43 to 0.91 early-season (Table 2) and 0.53 ± 0.03 to 0.65 ± 0.06 late-season at NDSU and NW22, respectively, likely had little impact on herbicide efficacy or agronomic traits across locations. In this study, both sulfonylurea-resistant crops appeared to be good options for reducing weed biomass and, in some cases, the low application rate of sulfonylurea herbicide several weeks prior to mid-season data collection tended to produce an additive effect of reducing weed pressure.
Hybrid and open-pollinated canola have been reported to be effective at reducing late-season weed biomass [17]. However, this same study suggested that canola, early in maturity, is less effective at reducing weed density. In our study, sulfonylurea-resistant camelina was more effective at reducing mid- and late-season weed density, with and without herbicide treatment, compared with sulfonylurea-resistant canola. However, both sulfonylurea-resistant camelina and canola were effective at reducing mid- and late-season weed biomass dry weight, which is consistent with results reported by Beckie et al. [17]. The weed suppressing trait for sulfonylurea-resistant camelina observed in this study is also consistent with that previously reported by Saucke and Ackermann [23], where camelina suppressed weed coverage in a camelina-pea (Pisum sativum L.) mixed crop by 52–63% compared with mono-cropped pea alone.
Although sulfonylurea-resistant camelina appears to be an effective option for reducing weed pressure, weed control in camelina production can be a challenge [18,42]. Thus, best management practices for improving camelina’s competition with weeds includes early planting and good stand establishments. A major factor that makes weed control challenging is the limited number of effective grass and broadleaf herbicides for controlling weeds in camelina production [43]. In the USA and Canada, respectively, sethoxydim and quizalofop are grass herbicides registered for camelina production [18,44]. The broadleaf and small grass seedling herbicide trifluralin has also been used to control early-season weed pressure in camelina [43,45], and recently, camelina mutants resistant to acetolactate synthase inhibitor herbicides have also been developed [46,47,48]. Thus, the identification and development of new cultivars of camelina with natural resistance to sulfonylureas herbicides, which are effective a low application rates, should enhance management of weeds in camelina production. Furthermore, using sulfonylurea herbicides with a shorter half-life, such as thifensulfuron and tribenuron, should help to reduce environmental impacts associated with agricultural intensification practices.
3.4. Seed Yield
Crop was not a significant variable for end of season mean seed yield between sulfonylurea-resistant camelina and canola at NDSU, but crop was a significant variable for seed yield at NW22 (Table 1). At NDSU, crop seed yield of both sulfonylurea-resistant camelina and canola was noticeably less than observed at NW22 (Figure 4A) and herbicide and C × H were not significant variables for seed yield at either location (Table 1 and Table S3). Overall, final mean seed yield for camelina with or without herbicide treatment, respectively, at NDSU was 1246 and 1172 kg ha−1 and at NW22 was 2214 and 2414 kg ha−1, whereas final seed yield for canola at NDSU was 1299 and 1011 kg ha−1 and at NW22 was 1814 and 1891 kg ha−1. The reason for the overall increased seed yield at NW22 for both sulfonylurea-resistant camelina and canola is not known; however, we speculate that the significant increase in late-season mean stem counts and biomass of camelina and canola observed at NW22 (Figure 2) likely contributed to the greater seed yield.
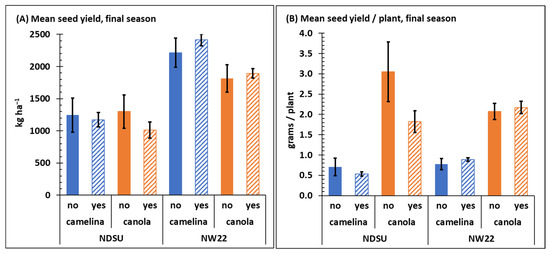
Figure 4.
Mean seed yield kg ha−1 (A) and grams/plant (B) collected from sulfonylurea-resistant camelina and canola at NDSU and NW22 field plots treated with (yes) or without (no) sulfonylurea herbicide. Seed was collected at final-season crop maturity. Error bars represent the standard error of the mean.
A study conducted by Gesch et al. [49] reported seed yield averaged across three growing seasons of 1101 and 1686 kg ha−1, respectively, for a spring biotype of camelina (CO46) in Minnesota and North Dakota. In the same study, seed yields for four varieties of spring canola (Invigor L130, DK3042RR, Empire, and Gem) ranged from 1417–2395 kg ha−1 in Minnesota and 781–1750 kg ha−1 in North Dakota. Overall, canola yield in the U.S. was reported to average 2086 and 1996 kg ha−1, respectively, in 2018 and 2019 [50]. A review by Berti et al. [18] indicated that seed yield of camelina varies by cultivar, environment, and soil type with the greatest seed yield generally observed in Mediterranean climates. Globally, depending on genotype and environment, spring camelina seed yield has been reported to range from 400–3300 kg ha−1 [18,51]. Thus, in this study, seed yield from sulfonylurea-resistant camelina and canola harvested at NDSU and NW22 is well within the ranges previously reported for camelina and canola, with or without herbicide treatment.
The increased mean seed yield observed for both sulfonylurea-resistant camelina and canola at NW22 (Figure 4A) may also be attributed to available soil nitrogen at each location. Jankowski et al. [51] concluded that nitrogen rates up to 120 kg ha−1 increased seed yield of spring camelina by ~61% in Poland. Many other studies have also reported a strong response to nitrogen (up to 185 kg ha−1) by camelina [52,53,54,55]. The increased soil NO3-N at NW22 (Table 2) could also be a likely explanation for the increased canola seed yield at NW22. A report by Karamonas et al. [56] indicated that nitrogen application (side-banded urea) rates of 120–180 kg N ha−1 resulted in maximum canola seed yield at various locations in Canada where soil NO3-N only ranged from 6–34 kg ha−1 between 0–30-cm depth. Thus, the significant difference observed between average soil nitrogen (NO3-N) content, particularly early-season (Table 2) at NDSU (16–26 kg ha−1) and NW22 (148–193 kg ha−1) likely was a contributing factor to the greater seed yield observed for both sulfonylurea-resistant camelina and canola at NW22. However, because mean seed yield per plant at each location was similar for both sulfonylurea-resistant camelina and canola (Figure 4B), the increased seed yield at NW22 is more likely associated with the impact of soil nitrogen on increasing crop stem counts and biomass at NW22 (Figure 2).
3.5. Nutrient Retention
Both sulfonylurea-resistant camelina and canola retained significant levels of nutrient (N, P, K, and S) with or without herbicide treatment. Except for mean phosphorus content at NW22, mid- and late-season N, P, K, and S content was generally greater for canola compared with camelina at both NDSU and NW22 (Figure 5), which may be associated with the greater late-season biomass observed for canola compared with camelina at both locations (Figure 2C,D).
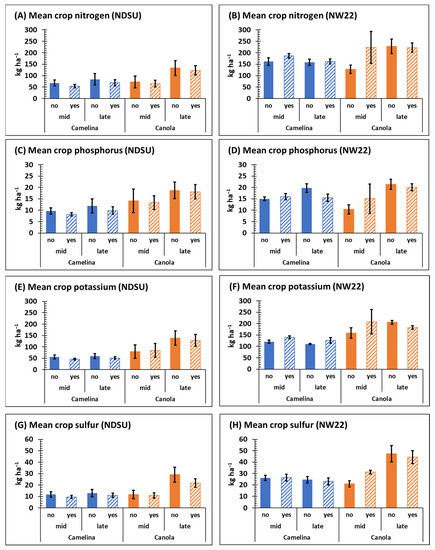
Figure 5.
Mean nutrient content of sulfonylurea-resistant camelina and canola mid- and late-season at NDSU and NW22 treated with (yes) or without (no) sulfonylurea; nitrogen (A,B), phosphorus (C,D), potassium (E,F), sulfur (G,H). Error bars represent the standard error of the mean.
3.6. Nitrogen-
At NDSU, crop (p ≤ 0.0069), time (p ≤ 0.0012) and C × T (p ≤ 0.038) were significant for N content, but not at NW22 (Table 1 and Table S4). Late-season mean N content in camelina ranged from 69–162 kg ha−1 at NDSU and NW22, respectively, whereas late-season mean N content for canola ranged from 123–228 kg ha−1 at NDSU and NW22, respectively (Figure 5A,B). Mean content of N mid- and late-season, respectively, was generally greater for both camelina and canola at NW22 than at NDSU (Figure 5A,B). At both locations, late-season N content of canola was significantly greater than mid-season N content, except for mid-season N content of canola treated with herbicide at NW22 (Figure 5A,B); however, herbicide was not a significant variable (Table 1).
Camelina is considered a great scavenger of soil NO3-N and provides environmental benefit by reducing potential leaching [25,26,57,58,59]. Likewise, in this study, sulfonylurea-resistant canola was equally effective at scavenging and retaining soil nitrogen (Figure S2). Indeed, plants in the Brassicaceae family have generally been classified as good to very good soil nitrogen scavengers [25,26,60]. Thus, the reduction in soil NO3-N levels observed late-season from camelina and canola field plots (Table 3) compared with early-season soil NO3-N levels (Table 2) could, in part, be attributed to NO3-N uptake by these two sulfonylurea-resistant species. Based on this data, these two non-transgenic species of sulfonylurea-resistant Brassicas could be good options for reducing nitrogen leaching in rotational cropping systems.
3.7. Phosphorus-
Crop (p ≤ 0.0002) was significant for phosphorus at NDSU and time (p ≤ 0.0252 and 0.0189, respectively) was significant for P at both locations (Table 1). Mean content of P in camelina ranged from 8.2–11.9 kg ha−1 at NDSU and 15–19.8 kg ha−1 at NW22, whereas the mean content of P in canola ranged from 13.3–18.7 kg ha−1 at NDSU and 10.4–21.5 kg ha−1 at NW22 (Figure 5B). At NW22, late-season mean P content of camelina, and canola was generally greater than at mid-season without herbicide (Figure 5C,D, Table S4), but herbicide was not a significant variable at either location (Table 1). A comparison of early- and late-season, respectively, soil P content at each location indicates that sulfonylurea-resistant camelina and canola did not appreciably change average soil P levels (Table 2 and Table 3).
3.8. Potassium-
Crop (p ≤ 0.0001), time (p ≤ 0.01) and C × T (p ≤ 0.03) were significant for K content at NDSU and crop (p ≤ 0.0008) was significant for K content at NW22 (Table 1). Content of K was greater for both crops at NW22 than observed at NDSU (Figure 5E,F). The mean content of K for camelina ranged from 46.3–59.7 kg ha−1 at NDSU and 114–140 kg ha−1 at NW22, whereas mean K content of for canola ranged from 84.7–128.6 kg ha−1 at NDSU and 158.9–208.3 kg ha−1 at NW22 (Figure 5E,F). Based on kg ha−1, canola retained significantly more K than camelina at NDSU both mid- and late-season, but the C × T mean was the only significant variable for K content of camelina and canola at NW22 (Table S4). As observed for soil P content early- and late-season, respectively, soil K content was not appreciably changed by sulfonylurea-resistant camelina or canola (Table 2 and Table 3).
3.9. Sulfur-
At both NDSU and NW22, respectively, crop (p ≤ 0.0010 and 0.001), time (p ≤ 0.0004 and 0.0012) and C × T (p ≤ 0.0021 and 0.0001) were significant for S content (Table 1). However, mean S content was greater for both crops at NW22 compared with NDSU (Figure 5G,H). The mean content of S from camelina ranged from 9.6–12.9 kg ha−1 at NDSU and 23.1–26.4 kg ha−1 at NW22, whereas the mean content of S for canola ranged from 20.8–29.1 kg ha−1 at NDSU and 20.9–47.3 kg ha−1 at NW22 (Figure 5G,H). Late-season mean S content and C × T mean S content was also greater in canola at both locations (Table S4). Early-season soil S content at NW22 was generally greater than at NDSU (Table 2). Because N:S ratio has been reported to be an important factor for seed yield in canola [56], the increased levels of both N and S at NW22 could be a factor associated with the greater seed yield at NW22 (Figure 4A). However, the increased levels of average soil S (SO4-S) late-season (Table 3), particularly at NW22 at 15–60 cm depth, compared with early-season (Table 2) at both locations could be due to organic matter mineralization during the season [61]. Additionally, most studies have not shown a seed yield response of camelina to sulfur fertilization [52,53].
Overall, the reason for the observed increase in nutrient content in camelina and canola at NW22 compared with NDSU both mid- and late-season is not clear, but early-season soil nutrient content at NW22, particularly for NO3-N and SO4-S (Table 2), may have been a contributing factor. The greater biomass dry weights observed at NW22 (Figure 2C,D) and the greater biomass plant−1 previously discussed also appear to be a related factor. This hypothesis also fits well with the increased nutrient content observed late-season in canola compared with camelina at both locations. Because crop retention of NO3-N did not differ appreciably between locations on a per plant bases (Figure S2), increased crop nutrient retention appears to be more closely associated with increased soil nutrient levels effecting crop stem counts and/or biomass at NW22. This hypothesis also fits well with the observed increased seed yield at NW22 (Figure 4A), as previously discussed.
4. Conclusions
In this study, sulfonylurea-resistant camelina and canola reduced late-season weed biomass by >75% and ≥60%, respectively, compared with fallow plots. Application of sulfonylurea herbicides to crops was not a significant factor for reducing weed pressure and generally had little impact on altering crop biomass, final seed yield, or nutrient retention. However, in some cases, herbicide treatment had an additive effect of reducing weed pressure over that of sulfonylurea-resistant camelina or canola alone. Thus, depending on the rotational cropping system and weed seed bank dynamics, sulfonylurea-resistant camelina and canola should provide additional options for integrated weed management approaches in the upper Midwest and northern Great Plains of the USA. Further research on the frequency and rate of sulfonylurea application could help to optimize best management practices for using these herbicide-resistant oilseed species in cropping systems.
Both sulfonylurea-resistant camelina and canola provided good soil nitrogen scavenging and could have great potential for reducing nutrient leaching in rotational cropping systems. The greater seed yield and nutrient retention observed for both species grown at NW22 appeared to be linked to greater early-season soil nutrient content impacting crop stem counts and biomass. Based on the ecosystem benefits observed in this study and the minimal impact of sulfonylurea herbicides on final season seed yield, these non-transgenic Brassica species appear to be excellent options for incorporating into rotational cropping systems. Additionally, the development of herbicide-resistant winter biotypes of camelina and canola might also be a benefit to rotational multi-cropping systems and provide superior ecosystem services and grain yields generally associated with winter cover/cash crops. In summary, these sulfonylurea-resistant varieties of camelina and canola should provide good non-GMO options for enhancing agricultural intensification practices in the Midwest and northern Great Plains of the U.S.A, while also meeting government mandates to reduce our environmental footprint.
Supplementary Materials
The following supporting information can be downloaded at: https://www.mdpi.com/article/10.3390/agronomy12112622/s1, Table S1. Mean weed stem counts (no. m−2) and weed biomass dry weights (kg DM m−2) mid- and late-season from plots of sulfonylurea-resistant camelina and canola treated with (yes) or without (no) herbicide and mean crop by time interaction (C × T) at two locations (NDSU and NW22). Fallow was not treated with herbicide. Table S2. Mean crop stem counts (no. m−2) and biomass dry weights (kg DM m−2) mid- and late-season from field plots of sulfonylurea-resistant camelina or canola treated with (yes) or without (no) sulfonylurea and mean crop by time interaction (C × T) at two locations (NDSU and NW22). Table S3. Final seasons mean seed yield (kg ha−1) from plots of sulfonylurea-resistant camelina or canola treated with (yes) or without (no) sulfonylurea herbicide and crop by herbicide. Table S4. Mean nutrient content of sulfonylurea-resistant camelina or canola mid- and late-season and crop by time interaction (C × T) at two locations (NDSU and NW22) for nitrogen (N), phosphorus (P), potassium (K), sulfur (S). Figure S1. Daily minimum (Min) and maximum (Max) temperature (Temp °C) and precipitation (Rainfall (mm)) during the 2020 growing season (May–August) obtained from the North Dakota Agricultural Weather Network station located in Fargo, ND (https://ndawn.ndsu.nodak.edu/station-info.html?station=23, accessed 18 October 2022). Figure S2. Nutrient content (NO3-N) of sulfonylurea-resistant camelina and canola mid- and late-season at NDSU and NW22 treated with (yes) or without (no) sulfonylurea; kg ha−1 (A and B) and g plant−1 (C and D). Error bars represent the standard error of the mean.
Author Contributions
Conceptualization, J.V.A. and K.H.; Methodology, J.V.A., B.B.B., K.H., J.M. and M.T.B.; Validation, J.V.A., B.B.B. and M.T.B.; Formal Analysis, J.V.A., M.T.B. and B.B.B.; Investigation, J.V.A. and B.B.B.; Resources, J.V.A., K.H. and M.T.B.; Data Curation, J.V.A., M.T.B. and B.B.B.; Writing—Original Draft Preparation, J.V.A.; Writing—Review and Editing, J.V.A., M.T.B., K.H., B.B.B. and J.M.; Supervision, J.V.A. and K.H.; Project Administration, J.V.A.; Funding Acquisition, J.V.A. All authors have read and agreed to the published version of the manuscript.
Funding
This work was funded by U.S. Department of Agriculture-Agricultural Research Service in-house CRIS project# 3060–21220-033–000D-Biology of Weed-Crop Interactions to Improve Weed Management Strategies in Northern Agro-ecosystems.
Data Availability Statement
Not applicable.
Acknowledgments
Mention of trade names or commercial products in this publication is solely for the purpose of providing specific information and does not imply recommendation or endorsement by the U.S. Department of Agriculture. USDA is an equal opportunity provider and employer.
Conflicts of Interest
The authors declare no conflict of interest.
References
- Anderson, J.V. Emerging technologies: An opportunity for weed biology research. Weed Sci. 2008, 56, 281–282. [Google Scholar] [CrossRef]
- Smith, P. Delivering food security without increasing pressure on land. Glob. Food Sec. 2013, 2, 18–23. [Google Scholar] [CrossRef]
- USDA, Agricultural Innovation Agenda. 2021. Available online: https://www.usda.gov/aia. (accessed on 30 August 2022).
- Tataridas, A.; Kanatas, P.; Chatzigeorgiou, A.; Zannopoulos, S.; Travlos, I. Sustainable crop and weed management in the era of the EU green deal: A survival guide. Agronomy 2022, 12, 589. [Google Scholar] [CrossRef]
- Thaler, E.A.; Larsen, I.J.; Yu, Q. The extent of soil loss across the US Corn Belt. Proc. Natl. Acad. Sci. USA 2021, 118, e1922375118. [Google Scholar] [CrossRef]
- Tiefenbacher, A.; Sandén, T.; Haslmayr, H.P.; Miloczki, J.; Wenzel, W.; Spiegel, H. Optimizing carbon sequestration in croplands: A synthesis. Agronomy 2021, 11, 882. [Google Scholar] [CrossRef]
- Heaton, E.A.; Schulte, L.A.; Berti, M.; Langeveld, H.; Zegada-Lizarazu, W.; Parrish, D.; Monti, A. Managing a second-generation crop portfolio through sustainable intensification: Examples from the USA and the EU. Biofuels. Bioprod. Bioref. 2013, 7, 702–714. [Google Scholar] [CrossRef]
- Heggenstaller, A.H.; Anex, R.P.; Liebman, M.; Sundberg, D.N.; Gibson, L.R. Productivity and nutrient dynamics in bioenergy double-cropping systems. Agron. J. 2008, 6, 1740–1748. [Google Scholar] [CrossRef]
- Gesch, R.W.; Archer, D.W. Double-cropping with winter camelina in the northern Corn Belt to produce fuel and food. Ind. Crops Prod. 2013, 44, 718–725. [Google Scholar] [CrossRef]
- Gesch, R.W.; Mohammed, Y.A.; Walia, M.K.; Hulke, B.; Anderson, J.V. Double-cropping early maturing sunflower after winter camelina. Ind. Crops Prod. 2022, 181, 114811. [Google Scholar] [CrossRef]
- Gesch, R.; Archer, D.W.; Berti, M.T. Dual cropping winter camelina with soybean in the northern Corn Belt. Agron. J. 2014, 106, 1735–1745. [Google Scholar] [CrossRef]
- Anderson, J.V.; Horvath, D.P.; Doğramacı, M.; Dorn, K.M.; Chao, W.S.; Watkin, E.; Marks, M.D.; Gesch, R. Expression of FLOWERING LOCUS C and a frameshift mutation of this gene on chromosome 20 differentiate a summer- and winter-annual biotype of Camelina sativa. Plant Direct 2018, 2, e00060. [Google Scholar] [CrossRef]
- Kebede, B.; Thiagarajah, M.; Zimmerli, C.; Rahman, M.H. Improvement of open-pollinated spring rapeseed (Brassica napus L.) through introgression of genetic diversity from winter rapeseed. Crop Sci. 2010, 50, 1236–1243. [Google Scholar] [CrossRef]
- Wittenberg, A.; Anderson, J.V.; Berti, M. Winter and summer annual biotypes of camelina have different morphology and seed characteristics. Ind. Crops Prod. 2019, 135, 230–237. [Google Scholar] [CrossRef]
- Myers, R.; Weber, A.; Tellatin, S. Cover Crop Economics: Opportunities to Improve your Bottom Line in Row Crops. SARE Technical Bulletin, US Department of Agriculture, National Institute of Food and Agriculture. 2019. Available online: https://www.sare.org/Learning-Center/Bulletins/Cover-Crop-Economics. (accessed on 30 August 2022).
- Asaduzzaman, M.; Pratley, J.E.; An, M.; Luckett, D.J.; Lemerle, D. Canola interference for weed control. Springer Sci. Rev. 2014, 2, 63–74. [Google Scholar] [CrossRef]
- Beckie, H.J.; Johnson, E.N.; Blackshaw, R.E.; Gan, Y. Weed suppression by canola and mustard cultivars. Weed Tech. 2008, 22, 182–185. [Google Scholar] [CrossRef]
- Berti, M.; Gesch, R.; Eynck, C.; Anderson, J.V.; Cermak, S. Camelina uses, genetics, genomics, production, and management. Ind. Crops Prod. 2016, 94, 690–710. [Google Scholar] [CrossRef]
- Berti, M.T.; Samarappuli, D.; Peterson, A.; Cabello, S.; Andersen, B.; Wittenberg, A.; Mozea, K.; Ransom, J.; Schmitt, M.; Kandel, H.; et al. MCCC-North Dakota Annual Report. 2020. Available online: https://mccc.msu.edu/wp-content/uploads/2020/03/ND_2019_MCCC_-North-Dakota-Report.pdf. (accessed on 30 August 2022).
- Blanco-Canqui, H.; Shaver, T.M.; Lindquist, J.L.; Shapiro, C.A.; Elmore, R.W.; Francis, C.A.; Hergert, G.W. Cover crops and ecosystem services: Insights from studies in temperate soils. Agron. J. 2015, 107, 2449–2474. [Google Scholar] [CrossRef]
- Eberle, C.A.; Thom, M.D.; Nemec, K.T.; Forcella, F.; Lundgren, J.G.; Gesch, R.W.; Riedell, W.E.; Papeiernik, S.K.; Wagner, A.; Peterson, D.H.; et al. Using pennycress, camelina, and canola cash cover crops to provision pollinators. Ind. Crops Prod. 2015, 75, 20–25. [Google Scholar] [CrossRef]
- Forcella, F.; Patel, S.; Lenssen, A.W.; Hoerning, C.; Wells, M.S.; Gesch, R.W.; Berti, M.T. Weather and landscape influences on pollinator visitation of flowering winter oilseeds (field pennycress and winter camelina). J. Appl. Entomol. 2021, 145, 286–294. [Google Scholar] [CrossRef]
- Hoerning, C.; Wells, M.S.; Gesch, R.; Forcella, F.; Wyse, D. Yield tradeoffs and weed suppression in a winter annual oilseed relay-cropping system. Agron. J. 2020, 112, 2485–2495. [Google Scholar] [CrossRef]
- Saucke, H.; Ackermann, K. Weed suppression in mixed cropped grain peas and false flax (Camelina sativa). Weed Res. 2006, 46, 453–461. [Google Scholar] [CrossRef]
- Weyers, S.; Thom, M.; Forcella, F.; Eberle, C.; Matthees, H.; Gesch, R.; Ott, M.; Feyereisen, G.; Strock, J.; Wyse, D. Reduced potential for nitrogen loss in cover crop–soybean relay systems in a cold climate. J. Environ. Qual. 2019, 48, 660–669. [Google Scholar] [CrossRef]
- Weyers, S.L.; Gesch, R.W.; Forcella, F.; Eberle, C.A.; Thom, M.D.; Matthees, H.L.; Ott, M.; Feyereisen, W.G.; Strock, J. Surface runoff and nutrient dynamics in cover crop-soybean systems in the Upper Midwest. J. Environ. Qual. 2021, 50, 158–171. [Google Scholar] [CrossRef]
- Wallander, S.; Smith, D.; Bowman, M.; Claassen, R. Cover crop trends, programs and practices in the United States. EIB 222, U.S. Department of Agriculture, Economic Research Service. 2021. Available online: https://ers.usda.gov/webdocs/publications/100551/eib-222.pdf?v=8830 (accessed on 30 August 2022).
- Thompson, N.M.; Reeling, C.J.; Fleckenstein, M.R.; Prokopy, L.S.; Armstrong, S.D. Examining intensity of conservation practice adoption: Evidence from cover crop use on U.S. Midwest farms. Food Policy 2021, 101, 102054. [Google Scholar] [CrossRef]
- Bridges, D.C. Impact of weeds on human endeavors. Weed Tech. 1994, 8, 392–395. [Google Scholar] [CrossRef]
- Gianessi, L.P.; Reigner, N.P. The value of herbicides in U.S. crop production. Weed Tech. 2007, 21, 559–566. [Google Scholar] [CrossRef]
- Pimentel, D.; McNair, S.; Janecka, J.; Wightman, J.; Simmonds, C.; O’Connell, C.; Wong, E.; Russel, L.; Zern, J.; Aquino, T.; et al. Economic and environmental threats of alien plant, animal, and microbe invasion. Agric. Ecosyst. Environ. 2001, 84, 1–20. [Google Scholar] [CrossRef]
- Kaye, J.P.; Quemada, M. Using cover crops to mitigate and adapt to climate change. A review. Agron. Sustain. Dev. 2017, 37, 4. [Google Scholar] [CrossRef]
- Sharma, P.; Singh, A.; Kahlon, C.; Brar, A.; Grover, K.; Dia, M.; Steiner, R. The Role of Cover Crops towards Sustainable Soil Health and Agriculture—A Review Paper. Am. J. Plant Sci. 2018, 9, 1935–1951. [Google Scholar] [CrossRef]
- Abdalla, M.; Hastings, A.; Cheng, K.; Yue, Q.; Chadwick, D.; Espenberg, M.; Truu, J.; Rees, R.M.; Smith, P. A critical review of the impacts of cover crops on nitrogen leaching, net greenhouse gas balance and crop productivity. Glob. Chang. Biol. 2019, 25, 2530–2543. [Google Scholar] [CrossRef]
- Knezevic, S.Z.; Cassman, K.G. Use of herbicide-tolerant crops as a component of an integrated weed management program. Crop Manag. 2003, 2, 1–7. [Google Scholar] [CrossRef][Green Version]
- Dekker, J.; Duke, S.O. Herbicide-resistant field crops. Adv. Agron. 1995, 54, 69–116. [Google Scholar] [CrossRef]
- Zimdahl, R.L. Development of herbicides after 1945. In A History of Weed Science in the United States; Zimdahl, R.L., Ed.; Elsevier: Amsterdam, The Netherlands, 2010; pp. 97–113. [Google Scholar] [CrossRef]
- Shaner, D.L. Herbicide Handbook, 10th ed.; Weed Science Society of America: Lawrence, KS, USA, 2014; p. 513. [Google Scholar]
- Russell, M.H.; Saladini, J.L.; Lichtner, F. Sulfonylurea herbicides. Pestic. Outlook 2002, 13, 166–173. [Google Scholar] [CrossRef]
- Zhao, W.; Xu, L.; Li, D.; Li, X.; Wang, C.; Zheng, M.; Pan, C.; Qiu, L. Biodegradation of thifensulfuron-methyl by Ochrobactrum sp. in liquid medium and soil. Biotechnol. Lett. 2015, 37, 1385–1392. [Google Scholar] [CrossRef] [PubMed]
- Zhu, C.; Zhang, C.; Zhang, M.; Wu, Y.; Zhang, Z.; Zhang, H. Degradation characteristics and soil remediation of thifensulfuron-methyl by immobilized Serratia marcecens N80 beads. Environ. Technol. Innovat. 2021, 24, 102059. [Google Scholar] [CrossRef]
- Berti, M.T.; Wilckens, R.; Fischer, S.; Solis, A.; Gonzalez, W.; Johnson, B.L. Seeding date influence on camelina seed yield, yield components, and oil content in Chile. Ind. Crops Prod. 2011, 34, 1358–1365. [Google Scholar] [CrossRef]
- Sobiech, L.; Grzanka, M.; Kurasiak-Popowska, D.; Radzikowska, D. Phytotoxic effect of herbicides on various camelina [Camelina sativa (L.) Crantz] genotypes and plant chlorophyll fluorescence. Agriculture 2020, 10, 185. [Google Scholar] [CrossRef]
- Jha, P.; Stougaard, R.N. Camelina (Camelina sativa) tolerance to selected preemergence herbicides. Weed Tech. 2013, 27, 712–717. [Google Scholar] [CrossRef]
- Leclère, M.; Loyce, C.; Jeuffroy, M.H. Growing camelina as a second crop in France: A participatory design approach to produce actionable knowledge. Eur. J. Agron. 2018, 101, 78–89. [Google Scholar] [CrossRef]
- Hubert, S.H.; Craine, W.; Pan, W.L. Registration of WA-HT1, a camelina line with resistance to residual levels of ALS inhibitor herbicides. J. Plant Regist. 2018, 12, 253–256. [Google Scholar] [CrossRef]
- Walsh, D.T.; Babiker, E.M.; Burke, I.C.; Hulbert, S.H. Camelina mutants resistant to acetolactate synthase inhibitor herbicides. Mol. Breed. 2012, 30, 1053–1063. [Google Scholar] [CrossRef]
- Robin, M. Herbicide-Tolerant Camelina Now Available. The Western Producer 2021. Available online: https://www.producer.com/crops/herbicide-tolerant-camelina-now-available/ (accessed on 30 August 2022).
- Gesch, R.W.; Long, D.S.; Palmquist, D.E.; Allen, B.L.; Archer, D.W.; Brown, J.; Davis, J.B.; Hatfield, J.L.; Jabro, J.D.; Kiniry, J.R.; et al. Agronomic performance of Brassicaceae oilseeds in multiple environments across the Western USA. BioEnergy Res. 2019, 12, 509–523. [Google Scholar] [CrossRef]
- USDA NASS, Crop Production 2019 Summary-January 2020. 2019. Available online: https://www.nass.usda.gov/Publications/Todays_Reports/reports/cropan20.pdf. (accessed on 30 August 2022).
- Jankowski, K.J.; Sokolski, M.; Kordan, B. Camelina: Yield and quality response to nitrogen and sulfur fertilization in Poland. Ind. Crops Prod. 2019, 141, 111776. [Google Scholar] [CrossRef]
- Solis, A.; Vidal, I.; Paulino, L.; Johnson, B.L.; Berti, M.T. Camelina seed yield response to nitrogen, sulfur, and phosphorus fertilizer in South Central Chile. Ind. Crops Prod. 2013, 44, 132–138. [Google Scholar] [CrossRef]
- Malhi, S.S.; Johnson, E.N.; Hall, L.M.; May, W.E.; Phelps, S.; Nybo, B. Effect of nitrogen fertilizer application on seed yield, N uptake, and seed quality of Camelina sativa. Can. J. Soil Sci. 2014, 94, 35–47. [Google Scholar] [CrossRef]
- Obeng, E.; Obour, A.K.; Nelson, N.O.; Ciampitti, I.A.; Wang, D. Nitrogen and sulfur application effects on camelina seed yield, fatty acid composition, and nutrient removal. Can. J. Plant Sci. 2021, 101, 353–365. [Google Scholar] [CrossRef]
- Jankowski, K.J.; Sokólski, M. Spring camelina: Effect of mineral fertilization on the energy efficiency of biomass production. Energy 2021, 220, 119731. [Google Scholar] [CrossRef]
- Karamanos, R.E.; Goh, T.B.; Poisson, D.P. Nitrogen, phosphorus, and sulfur fertility of hybrid canola. J. Plant Nutr. 2005, 28, 1145–1161. [Google Scholar] [CrossRef]
- Berti, M.T.; Samarappuli, D.; Johnson, B.L.; Gesch, R.W. Integrating winter camelina into maize and soybean cropping systems. Ind. Crops. Prod. 2017, 107, 595–601. [Google Scholar] [CrossRef]
- Peterson, A.; Samarappuli, D.; Berti, M.T. Intersowing cover crops into standing soybean in the US Upper Midwest. Agronomy 2019, 9, 264. [Google Scholar] [CrossRef]
- Wittenberg, A.; Anderson, J.V.; Berti, M. Crop growth and productivity of winter camelina to sowing date in North Dakota. Ind. Crops Prod. 2020, 158, 113036. [Google Scholar] [CrossRef]
- Managing Cover Crops Profitably; Clark, A., Ed.; Diane Publishing: Collingdale, PA, USA, 2008; Available online: https://www.sare.org/wp-content/uploads/Managing-Cover-Crops-Profitably.pdf (accessed on 30 August 2022).
- Mahal, N.K.; Sawyer, J.E.; Iqbal, J.; Sassman, A.M.; Mathur, R.; Castellano, M.J. Role of sulfur mineralization and fertilizer source in corn and soybean production systems. Soil Sci. Soc. Am. J. 2022, 86, 1058–1071. [Google Scholar] [CrossRef]


Publisher’s Note: MDPI stays neutral with regard to jurisdictional claims in published maps and institutional affiliations. |
© 2022 by the authors. Licensee MDPI, Basel, Switzerland. This article is an open access article distributed under the terms and conditions of the Creative Commons Attribution (CC BY) license (https://creativecommons.org/licenses/by/4.0/).