Article

Pruning and Water Saving Management Effects on Mango High-Density and Mature Orchards

by
Federico Hahn
1,*,
Salvador Valle
2 and
Carmen Navarro-Gómez
3
1
Irrigation Department, Universidad Autonoma Chapingo, Texcoco C.P. 56230, Estado de Mexico, Mexico
2
Agroindustry Department, Universidad Autonoma Chapingo, Texcoco C.P. 56230, Estado de Mexico, Mexico
3
Engineering Department, Circuito Universitario, Universidad Autonoma Chihuahua, Chihuahua C.P. 31125, Chihuahua, Mexico
*
Author to whom correspondence should be addressed.
Agronomy 2022, 12(11), 2623; https://doi.org/10.3390/agronomy12112623
Submission received: 8 September 2022 / Revised: 6 October 2022 / Accepted: 9 October 2022 / Published: 25 October 2022
(This article belongs to the Special Issue Sustainable Agronomical Practices for Saving Water Supply)

Abstract

:
Water is getting scarce and irrigation practices should become more efficient. Mango orchards require great quantities of water, and policies in developing countries are substituting surface gravity irrigation by pressurized systems. A commercial orchard having mature 25-year-old trees and a 10-year-old HD high-density section were irrigated with micro sprinklers using 100% ETc (crop evapotranspiration) and reduced deficit irrigation treatments of 75% and 50% ETc. Water soil measurements were made with EC-5 probes at 10 and 35 cm in depth to study the effect of the different irrigation treatments. After the 2020 harvest, mature trees were trimmed without achieving pruning severity greater than 1.3. Canopy volume, mango size, fruit yield and water-use efficiency WUE were analyzed during 2020 and 2021. Sporadic storms produced sprinkler watering problems as weeds proliferated within trees. A controller with a fuzzy algorithm optimized orchard management and saved water in trees without decreasing yield and fruit size. It was found that one year after mature trees were trimmed by taking away the larger internal branch, more light penetrated the canopy, increasing yield by 60%; pruning in HD trees presented a yield increase of 5.37%. WUE (water-use efficiency) also increased with pruning and its value increased to 87.6 when the fuzzy controller and the 50% DI treatments were used in mature trees. This value was 260% greater than the one obtained in pruned trees without the controller. HD trees presented a lower WUE and yield per hectare than mature trees.

1. Introduction

Seventy percent of the world’s total freshwater is used by agriculture [1]. Water is becoming scarce as the world’s population increases, but if proper technologies are used basic crops could be produced by 2050 [2]. Brazil, having the largest amount of fresh water in the world, uses 68.4 billion liters per day to irrigate their crops [3]. Worldwide irrigated rice-farming covers 93 million hectares and consumes up to 30% of the world’s freshwater extraction [4]. Water resources are classified as green and blue water, with green water being obtained from precipitation. It is deposited in the soil and returned back to the atmosphere through evaporation from crops and trees [5]. Rain grown crops used in developing countries uses green water, but due to climate change irrigated crops and trees must use both types of water.
The main irrigation method in developing countries is surface gravity, as it is a cheap alternative to provide water to plants with regular efficiency [6]. It was reported in Australia that during 2013–2014, it accounted for 59% of the irrigated land [7]. Mexico has 6.64 million hectares of irrigated land, with 3.5 million distributed within 85 irrigation districts [8]. Inadequate surface irrigation causes partial land flooding with disturbing consequences for soil and crop [9].
Irrigation technology is being used in many orchards and vegetable farms, using sprinkler and drip pressurized systems [10,11]. Deficit irrigation strategies preserve water rates below the projected evapotranspiration improving water-use efficiency [12,13,14]. The two known systems for water quantity reduction are sustained deficit irrigation (SDI) and regulated deficit irrigation (RDI). SDI does not take into account the plant phenological period and water application is a percentage of ETc. RDI supplies the water required by the plant so that 100% of ETc can be applied to plant less tolerant to water stress [15]. RDI requires sensors to know the plant hydric status. In variable rainfall distribution areas, plants with an enhanced tolerance together with deficit irrigation programs should be used to guarantee a stable yield [16].
Constant water reduction can be applied throughout the entire season, or during short watering periods. Deficit irrigation strategies require farm automation to optimize water-use efficiency (WUE) [17,18,19,20,21]. Automation makes irrigation scheduling possible, but its programming depends on the knowledge of how the plants use water. Several environmental parameters should be considered, together with the plant phenological stage. Ground scheduling methods based on plant and evapotranspiration measurements were expensive at the beginning of this century [22]. Currently, the IoT for small orchards has several new and cheaper sensors that can be used during optimal irrigation scheduling [23,24,25,26]. Remotely sensed data with drones [27,28] and satellites can estimate crop or plant water status to plan plant irrigation at greater scales [29,30,31].
Mango (Mangifera indica L.) was the sixth most produced tropical fruit (56 million tonyear−1) in the world in 2019 [32]. Mango exportation requires irrigation [33], as a water shortage reduces flushes during vegetative growth and yield; fruit is the main sink in tree growth as water enhances this [34]. Application of RDI at 50 and 75% ETc for fruit set in Tommy Atkins trees caused a drop in production [35]. The effects of sustained deficit irrigation on mango size and quality has been studied [32]. Fruit size decreased as less water was applied and peel color varied after two weeks of storage. In Granada, Spain, mangoes have been planted in orchard terraces [36]. In mango tree orchards, the highest yield and water-use efficiency were obtained with 50% ETc. Yield was strongly correlated with the number of fruits and not with fruit size [36]. Daily irrigation and reduced deficit irrigation (RDI) were applied to mango bearing trees in Mexico [37]. A reduced deficit irrigation of 50% ETc was applied to the trees one day at sunset for half an hour and kept them without water the next [37].
Tree management is fundamental for increasing yield and WUE. Intense pruning stimulates mango tree vegetative growth, increasing the probability of bud break and the number of new growth units [38]. The loss of apical vertical branches and canopy stimulates lateral bud growth [38]. As pruning favors intense vegetative growth, it leads to a decrease in the number of inflorescences produced by the growth units. As flowering is disturbed, it can cause several flushes instead of a periodic annual cycle. Best light distribution occurs when all areas of the tree have access to at least 25% of available sunlight [39]. Sunlight enhances the quality and color of fruits [40], so fruits at the top of the tree always have better quality than fruits in the lower sections of the tree [41]. Ground cover factor (GCF) is a variable associated with canopy size and provides the solar radiation percentage captured by plants for evapotranspiration [42]. High-density HD trees (2.5 m × 2.5 m) have shown a drop in yield due to canopy crowding [43]. In Australia, leaf area dropped after pruning from 76.41 m2 to 42.28 m2 for high-density mango trees keeping a height of 2.75 m [44].
Producers have to be ready under the climate changes that bring storms one year and drought the next. Freshwater nowadays is limited for irrigation and requires better water usage by producers. The aim of this work is to optimize water usage and provide producers with the latest technology to save water. Two sustained deficit irrigations were applied (50 and 75% ETc) and compared against 100% ETc during the entire season from flowering to fruit ripening. As a higher yield and a better use of water for tall mature trees is desired, cultural practices such as pruning were considered. Storms affect superficial irrigation systems as weeds proliferate at the tree’s surface and thus water is not efficiently utilized. An intelligent controller was tested to optimize water usage.

2. Materials and Methods

A field experiment was conducted during 2020–2021 in a commercial mango orchard located in Loma Bonita (17°25′47″ N, −101°11′19″ W, 17 m ASL), in the state of Guerrero, Mexico. The orchard presented 25- and 35-year-old trees and some sections being rejuvenated with high-density planting. Old trees were planted with the traditional 10 × 10 m spacing, so 100 trees were grown per hectare, Figure 1. The trees referred as high-density were 10 years old by 2020.
Trees were grown in a basaltic clay loam red soil, having an average density of 1.1 gcm−3 [37]. The top layer of 3 cm around the trees was covered by organic soil obtained from composting organic matter, falling leaves and branches. After harvest, before pruning takes place, NPK fertilizer (250 g N, 70 g P2O5 and 210 g K2O) were applied to each tree. Three kilograms of granular fertilizer was manually applied to each mature tree within a circular groove, 250 cm around the tree trunk. The 5 cm wide groove was 5 cm deep. High-density trees planted had 800 cm between each row and 400 cm in-row spacing giving a total of 315 trees ha−1. One kilogram of the same granular fertilizer was applied to high-density trees. The fertilizer was evenly applied within a circular groove with a radius of 1.5 m centered at the tree trunk.

2.1. Weather Conditions

A weather station (Vantage Pro2, Davies Instrument, CA, USA) located in the orchard acquired the meteorological variables during both seasons. Mean annual rainfall was 1325 mm in 2020 and 1470 mm in 2021. Average rainfall during the last 5 years was 1310 mm. The winter and spring were dry (15 December to 31 May), meanwhile the rain season received 150 mm during each summer month. The weather station took raining measurements during 2020 and 2021, Figure 2a. Rain events during 2021 are highlighted by black lines, Figure 2b, meanwhile blue squares indicate raining days during 2020. At the end of the fruit-drop period (F-drop) rain took place during May 2021, Figure 2b. Mango fruits reached an average weight of 450 g, mainly due to the rain events during May and mid-June of both seasons.
Climatic conditions during 2020 and 2021 presented air temperature values within 7 and 38 °C, being colder during the nights of January and February of both years. Maximum average relative humidity of 93.8% was found before sunset in February 2020 and April 2021.

2.2. Irrigation System

A three-phase submersible deep-well pump (mod. 5FA15S4-PE, Franklin Control Systems, OR, USA) provided the water for irrigation, Figure 3a. The 1.5 HP pump delivered 1.5 l s−1 to the micro-sprinkler irrigation system. A timer turns on a solenoid valve during the programmed periods, Figure 3b.
Irrigation water for proper mango production varies during each phenological cycle. The phenological cycles are flowering, fruit drop, fruit growth and harvest [45]. After three months of water shortage during winter, flowering takes place naturally, starting with the irrigation cycle. Water interruption limits vegetative growth and stresses mango trees. After flowering and fruit set, a fruit-drop period of one month takes place. Fruit expansion and ripening continues for 45 days during the hot spring season, and trees require much more water prior to harvest. After harvest, irrigation is used to enhance vegetative growth when rainfall is not present.

2.2.1. Irrigation Treatments for High-Density Trees

A 0.15 m deep circular furrow retained water beneath the tree canopy. The furrow presented soil cover around the trunk to avoid direct water contact. According to tree size and age, 55 L day−1 was recommended from flowering to fruit ripening. Water was delivered by one 120 L h−1 micro-sprinkler installed at a distance of 1.5 m from the tree trunk. Micro-sprinkler irrigation maintained the soil beneath the trees wet and was controlled by automatic timers set to operate at 18:00 for 30 min, avoiding soil transpiration.
Three treatments of ten trees each (red circle, Figure 1) were used during the seasons of 2020 and 2021. The trees were ten years old in 2020 and named throughout the paper as high-density HD trees. Ten 100% DI trees were irrigated daily for 100 days from flowering until harvest, receiving 60 L daily. Ten trees received reduced irrigation (RDI1 = 45 L day−1) during the same time at 18:00 daily. The RDI2 treatment applied only 30 L daily to ten trees. There was a difference in the irrigation start date for both seasons. Blooming in all trees appeared in the 24 March during 2020, meanwhile a year later it started on the 25 of April 2021. It is important to mention that the trees under the reduced treatments were under the same treatment since 2018.
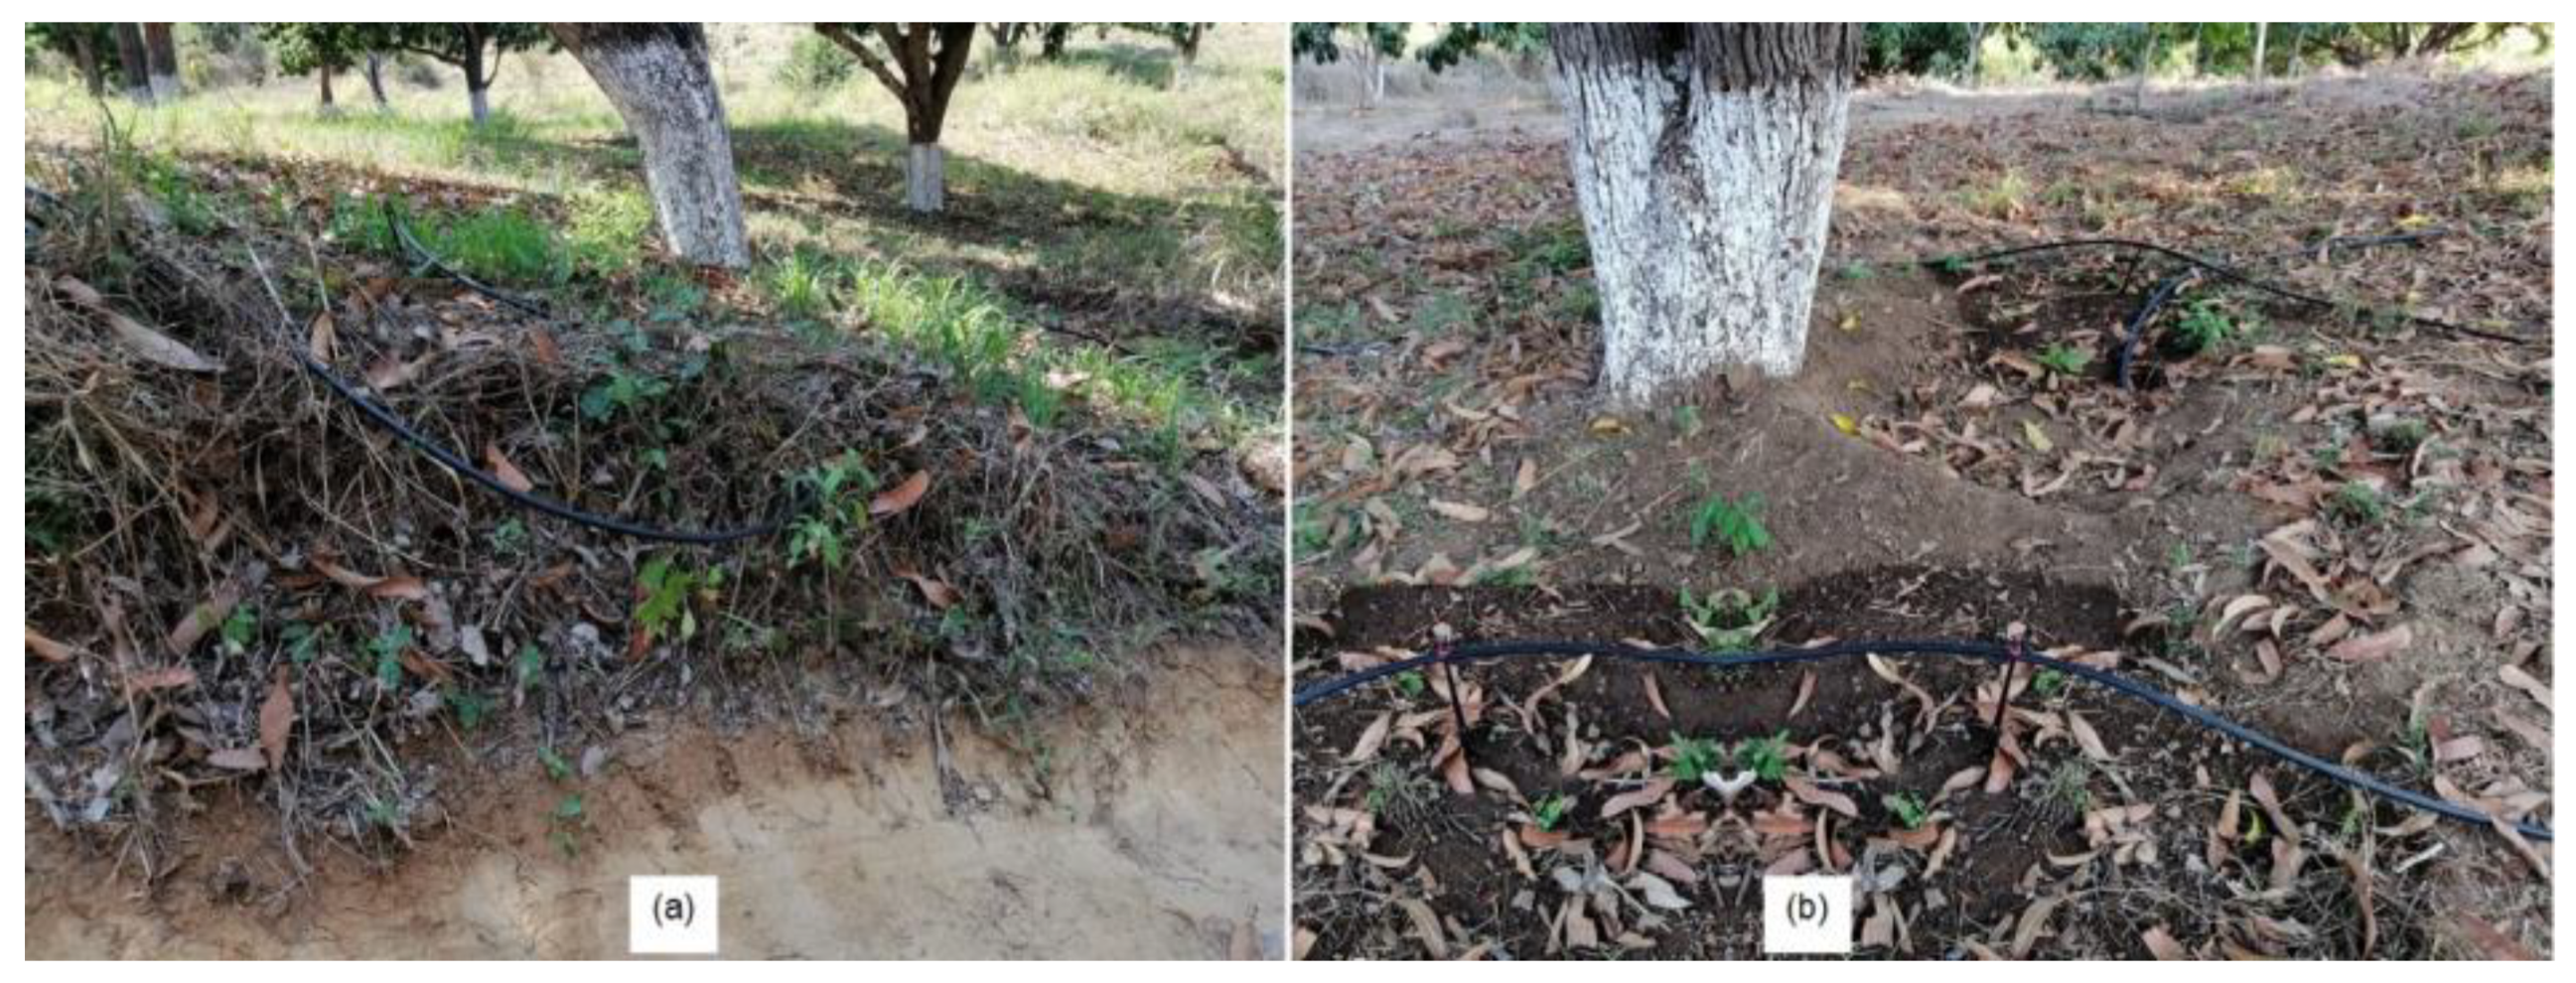
The circular furrow received water daily during the fruit-drop period (Figure 4a), with a dry soil cover being noted around the furrow due to the warm weather conditions. Irrigation filled the circular furrow daily during the fruit growth and expansion period, Figure 4c. After storms irrigation was not required as weeds may grow over the soil cover, Figure 4b.

2.2.2. Irrigation Treatments for Mature Trees

Mature trees have to be watered with 200 L day−1. The use of only one lateral with micro-sprinklers between plants presented a lower fruit yield than when two laterals closer to the trees were used [46]. Santos et al., 2013 [47] reported the use of two lateral hoses fixed two meters away from the tree trunks. Each hose had three micro-sprinklers to cover the area beneath the tree canopy. Lateral black polyethylene pipes become damaged at high temperatures after being exposed continuously to sunshine [48]. As the dripper is placed beneath sun exposure and low soil cover, evaporation takes place over the soil surface [49]. Tree shade helps to maintain black polyethylene pipes in good condition for 3 or 4 years.
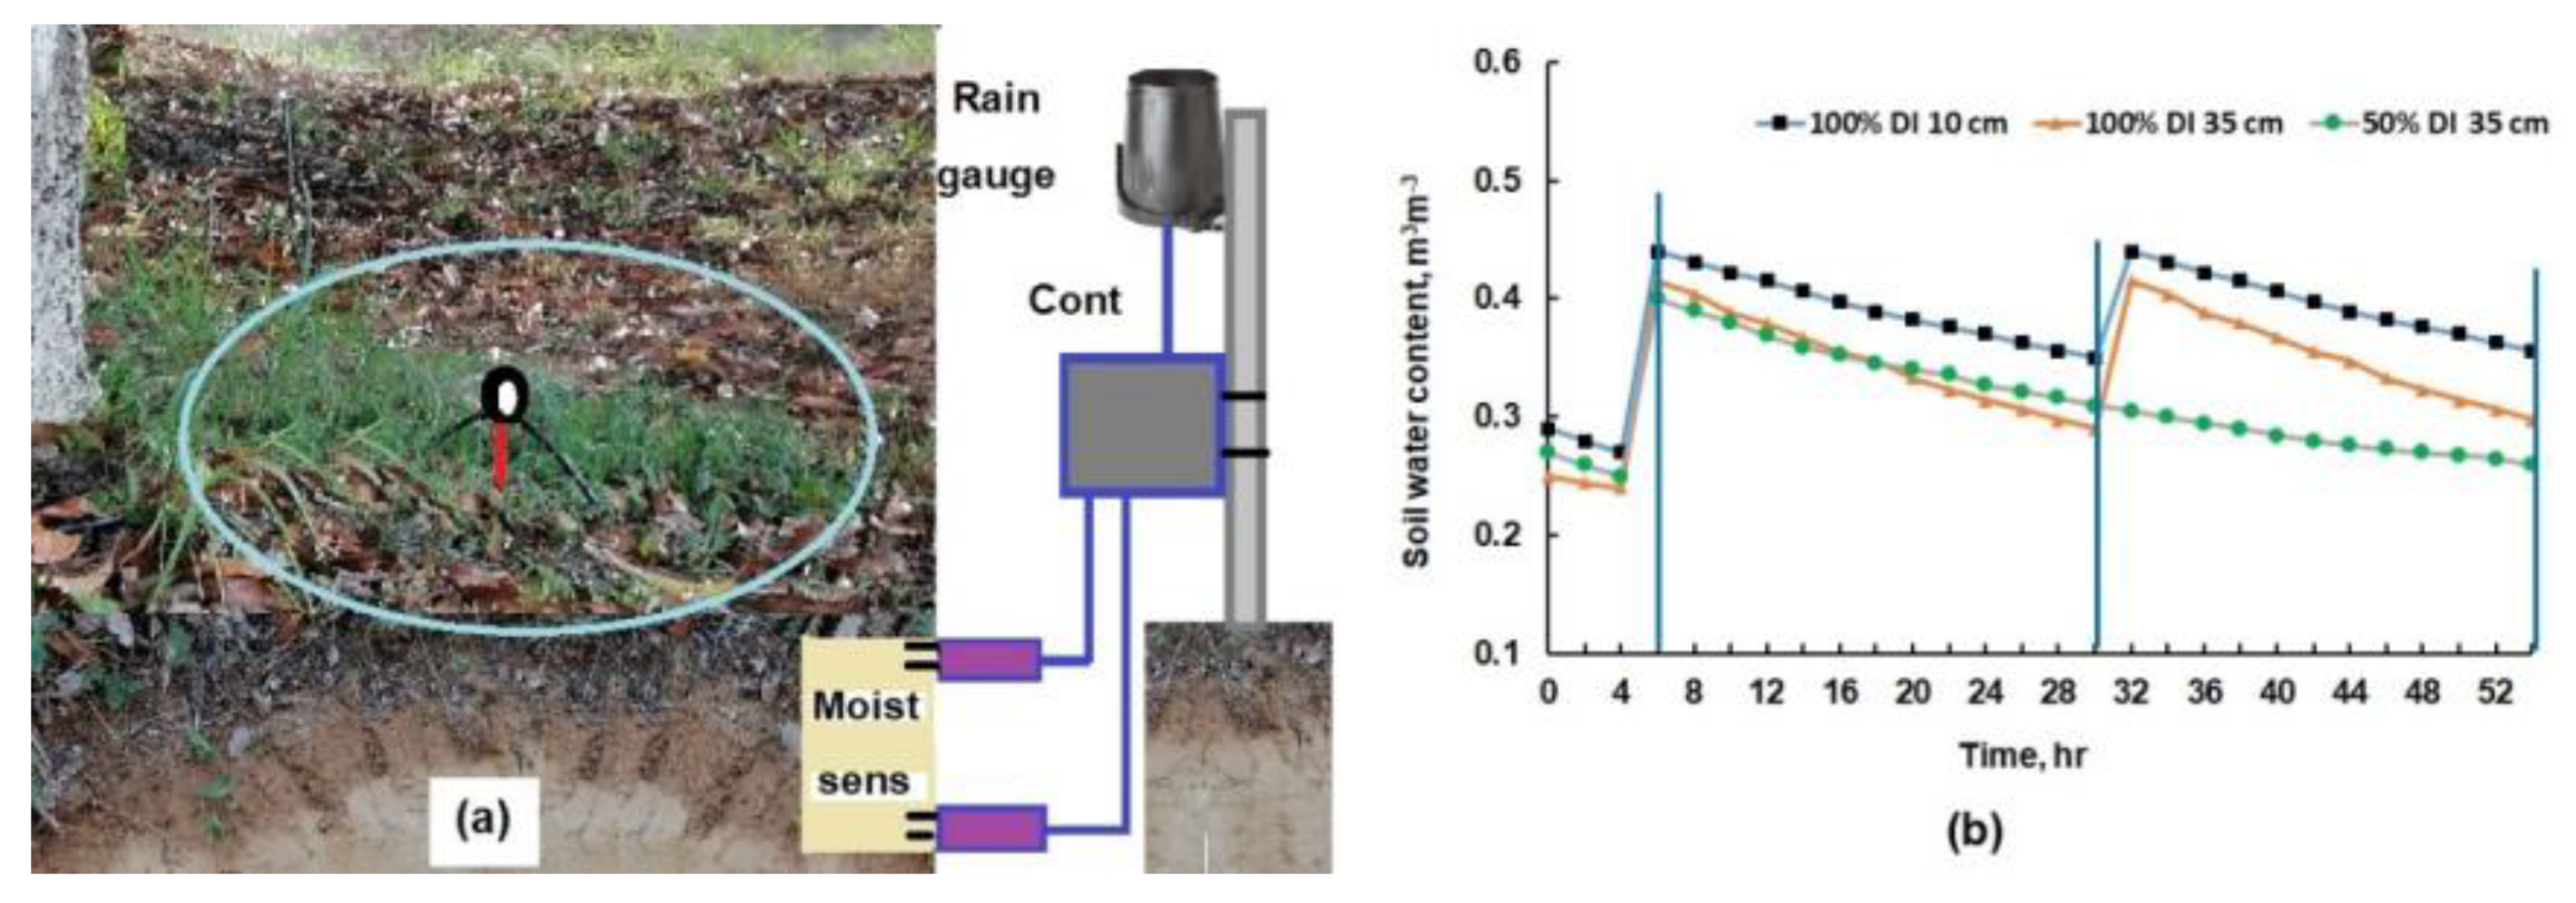
These micro-sprinklers (mod. Aquamaster 2005, NaanDanJain Ltd., Tel Aviv, Israel) watered a soil area of 50 square meters beneath the canopy. Each 120 L h−1 sprinkler moistened an area of 4.9 m2 (2.5 m diameter). The consultants [50] recommended a 4 × 4 system to irrigate each tree providing a precipitating rate of 7.5 mm h−1. Nevertheless, some leaves became stressed as the wetted area was insufficient. With a 6 × 6 array of micro-sprinklers (120 L h−1 each), 360 L day−1 of water was applied after 30 min of operation. This was too much water so smaller nozzles providing 70 L h−1 were fitted. Irrigation maintained moist soil (Figure 5b) after watering for 30 min at 18:00. Figure 5a shows how the water moistened the soil 35 cm beneath the surface. This treatment is named throughout this work as 100% DI (deficit irrigation).
The other two reduced deficit irrigation treatments corresponded to 75% RDI and 50% RDI. Watering periods of 15 min and 23 min were applied for the 50 and 75% RDI treatments, respectively. It was important to minimize air present within the hoses, so that water application to the trees was precise. A 50% RDI was obtained after watering for one day for 30 min and shutting off the irrigation system during the next day [37]. Trees were watered for half an hour for 3 days in the 75%-RDI treatment and in the fourth day trees were water-stressed. Most of the area between mature mango tree rows was dry and covered by leaves in decomposition; this cover reduced weed growth (Figure 6a). Dry soil surfaces increase air temperatures compared to flood irrigation [48].

2.3. Precipitation Effect on Micro-Sprinklers and Fuzzy Controller

Precipitation is always useful during plant growth, but storms turn out to be troublesome. When it rains during several consecutive days’ soil become saturated. A lack of sun limits water transpiration and water within furrows is not absorbed. After three days of storms, water runs through the soil surface and destroys the furrows, eliminating water capture from the irrigation system. Nine days after the rain, seedlings in the topsoil layer germinate (Figure 7a), and after another week weeds cover the micro-sprinklers. Soil volumetric water content is very high staying at field capacity so there is no need to irrigate. Weed growth depends on tree cover and high-density trees allow indiscriminate growth, Figure 7b. Beneath the mature tree canopy, brown leaf cover limits weed growth, Figure 7c. Under these conditions, the irrigation system works improperly, and lateral hoses should be removed.
An automatic controller was designed in order to take additional actions within the irrigation system, Figure 6a. The control system monitored daily precipitation and soil water moisture, Figure 8. Daily precipitation was acquired by a microcontroller module (TTGO LoRa32 OLED V2.1.6., Lilygo, China) just before 18:00, when the irrigation system was turned on. After this time, at sunset, the rain gauge was automatically emptied to start a new measurement.

2.3.1. Precipitation and Soil Moisture Sensors

Rain measurements are commonly obtained by a funnel that conducts water into a graduated cylinder, a tipping bucket or a weighting device [51]. A better system uses a capacitance sensor beneath the tipping bucket preventing the rainwater collected from condensing. As it condenses it turns into water vapor leaving the rain gauge and causing an erroneous readout [52].
Although the Davis weather station has its own rain gauge, another Davis Rain Gauge smart sensor (mod. S-RGD-M002, Onset Computer Corp., MA, USA) was installed in the tallest mature tree, Figure 6a. The rain sensor was mounted on the top of a six-meter-long aluminum pole with a diameter of 38 mm [53]. The pole was fixed to the tree’s central stem with wires, assuring proper leveling of the rain gauge. Bird spikes were placed around the rim of the gauge cone [53]. The smart sensor was easily connected to the microcontroller board of the controller.
Two moisture sensors (mod. EC-5, Decagon Devices Inc., Pullman, WA, USA) were inserted into the soil at depths of 10 cm and 35 cm, Figure 6a. These ECH2O EC-5 sensors measured the dielectric permittivity of the soil surrounding the probe [54,55,56]. These sensors provided voltage signals acquired by the microcontroller ADC’s [56]. The EC5 sensor can measure volumetric water content (VWC) from 0% to 100%, with an accuracy of 3%, at a temperature ranging from 0 to 50 °C. At the soil surface, the EC-5 sensor was inserted with an inclination of 45° to avoid water accumulation on the top of the sensor [54]. Sensors buried in the soil were inserted in a PVC tube and sealed with silicon to avoid water contacting the electronic circuit [57]. Available water in the clay loam soil at the tree root zone varied from 17.5% to 35% VWC; field capacity measurement was 35% VWC [58,59]. Soil saturates when its water content reaches 45–50%. Mango trees increase their water consumption with higher evapotranspiration, causing soil drying. Soil moisture sensors measured the volumetric content on March 10 and 11 of 2020, Figure 6b. A mango tree irrigated daily with 100% ETc drops its volumetric water content to 35% (blue line, Figure 6b). VWC falls to 29% (orange line, Figure 6b) at a depth of 35 cm. With the 50% RDI treatment (gray line, Figure 6b), VWC decreased to 26% after the second day, when no irrigation took place. A decrease in VWC/day of 1% corresponds to a decrease of 3 mm day so this has to be stabilized with scheduled irrigation.

2.3.2. Irrigation Fuzzy Model

The effects of precipitation on weed cover and height was evaluated ten and 17 days after a rain event, Table 1. A storm of one day was characterized by heavy rain (events 1, 4 and 8). If the rain lasted for 3 continuous days and recorded a total of 80 mm, weeds germinated around the HD trees (Figure 7a). A weed height of 7 cm was noted after 10 days; one week later the weed covered 25% of the furrow area. Furrows in hilly sections disappeared after stormwater runoff was observed in events 1, 4 and 8, Figure 4b. Events 8, 9 and 10, recorded a total of 150 mm, and irrigation was suspended during the entire season as weed cover varied between 60 and 80% and its height enclosed the micro-sprinklers, Table 1.
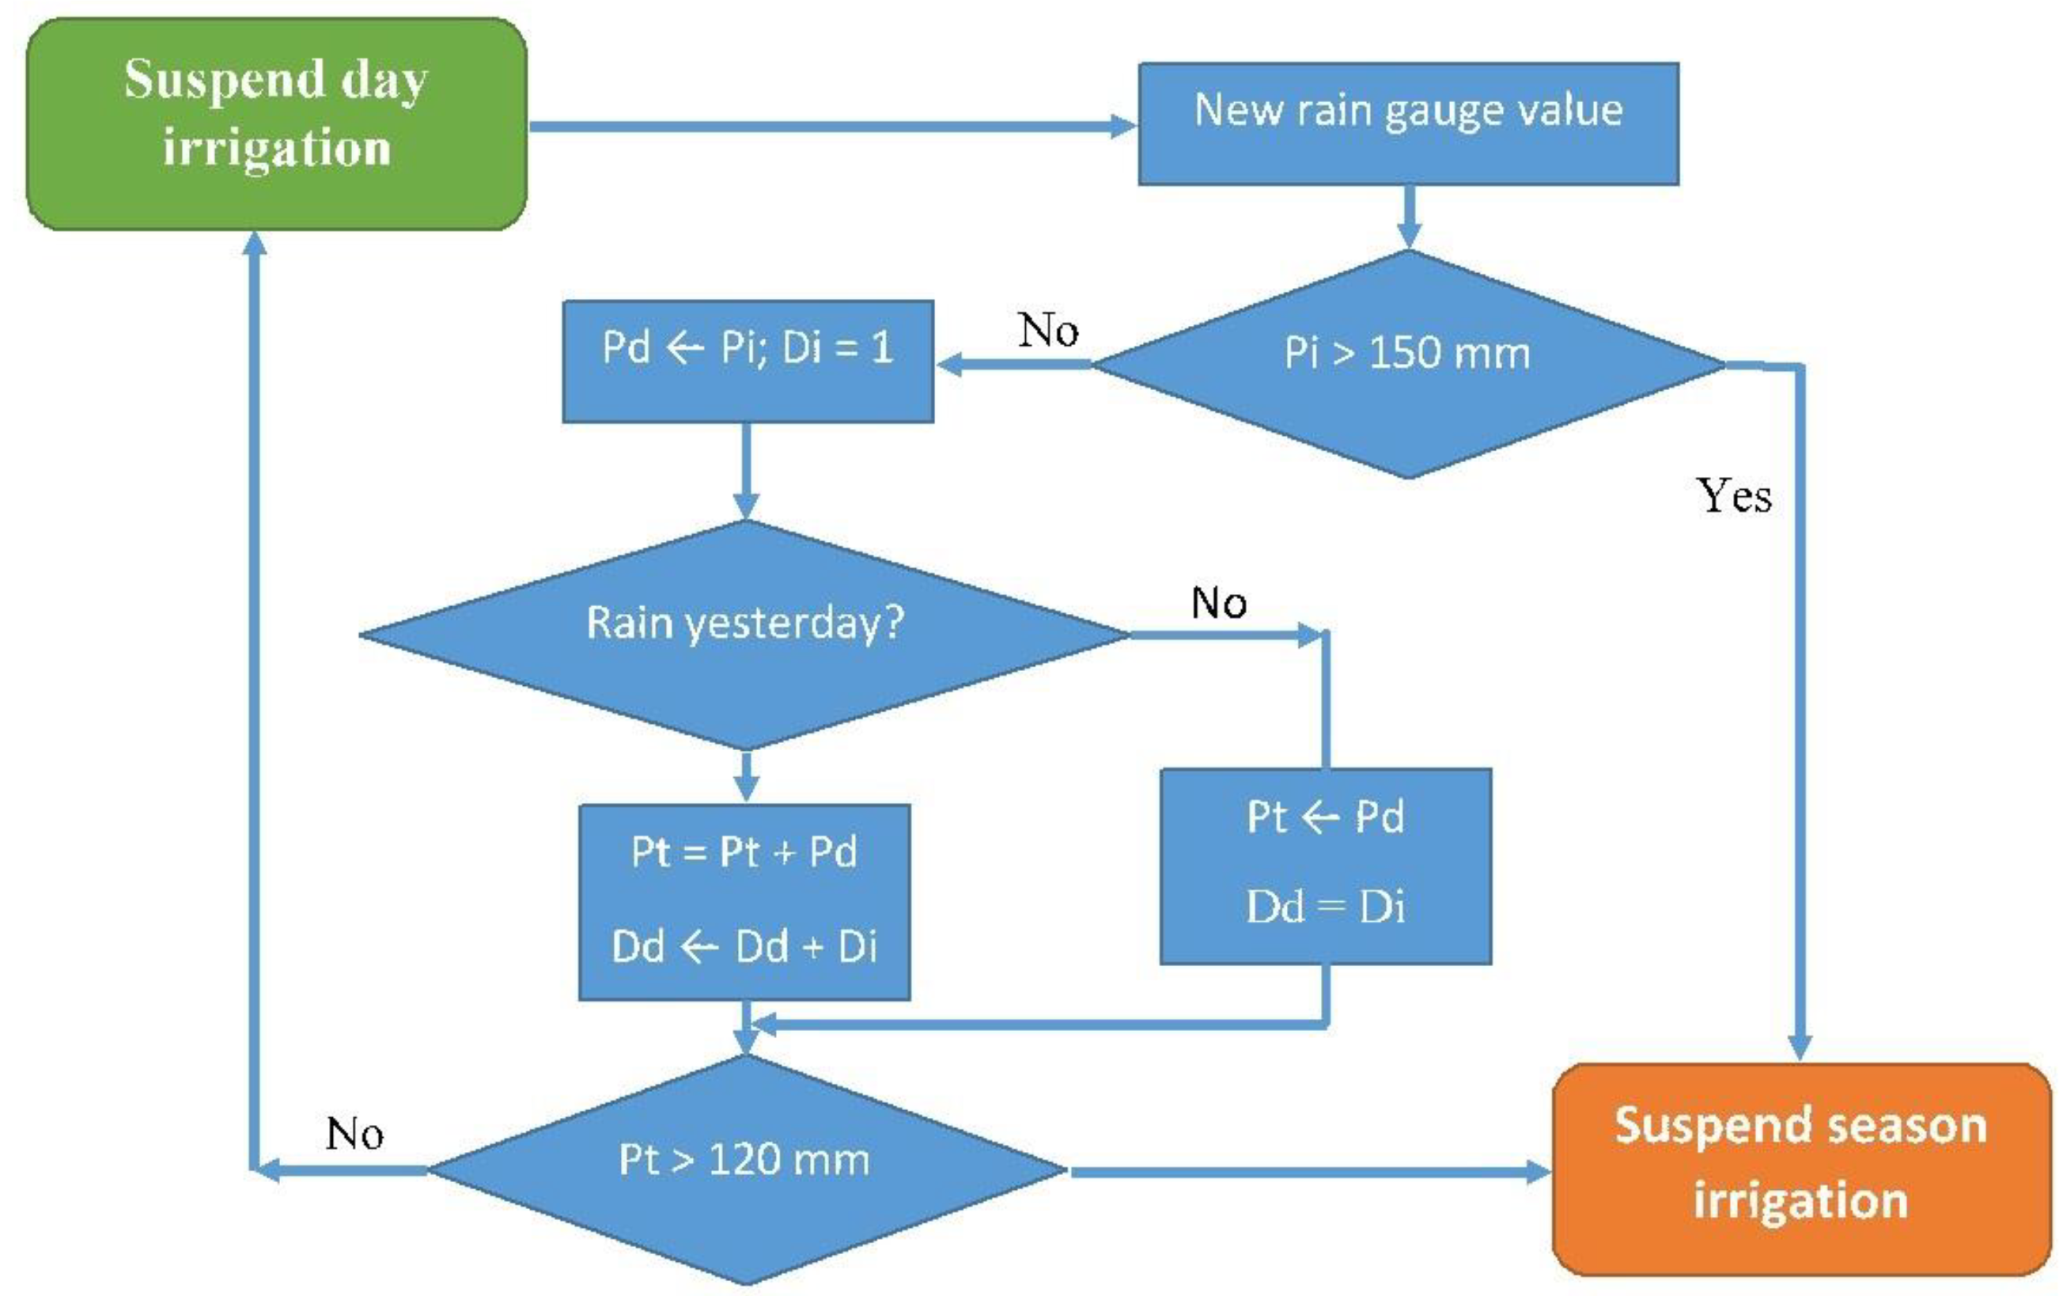
The controller (Figure 8) acquired the daily rain gauge value and processed it as shown in Figure 9. If the storm rainwater exceeded 150 mm, irrigation was suspended during the entire season. These storms reduced flowering, increased fruit-drop and decreased orchard yield. The controller algorithm checked whether it was the first rain, otherwise it added it to the precipitation value from the previous day and saved it as total precipitation (Pt). If Pt was greater than 120 mm, irrigation was suspended all season. If Pt was lower than 120 mm it suspended irrigation during the next day and proceeded to measure rainfall again. Precipitation values were acquired daily at 18:00 and then reset.
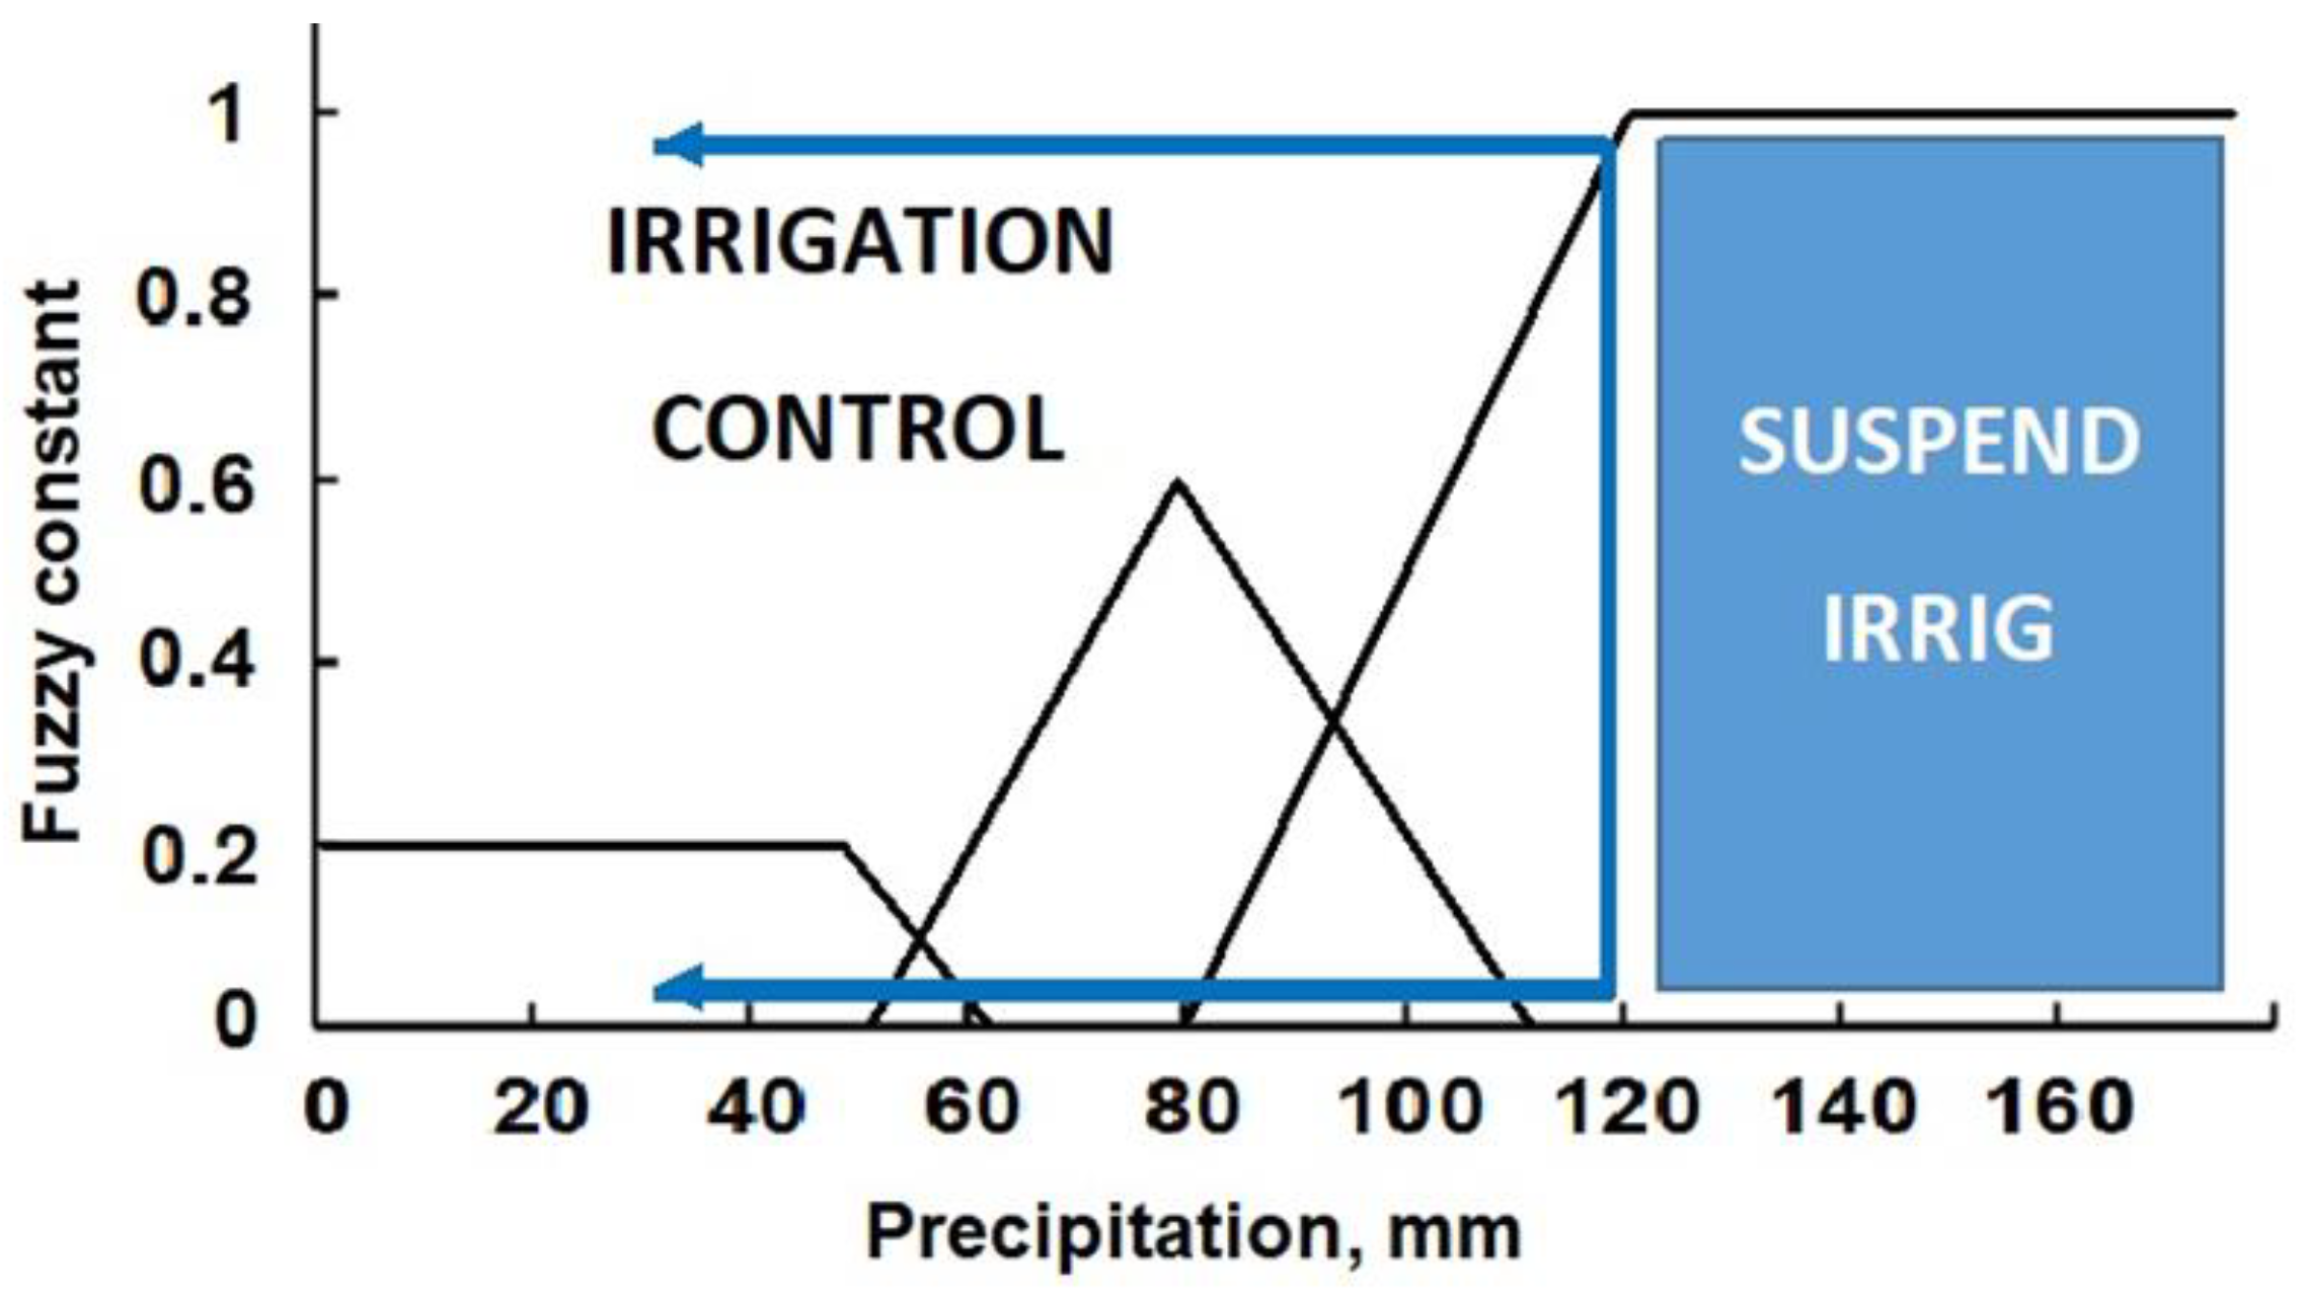
Fuzzy rules were implemented by one triangular rule that functioned between precipitations of 50 and 110 mm and by two trapezoidal rules, Figure 10. The left trapezoid has a fuzzy magnitude (FZ) of 0.2, meanwhile the right trapezoid reached FZ = 1 after 120 mm of precipitation. The fuzzy constant or magnitude was obtained from Equation (1), where Wc represents cover in a 0–100% range and Wh is the weed height in centimeters. For example, with 80 mm at the 17th day, Wc = 25 and Wh = 12 being final FZ = 0.3. In case of experiment 10 (Table 1), FZ value is 2.4, but as it cannot be over 1, it was limited to 1.
FZ = W c ×   W h 1000

2.4. High-Density and Mature Tree Measurements

Mango tree morphological characterization was carried out by measuring tree height, canopy diameter and volume, number of branches, leaf number and trunk diameter. Trunk diameter was measured with a meter at a height of 80 cm from soil level in both HD and mature trees. Leaves were visually counted in HD trees. Three workers counted the leaves and the average value was within ±5 leaves. If the difference was greater, the number of leaves were counted again. Leaves of mature trees were not counted. Once harvested each mango box was weighed with a 45 kg digital scale (mod. JS7916, JUSTA, China) to obtain the yield per tree. After collecting the mango fruits from a tree, the fruits were counted and the ratio between yield per tree, and fruit number provided the average fruit weight. Yield per tree and number of fruits were obtained from each tree after harvest prior to mechanical pruning. Equation (2) was used to obtain canopy volume in HD trees, with h representing the tree height and r the external canopy radius.
V c = 0.4 π r 2 h
Mature trees morphological characterization was more sophisticated. Tree height could not be measured with a conventional meter, so it was measured with a laser meter (mod GLM 20, Bosch Power Tools, Germany). This red laser meter can measure heights of 20 m with an accuracy of 3 mm. This meter also measured canopy diameter between two stakes buried at the end of the tree canopy shade taken at midday. The same mature trees were used during the experiment. For example, the ten trees watered by the 100% DI treatment during 2020, were pruned and then watered again with the 100% DI during 2021. Equation (3) is the same than Equation (2) but the constant is changed from 0.4 to 0.54 as the canopy is denser.
V c = 0.54 π r 2 h  

2.4.1. Pruning

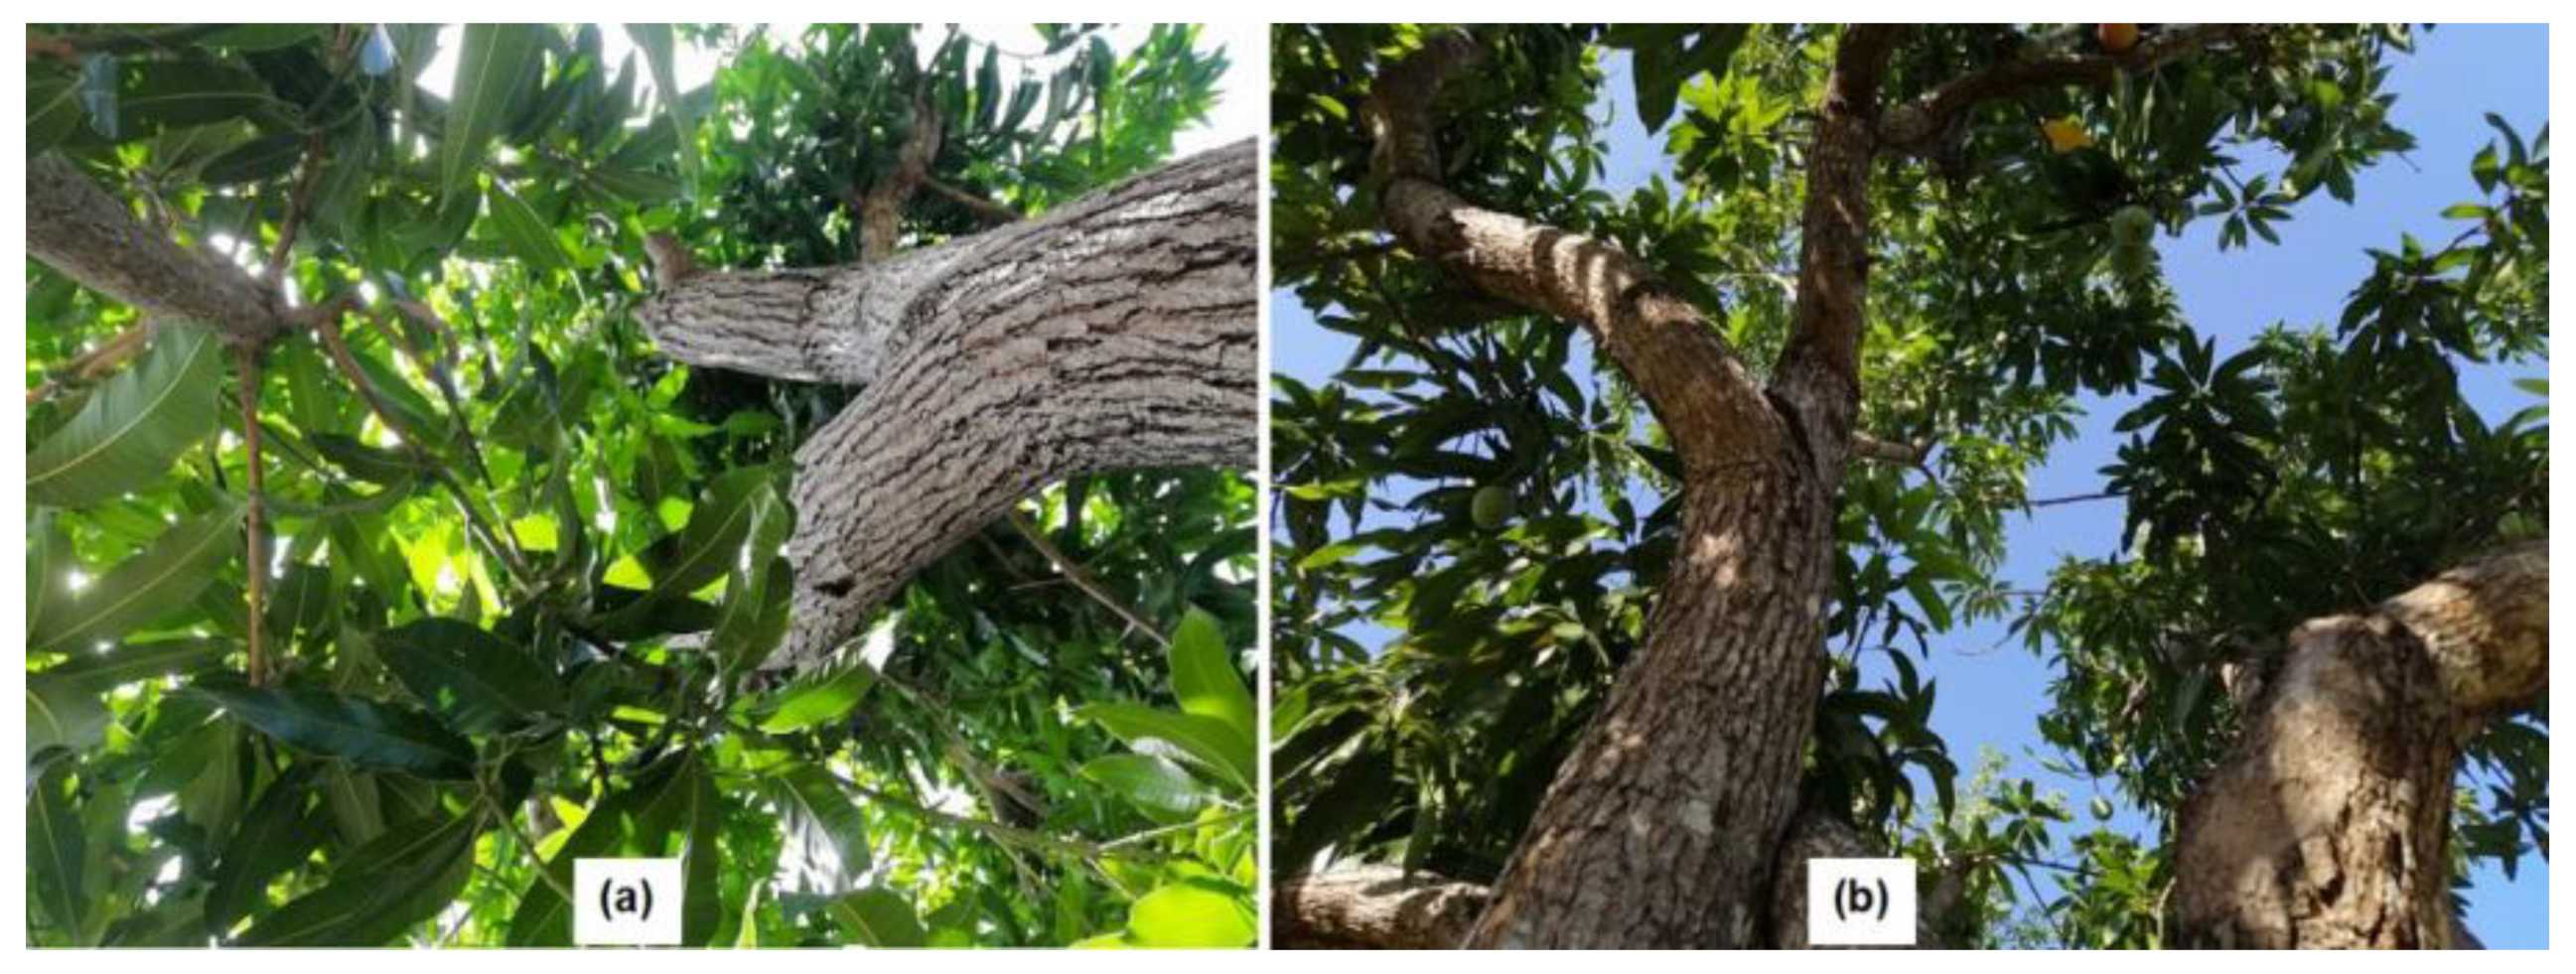
Trees without pruning become large (Figure 11a), limiting light penetration through the canopy. Vegetative sprouting decreases in large trees, meanwhile pests and diseases flourish due to the high relative humidity content of the canopy [60]. A maximum height of 4 m is recommended on mature mango trees spaced by 10 m. Tree canopies should be trimmed to a letting leaves within a radius of 3 m from the trunk [61]. Yield for the same mature trees was obtained during 2020 and 2021 at the Loma Bonita orchard. After the 2020 harvest, the 30 mature trees were pruned with a chainsaw. The main vertical-apical branch from each tree was removed so light was available within the canopy. After clearing the tree center, the sky was perceivable from the soil level, Figure 11b. After pruning in September 2020, tree height decreased 2 m, Figure 12. A maximum of 25% of the biomass in mature trees was removed during 2020.
Relative movement between the earth and sun, provides variable radiation beneath canopy leaves in pruned trees due to its final morphology. Two pyranometers (model SP212, Apogee, CA, USA) were used to measure the ground cover fraction in mango trees [62]. One pyranometer was fixed in an adjacent row space were no shadow was present during the entire day. The second pyranometer was fixed below the canopy where the thicker stem diversifies into 2–3 branches (1.5 m above the ground). Both sensors were leveled to obtain the right values. Measurements were taken throughout the day, sampling every ten minutes. All day solar radiation (8:00 to 18:00) was averaged minimizing the shading effects within the tree. Transmission ratios were obtained by dividing the bottom canopy and top tree radiation (adjacent free space row) values. The total day transmission ratio (TRt) was calculated by averaging all day pyranometer values into a ratio; the bottom radiation values were divided against the global radiation obtained from the adjacent free space row, where vegetation blockage was null. Noon transmission ratio (TN) only used the values recorded at 12:00. Quantum sensors can measure diffuse light availability within a pruned tree canopy. An increase in its photosynthetic rate was encountered [63].
High-density trees were uniformly trimmed in 2020 by removing 50 cm from shoots from the apical branches as recommended by experts [63,64]. Shoots from the previous year’s inflorescences were also cut. Yield comparisons between 2020 and 2021 HD trees were also carried out.

2.4.2. Mango Fruit Counting

Workers distinguish mango fruit within the tree canopy based on color and texture. Their experience means they can detect them even when the fruit and canopy color changes. In mango orchards, single cameras can view the whole tree from an inter-row position taking two images at 180° [65]. Machine vision can predict fruit yield accurately [66]. Image processing includes techniques such as segmentation based on color [67], K-nearest neighbor (KNN), pixel classification [66] or super-pixel over-segmentation. Night imaging seems to provide better results compared to machine vision during light hours.
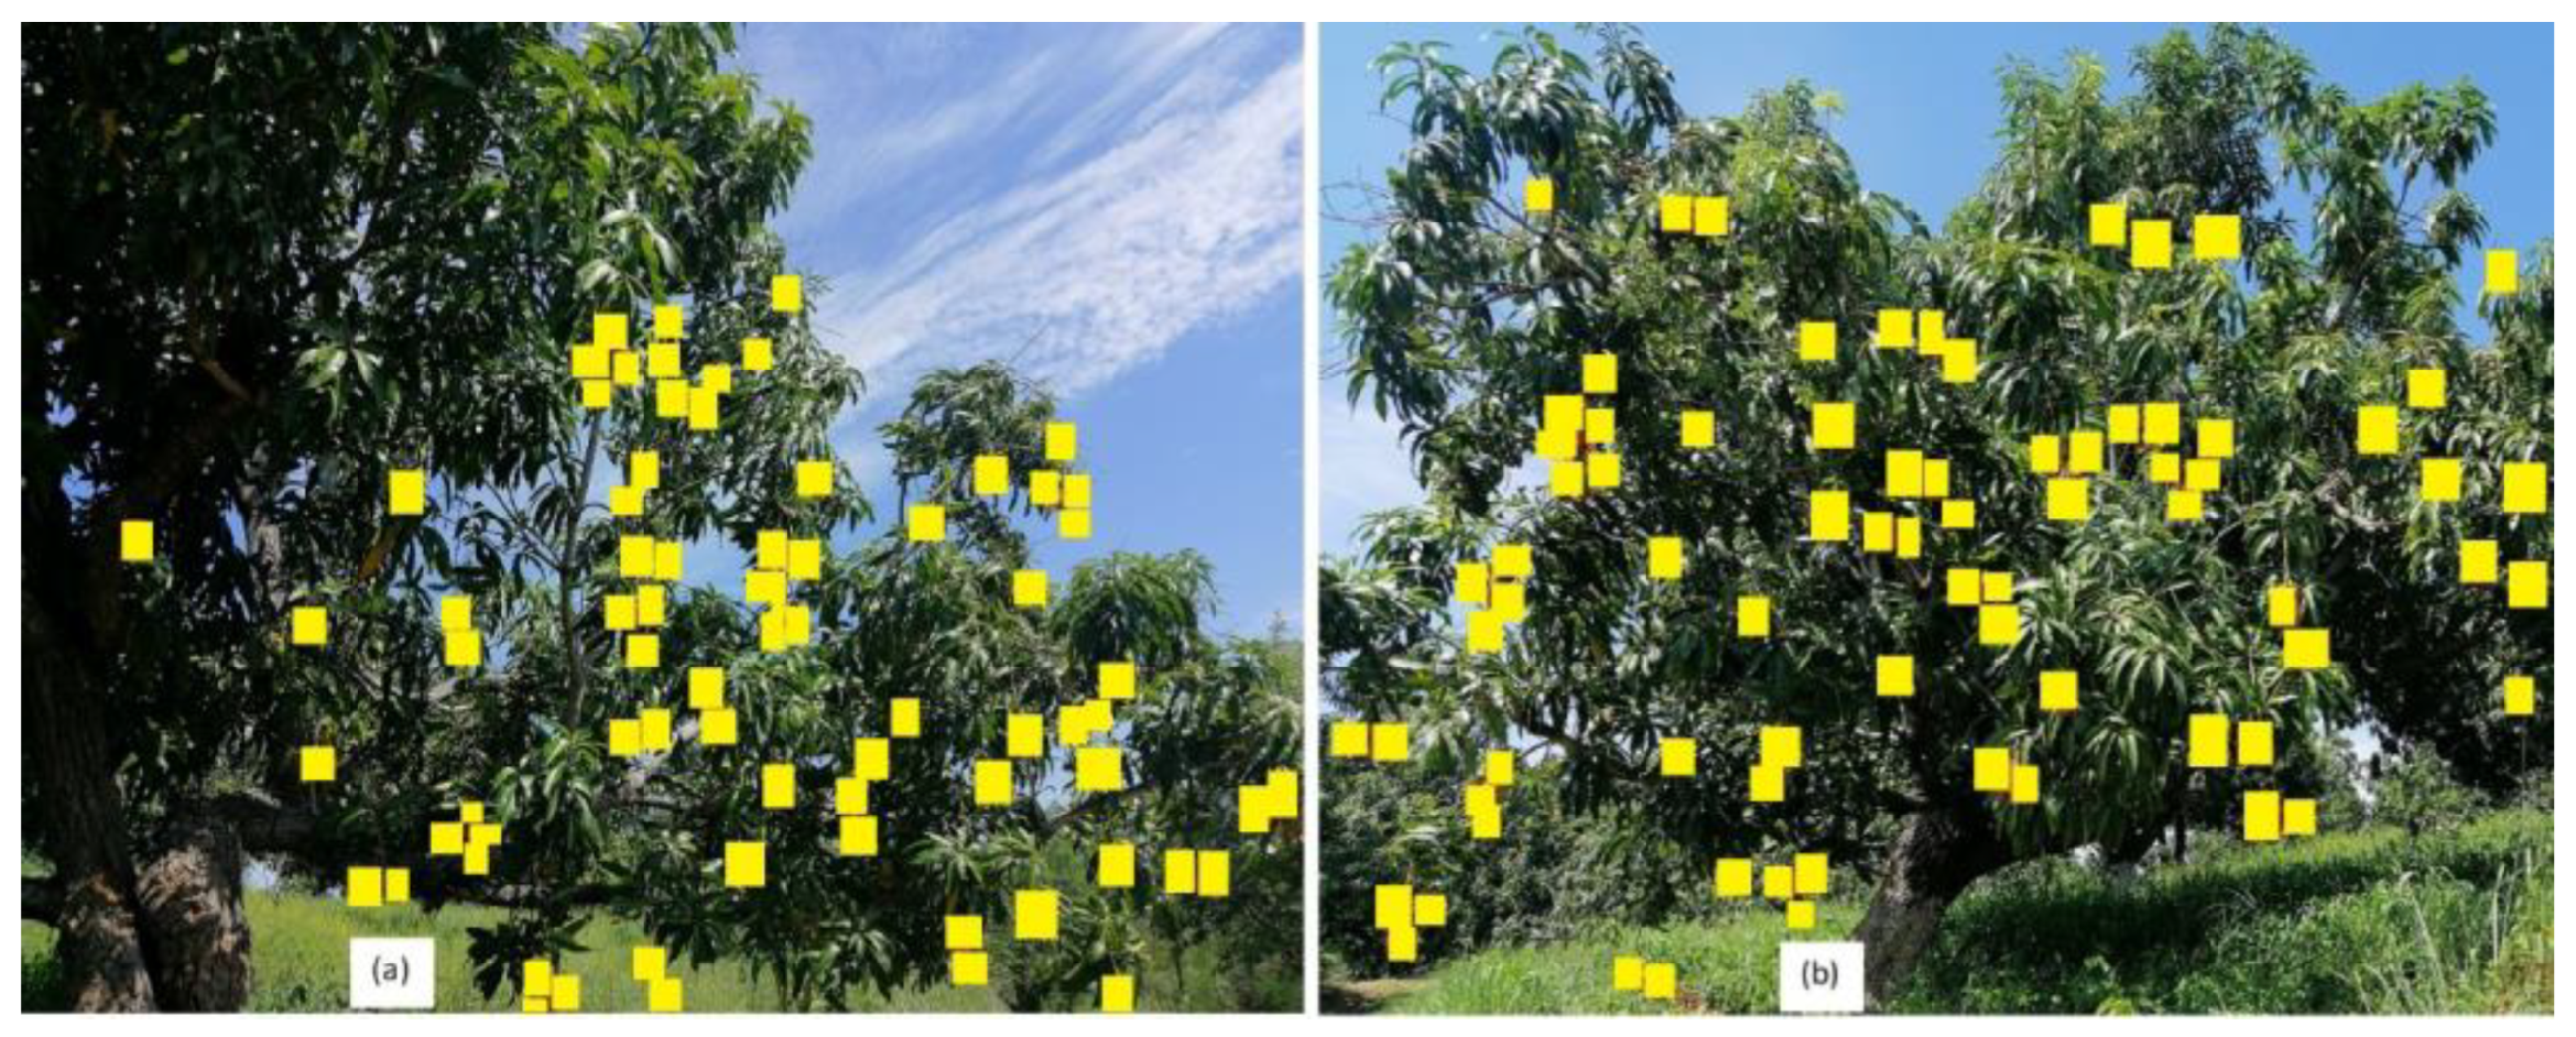
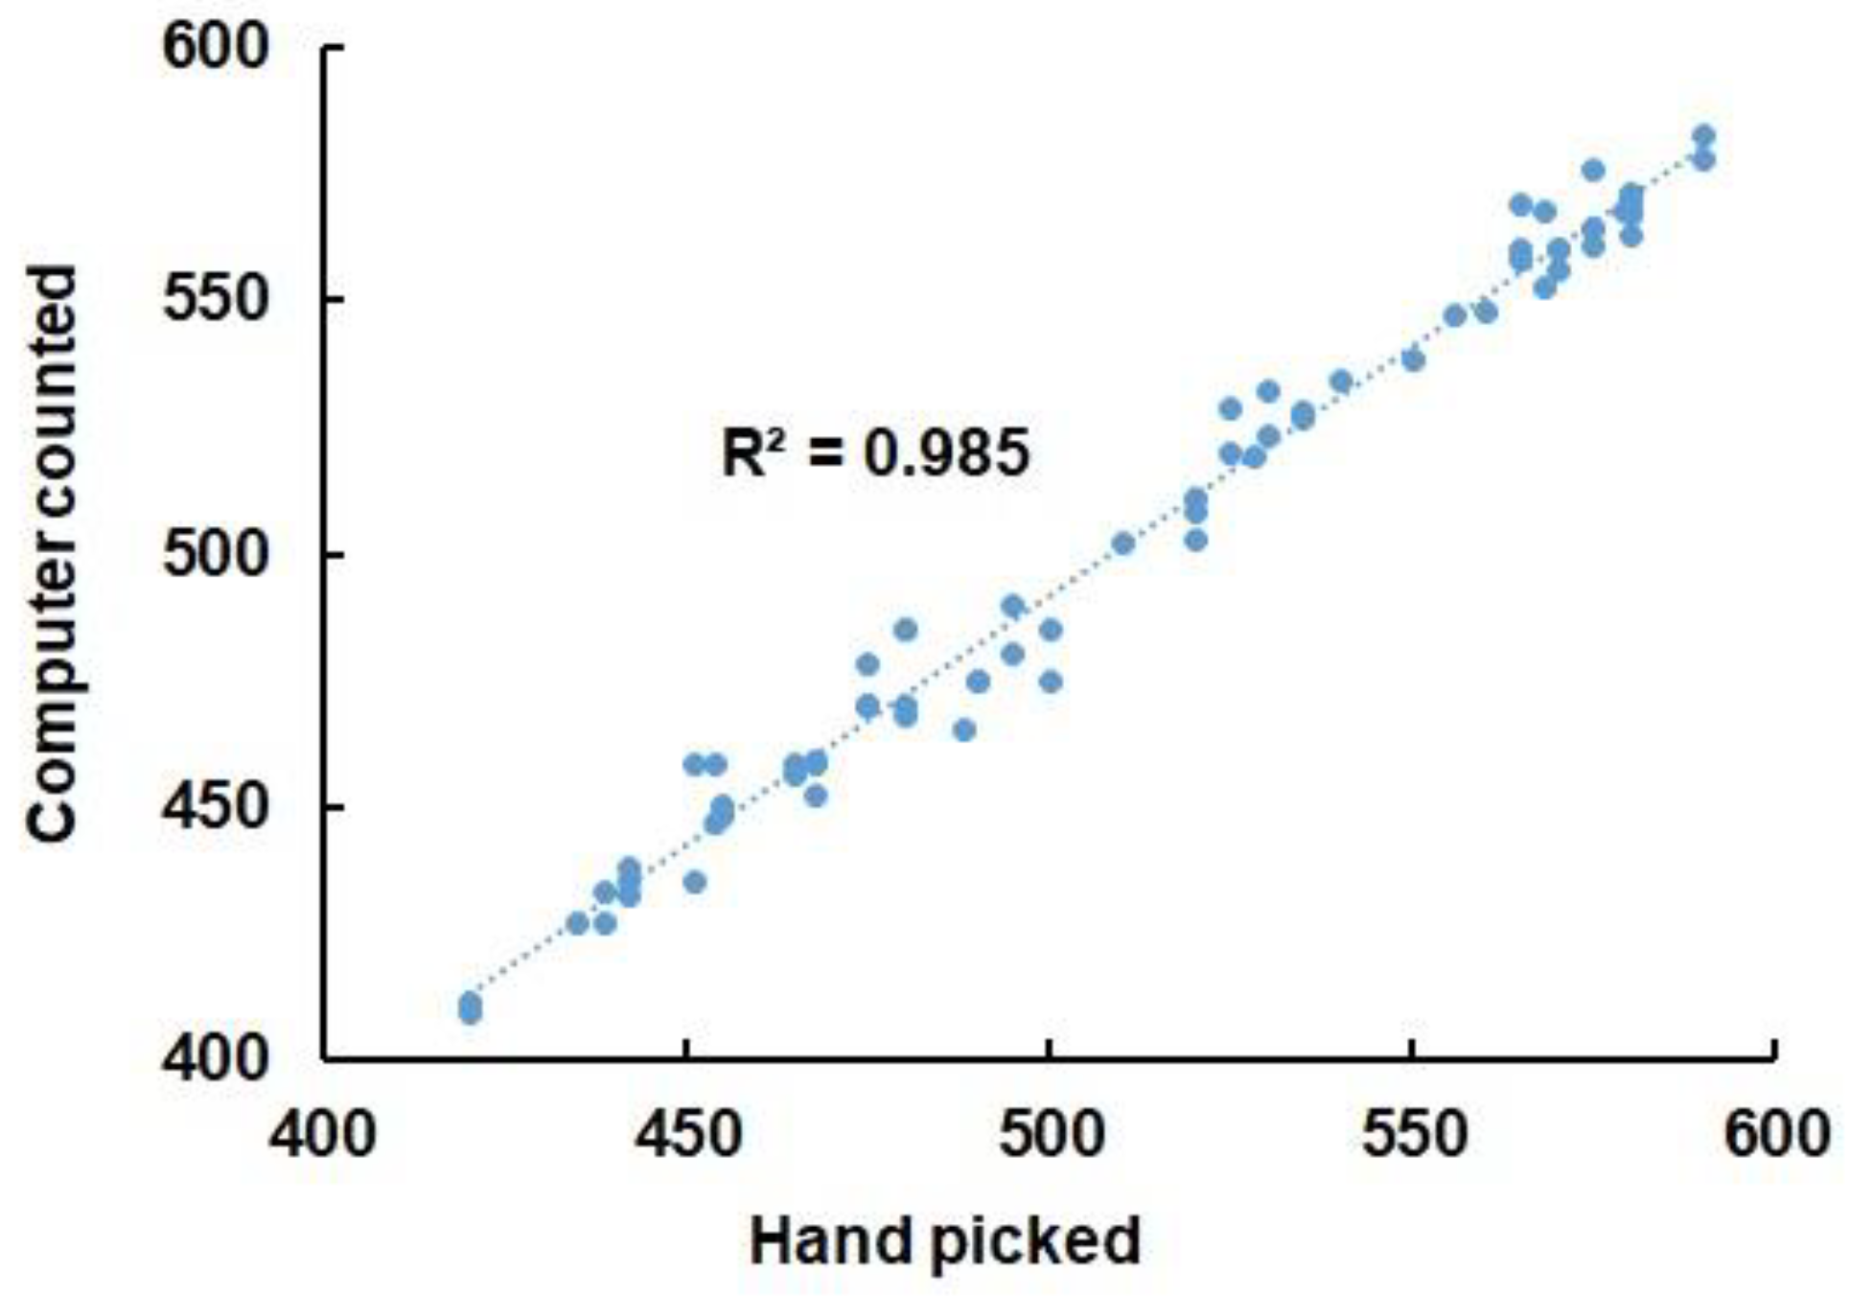
Fruit load from the experimental 30 mature fruit trees were required. Therefore, three 120° offset images of each tree were taken. Each image was acquired at a distance that allows for all the fruits and the tree canopy to be seen, Figure 13. In this study automatic machine vision techniques were discarded. Each image was manually processed by adding a yellow square over each mango; these squares were counted to obtain the number of fruits hanging. Mango fruits counted with imaging techniques had a correlation of 0.985 against hand-picked fruit, Figure 14. Fruit load estimation errors resulted from fruit occlusion caused by foliage and branches. As imaging took place 2 or 3 days before harvest, it was possible that very mature fruits fell to the floor.

2.5. Data Analysis

Tree morphological values were introduced to a spreadsheet, and their values averaged before obtaining their standard deviation. An analysis was carried out for HD trees and another for mature trees during each season. Data of fruit yield during 2020 and 2021, water-use efficiency, fruit yield, fruits per tree, fruit weight, canopy volume and irrigation application were evaluated by analysis of variance (ANOVA), and the means were separated by Tukey’s test (p < 0.05). Data was loaded on to a spreadsheet where the columns corresponded to each variable and ten rows corresponded to each irrigation treatment: 100% DI-2020, 75% RDI1-2020, 50% RDI2-2020, 100% DI-2021, 75% RDI1-2021 and 50% RDI2-2021. R Statistical software version 3.6.3 (R Foundation for Statistical Computing, Vienna, Austria) was used to calculate the ANOVA and determine whether two or more groups were significantly different.
As the methodology section is too long, with images and researcher’s comments it may be difficult to follow. Therefore, we want to remark the main objectives (Table 2) to simplify what has been conducted.

3. Results

This section is divided into the subheadings denoted in Table 2. It provides yield results after pruning, its effect on tree size, WUE, and the application of the fuzzy controller.
The average morphological measurements carried out in the experimental trees are shown in Table 3 and Table 4. After the 2020 harvest, HD and mature trees were pruned. Data was averaged per treatment and Table 3 shows the results of high-density trees. Although HD trees were pruned, they were taller and their trunks thicker in 2021. Canopy volume also increased although the number of branches and leaves were similar; an average canopy volume up to 5.71 m3 was measured, Table 3. As the trees grow every year their canopy diameter increases due to tree growth. HD trees presented between 3 and 4 branches and their leaf number was within 760 and 776 for all treatments except HD trees watered by the 100% DI treatment in 2021. There was no particular explanation for why these HD trees presented more leaves as the canopy volume and diameter was smaller than the other 2021 HD trees watered with 75% RDI and 50% RDI treatments.
Table 4 shows the average values obtained after each year’s harvest from mature trees, exhibiting non-significant differences between each year’s treatment as trees are mature. Canopy volume and height displayed changes between 2020 and 2021 as the trees were trimmed after the 2020 harvest. Mature trees decreased their canopy volume from 315 to 210 m3 (Table 4). Canopy area decreased by 23.9% one year after trimming, allowing separation between different trees and better light penetration. Mature tree height decreased after pruning from 8.1 to 6.8 m.

3.1. Light Penetration and Ground Cover Factor in Mature Trees after Pruning

With a lower height and a better branch distribution, light penetrates through the canopy full of leaves and limbs. Better canopy separation between trees avoids shade and increases the main physiological activities.
Pyranometer measurements showed radiation changes inside the canopy of pruned trees. The radiation values obtained during an entire day from two different mature trees beneath their canopy are plotted in Figure 15a, marked by the green and red lines. Total day transmission ratio (TRt) for pruned trees and unpruned trees is shown in Figure 15a. Radiation measurements throughout the day are also plotted. Leaves and branches interfered with the total incoming radiation decreasing the available light. TRt and TN were of 0.61 and 0.81 for the green line, respectively. The pruned trees with the red radiation curve presented a higher TRt of 0.67. In an unpruned tree, the radiation at the bottom of the tree is shown by dashed lines, Figure 15a. A TRt of 0.31 was obtained being 50% lower than the that calculated for pruned trees. This can be understood since a closed canopy tree with high leaf density limits light transmission [44].
Ground cover factor (GCF) was calculated from GCF = 1 − Tm/Td, with Tm representing the average transmission from 11:00 to 13:00, and Td being the average transmission during the entire day [62]. In Figure 15a, the green line shows a trimmed tree with a greater GCF than the one with the red line, with a greater Tm. The transmission of the tree without pruning measured 1 m above the soil is plotted with a dashed line. Its GCF was lower than that of pruned trees as less radiation arrives to the bottom of the canopy. The thirty pruned trees resulted in canopy volumes of within 220 and 280 m3. Three to four trees with the same canopy volume of 245 m3 presented important differences in GCF (green squares) as well as an average radiation below the canopy (triangles), Figure 15b. The GCF correlation against canopy volume was 0.69, meanwhile radiation below the canopy presented a lower correlation against canopy volume of 0.47. This poor R2 was attributed to pruning severity, determined by limb to trunk ratio [68]. Pruning severity shown on Figure 15b shows that after trimming, many trees ended with the same canopy volume.
A lower canopy external area (CEA) of 81% was obtained in September 2020 (2020S) after thinning the trees in its outside contour, Table 5. During this month, branches that limited available radiation to the canopy were removed. The internal area (IAWL) represented one third of the tree’s external area (20.1/63.58 m2). Real canopy volume (RCV) was obtained after multiplying the tree’s height (H-0.7) by the real area with leaves (CEA-IAWL) and by the constant 0.54 (Equation (3)). Measurements before harvest in May 2020 and May 2021, showed a decrease of 27.2% in real canopy volume. The canopy volume CV will only be different after pruning as IAWL will be present. The other two variables shown in Table 5 are the average GCF and the radiation at a height of 1 m (Rad@1) from the soil, both were greater for pruned trees (2021M). Higher pyranometer values in trees were encountered when radiation entered freely through the canopy.

3.2. Effect of Irrigation Treatments on Yield and Fruit Size

After obtaining all the data from both mature and HD trees under different treatments an ANOVA analysis was carried out. Irrigation treatment effects on fruits per tree, fruit yield, canopy volume and WUE were considered.
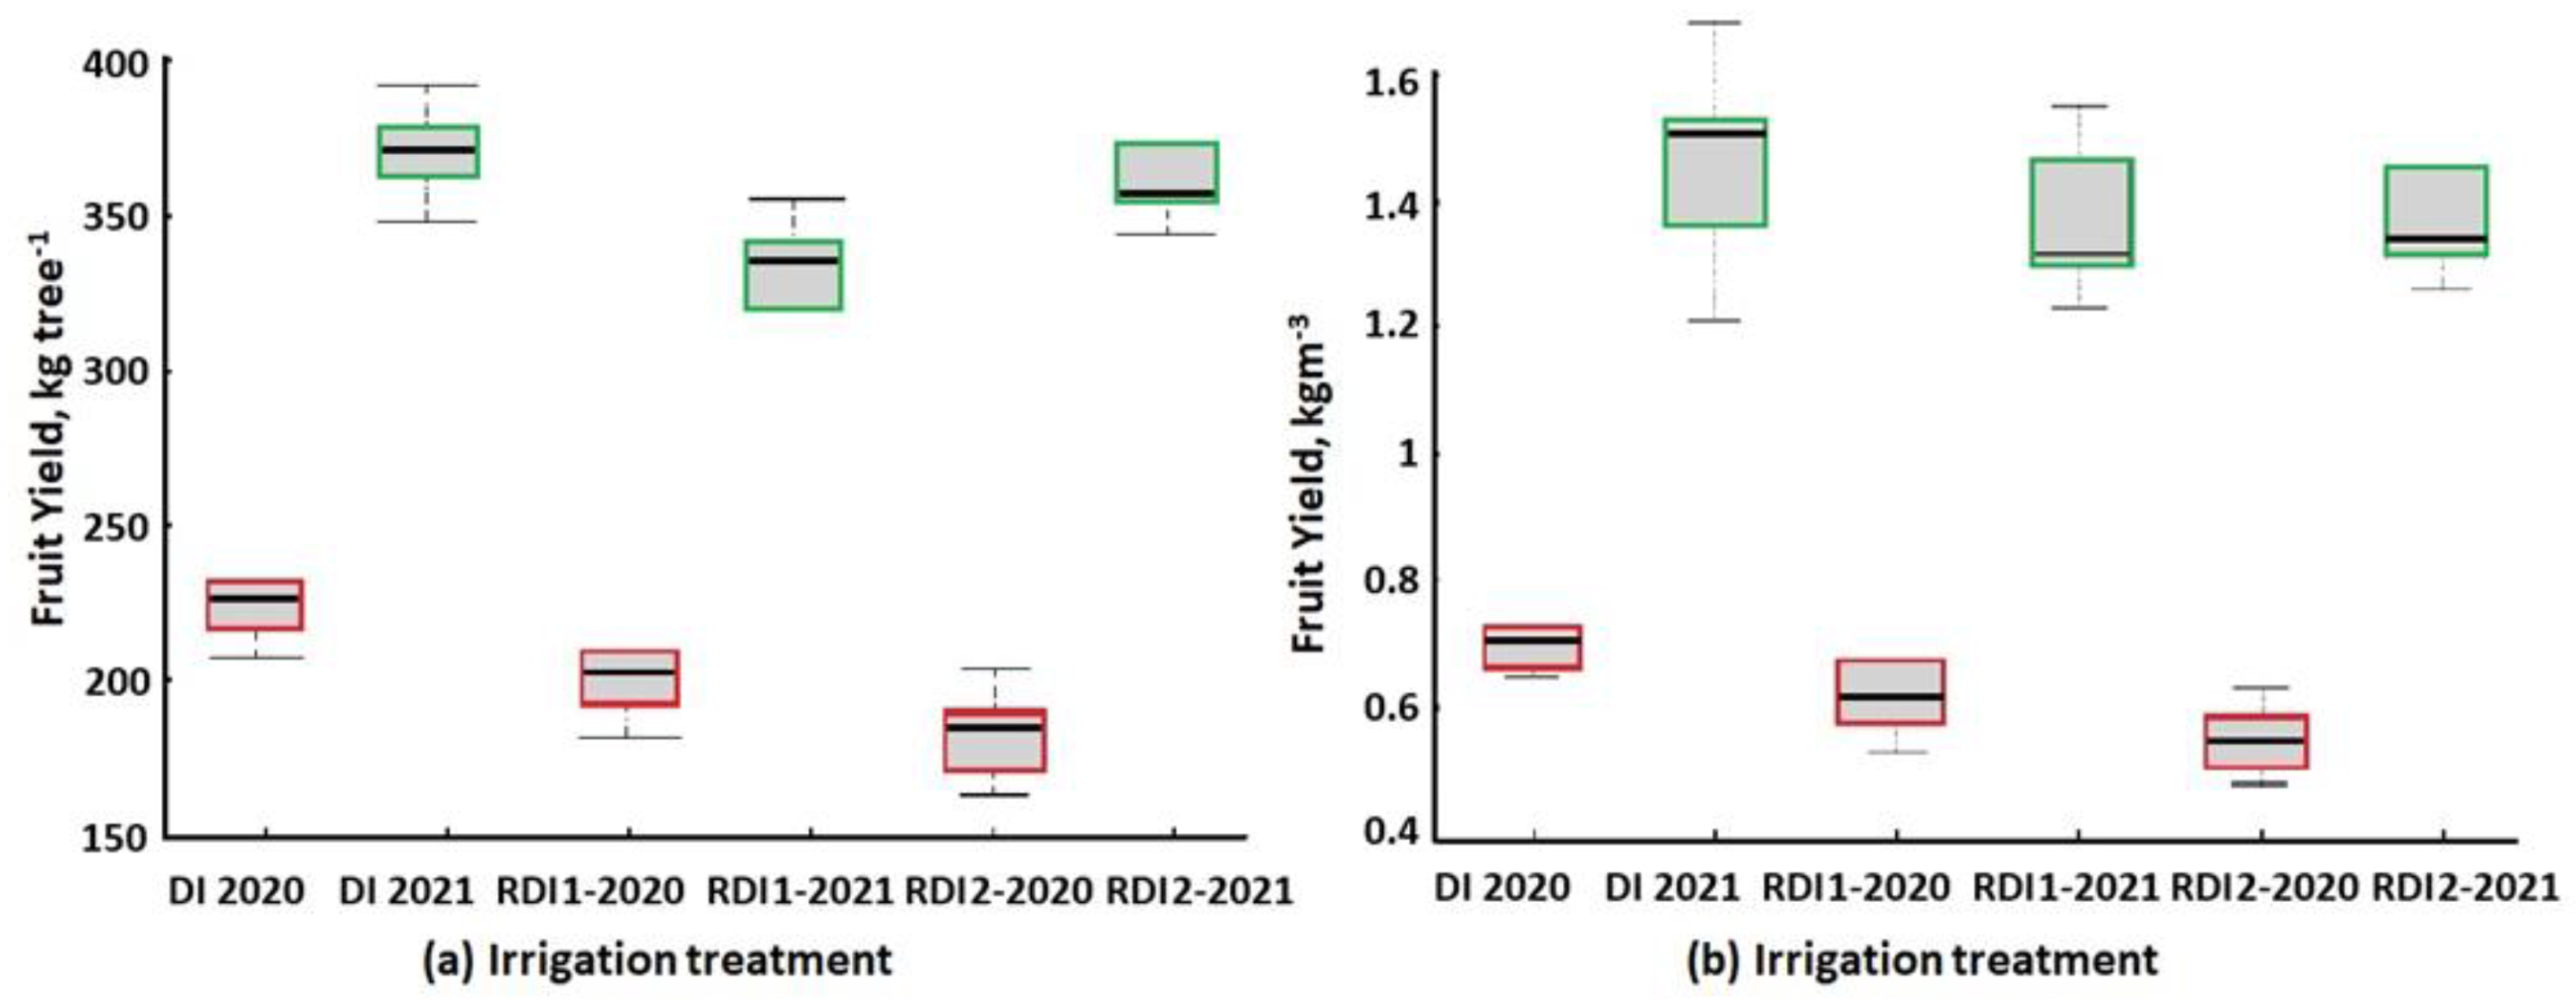
The high-density trees received the same quantity of water during both 2020 and 2021. Three different irrigation treatments were applied to ten trees each during both years. Mango fruits produced by each tree were counted with the photographic technique and images can be seen in Figure 16. As trees were pruned, a lower canopy volume was observed during 2021, and no statistical difference was obtained between the different treatments. Pruning severity varied between trees for all treatments and some trees irrigated with RDI-1 75% had the same canopy volume than those irrigated with DI 100% or RDI-2 50%. Severely pruned 9-year-old Keitt trees [69,70] had the highest number of fruits, similar to the results obtained during 2021 from our high-density trees irrigated with the 50% RDI treatment. In 2020, mango average weight per unit was higher with reduced irrigation treatments, but fruit yield was higher under 100% DI as more fruits per tree were harvested. ANOVA showed that during 2020, fruit yield and fruit per tree were statistically different. ANOVA found no statistical differences in fruit weight under the different irrigation treatments during 2020, as noted by the letter ‘a’ appearing in the fruit weight column for the three irrigation treatments, Table 6. Mango size under different irrigation treatments presented some fruits of the same size although average values differed, Table 6. Fruit yield increased by 2 kg in 2021 for all the irrigation treatments against the same trees during 2020.
ANOVA was also applied to analyze fruit yield and mango size in 30 mature trees. It analyzed the effects caused by the three different irrigation treatments and pruning during 2020 and 2021. Fruits were heavier in 2020 when the trees were irrigated by the 100% DI treatment, Table 7. After pruning, fruit size increased even further in 2021. The heavier fruits were encountered with the 50% deficit irrigation treatment as 8% less fruits were harvested. ANOVA did not encounter statistically significant differences between fruit size under different irrigation treatments in 2021. Fruit yield increased by 60% after pruning using the 100% DI.
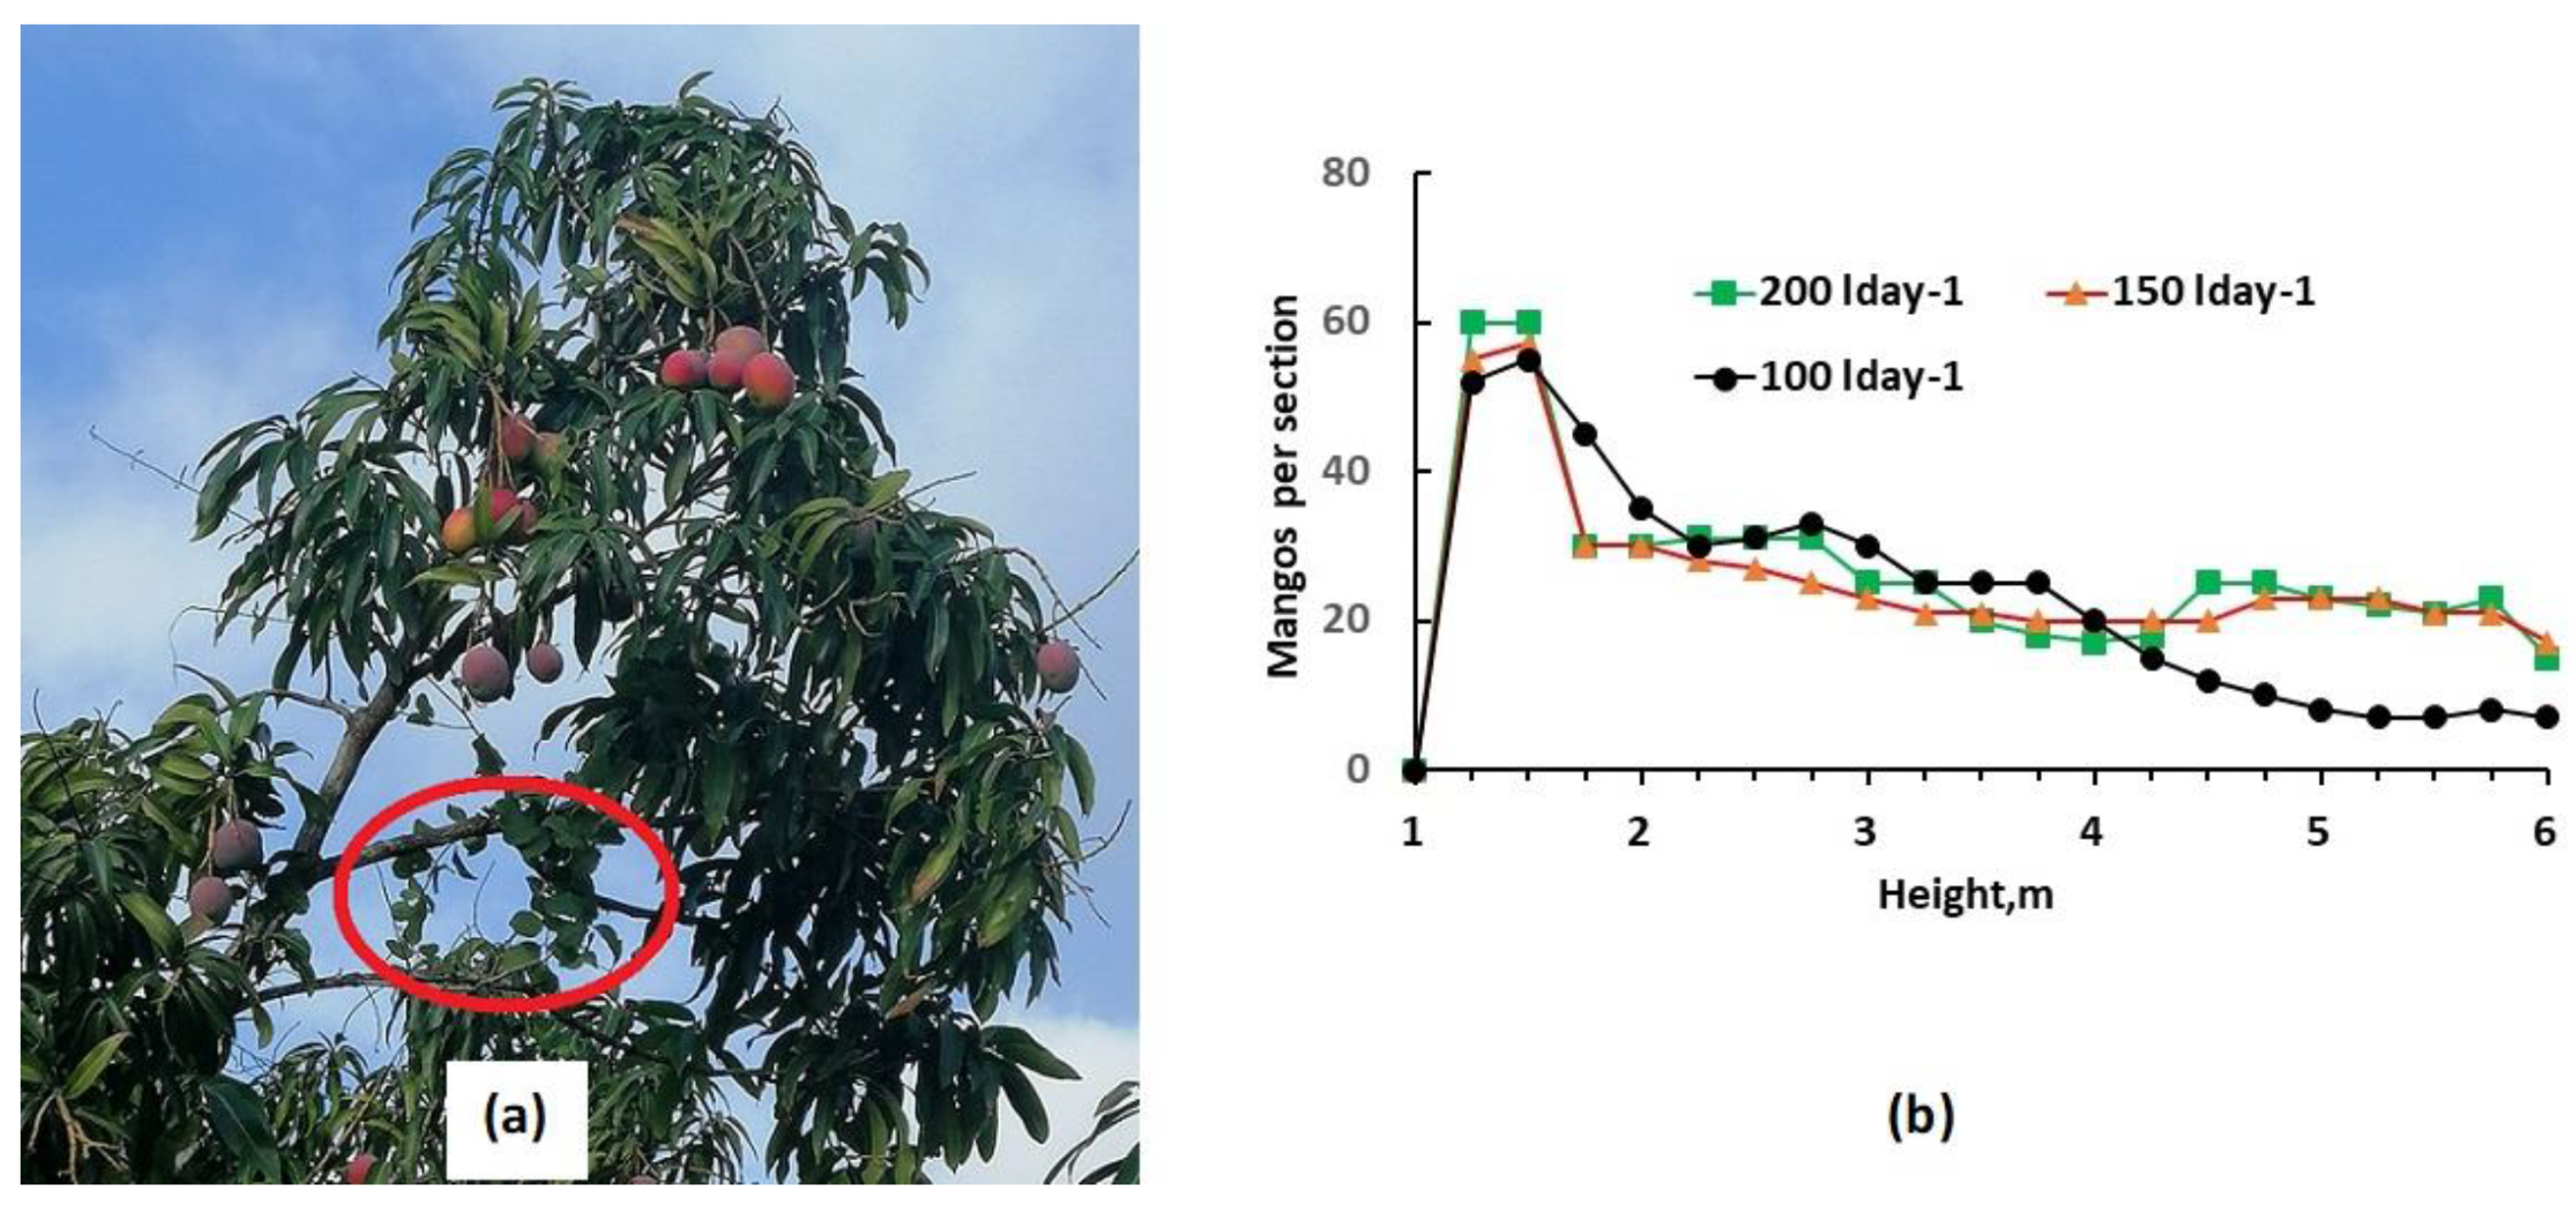
In our case, yield increased as only the taller and unproductive branches were trimmed, Figure 17a. The taller branches amassed ivy which are plants which stick to the stem and feed on the sap. These plants, if not treated, can dry healthy branches (Figure 17a, red circle). Fruits grow better at a height of one-meter than at 4 or 5 m for all irrigation treatments, Figure 17b. Fruit yield was calculated as kg tree−1 or as kg m−3 and Figure 18 shows the increases during 2021 for each irrigation treatments. The effect of pruning was clearly seen by the yield (kg m−3) increase over 1.36 in al treatments, Figure 18b. In 2021, ANOVA could not distinguish clearly between irrigation treatments and fruit yield (kg m−3), hence why letters ‘a’ and ‘b’ appear, Table 7.
Two years after pruning fruit yield and size were observed in the 2022 season, Table 8. Canopy volume, number of fruits per tree and WUE increased but this was insignificant. We did not encounter any yield loss under the same water treatments one year after pruning. This could be explained as the more vigorous branches remained after trimming (Figure 12) and more radiation was able to enter the canopy. More fruits grew within the canopy’s internal limbs. Trees were smaller and easier to manage. Constant relationships between transpiration and absorbed energy have been reported during a whole season in peach and in walnut trees [71,72]. Almond trees with a high fruit load presented considerable new shoot growth after harvest [72]. Transpiration rate progressively decreased from 8 L h−1 when the soil water content was near field capacity to 2.7 L h−1 by the last week of December as no water was added. A similar behavior was reported with olives trees [73], where transpiration rates recovered after irrigation.
EC-5 probes buried at a depth of 35 cm measured soil moisture daily and the VWC values obtained are plotted in Figure 19a. Soil moisture was monitored during all phenological stages of the tree, from flowering to harvest. The purple arrow shows the soil’s first response to a 50% deficit irrigation event on the 6 April 2021, Figure 19a. The irrigation treatment (red circles) was applied to the trees every two days in 2021, lasting from the flowering stage to the beginning of the fruit-drop stage in 2021. Heavy rains were recorded during most of the fruit-drop and growth stages from 17 April until 21 May, and water was not applied during this period, Figure 19a. In naturally stressed orchards, flowers generally appear three months after the last rain. Natural orchards are those in which chemicals are not used to stimulate flowering [74,75]. Three years earlier during the 2018 season, flowers in this mango orchard appeared by the 15 January, Figure 19b. Irrigation was applied continuously until 3 April throughout all the phenological cycles (red square). With the 50% RDI irrigation treatment, water was supplied every two days and the soil VWC at a depth of 35 cm decreased from 36% to 27%. Rainy events began in April, ending with irrigation (green circle). Timing of flowering is important to reduce irrigation and increase water-use efficiency. A total of 43 irrigation events were carried out in 2018 compared to 10 in 2021. Temperature variations and bulk electrical conductivity [55] can affect the EC-5 sensors. However, as no fertilizers were employed during all these phenological stages we fully trust the measurements.

3.3. Effect of Irrigation Treatments on Yield and Fruit Size Using the Fuzzy Algorithm

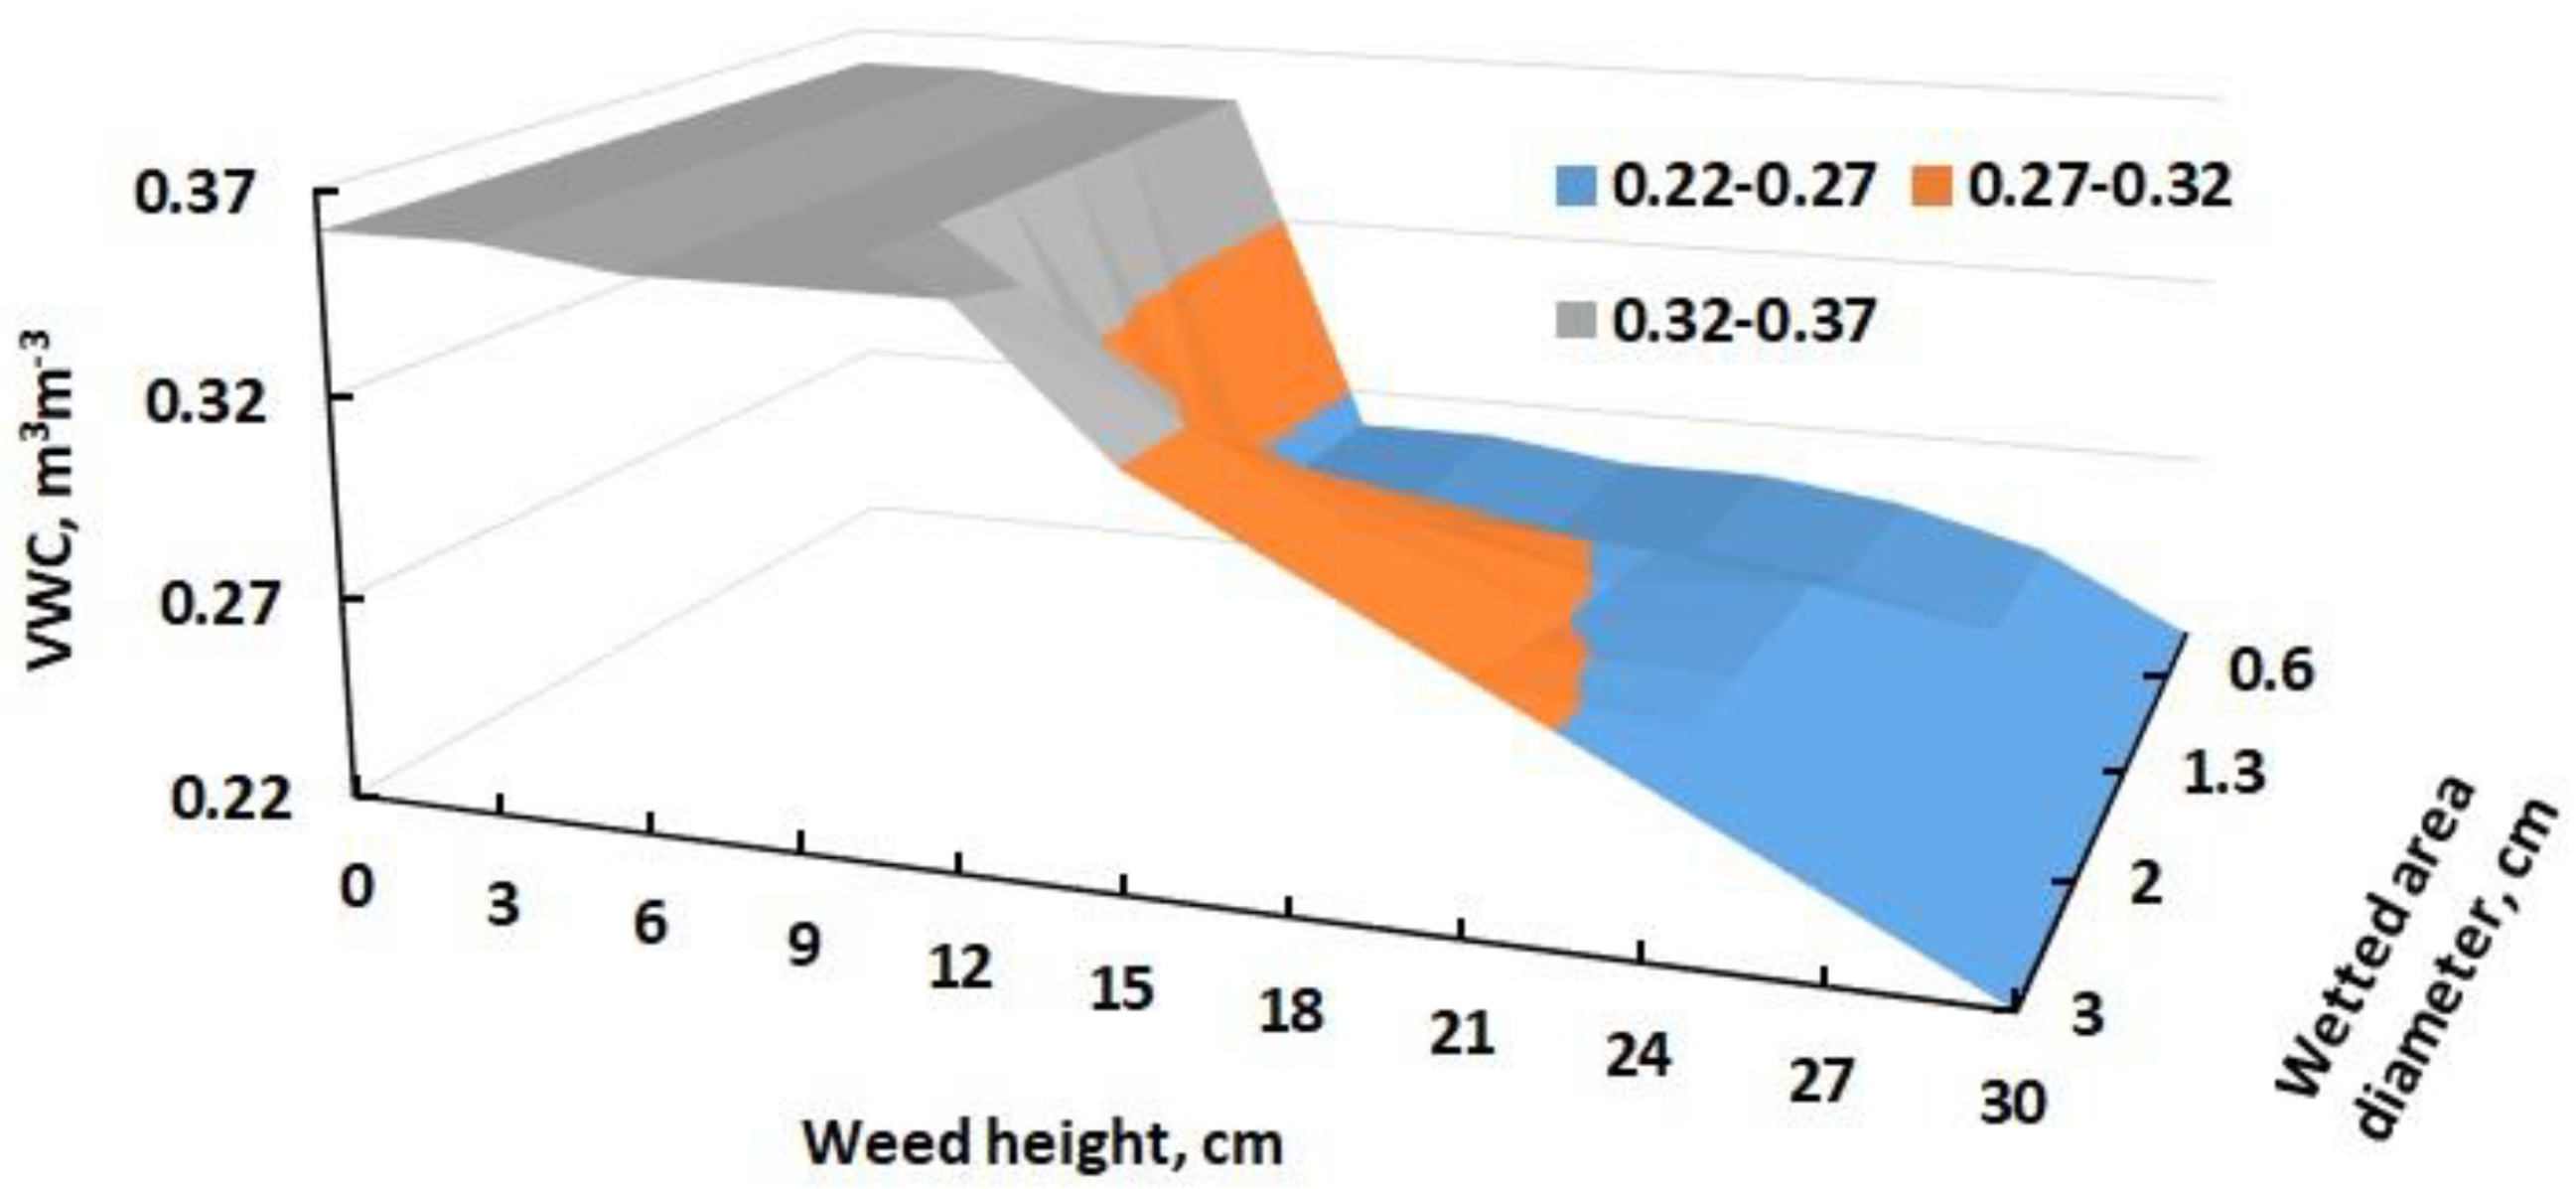
Weeds grow fast with surface rainwater allowing seeds to germinate, Table 1. Weeds interfere with micro-sprinklers reducing their wetting area, Figure 20. Without weeds, sprinklers wet an area with a diameter of 3 m. The humid soil area was reduced by half when weeds reached a height of 20 cm, decreasing soil VWC at a 35 cm depth from 36 to 28.5%. As weed height increased to 28 cm, VWC dropped to 22% and the wetted area had a diameter of only 0.5 m, Figure 20.
Mature trees during the 2020 and 2021 seasons received different quantities of water, changing specially during 2021 with the use of the fuzzy controller. Water applied by the irrigation system during 2021 stopped with rainwater. Each tree received four times more water during 2020 than 2021, Table 9. Fruit per tree was higher in 2021, than in 2020 due to the higher precipitation and reduced foliage. In both years, lower quantities of fruits and heavier produce were obtained with the RDI-2 50% treatment.
A higher fruit yield of 5.4% was produced in 2021 when compared with the 2020 harvest both using the 100% DI treatment. The increase in production was attributed to tree pruning and greater precipitation. Average fruit weight and yield obtained during 2021 is compared in Table 6 and Table 9, to see the effect of employing the fuzzy controller. In both 75% and 100% irrigation treatments a higher fruit yield was recorded with the fuzzy controller. In both cases, the pruning effect and rainfall differences were ruled out. Yield increases resulted from the use of the fuzzy controller, as excessive water application was avoided.
Mature trees were irrigated by different RDI treatments during 2020 and 2021. With the fuzzy controller, only 38% of the production period was irrigated during 2021. Yield comparisons during 2021 from trees irrigated with and without the fuzzy controller are shown in Table 7 and Table 10. There was no yield differences noted in 2021 with the use of the fuzzy controller in both the 100% DI and 50% RDI treatments. A 3% yield production difference was noted when using the 75% RDI treatment and the fuzzy controller. WUE increased by 260% when the fuzzy controller was used in all irrigation treatments.

3.4. Water-Use Efficiency under Each Irrigation Treatment and with the Fuzzy Controller

Mature mango trees grown in clay loam soil and watered with several micro-sprinklers produced a better yield when more water was applied, Table 7. Two lateral pipes irrigated each tree and performed similar to the apple drip irrigation experiment carried out in an apple orchard in the Central Valley of Chile [76]. Micro-sprinklers watered the soil where the largest amount of roots scatter around. This wetted area beneath the canopy provided enough water, so that 35 cm deep roots were always active. Superficial watering may not be effective due to soil evaporation [76]. At the Loma Bonita mango plantation, it was noted that the 200 L day−1 treatment (DI 100%), was excessive for mature trees. After one day, the volumetric soil content at 35 cm deep was over 30%, Figure 6b. The 50% deficit irrigation presented 29% VWC after two days in clay loamy soil. Soil moisture sensing is a better option to control water scheduling. WUE increased by 62.3% in mature trees during 2020 by watering with the 50% RDI treatment instead of 100% DI, Table 7. After mature tree pruning in 2021, WUE increased by 85.2% when 50% RDI was used instead of 100% DI, Table 7. WUE in high-density trees increased by 49% in 2020, when water was supplied by the 50% RDI treatment instead of the 100% DI irrigation, Table 6. Although pruning was less severe in HD trees, WUE increased by 77% in 2021 when using 50% RDI irrigation instead of 100% DI, Table 6. The fuzzy controller was useful to obtain higher WUE, being the maximum 87.59 kg m−3. This WUE was obtained in 2021 by using the 50% RDI treatment. Average high WUE values of 47.84 and 63.84 kg m−3 were obtained with the 100% DI and 75% RDI treatment, respectively, by using the fuzzy controller, Table 10. HD trees also presented high average WUE values of 29.9 and 34.5 kg m−3 for 100% DI and 75% RDI treatments, respectively, in 2021 when the fuzzy controller was employed, Table 9.

3.5. Mature versus High Density Orchard

Water supplied per hectare was superior in mature trees than in HD trees, although in the later year there were more trees. WUE was higher in mature trees with 50% RDI as better a yield was obtained, Table 11. Mature trees produced between 33.58 and 36.15 ton ha−1 (Table 10), meanwhile HD trees produced an average 9.25 ton ha−1; yield was 3.79 higher in mature trees. Even in a 4 × 4 HD orchard under the same conditions, yield obtained was 24.7 ton ha−1, still lower than the mature tree production.
Experiments in India showed that 1600 ‘Amrapali’ trees per hectare produced 22 ton ha−1 seven years after planting [77]. There are significant differences in yield levels under various planting densities. Maximum net returns between different planting density indicated that 5 × 5 m (400 plants/ha) was the highest [78]. In a complete economic study, it was stated that average fruit yield per hectare of 5 × 5 m HDP (high-density plantation) and traditional orchards were 18.48 and 8.65 tons, respectively [79,80]. This yield for the HDP occurs eight years after planting. Intense ultra-high-density (UHD) orchards attract arthropods and flies due to an increase in humidity and a decline in low light intensity [78,81]. This combination caused by an increase in tree canopy, favors insect pest proliferation [78]. For example, leaf hopper has been reported to have its highest population under ultra-high-density systems, such as 4.2 × 0.9 m (2646 trees/ha), 4.2 × 1.2 m (1984 trees/ha) where too many trees cohabit. Trees with a 5 × 5 m spacing is the more profitable from an entomological and agronomical point of view [78].

4. Discussion

Tree pruning is an important orchard management operation. Canopy structure is related to tree growth and yield, providing a strong indicator of water consumption [44]. Tree shaping and pruning provides the final canopy architecture [82]. Tree pruning optimizes the number of branches left, and open shapes allow better light capture [39,82]. With our radiation measurements, total day transmission ratio (TRt) of pruned trees ranged between 0.61 and 0.67. Unpruned tree TRt only accounted for 0.31, being half of the collected radiation obtained by trimmed trees. Field measurements carried out on the Loma Bonita mature trees was time-consuming and canopy volume estimation presented errors of 7–12%. LiDAR (light detection and ranging) is more precise and relies on laser time-of-flight, but this equipment was not used as it is expensive [83]. Some researchers [64,84,85] observed that fruit yield was significantly affected by pruning during the first year, whereas in the second year the production increased. In our HD trees, canopy volume did not decrease at all, meanwhile production increased a little bit. Mature trees decreased their canopy volume after pruning but yield during 2021 increased considerably for all irrigation treatments, Figure 18; both fruit weight and fruits per tree increased in 2021. Total average yield per mature tree watered with 100% DI before pruning was 226.41 kg tree−1 and increased one year later to 361.53 kg tree−1 (Table 10). Additionally, HD trees watered with 100% DI increased their yield after trimming from 37.6 to 44.83 kg tree−1 (Table 9). This difference is not huge and relates to tree age. Mango fruit’s biochemical properties change with age, with the carotenoid content and the total soluble solids are higher in 30-year-old trees than in 8-year-old trees [86]. Tree pruning also increases fruit firmness and total carotenoids [64]. In mid-October of 2020 and 2021 after pruning, irrigation was shut down.
Artificial intelligence is being applied to optimize irrigation scheduling [87,88]. Climatic and crop evapotranspiration data are used in real-time decision support systems [89]. A fuzzy algorithm provided the watering period after measuring air temperature, solar radiation and soil moisture [90]. The system maintained soil water content over 30% for apple trees throughout all the year. Another fuzzy algorithm was used to produce giant curled mustard (Brassica juncea) in Thailand [91]. The fuzzification process used the crop water stress index (CWSI) and soil moisture as variables, increasing yield by 22.58% and saving applied water by 59.61% [91]. Our fuzzy controller is based on solving irrigation scheduling after water storms. Rain affects the amount of water that the plant requires by irrigation [92]. When the precipitation of three consecutive days exceeds a threshold, it can be considered useful, but excessive volumes of rain that does not reach the roots is worthless [92]. We found that storm water precipitation maintained the soil moisture, and after two weeks weed growth affected micro-sprinkler performance. If black polyethylene pipes are not removed it will require excessive manual labor to remove the weeds at the end of the harvest, with the possibility of breaking the pipes. As the irrigation system was not used anymore after the fuzzy controller’s advice, and mango production remained constant, WUE increased.
Plant growth depends on soil water content and soil oxygen movement, with both essential for root processes. When soil becomes water-saturated for long periods due to over-irrigation or rainstorms, oxygen is not supplied to the roots [93,94,95]. Roots grow around the emitter area in subsurface drip irrigation, receiving a poor oxygen supply during excess wetting [96]; micro-sprinklers have the advantage of spraying the water and capturing oxygen. Many controllers use soil moisture sensors and future work will analyze the data saved during the last two seasons to train an AI algorithm.
Capacitance soil moisture sensors are commonly used for irrigation scheduling applications due to its low cost and continuous monitoring [91]. However, soil moisture calculations can exceed watering by 20–30% [94]. Soil texture, bulk density, salinity, and stones present can affect sensor performance [97]. EC-5 probes read volumetric soil water content properly below 0.27 cm3 cm−3 against watermark potential sensors [73]. After irrigation reduction, the great amount of water stored in the soil at a depth of 30 cm supplies their daily transpiration rate. For example, olive trees without irrigation for one month recorded a decrease in volumetric water content of 0.02 a depth of 40 cm [73]. At 30 cm deep, apple tree root density was the highest, with the critical VWC threshold of non-limiting water at 0.25 cm3 cm−3 [98]. Our EC-5 probes, buried at a depth of 35 cm, monitored soil moisture every hour during all the tree phenological stages from flowering to harvest (Figure 19). Soil VWC at a depth of 35 cm varied from 36 to 27% with the 50% RDI irrigation treatment. A study carried out in Japan and Thailand measured daily soil water moisture with ECH2O-TE probes [99]. VWC was over 0.6 throughout the rainy season at a depth of 25 cm. A low VWC of 0.27 at the same depth was maintained afterwards by the farmers’ practices for flower induction. Irrigation caused VWC to vary between 0.4 and 0.27 cm3 cm−3, but soil moisture should remain wet just below field capacity [100].
Capacitance sensors placed at a depth of 30 cm were very sensitive to irrigation events and responded quickly. Minimum pre-irrigation signals were obtained as well as maximum values after irrigation [101]. Automatic irrigation scheduling with the IRRIX system was carried out on olives trees with data obtained from capacitive sensors buried at depths of 30 and 60 cm [102]. Recognition of soil water content requires high and low reference values. The high reference corresponds to the field capacity and a low reference to the deficit irrigation conditions; the driest value recorded every day becomes the low reference [101]. It is important to add another probe at a depth of 90 cm that can predict water drainage. Leaf degradation and organic matter provides a great amount of the nutrients required by the trees. If fertilizers have been added for several years, two or three over-irrigation events will help to reduce salt accumulation in the root zone. Soil moisture controllers do not consider plant transpiration and terrain topography.
Tree water consumption for WUE calculations should include rainfall and irrigation [103]. Nevertheless, we only used the water applied by the irrigation system. We applied fixed interval irrigation for each treatment, and WUE values varied during both years and under pruning conditions. In Ukraine, a smart irrigation system decreased irrigation watering, due to a controlled water supply and timing [94]. WUE can increase even further with the use of sensors throughout the season. The RDI impact on fruit weight, trunk diameter and fruits per tree was insignificant for mature and HD trees. Similar results were reported in pear [104] and apple trees [98]. Water scarcity and availability throughout the season, especially during flowering, fruit set and fruit growth, may affect yield and WUE. Different irrigation RDI strategies were studied under variable water needs and climatic scenarios [105]. Root distribution in the soil profile plays an important role on the irrigation system to be used [106]. The tree’s capacity to use water held in the soil effectively where root systems co-exist requires to reconsider deficit irrigation [73]. The results obtained in our experiments shows correlations of yield with WUE. As yield increased in mature trees with the 100% DI treatment, WUE had its minimum value. The better values of WUE were encountered with RDI treatments of 50%. As well, highest fruit yield and WUE was reported for date palms with an irrigation system at 50% ETc [107].

5. Conclusions

Although this study shows variations on fruit yield caused by different irrigation treatments it brought many other conclusions. Mature and HD trees were grown in clay loamy soil and received irrigation through micro-sprinklers. Three different treatments, 100% ETc, RDI 75% ETc and RDI 50%, were used and tree yield and fruit size were analyzed. Important points worth mentioning are highlighted in the following statements:
  • Novel techniques were used to obtain morphological measurements of trees and for fruit counting using images from a smartphone. A high correlation R2 = 0.98 was recorded between image counting and manual fruit picking.
  • Radiation was measured at the bottom of the canopy to obtain the GCF and these parameters can be used in the future to predict yields.
  • Soil moisture measurements at 35 cm deep with EC-5 probes showed that daily 100% ETc irrigation was not necessary. The 50% RDI treatment maintains soil moisture within the water available zone.
  • Mature trees without pruning (2020-Table 7) presented greater yields with 100% irrigation. Yield was 22% higher with this treatment than with 50% RDI. Although there were less fruits per tree in the HD trees without pruning (2020-Table 6), the yield decreased by 33.5% when half the water was applied per tree (50% RDI).
  • Pruning affected canopy volume and yield considerably. A decrease of 29.2% in canopy volume was obtained after averaging all the mature trees before and after pruning. An average canopy volume loss of 2.6% was noted in trimmed HD trees. Mango production in mature trees increased by 59.6% (Table 7) after pruning, using the same trees under 100% DI treatment. First and second year productivity differences after pruning were insignificant. Minimum yield was obtained in mature trees with the 50% RDI irrigation treatment, decreasing 7.6% with respect to the production obtained with 100% DI. HD trees after pruning increased their average yield by 5.4%, with the same trees irrigated by the 100% DI treatment during 2020 and 2021. An average fruit size of 753.6 g was obtained with the 50% RDI treatment, heavier than the 710.2 g fruits produced with 100% DI. Nevertheless, yield was higher with the 100% DI treatment as more fruits were produced per tree.
  • The fuzzy controller was used as a rain gauge during its operation. Yield from mature trees was not affected with its use, but a much better WUE achieved. WUE varied from 47 to 87 kg m−3 (Table 10) in mature trees with the use of the fuzzy controller and the selected irrigation treatment. Yield increased by 13.1% in 2021 by using the fuzzy controller in pruned HD trees with 100% DI. With the higher yield and fewer irrigation periods, WUE increased to 29.89 kg m−3. Without using the fuzzy controller in HD trees, yield and WUE were 39.62 kg tree−1 and 6.3 kg m−3, respectively under the 100% DI treatment (Table 9).
  • The intelligent controller was designed to forecast when to remove the lateral polyethylene pipes when the micro-sprinklers no longer worked properly anymore. Soil VWC at a depth of 35 cm decreased from 36 to 28.5%, when weed height reached 20 cm; the sprinkler’s wetting area decreased to half of the normal weed-free area.
  • The high-density trees produced 3.8 times less fruit per hectare than the traditional 100 mature tree plantation, with WUE also being lower. Water supplied per hectare was lower in the HD plantation.
Future work should consider pruning efficiency and flowering time control, as it makes a lot of difference in watering for mango production if it occurs during the dry season. WUE increases considerably and yield tends to decrease. It is also recommendable to produce mango fruits well below 900 g as this size cannot be exported and has no market unless it is used for processing. Soil water automation with the 35 and 90 cm deep probes can save even more water and is being tested during this season.

Author Contributions

Conceptualization, F.H., S.V. and C.N.-G.; literature collection, C.N.-G. and S.V.; Methodology, S.V.; project administration, C.N.-G., writing—original draft, F.H.; writing—review and editing, C.N.-G. and F.H.; formal analysis, S.V. All authors have read and agreed to the published version of the manuscript.

Funding

This research received no external funding.

Institutional Review Board Statement

Not applicable.

Informed Consent Statement

Not applicable.

Data Availability Statement

Not applicable.

Acknowledgments

The authors are grateful to the MI Jesus Antonio Garcia Martinez who helped to realize the statistical analysis and to Luis Lombera who carried out several agricultural activities in the farm. Authors thank the Universidad Autonoma Chapingo that provided administrative and technical support throughout project DGIP: 22007-DTT-65.

Conflicts of Interest

The authors declare that they have no known competing financial interests or personal relationships that could have appeared to influence the work reported in this paper.

References

  1. FAO. The State of the World’s Land and Water Resources for Food and Agriculture (SOLAW): Managing Systems at Risk; Food and Agriculture Organization of the United Nations: Rome, Italy, 2011. [Google Scholar]
  2. FAO. Towards a Water and Food Secure Future: Critical Perspectives for Policy-Makers; Food and Agriculture Organization of the United Nations: Rome, Italy, 2015; pp. 1–61. [Google Scholar]
  3. Getirana, A.; Libonati, R.; Cataldi, M. Brazil is in water crisis—It needs a drought plan. Nature 2021, 600, 218–220. [Google Scholar] [CrossRef] [PubMed]
  4. Bouman, B.; Tuong, T. Field water management to save water and increase its productivity in irrigated lowland rice. Agric. Water Manag. 2001, 49, 11–30. [Google Scholar] [CrossRef]
  5. Liu, J.; Zehnder, A.; Yang, H. Global consumptive water use for crop production: The importance of green water and virtual water. Water Resour. Res. 2009, 45, W05428. [Google Scholar] [CrossRef] [Green Version]
  6. Rendón, L.; Saucedo, H.; Fuentes, C. Gravity irrigation design. In Gravity Irrigation, 1st ed.; Fuentes, C., Rendón, L., Eds.; National Association of Irrigation Specialists: Mexico City, Mexico, 2017; pp. 345–386. [Google Scholar]
  7. ABS. Water Use on Australian Farms; Australian Bureau of Statistics (ABS): Canberra, Australia, 2018.
  8. Comisión Nacional del Agua (CONAGUA). Estadísticas del agua en México; Comisión Nacional del Agua (CONAGUA): Mexico City, Mexico, 2017; p. 275. [Google Scholar]
  9. Chávez, C.; Fuentes, C. Design and evaluation of surface irrigation systems applying an analytical formula in the irrigation district 085, La Begoña, Mexico. Agric. Water Manag. 2019, 221, 279–285. [Google Scholar] [CrossRef]
  10. Koech, R.; Langat, P. Improving Irrigation Water Use Efficiency: A Review of Advances, Challenges and Opportunities in the Australian Context. Water 2018, 10, 1771. [Google Scholar] [CrossRef] [Green Version]
  11. Mayer, A.; Rienzner, M.; de Maria, S.C.; Romani, M.; Lasagna, A.; Facchi, A. Correction: Mayer, A.; et al.. A Comprehensive Modelling Approach to Assess Water Use Efficiencies of Different Irrigation Management Options in Rice Irrigation Districts of Northern Italy. Water 2019, 11, 1833. [Google Scholar] [CrossRef] [Green Version]
  12. Costa, J.; Ortuno, M.; Chaves, M. Deficit irrigation as a strategy to save water: Physiology and potential application to horticulture. J. Integr. Plant Biol. 2007, 49, 1421–1434. [Google Scholar] [CrossRef]
  13. Garcia-Tejero, I.; Duran, Z.V.H.; Jimenez, B.J.A.; Muriel, F.J.L. Improved water-use efficiency by deficit-irrigation programmes: Implications for saving in citrus orchards. Sci. Hortic. 2011, 128, 274–282. [Google Scholar] [CrossRef]
  14. Galindo, A.; Collado-González, J.; Griñán, I.; Corell, M.; Centeno, A.; Martín-Palomo, M.; Giróne, I.; Rodríguez, P.; Cruz, Z.; Memmi, H.; et al. Deficit irrigation and emerging fruit crops as a strategy to save water in Mediterranean semiarid agrosystems. Agric. Water Manag. 2018, 202, 311–324. [Google Scholar] [CrossRef]
  15. Quiñones, A.; Polo-Folgado, C.; Chi-Bacab, U.; Martínez-Alcántara, B.; Legaz, F. Water Productivity and Fruit Quality in Deficit Drip Irrigated Citrus Orchards. In Chapter 3. Irrigation Systems and Practices in Challenging Environments; Lee, T.S., Ed.; Intech: Croatia, Yugoslavia, 2012; pp. 33–56. ISBN 978-953-51-0420-9. [Google Scholar]
  16. García-Tejero, I. Deficit Irrigation for Sustainable Citrus Cultivation in Guadalquivir River Basin. Ph.D. Thesis, Universidad de Sevilla, Sevilla, Spain, 2010; p. 285. [Google Scholar]
  17. Al-Ghobari, H.; Mohammad, F. Intelligent irrigation performance: Evaluation and quantifying its ability for conserving water in arid region. Appl. Water Sci. 2011, 1, 73–83. [Google Scholar] [CrossRef]
  18. Badran, A.; Kashmoola, M. Smart Agriculture; Farm Irrigation System Using IoT. AL-Rafidain J. Comput. Sci. Math. 2020, 14, 75–83. [Google Scholar] [CrossRef]
  19. Loukatos, D.; Lygkoura, K.; Maraveas, C.; Arvanitis, K. Enriching IoT Modules with Edge AI Functionality to Detect Water Misuse Events in a Decentralized Manner. Sensors 2022, 22, 4874. [Google Scholar] [CrossRef]
  20. Ko, J.; Piccinni, G. Corn yield responses under crop evapotranspiration-based irrigation management. Agric. Water Manag. 2009, 96, 799–808. [Google Scholar] [CrossRef]
  21. Montesano, F.; Van Ierselb, M.; Boaria, F.; Cantorea, V.; D’Amatoc, G.; Parente, A. Sensor-based irrigation management of soilless basil using a new smart irrigation system: Effects of set-point on plant physiological responses and crop performance. Agric. Water Manag. 2018, 203, 20–29. [Google Scholar] [CrossRef]
  22. Jones, H.G. Irrigation scheduling: Advantages and pitfalls of plant-based methods. J. Exp. Bot. 2004, 55, 2427–2436. [Google Scholar] [CrossRef] [PubMed] [Green Version]
  23. Bhalage, P.; Jadia, P.; Sangale, S. Case Studies of Innovative Irrigation Management Techniques. Aquat. Procedia 2015, 4, 1197–1202. [Google Scholar] [CrossRef]
  24. Ghutke, P.; Agrawal, R. An IoT-based Immersive Approach to Sustainable Farming. In Irrigation and Drainage—Recent Advances; Sultan, M., Ahmad, F., Eds.; IntechOpen: London, UK, 2022; p. 21. [Google Scholar]
  25. Ramachandran, V.; Ramalakshmi, R.; Kavin, B.P.; Hussain, I.; Almaliki, A.H.; Almaliki, A.A.; Elnaggar, A.Y.; Hussein, E.E. Exploiting IoT and Its Enabled Technologies for Irrigation Needs in Agriculture. Water 2022, 14, 719. [Google Scholar] [CrossRef]
  26. García, L.; Parra, L.; Jimenez, J.; Lloret, J.; Lorenz, P. IoT-Based Smart Irrigation Systems: An Overview on the Recent Trends on Sensors and IoT Systems for Irrigation in Precision Agriculture. Sensors 2020, 20, 1042. [Google Scholar] [CrossRef] [Green Version]
  27. Tsouros, D.; Bibi, S.; Sarigiannidis, P. A Review on UAV-Based Applications for Precision Agriculture. Information 2019, 10, 349. [Google Scholar] [CrossRef] [Green Version]
  28. Boursianis, A.; Papadopoulou, M.; Panagiotis Diamantoulakis, P.; Liopa-Tsakalidi, A.; Barouchas, P.; Salahas, G.; Karagiannidis, G.; Wan, S.; Goudos, S. Internet of Things (IoT) and Agricultural Unmanned Aerial Vehicles (UAVs) in smart farming: A comprehensive review. Internet Things 2022, 18, 100187. [Google Scholar] [CrossRef]
  29. Quebrajo, L.; Perez-Ruiz, M.; Pérez-Urrestarazu, L.; Martínez, G.; Egea, G. Linking thermal imaging and soil remote sensing to enhance irrigation management of sugar beet. Biosyst. Eng. 2018, 165, 77–87. [Google Scholar] [CrossRef]
  30. Saddik, A.; Latif, R.; El Ouardi, A.; Elhoseny, M.; Khelifi, A. Computer development based embedded systems in precision agriculture: Tools and application. Acta Agric. Scand. Sect. B—Soil Plant Sci. 2022, 72, 589–611. [Google Scholar] [CrossRef]
  31. Bazzi, H.; Baghdadi, N.; Fayad, I.; Zribi, M.; Belhouchette, H.; Demarez, V. Near Real-Time Irrigation Detection at Plot Scale Using Sentinel-1 Data. Remote Sens. 2020, 12, 1456. [Google Scholar] [CrossRef]
  32. Lipan, L.; Carbonell-Pedro, A.A.; Cárceles Rodríguez, B.; Durán-Zuazo, V.H.; Franco Tarifa, D.; García-Tejero, I.F.; Gálvez Ruiz, B.; Cuadros Tavira, S.; Muelas, R.; Sendra, E.; et al. Can Sustained Deficit Irrigation Save Water and Meet the Quality Characteristics of Mango? Agriculture 2021, 11, 448. [Google Scholar] [CrossRef]
  33. Fukuda, S.; Spreer, W.; Yasunaga, E.; Yuge, K.; Sardsud, V.; Müller, J. Random Forests modelling for the estimation of mango (Mangifera indica L. cv. Chok Anan) fruit yields under different irrigation regimes. Agric. Water Manag. 2013, 116, 142–150. [Google Scholar] [CrossRef]
  34. Levin, A.; Peres, M.; Noy, M.; Love, V.; Gal, Y.; Naor, A. The response of field-grown mango (cv. Keitt) trees to regulated deficit irrigation at three phenological stages. Irrig. Sci. 2018, 36, 25–35. [Google Scholar] [CrossRef]
  35. Santos, M.; Rodrigues Donato, S.; Coelho, E.; Cotrim, P.; de Castro, I. Irrigation deficit strategies on physiological and productive parameters of Tommy Atkins mango. Rev. Caatinga Mossoró 2016, 29, 173–182. [Google Scholar]
  36. Durán, V.; Rodriguez, C.; Tarifa, D. Impact of sustained-deficit irrigation on tree growth, mineral nutrition, fruit yield and quality of mango in Spain. Fruits 2011, 66, 257–268. [Google Scholar] [CrossRef] [Green Version]
  37. Hahn, F.; García, J. Mango Stem Response under Different Irrigation Regimes. Int. J. Fruit Sci. 2022, 22, 35–56. [Google Scholar] [CrossRef]
  38. Persello, S.; Grechi, I.; Boudon, F.; Normand, F. Nature abhors a vacuum: Deciphering the vegetative reaction of the mango tree to pruning. Eur. J. Agron. 2019, 104, 85–96. [Google Scholar] [CrossRef]
  39. Westling, F.; Underwood, P.; Bryson, M. A procedure for automated tree pruning suggestion using LiDAR scans of fruit trees. Comput. Electron. Agric. 2021, 187, 106274. [Google Scholar] [CrossRef]
  40. Hampson, C.; Quamme, H.; Brownlee, R. Canopy growth, yield, and fruit quality of ‘Royal Gala’ apple trees grown for 8 years in five tree training systems. HortScience 2002, 37, 627–631. [Google Scholar] [CrossRef] [Green Version]
  41. Kumar, S.P.; Maurer, D.; Feygenberg, O.; Love, C.; Alkan, N. Improving the Red Color and Fruit Quality of ‘Kent’ Mango Fruit by Pruning and Preharvest Spraying of Prohydrojasmon or Abscisic Acid. Agronomy 2020, 10, 944. [Google Scholar] [CrossRef]
  42. Williams, L.; Ayars, J. Grapevine water use and the crop coefficient are linear functions of the shaded area measured beneath the canopy. Agr Forest Meteorol. 2005, 132, 201–211. [Google Scholar] [CrossRef]
  43. Sharma, R.; Singh, C.; Saxena, S.; Pandey, S.; Chhonkar, O. Cluster planting favours malformation and influences yield and fruit quality in mango. Ann. Agric. Res. 2001, 22, 48–51. [Google Scholar]
  44. Wu, D.; Phinn, S.; Johansen, K.; Robson, A.; Muir, J.; Searle, C. Estimating Changes in Leaf Area, Leaf Area Density, and Vertical Leaf Area Profile for Mango, Avocado, and Macadamia Tree Crowns Using Terrestrial Laser Scanning. Remote Sens. 2018, 10, 1750. [Google Scholar] [CrossRef] [Green Version]
  45. Cotrim, C.; Coelho Filho, M.; Coelho, E.; Ramos, M.; Cecon, P. Regulated deficit irrigation and Tommy Atkins mango orchard productivity under micro sprinkling in Brazilian semi-arid. Eng. Agrícola 2011, 31, 1052–1063. [Google Scholar] [CrossRef] [Green Version]
  46. Simões, W.; Aparecida do Carmo Mouco, M.; Pimenta Martins de Andrade, V.; Paulo Bezerra, P.; Ferreira Coelho, E. Fruit yield and quality of Palmer mango trees under different irrigation systems. Comun. Sci. 2020, 11, e3254. [Google Scholar] [CrossRef]
  47. dos Santos, M.R.; Martinez, M.A. Soil water distribution and extraction by ‘Tommy Atkins’ mango (Mangifera indica L.) trees under different irrigation regimes. Idesia 2013, 31, 7–16. [Google Scholar] [CrossRef] [Green Version]
  48. Mirjat, M.; Jiskani, M.; Siyal, A.; Mirjat, M. Mango production and fruit quality under properly managed drip irrigation system. Pak. J. Agri. Agril. Engg. Vet. Sci. 2011, 27, 1–12. [Google Scholar]
  49. Simões, W.; Ferreira, P.; Mouco, M.; Guimarães, M.; Silva, J. Produção e respostas fisiológicas da mangueira cv. Keitt sob diferentes sistemas de irrigação no Submédio do São Francisco. Irriga 2018, 23, 34–43. [Google Scholar] [CrossRef]
  50. NaanDanJain. Micro Sprinklers Catalog. 2018, p. 40. Available online: https://naandanjain.com/wp-content/uploads/2018/11/NDJ_Micro_catalog_eng_030722F.pdf (accessed on 13 August 2022).
  51. Donlagic, W.; Zavrsnik, M.; Sirotic, I. The use of onedimensional acoustical gas resonator for fluid level measurements. IEEE Trans. Instrum. Meas. 2000, 49, 1095–1100. [Google Scholar] [CrossRef]
  52. Rashid, M.; Rabani bin, M.; Romlay, M.; Ferdaus, M.; Al-Mamun, A. Development of Electronic Rain Gauge System. Int. J. Electron. Electr. Eng. 2015, 3, 245–249. [Google Scholar]
  53. ONSET Hobo Data logger. Davis® Rain Gauge Smart Sensor (S-RGC-M002, S-RGD-M002) Manual. 2016. 19878-A MAN-S-RGCD. p. 4. Available online: https://www.onsetcomp.com/files/manual_pdfs/19878-AMAN-S-RGCD.pdf (accessed on 4 August 2022).
  54. Bogena, H.; Huisman, J.; Oberdörster, C.; Vereecken, H. Evaluation of a low-cost soil water content sensor for wireless network applications. J. Hydrol. 2007, 344, 32–42. [Google Scholar] [CrossRef]
  55. Blonquist, J.; Jones, S.; Robinson, D. Standardizing characterization of electromagnetic water content sensors. Part 2. Evaluation of seven sensing systems. Vadose Zone J. 2005, 4, 1059–1069. [Google Scholar] [CrossRef]
  56. Kanso, T.; Gromaire, M.; Ramier, D.; Dubois, P.; Chebbo, G. An Investigation of the Accuracy of EC5 and 5TE Capacitance Sensors for Soil Moisture Monitoring in Urban Soils-Laboratory and Field Calibration. Sensors 2020, 20, 6510. [Google Scholar] [CrossRef] [PubMed]
  57. Kodešová, R.; Kodeš, V.; Mráz, A. Comparison of two sensors ECH2O EC-5 and SM200 for measuring soil water content. Soil Water Res. 2011, 6, 102–110. [Google Scholar] [CrossRef] [Green Version]
  58. Gavrilescu, M. Water, Soil, and Plants Interactions in a Threatened Environment. Water 2021, 13, 2746. [Google Scholar] [CrossRef]
  59. da Silva, A.; Coolong, T.; Diaz-Perez, J.C. Principles of irrigation and scheduling for vegetable crops in Georgia. UGA Coop. Ext. Bull. 2019, 1511, 2–12. [Google Scholar]
  60. Lal, B.; Mishra, D. Effect of pruning on growth and bearing behavior of mango cv. Chausa. Indian J. Hortic. 2007, 64, 268–270. [Google Scholar]
  61. Davenport, T. Pruning Strategies to Maximize Tropical Mango Production from the Time of Planting to Restoration of Old Orchards. HortScience 2006, 41, 544–548. [Google Scholar] [CrossRef] [Green Version]
  62. Martínez-Cob, A.; Faci González, J.; Blanco Alibés, O.; Medina Pueyo, E.; Suvočarev, K. Use of pyranometers for continuous estimation of ground cover fraction in orchards. In Proceedings of the 1st CIGR Inter-Regional Conference on Land and Water Challenges, Bari, Italy, 10–14 September 2013. [Google Scholar]
  63. Sharma, R.; Singh, R.; Singh, D. Influence of pruning intensity on light penetration and leaf physiology in high-density orchards of mango trees. Fruits 2006, 61, 117–123. [Google Scholar] [CrossRef] [Green Version]
  64. Asrey, R.; Patel, V.; Barman, K.; Pal, R. Pruning affects fruit yield and postharvest quality in mango (Mangifera indica L.) cv. Amrapali. Fruits 2013, 68, 367–380. [Google Scholar] [CrossRef] [Green Version]
  65. Anderson, N.T.; Walsh, K.B.; Koirala, A.; Wang, Z.; Amaral, M.H.; Dickinson, G.R.; Sinha, P.; Robson, A.J. Estimation of Fruit Load in Australian Mango Orchards Using Machine Vision. Agronomy 2021, 11, 1711. [Google Scholar] [CrossRef]
  66. Qureshi, W.; Payne, A.; Walsh, K.; Linker, R.; Cohen, O.; Dailey, M. Machine vision for counting fruit on mango tree canopies. Precis. Agric 2017, 18, 224–244. [Google Scholar] [CrossRef]
  67. Payne, A.; Walsh, K. Machine vision in estimation of crop yield. In Plant Image Analysis: Fundamentals and Applications; Gupta, S.D., Ibaraki, Y., Eds.; CRC Press: Boca Raton, FL, USA, 2014. [Google Scholar]
  68. Schupp, J.; Winzeler, H.; Kon, T.; Marini, R.; Baugher, T.; Kime, L.; Schupp, M. A Method for Quantifying Whole-tree Pruning Severity in Mature Tall Spindle Apple Plantings. HortScience 2017, 52, 1233–1240. [Google Scholar] [CrossRef]
  69. El-Kosary, E.; El-Shenawy, I.; Radwan, S. Effect of Pruning and Nitrogen Fertilization Rates on the Productivity of “Keitt” and “Tommy Atkins” Mango Trees. Am.-Eurasian J. Agric. Environ. Sci. 2019, 19, 279–290. [Google Scholar]
  70. Shaban, A. Effect of summer pruning and GA3spraying on inducing flowering and fruiting of Zebda mango trees. World J. Agric. Sci. 2009, 5, 337–344. [Google Scholar]
  71. Pereira, A.; Green, S.; Villa Nova, N. Sap flow, leaf area, net radiation and the Priestley–Taylor formula for irrigated orchards and isolated trees. Agric Water Manag. 2007, 92, 48–52. [Google Scholar] [CrossRef]
  72. Espadafor, M.; Orgaz, F.; Testi, L.; Lorite, I.; Villalobos, F. Transpiration of young almond trees in relation to intercepted radiation. Irrig. Sci. 2015, 33, 265–275. [Google Scholar] [CrossRef] [Green Version]
  73. Santos, F.; Valverde, P.; Ramos, A.; Reis, J.; Castanheira, N. Water use and response of a dry-farmed olive orchard recently converted to irrigation. Biosyst. Eng. 2007, 98, 102–114. [Google Scholar] [CrossRef]
  74. Huang, S.; Han, D.; Wang, J.; Guo, D.; Li, J. Floral Induction of Longan (Dimocarpus longan) by Potassium Chlorate: Application, Mechanism, and Future Perspectives. Front. Plant Sci. 2021, 12, 670587. [Google Scholar] [CrossRef] [PubMed]
  75. Yeshitela, T.; Robbertse, P.; Stassen, P. 2005 Potassium nitrate and urea sprays affect flowering and yields of ‘Tommy Atkins’ (Mangifera indica) mango in Ethiopia. South Afr. J. Plant Soil 2005, 22, 28–32. [Google Scholar] [CrossRef]
  76. Lecaros-Arellano, F.; Holzapfel, E.; Fereres, E.; Rivera, D.; Muñoz, N.; Jara, J. Effects of the number of drip laterals on yield and quality of apples grown in two soil types. Agric. Water Manag. 2021, 248, 106781. [Google Scholar] [CrossRef]
  77. Menzel, M.; Le Lagadec, M. Can the productivity of mango orchards be increased by using high-density plantings? Sci. Hortic. 2017, 219, 222–263. [Google Scholar] [CrossRef] [Green Version]
  78. Poornima, M.; Gopali, J.; Athani, S.; Venkateshalu; Patil, S. Impact of ultra-high density, high density and conventional planting systems on major insect pests of mango. J. Entomol. Zool. Stud. 2018, 6, 292–297. [Google Scholar]
  79. Joglekar, V.; Chivate, D.; Pujari, K. High density planting technique in dry region for ‘Kesar’ mango cultivation—A Savlaj pattern. Acta Hort. 2013, 992, 233–235. [Google Scholar] [CrossRef]
  80. Kerutagi, M.; Deshetti, M.; Abhilash, K. Comparative Economics of Traditional viz High Density Mango Cultivation in Karnataka. Asian J. Agric. Ext. Econ. Sociol. 2017, 18, 1–12. [Google Scholar] [CrossRef]
  81. Rahman, S.; Kuldeep. Mango hopper: Bio-ecology and management—A review. Agric. Rev. 2007, 28, 49–55. [Google Scholar]
  82. Tang, L.; Yin, D.; Chen, C.; Yu, D.; Han, W. Optimal Design of Plant Canopy Based on Light Interception: A Case Study with Loquat. Front. Plant Sci. 2019, 10, 364. [Google Scholar] [CrossRef]
  83. Verma, N.; Lamb, D.; Reid, N.; Wilson, B. Comparison of Canopy Volume Measurements of Scattered Eucalypt Farm Trees Derived from High Spatial Resolution Imagery and LiDAR. Remote Sens. 2016, 8, 388. [Google Scholar] [CrossRef] [Green Version]
  84. Singh, A.; Singh, C.; Bora, L. Impact of pruning on growth, yield and quality of mango cv. Dashehari. J. Hortic. Sci. 2017, 12, 118–123. [Google Scholar]
  85. Swaroop, M.; Sant, R.; Singh, C.; Shukla, P. Effect of pruning on growth, flowering and fruiting in mango. Indian J. Hort. 2001, 58, 303–308. [Google Scholar]
  86. Meena, N.; Asrey, R. Tree Age Affects Postharvest Attributes and Mineral Content in Amrapali Mango (Mangifera indica) Fruits. Hortic. Plant J. 2018, 4, 55–61. [Google Scholar] [CrossRef]
  87. Abioye, E.A.; Hensel, O.; Esau, T.J.; Elijah, O.; Abidin, M.S.Z.; Ayobami, A.S.; Yerima, O.; Nasirahmadi, A. Precision Irrigation Management Using Machine Learning and Digital Farming Solutions. AgriEngineering 2022, 4, 70–103. [Google Scholar] [CrossRef]
  88. Bhoi, A.; Nayak, R.; Bhoi, S.; Sethi, S.; Panda, S.; Sahoo, K.; Nayyar, A. IoT-IIRS: Internet of Things based intelligent-irrigation recommendation system using machine learning approach for efficient water usage. PeerJ Comput. Sci. 2021, 7, e578. [Google Scholar] [CrossRef] [PubMed]
  89. Chen, X.; Qi, Z.; Gui, D.; Gu, Z.; Ma, L.; Zeng, F.; Li, L.; Sima, M.W. A Model-Based Real-Time Decision Support System for Irrigation Scheduling to Improve Water Productivity. Agronomy 2019, 9, 686. [Google Scholar] [CrossRef] [Green Version]
  90. Benzaouia, M.; Bekkay, H.; Migan-Dubois, A.; Adel, M.; Rabhi, A. An intelligent irrigation system based on fuzzy logic control: A case study for Moroccan oriental climate region. In Proceedings of the 2nd International Conference on Embedded Systems and Artificial Intelligence (ESAI’21), Fez, Morocco, April 2021. [Google Scholar]
  91. Jamroen, C.; Komkum, P.; Fongkerd, C.; Krongpha, V. An Intelligent Irrigation Scheduling System Using Low-Cost Wireless Sensor Network Toward Sustainable and Precision Agriculture. IEEE Access 2020, 8, 172756–172769. [Google Scholar] [CrossRef]
  92. Difallah, W.; Benahmed, K.; Draoui, B.; Bounaama, F. Linear Optimization Model for Efficient Use of Irrigation Water. Int. J. Agron. 2017, 2017, 5353648. [Google Scholar] [CrossRef] [Green Version]
  93. Bhattarai, S.; Midmore, D.; Su, N. Sustainable irrigation to balance supply of soil water, oxygen, nutrients and agrochemicals. Sustain. Agric. Rev. 2010, 5, 253–286. [Google Scholar]
  94. Bazaluk, O.; Havrysh, V.; Nitsenko, V.; Mazur, Y.; Lavrenko, S. Low-Cost Smart Farm Irrigation Systems in Kherson Province: Feasibility Study. Agronomy 2022, 12, 1013. [Google Scholar] [CrossRef]
  95. Zhu, Y.; Dyck, M.; Cai, H.; Song, L.; Chen, H. The effects of aerated irrigation on soil respiration, oxygen, and porosity. J. Integr. Agric. 2019, 18, 2854–2868. [Google Scholar] [CrossRef]
  96. Machado., R.; Do RosArio, M.; Oliveira, G.; Portas, C. Tomato root distribution, yield and fruit quality under subsurface drip irrigation. Plant Soil 2003, 255, 333–341. [Google Scholar] [CrossRef]
  97. Vera, V.; Conejero, W.; Mira-García, A.; Conesa, M.; Ruiz-Sánchez, M. Towards irrigation automation based on dielectric soil sensors. J. Hortic. Sci. Biotechnol. 2021, 96, 696–707. [Google Scholar] [CrossRef]
  98. Chenafi, A.; Monney, P.; Arrigoni, E.; Boudoukha, A.; Carlen, C. Influence of irrigation strategies on productivity, fruit quality and soil-plant water status of subsurface drip-irrigated apple trees. Fruits 2016, 71, 69–78. [Google Scholar] [CrossRef] [Green Version]
  99. Yuge, K.; Yasunaga, E.; Fukuda, S.; Spreer, W.; Sardsud, V.; Pattanopo, W. Evaluation of Soil Water Management Difference in Mango Orchards between Thailand and Japan. Am. J. Plant Sci. 2013, 4, 182–187. [Google Scholar] [CrossRef] [Green Version]
  100. Mattar, M.A.; Soliman, S.S.; Al-Obeed, R.S. Effects of Various Quantities of Three Irrigation Water Types on Yield and Fruit Quality of ‘Succary’ Date Palm. Agronomy 2021, 11, 796. [Google Scholar] [CrossRef]
  101. Millán, S.; Casadesús, J.; Campillo, C.; Moñino, M.J.; Prieto, M.H. Using Soil Moisture Sensors for Automated Irrigation Scheduling in a Plum Crop. Water 2019, 11, 2061. [Google Scholar] [CrossRef] [Green Version]
  102. Millán, S.; Campillo, C.; Casadesús, J.; Pérez-Rodríguez, J.M.; Prieto, M.H. Automatic Irrigation Scheduling on a Hedgerow Olive Orchard Using an Algorithm of Water Balance Readjusted with Soil Moisture Sensors. Sensors 2020, 20, 2526. [Google Scholar] [CrossRef]
  103. Ali, M.; Talukder, M. Increasing water productivity in crop production–A synthesis. Agric. Water Manag. 2008, 95, 1201–1213. [Google Scholar] [CrossRef]
  104. Cheng, F.; Sun, H.; Shi, H.; Zhao, Z.; Wang, Q.; Zhang, J. Effects of regulated deficit irrigation on the vegetative and generative properties of the pear cultivar ‘Yali’. J. Agric. Sci. Technol. 2012, 14, 183–194. [Google Scholar]
  105. Molina-Moral, J.; Moriana-Elvira, A.; Pérez-Latorre, F. The Sustainability of Irrigation Strategies in Traditional Olive Orchards. Agronomy 2022, 12, 64. [Google Scholar] [CrossRef]
  106. Mohamadzade, F.; Gheysari, M.; Kiani, M. Root adaptation of urban trees to a more precise irrigation system: Mature olive as a case study. Urban For. Urban Green. 2021, 60, 127053. [Google Scholar] [CrossRef]
  107. Mohammed, M.; Sallam, A.; Munir, M.; Ali-Dinar, H. Effects of deficit irrigation scheduling on water use, gas exchange, yield, and fruit quality of date palm. Agronomy 2021, 11, 2256. [Google Scholar] [CrossRef]
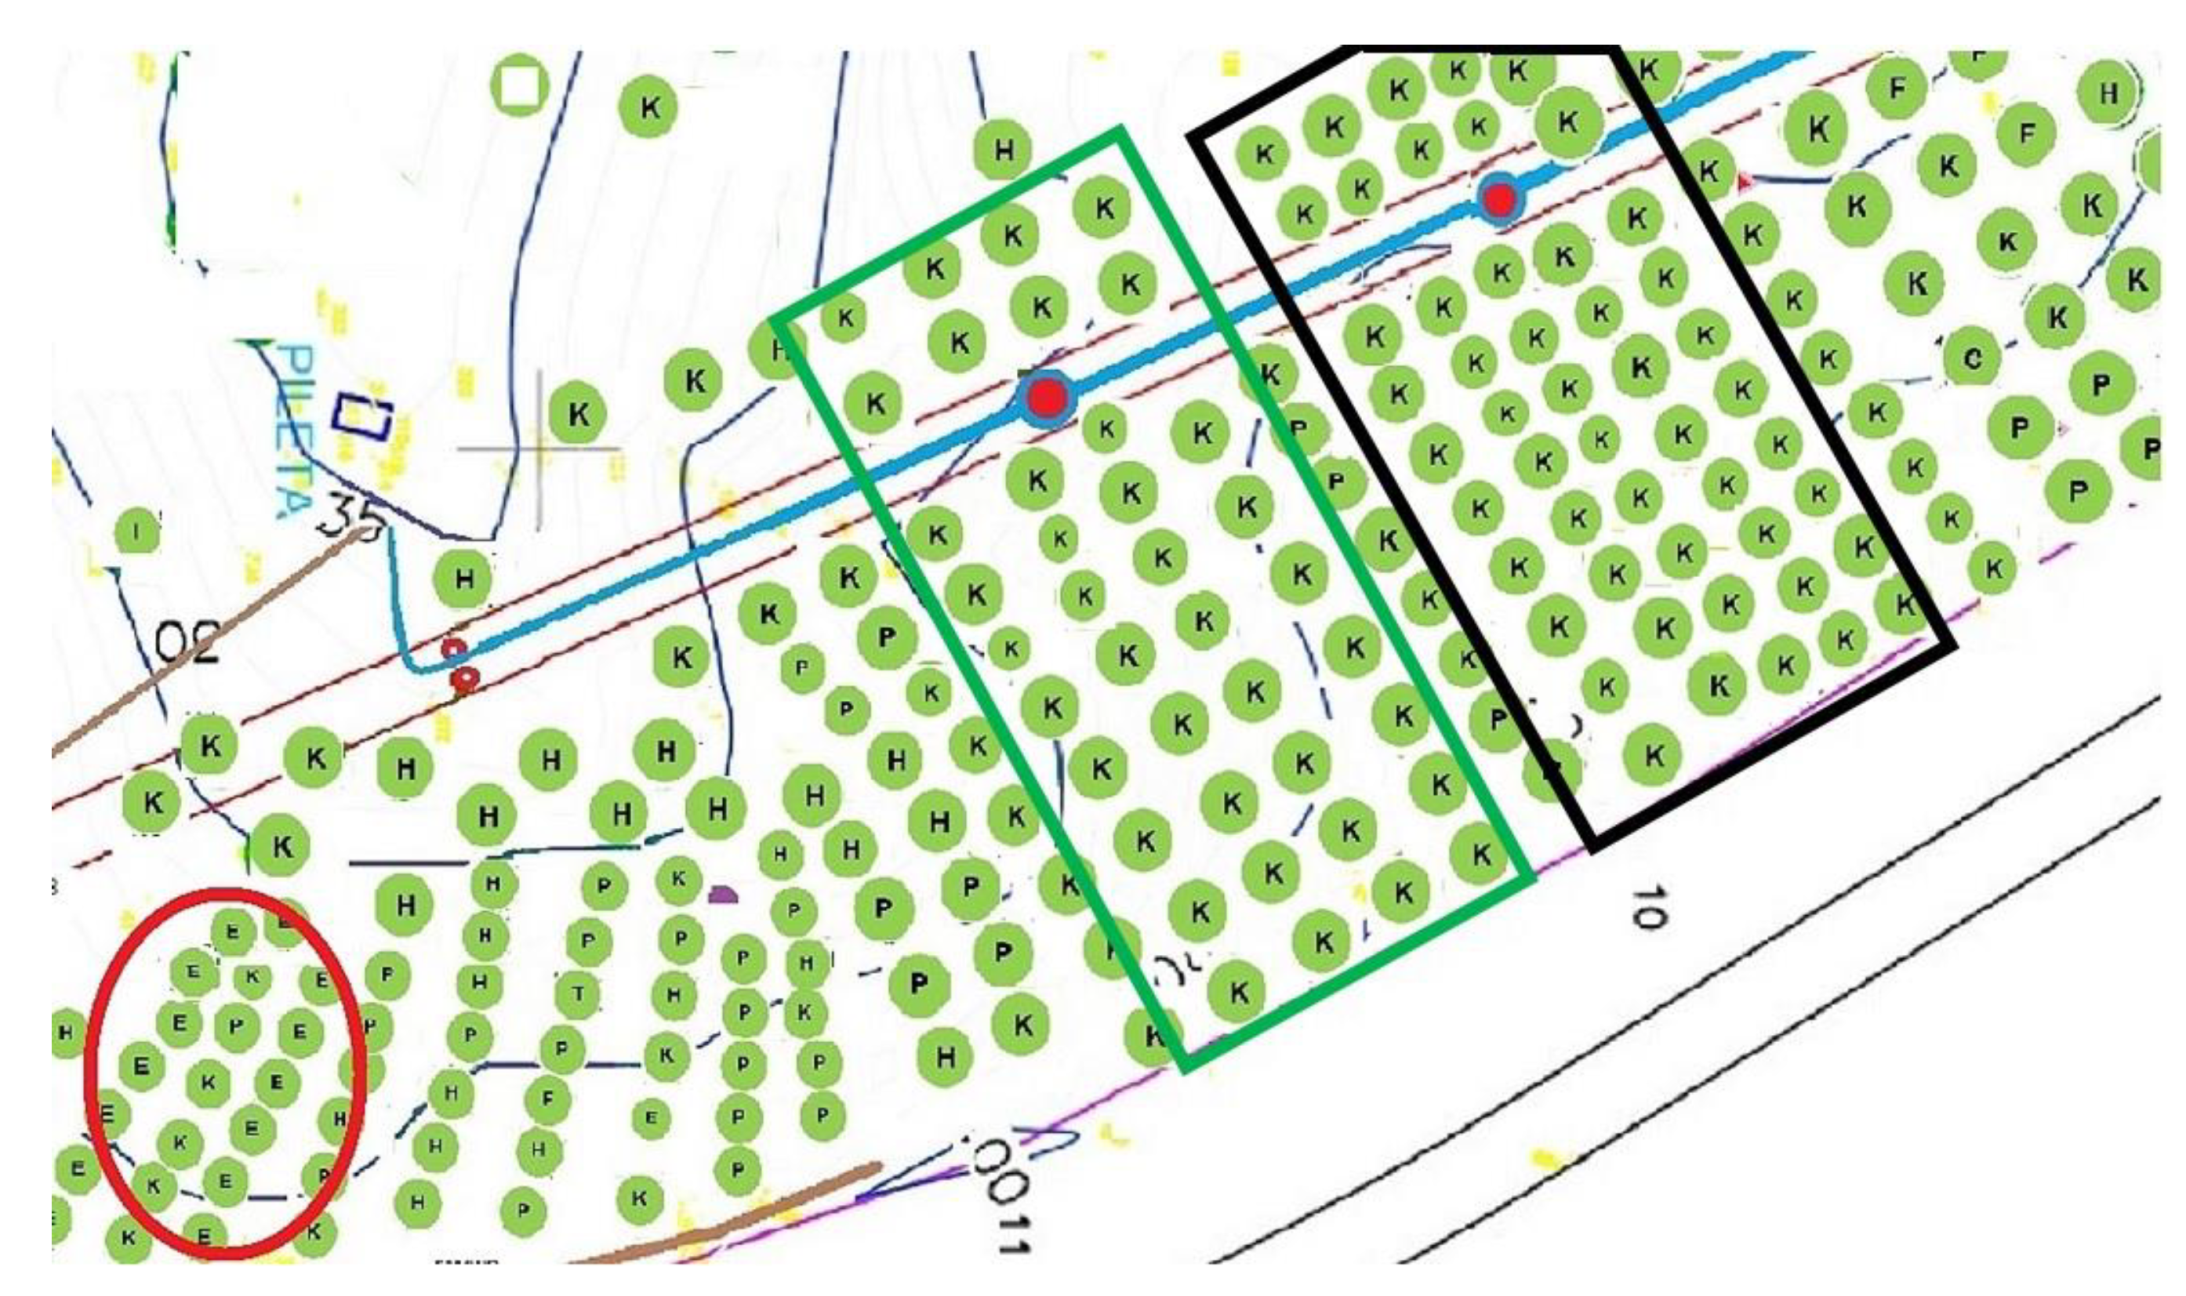
Figure 1. Orchard showing high-density trees (red circle), 25-year-old trees (green square) and 35-year-old trees (black square). Kent tree: K; recent planted: P; Haden tree: H; Keitt tree: E.
Agronomy 12 02623 g001
Figure 2. Climatic (a) station, and (b) precipitation during 2020 and 2021.
Agronomy 12 02623 g002
Figure 3. Irrigation system including (a) pump, (b) solenoid valve with connection to lateral hoses, and (c) micro sprinklers.
Agronomy 12 02623 g003
Figure 4. Water within the furrow of a mango HD tree during (a) dry season, (b) a rain event, and (c) fruit growth.
Agronomy 12 02623 g004
Figure 5. Water moisture (a) absorbed by the soil and, (b) around the mature tree.
Agronomy 12 02623 g005
Figure 6. Water moisture measurement (a) in the soil with two sensors, and (b) graphs with 100% DI and 75% RDI (blue lines denote irrigation timing).
Agronomy 12 02623 g006
Figure 7. Water moisture (a) measured in the soil where weeds grow, (b) causing weeds to grow over a micro-sprinkler, and (c) soil with fine weeds.
Agronomy 12 02623 g007
Figure 8. Microcontroller for monitoring soil moisture and rainfall.
Agronomy 12 02623 g008
Figure 9. Flow diagram of rainfall sampling and processing.
Agronomy 12 02623 g009
Figure 10. Fuzzy rainfall rules.
Agronomy 12 02623 g010
Figure 11. Mature tree viewed from the soil (a) before pruning in 2020, and (b) after harvest in 2021.
Agronomy 12 02623 g011
Figure 12. Sectional area of vegetation in a mature tree at different heights.
Agronomy 12 02623 g012
Figure 13. Counting of mango fruits in a mature tree using vision techniques on (a) the front and (b) the lateral side.
Agronomy 12 02623 g013
Figure 14. Correlation between mangos counted by the computer and those picked-up by the workers.
Agronomy 12 02623 g014
Figure 15. Radiation (a) measured the 22 May of 2021 and (b) its correlation against canopy volume of two pruned trees.
Agronomy 12 02623 g015
Figure 16. Counting mango fruits from the (a) front and (b) back of HD trees.
Agronomy 12 02623 g016
Figure 17. Mature tree (a) with low quantity of fruits at the top, and (b) fruits per section under different irrigation treatments.
Agronomy 12 02623 g017
Figure 18. Fruit yield (a) per tree, and (b) per cubic meter during both seasons and irrigation treatments. Green squares refer to 2021 pruned trees; red squares refer to 2020 trees.
Agronomy 12 02623 g018
Figure 19. Daily soil moisture monitoring during (a) 2021 and, (b) 2018 after irrigation application and rainfall.
Agronomy 12 02623 g019
Figure 20. Effect of weed height in soil volumetric water content and diameter moistened by the micro-sprinklers.
Agronomy 12 02623 g020
Table 1. Precipitation event with the number of rainy days and weed growth after 10 and 17 days within the micro-sprinkler area.
EventRainfallWeed at Day 10Weed at Day 17Action
MmDayscov, %Height, cmcov, %Height, cm
17511052510D
28022072512D
38032572512D
410011882815D
510022583215D
610033883518D
7120240106025S
815012586030S
9150241107030S
10150348108030S
Cov: cover area of weed, %; Height; weed height over sprinkler; D: day suspension; S: suspend season irrigation.
Table 2. Main studies carried out during both seasons, equipment used and some comments during its implementation.
ObjectiveStudy Carried outSensors & EquipmentComments
PruningEffect of fruit size and yield after pruningChainsaw, laser meter, mango counterObtain ground cover and radiation, calculate real canopy volume and calculate fruit size and yield.
IrrigationEffect of irrigation treatments on yield and fruit sizeLaser meter, mango counterAnalysis of irrigation treatments on yield, fruit size.
Fuzzy controllerFuzzy controller impact on fruit size and yieldController, laser meter, mango counterUse of fuzzy algorithm together with different irrigation treatments
WUEWater-use efficiency under each irrigation treatment and with fuzzy controller ControllerWater-use efficiency caused by pruning and controller
HD-MatureHigh-density and mature fruit yield Comparison of water use and yield between high-density and mature trees per hectare
Table 3. Average tree height, trunk and canopy diameter, number of leaves, canopy volume, and number of branches of high-density trees used for different irrigation treatments after the 2020 and 2021 harvest.
2020 2021
100%75%50%100%75%50%
Tree height, m2.462.432.432.732.762.76
Canopy diameter, m2.11.992.192.352.332.35
Number branches3.43.94.23.444.2
Canopy volume m33.463.13.694.85.714.83
Leaf number760767776862767766
trunk diameter, cm8.738.588.719.79.739.72
Table 4. Average tree height, trunk and canopy diameter, canopy volume, and number of branches of mature trees during 2020 and 2021 under different irrigation treatments.
20202021
100%75%50%100%75%50%
Tree height, m8.18.118.16.86.856.75
Canopy area, m278.57878.563.5863.663.58
Number branches7.67.77.87.67.77.8
Canopy volume m3313.69312.11313.69209.43211.22207.72
trunk diameter, cm32.3432.432.2232.6632.5832.51
Table 5. Average height, external and internal canopy areas, external and real canopy volume, ground cover factor and radiation of mature trees during May 2020, September 2020 and May 2021.
EventTree Parameters
H, mCEA, m2IAWL, m2CV, m3RCV, m3GCF%Rad@1,%
2020M8.178.50313.68313.62931.4
2020S663.5820.1181.9161.84165.2
2021M6.869.3622.3228.471553961.7
H: height, m; CEA: Canopy external area, m2; IDWL: Internal area without leaves, m2; CV: Canopy volume, m3; RCV: Real canopy volume, m3; GCF: Ground cover fraction, %; Rad@1: Radiation at 1 m, %; 2020M: 2020 May; 2020S: 2020 September; 2021M: 2021 May.
Table 6. Average fruit yield, fruit per tree, fruit weight, water applied, canopy volume and WUE for each irrigation treatment during 2020 and 2021 for HD trees.
Irrigation TreatmentIrrig, m3/TreeCanopy Volume, m3Fruit Yield, kg/TreeFruit/
Tree
Fruit Weight, gFruit Yield kg/m3WUE Kg/m−3
Irrigation2020
DI(100% ET)63.46a37.6a52.9a710.9a10.9a6.3c
RDI1 (75%ET)4.53.1a33.66b46.4b725.3a10.9a7.5b
RDI2 (50%ET)33.69a28.16c37.9c742.5a7.6b9.4a
Irrigation2021prunedtrees
DI(100% ET)63.52a39.62a55.8a710.2c11.3a6.6c
RDI1 (75%ET)4.53.56a36.47b50b729.4b10.26b8.1b
RDI2 (50%ET)33.44a34.96c46.4c753.6a11.17b11.7c
ANOVA
Interaction 2020 *****
Interaction 2021******
Interaction *****
* Significant at p < 0.05; Different letters in the same column are statistically different by Tukey’s test (p < 0.05).
Table 7. Mature tree average fruit yield, fruit per tree, fruit weight, water applied, canopy volume and WUE for each irrigation treatment.
Irrigation TreatmentIrrig, m3/TreeCanopy Volume, m3Fruit Yield, kg/TreeFruit/
tree
Fruit Weight, gFruit Yield kg/m3WUE Kg/m−3
Irrigation2020
DI(100% ET)19.92314.7c226.46a488a464a0.72a11.4c
RDI1 (75%ET)14.98319.5b203.24b467.8b434.2b0.64b13.6b
RDI2 (50%ET)9.98329a184.85c442c418.2b0.56c18.5a
Irrigation2021prunedtrees
DI(100% ET)19.92246a361.53a579a624.4a1.47a18.15c
RDI1 (75%ET)14.98250.8a352.74b560.8b629a1.41ab23.55b
RDI2 (50%ET)9.99248.6a335.81c528c636a1.36b33.62a
ANOVA
Interaction 2020 *****
Interaction 2021******
Interaction ** ***
* Significant at p < 0.05; Different letters in the same column are statistically different by Tukey’s test (p < 0.05).
Table 8. Mature tree average fruit yield, water applied, canopy volume and WUE for each irrigation treatment during 2021 and 2022.
Irrigation TreatmentIrrig, m3/TreeCanopy Volume, m3Fruit Yield, kg/TreeWUE Kg/m−3
Irrigation2021
DI(100% ET)19.92246a361.53a18.15c
RDI1 (75%ET)14.98250.8a352.74b23.55b
RDI2 (50%ET)9.99248.6a335.81c33.62a
Irrigation2022
DI(100% ET)19.92263.2a372.79a18.71c
RDI1 (75%ET)14.98264.7a360.23b24.05b
RDI2 (50%ET)9.99253.3a350.28c35.06a
Different letters in the same column are statistically different by Tukey’s test (p < 0.05).
Table 9. Average fruit yield, fruit per tree, fruit weight, water applied, canopy volume and WUE for each irrigation treatment in 2020 and with the fuzzy controller during 2021 in high-density trees.
Irrigation TreatmentIrrig, m3/TreeCanopy Volume, m3Fruit Yield, kg/TreeFruit/
Tree
Fruit Weight, gFruit Yield kg/m3WUE Kg/m−3
Irrigation2020
DI(100% ET)63.46a37.6a52.9a710.9a10.9a6.3c
RDI1 (75%ET)4.53.1a33.66b46.4b725.3a10.9a7.5b
RDI2 (50%ET)33.69a28.16c37.9c742.5a7.6b9.4a
Irrigation2021prunedtrees+ fuzzycontrol
DI(100% ET)1.53.1b44.83a57.8a775.6b14.46a29.89c
RDI1 (75%ET)1.133.23a39.01b50.4b774b12.08b34.52b
RDI2 (50%ET)0.753.22a33.14c42c789a10.29c44.18a
ANOVA
Interaction 2020 *****
Interaction 2021******
Interaction *****
* Significant at p < 0.05; Different letters in the same column are statistically different by Tukey’s test (p < 0.05).
Table 10. Average fruit yield, fruit per tree, fruit weight, water applied, canopy volume and WUE for each irrigation treatment during 2020 and 2021 in mature trees using the fuzzy controller.
Irrigation TreatmentIrrig, m3/TreeCanopy Volume, m3Fruit Yield, kg/TreeFruit/
Tree
Fruit Weight, gFruit Yield kg/m3WUE
Kg/m−3
Irrigation2020
DI(100% ET)19.92314.7c226.46a488a464a0.72a11.4c
RDI1 (75%ET)14.98319.5b203.24b467.8b434.2b0.64b13.6b
RDI2 (50%ET)9.98329a184.85c442c418.2b0.56c18.5a
Irrigation2021prunedtrees+ fuzzycontrol
DI(100% ET)7.56257.8b361.64a579a624.4a1.4a47.84c
RDI1 (75%ET)5.7269.8a363.91a575a629a1.35ab63.84b
RDI2 (50%ET)3.8254.2b332.85b525b636a1.31b87.59a
ANOVA
Interaction 2020 *****
Interaction 2021*** **
Interaction *****
* Significant at p < 0.05; Different letters in the same column are statistically different by Tukey’s test (p < 0.05).
Table 11. Water supplied per hectare, number of trees, yield and WUE for mature and HD trees.
Irrigation TreatmentWater Supplied
m3 ha−1
Trees ha−1Yield
kg ha−1
WUE
kg m−3
100% HD150025099056.6
75% HD112525091178.1
50% HD750250874011.65
100% MATURE199210036,15318.2
75% MATURE149810035,27423.6
50% MATURE99610033,58133.6
Publisher’s Note: MDPI stays neutral with regard to jurisdictional claims in published maps and institutional affiliations.