Article

Direct Digital Manufacturing of a Customized Face Mask

by
Leonardos Bilalis
,
Vassilios Canellidis
,
Theodore Papatheodorou
and
John Giannatsis
*
Department of Industrial Management and Technology, University of Piraeus, 80 Karaoli Dimitriou Str., 18534 Piraeus, Greece
*
Author to whom correspondence should be addressed.
J. Manuf. Mater. Process. 2022, 6(5), 126; https://doi.org/10.3390/jmmp6050126
Submission received: 22 August 2022 / Revised: 17 October 2022 / Accepted: 20 October 2022 / Published: 21 October 2022
(This article belongs to the Special Issue Direct Digital Manufacturing with Additive Manufacturing/3D Printing)

Abstract

:
Direct Digital Manufacturing (DDM) is considered by many as one of the most promising approaches towards cost- and time-efficient mass customization. Compared to conventional manufacturing systems, DDM systems are not as common and incorporate several distinctive features, such as higher flexibility in product form and structure, lower economies of scale and higher potential for decentralized production network. The initial design phase of a DDM production system, where very important in term of efficiency and quality, decisions are made, is a relatively unexplored topic in the relevant literature. In the present study, the corresponding issues are investigated through a case study involving the direct digital production of a customized reusable face mask (respirator) for medical use. Investigated system design aspects include product, process, and facility design. Based on data generated through manufacturing tests, a preliminary cost analysis is performed and several scenarios regarding production throughput and facility planning are examined. According to the results, DDM of custom-made face masks is, to a large extent, technically and economically feasible. Interestingly, considering the whole process, a large part of production cost is associated with labor and materials. Finally, evidence for a fundamental trade-off between manufacturing cost and speed/flexibility is identified, implying that different implementations of DDM systems can be realized depending on strategic operational objectives.

1. Introduction

In the context of product design and development, Additive Manufacturing (AM) and 3D Printing (3DP) are of indisputable value, enabling the fabrication of product models and prototypes relatively fast and cheaply. Parallel to the application of these technologies in prototyping and, relatively early on in terms of technological development, the possibility of using them for the fabrication of end-use parts or products (rapid manufacturing) or production tools (rapid tooling), has been the subject of discussion and research, both in the academy and the manufacturing sector [1]. During recent years, the interest and debate around direct production with AM has been renewed, due to the overall advancement of the corresponding technologies in terms of quality and cost [2]. The corresponding field is now commonly referred to as the more encompassing term “Direct Digital Manufacturing” (DDM). In the context of DDM, the use of an AM technology as the core manufacturing method is supported by advanced product design tools and methodologies, such as generative design and topology optimization, as well as novel methodologies for controlling and managing the production process, such as distributed and decentralized manufacturing [3,4,5].
Furthermore, in the context of the evolving highly automated and digitized manufacturing paradigm of Industry 4.0, AM has been identified as one of the basic technologies that can be employed for the economic and fast production of products in small batches [5,6,7,8,9,10]. DDM has been also identified as one of the most promising routes towards localized production and mass production of customized/personalized products (mass customization) in a cost-efficient and sustainable manner [4,11,12,13,14,15,16]. The approach has proved successful in several cases, especially in the healthcare and medical sector (e.g., the production of personalized hearing aids, dental aligners and implants), and the aerospace industry [17,18,19], which shows that there is clearly significant potential in this direction. To achieve, however, the broader goal of developing a new manufacturing paradigm that addresses some of the limitations of traditional mass manufacturing, such as the inability to produce small batches of parts/components economically and rapidly or of highly customized products in a sustainable manner, significant work needs to be undertaken [16]. This work should not be limited to the, obviously necessary, advancement of the corresponding technologies [20,21], but should be expanded to the study and analysis of their strengths and weaknesses, in terms of economic efficiency, sustainability and overall capabilities. Investigation of these issues in various case studies will help to identify areas where DDM can be applied successfully. Identification of promising application areas will, in turn, provide insights and justification for further technical development [11,22].
Successful adoption of DDM requires a holistic approach where various aspects of the overall manufacturing system are considered [23]. The most basic issues, in this respect, are product design (the basic product features and functions), process design (how is the product produced), capacity design (how many products per year should be produced and with what resources) and facility design (the number, size and location of manufacturing facilities). These issues are, to a large extent, interrelated, and the corresponding choices/decisions made for each problem affect the choices/alternatives of other aspects. This is true for any manufacturing system, but it is more evident in the case of DDM where no standard manufacturing practices are established, and relatively little collective knowledge has been acquired.
In the present paper an effort is made to address the problem of DDM system design in a holistic manner. Starting with the assumption that AM is employed as the basic manufacturing method, we examine the issues of product design, process design, capacity planning and facility location for a specific product case in detail. The selected product is a personalized reusable face mask/respirator intended for use by personnel and patients in healthcare facilities. The personalized face mask represents an interesting case because it combines relatively high complexity of shape and form with a moderate degree of customization, a combination of factors that has been identified as conducive to DDM in previous studies [18,24]. Taking, also, into account the importance of face masks in terms of safety and the need for resilience against supply chain disruptions, such as those observed during the Covid-19 pandemic, DDM may provide the additional benefit of short production lead-time and on-the-spot production. The possibility of exploiting advantages of AM technology such as the incorporation of sensors and assembly simplification further strengthens the interest in the specific case.
The rest of the paper is organized as follows: in Section 2, a brief presentation of relevant previous studies investigating issues associated with the development and evaluation of DDM production systems as well as the application of AM in similar settings are presented; in Section 3, the proposed mask design and the corresponding production process are presented; in Section 4, issues concerning production cost, capacity and facility location are investigated; basic findings and insights are briefly discussed in Section 5, and finally in Section 6, the main conclusions of the study and topics for further research are summarized.

2. Previous Work

The concept of DDM, its efficacy and relevant methodological frameworks for its application have been the subject of various studies. One research direction focuses on the possibility of incorporating AM for the direct production of spare parts [20,21,22,25,26,27,28,29,30,31]. Processing costs, associated mainly with material and equipment costs are identified as the main barriers for the wide adoption of DDM in such applications [20,21,22], a fact that is expected to change as the corresponding AM technologies mature [21]. This does not mean, however, that there are currently no significant savings that can be achieved through DDM, especially when applied in a decentralized/distributed fashion [26,27,31]. According to several studies the decentralized potential of DDM, in conjunction with efficient material and energy use, may lead also to significant environmental benefits [28,29]. In any case special attention should be given to legal and business aspects to ensure efficient and problem-free parts production [30].
The extent to which DDM benefits, such as higher production flexibility, are exploited depends on how it is implemented and incorporated into actual manufacturing practice [32,33]. Implementation methodologies and guidelines are discussed in studies by Achillas et al. [34], Mellor et al. [11] and Stavropoulos et al. [35], who propose a hybrid approach that combines AM and machining technologies to alleviate cost and volume constraints. A similar approach, combining AM with injection molding is proposed by Gaub [12]. Further cost and other gains can also be achieved when the product is designed to fit DDM capabilities and constraints, as shown by several studies on the topic of Design for AM [36,37,38,39,40,41,42]. Key capabilities of the technology in this respect are considered the achievable high level of geometrical complexity, the ability to economically produce unique products or small batches, the ability to consolidate components into monolithic parts/structures, the ability to concurrently process multiple materials and the ability to embed electronic components during fabrication.
The problem of supply chain design and facility location for DDM production facilities is, also, increasingly attracting attention [43,44,45,46,47,48,49,50,51]. According to Verboeket et al. [45], the decentralized network approach of DDM favors speed and lower lead times, especially when demand is geographically dispersed because the facilities can be placed closer to demand centers. In this context, most studies focus on biomedical parts and implants and stress the importance of being able to accurately predict local demand and evaluate production costs in order to define the optimum degree of centralization for specific cases [45,46,47,48,49].
The COVID-19 pandemic provided a real-world ‘testbed’ for evaluating some of the issues presented above. Following the outbreak of the COVID-19 pandemic, AM was employed as a tool to combat shortages in personal protective equipment (PPE), medical supplies and critical components for medical devices due to supply chain issues [52,53,54,55,56,57,58,59]. The gained experience showed that AM can increase the resilience of supply networks and provide alternative avenues to produce critical parts in times of crisis, through careful consideration of its limitations and better design of the corresponding production processes, systems and supply networks [24,60,61,62]. Extensive collaboration between developers/makers and the regulatory authorities, and special attention to the design of parts and manufacturing systems are required to avoid the production and distribution of inefficient and potentially dangerous medical supplies [63,64,65].
Face shields and masks were among the most common PPE being produced with AM during the COVID pandemic [66]. In the case of face shields, AM is usually employed for the fabrication of the shield’s frame, on which the transparent protective sheet and the elastic band are attached [66,67,68,69,70,71]. In terms of production cost and time, AM face shields are easier to produce, but as several studies have pointed out shields cannot be considered as a substitute for face masks in terms of protection against infection [72,73]. To improve the level of protection through the better coverage of mouth and nose, several designs of individualized AM face masks equipped with filtering mechanisms have been proposed [74,75,76,77,78,79,80]. The corresponding masks provide, theoretically, better levels of protection but their efficacy is contested and with a few exceptions [81,82,83] relevant studies are generally lacking.

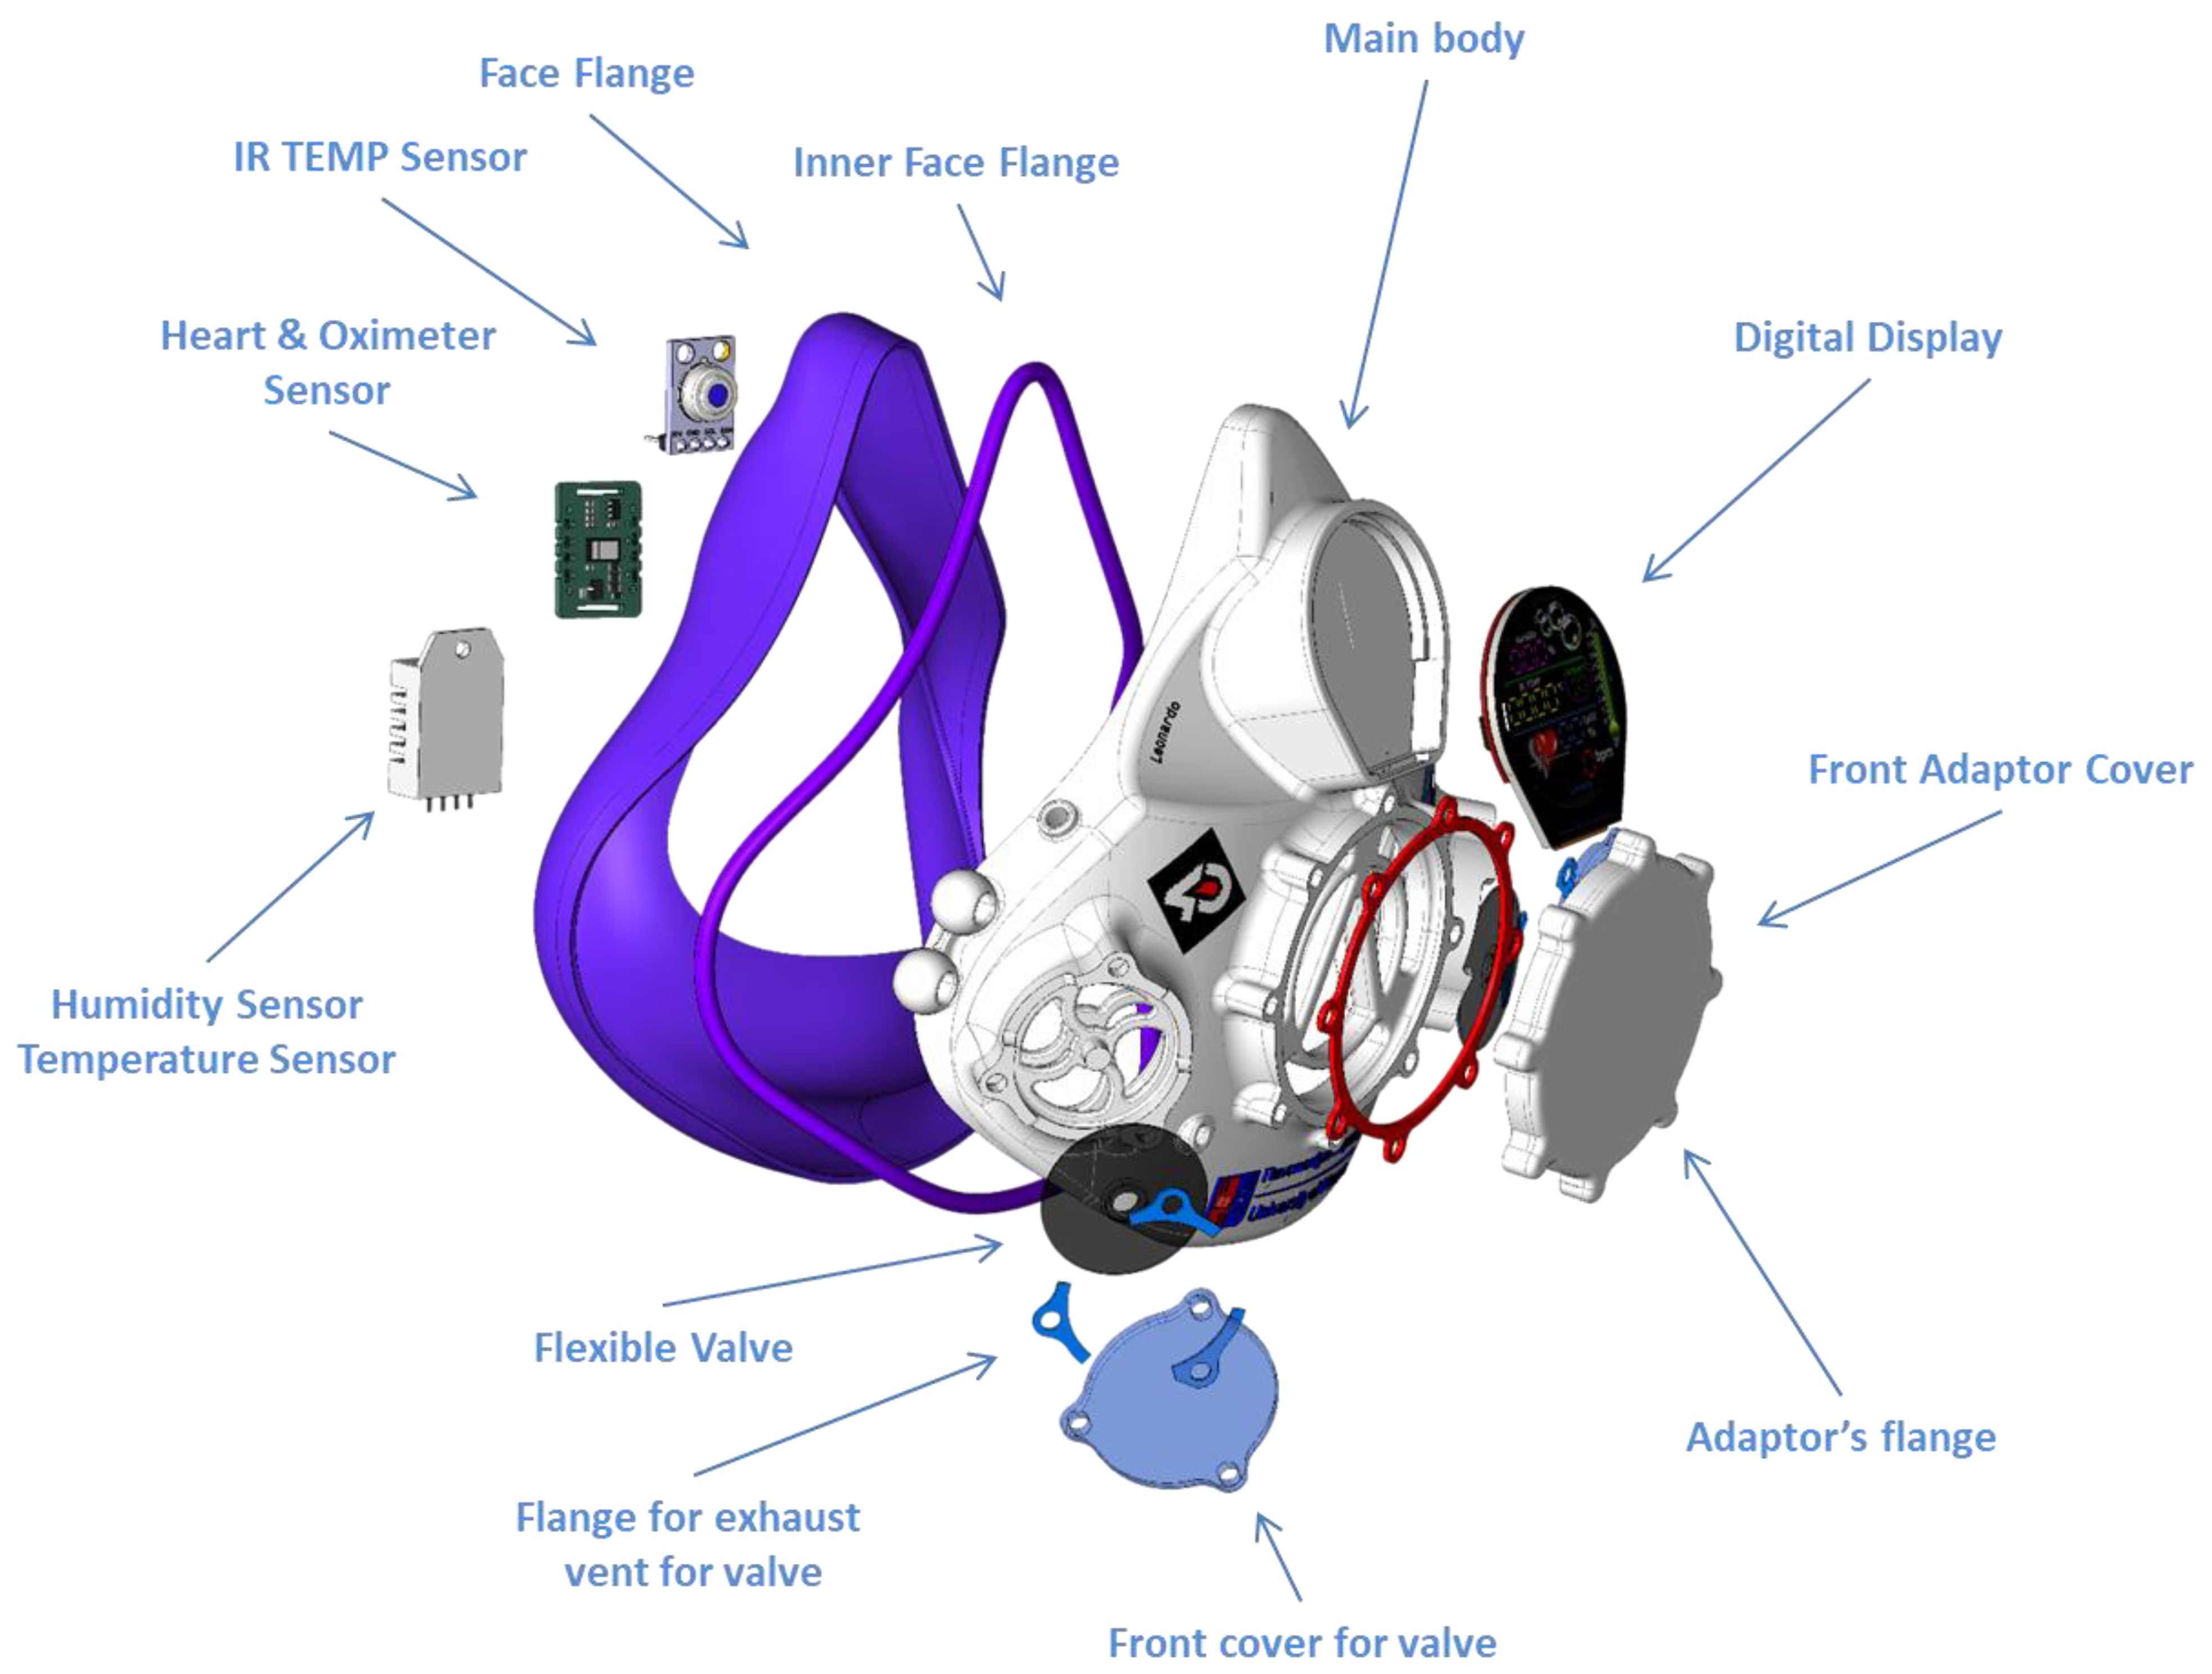
3. Mask Design Features and Fabrication Process

Based on the results of relevant studies mentioned in the previous section and guidelines provided by the World Health Organization [84] and the US Food and Drug Administration [85], the following basic features of the individualized reusable mask were defined:
  • The face mask must cover the area of the nose and the mouth,
  • The best possible fitting between the mask and the facial geometry should be achieved,
  • The mask must be easy to use and comfortable in breathing,
  • Non-allergenic materials must be used, and
  • The mask must have the highest possible filtering capacity to achieve the required protection level.
Furthermore, the mask should be designed in a way that permits customization/individualization. The mask will also be used daily and for long periods of time; hence it should, obviously, be comfortable to use, easy to apply and as lightweight as possible. Since the mask is also intended to be reusable, it should exhibit long total lifetime use and be easy to sterilize and maintain. The mask should ideally incorporate components for monitoring important physical and physiological parameters, such as humidity, air flow, body temperature, cardiac pulses and blood oxygen level sensors, as well as displaying/transmitting the corresponding information. Maintenance is, therefore, associated with the replacement of consumable components such as filters, valves and adaptors as well as the repair and/or replacement of electronic components.
Design requirements and assumptions were further refined through discussions and feedback with personnel of the Italian Insituto Superiore di Sanita, and researchers from the Physiology laboratory (Medical 3D Printing & Guided Surgery division) at the Medical School of the University of Athens. Based on the above the first/initial design of the mask/half-face respirator, presented in Figure 1, has been developed. Mask components can be grouped into three basic categories: (i) the main body of the frame of the mask that provides the basis for the attachment of several types of components performing various functions, (ii) the face flange that assures proper fit between the user’s face and the mask and (iii) the safety and monitoring components that ensure appropriate filtering, comfortable breathing, and accurate monitoring of important physical and physiological parameters. To secure the mask on the user’s face, elastic strips attached the sides of the main body are used (not shown in Figure 1).
The air inlet is at the front center of the mask where the main air filter is also positioned. To facilitate the incorporation of various types of air filters, an adaptor system has been designed. Two exhaust vents comprising exhalation valves have been incorporated to facilitate breathing and improve comfort. To avoid virus transmission, the exhalation venues can also be equipped with filters. Electronic components incorporated at this stage of design include heart rate, oximetry, temperature and humidity sensors, as well as a digital display device for displaying the corresponding measurements.
Product design features and characteristics are closely associated with the product manufacturing process. Taking especially, into account the high level of customization required to achieve the best possible fit between the mask and the user’s face, in conjunction with the requirement for the incorporation of various electronic components, AM can be considered an attractive manufacturing method. In particular, AM provides a cost-efficient and fast way to fabricate highly individualized masks based on facial scan data and user needs.
Among the various AM technologies available, photopolymer-processing methods, such as vat polymerization and Material Jetting, seem particularly attractive for the specific application because they combine relatively high levels of fabrication accuracy and speed. In the present study the process of Material Jetting (MJ) is investigated. MJ systems employ drop-on-demand mechanisms for depositing photopolymer material, only where it is needed via a moving printing head, equipped with numerous small holes/nozzles. Concurrently with deposition, material curing is achieved via exposure to ultraviolet (UV) light delivered by a light source, also attached on the print head. The deposition of the basic part material is followed by the deposition of a secondary material required for the construction of the support structure, necessary for supporting overhangs, enhancing the stability of the built and reducing part distortions. Common to most other AM approaches, MJ parts are constructed/built layer-by-layer on the machine tray (platform) in bottom-up direction.
A significant advantage of MJ technology is its relatively high layer resolution, associated with a relatively low layer height/thickness (around 0.015 mm), which allows the fabrication of parts with fine features, intricate details, and smooth surfaces. Another advantage of MJ technology is the availability of various materials with variable mechanical and optical properties, such as stiffness, toughness, color and translucency, and the possibility of concurrently using several of them to obtain multi-material parts in one build. This allows the fabrication of all structural mask components (all components bar the filters and the electrical devices) in one machine and one job, reducing thereby setup and assembly times.
The generic process for an industrial production system based on Additive Manufacturing, as identified by Eyers and Potter [23], comprises of 4 basic phases: (i) the design phase/system covering all activities associated with the creation of the individualized digital CAD model of the product, (ii) the pre-processing phase/component associated with preparatory planning, checking and scheduling activities required for actual AM fabrication, (iii) the manufacturing phase/component, where physical production/fabrication of the product is carried out and (iv) the post-processing phase/component which encompasses part finishing, assembly and quality control activities. These process phases can be associated with the four respective system components, where the corresponding operations are performed. Based on this analytical framework the mask production process has been defined and elaborated. The basic activities for each phase and system component are presented in Figure 2.
As noted earlier, each mask is individually designed/customized to fit the facial characteristics of individual users. The corresponding activities are carried out during the initial customization phase and include the following: (i) performing face scanning to obtain a virtual model of the user’s face, (ii) design/customization of interfacial components to fit the user’s facial model, (iii) virtual assembly and customization of the whole mask to ensure proper fit between components and satisfy possible additional requirements and (iv) export and check of the corresponding STL files.
The STL files are then transferred to the pre-processing component of the system. The corresponding build job is then added to the master production plan, based on priority, importance or other scheduling criteria. Build parameters, such as build orientation and layer thickness, for the specific job are then defined. Parallel to the above, the build layout of parts on the platform is defined and support structures are designed. Since the mask morphology is only partially modified and to a large extent predefined/stable, optimum build parameters and layouts can be defined in advance, to speed up the process, but these configurations may be changed if necessary (e.g., if there is a need to produce a higher number of masks in one job). Slicing is then performed, and the corresponding build files are sent to the machine for fabrication.
In terms of activities the manufacturing phase may be considered the most automated since it involves only simple machine setup and inspection operations (material loading, visual machine check etc.), while actual fabrication of the mask by the AM system is fully automated. The final post-processing phase, on the other hand, concerns several operations that are performed by specialized technicians. The corresponding activities are removing the mask from the machine, support removal and cleaning, finishing operations, components assembly, quality control and functional testing.
As noted earlier, choices regarding product and process design are interrelated. Initial choices consider these interrelationships but in order to fully assess the efficiency of the whole production system by evaluating as the production cost, time and quality, fabrication tests are required. The corresponding data can be used to inform subsequent design revisions where features of the whole system and its components are further refined and optimized to satisfy the corresponding strategic objectives. Test results are also used for studying further aspects of the production system, such as production capacity and facility location. Details regarding the tests performed for each production phases as well as the corresponding results are presented in the following sections.

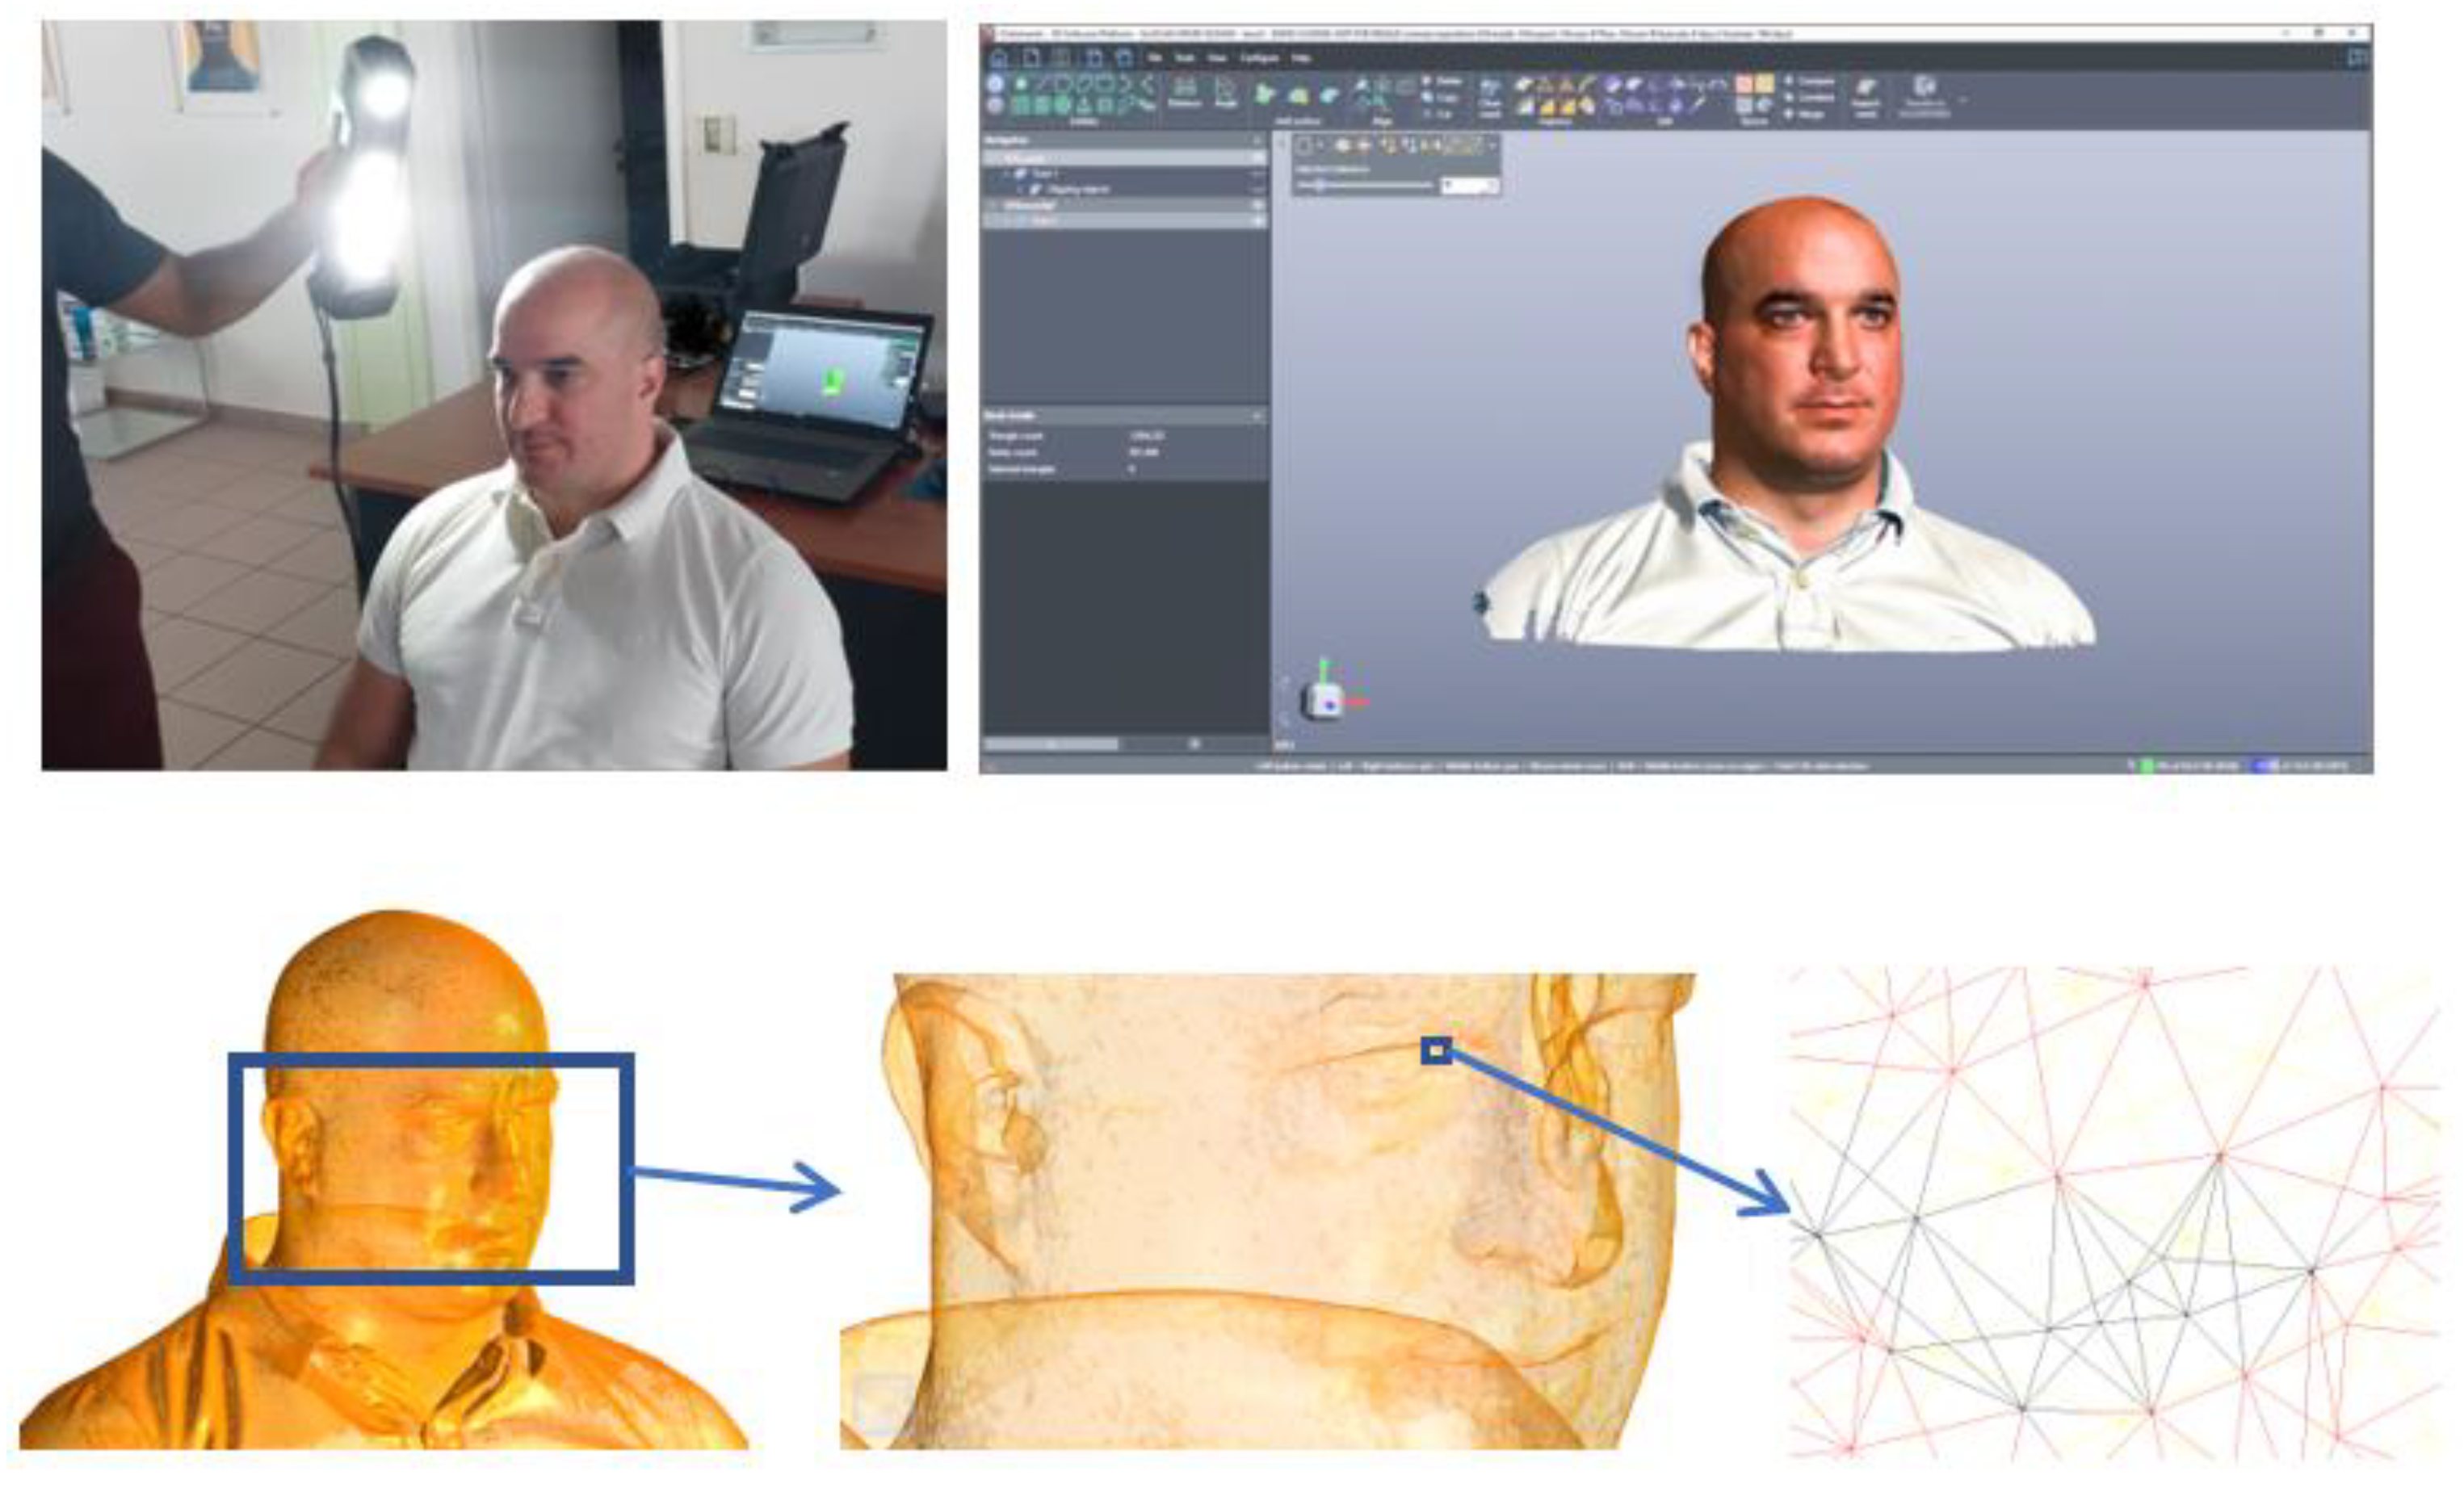
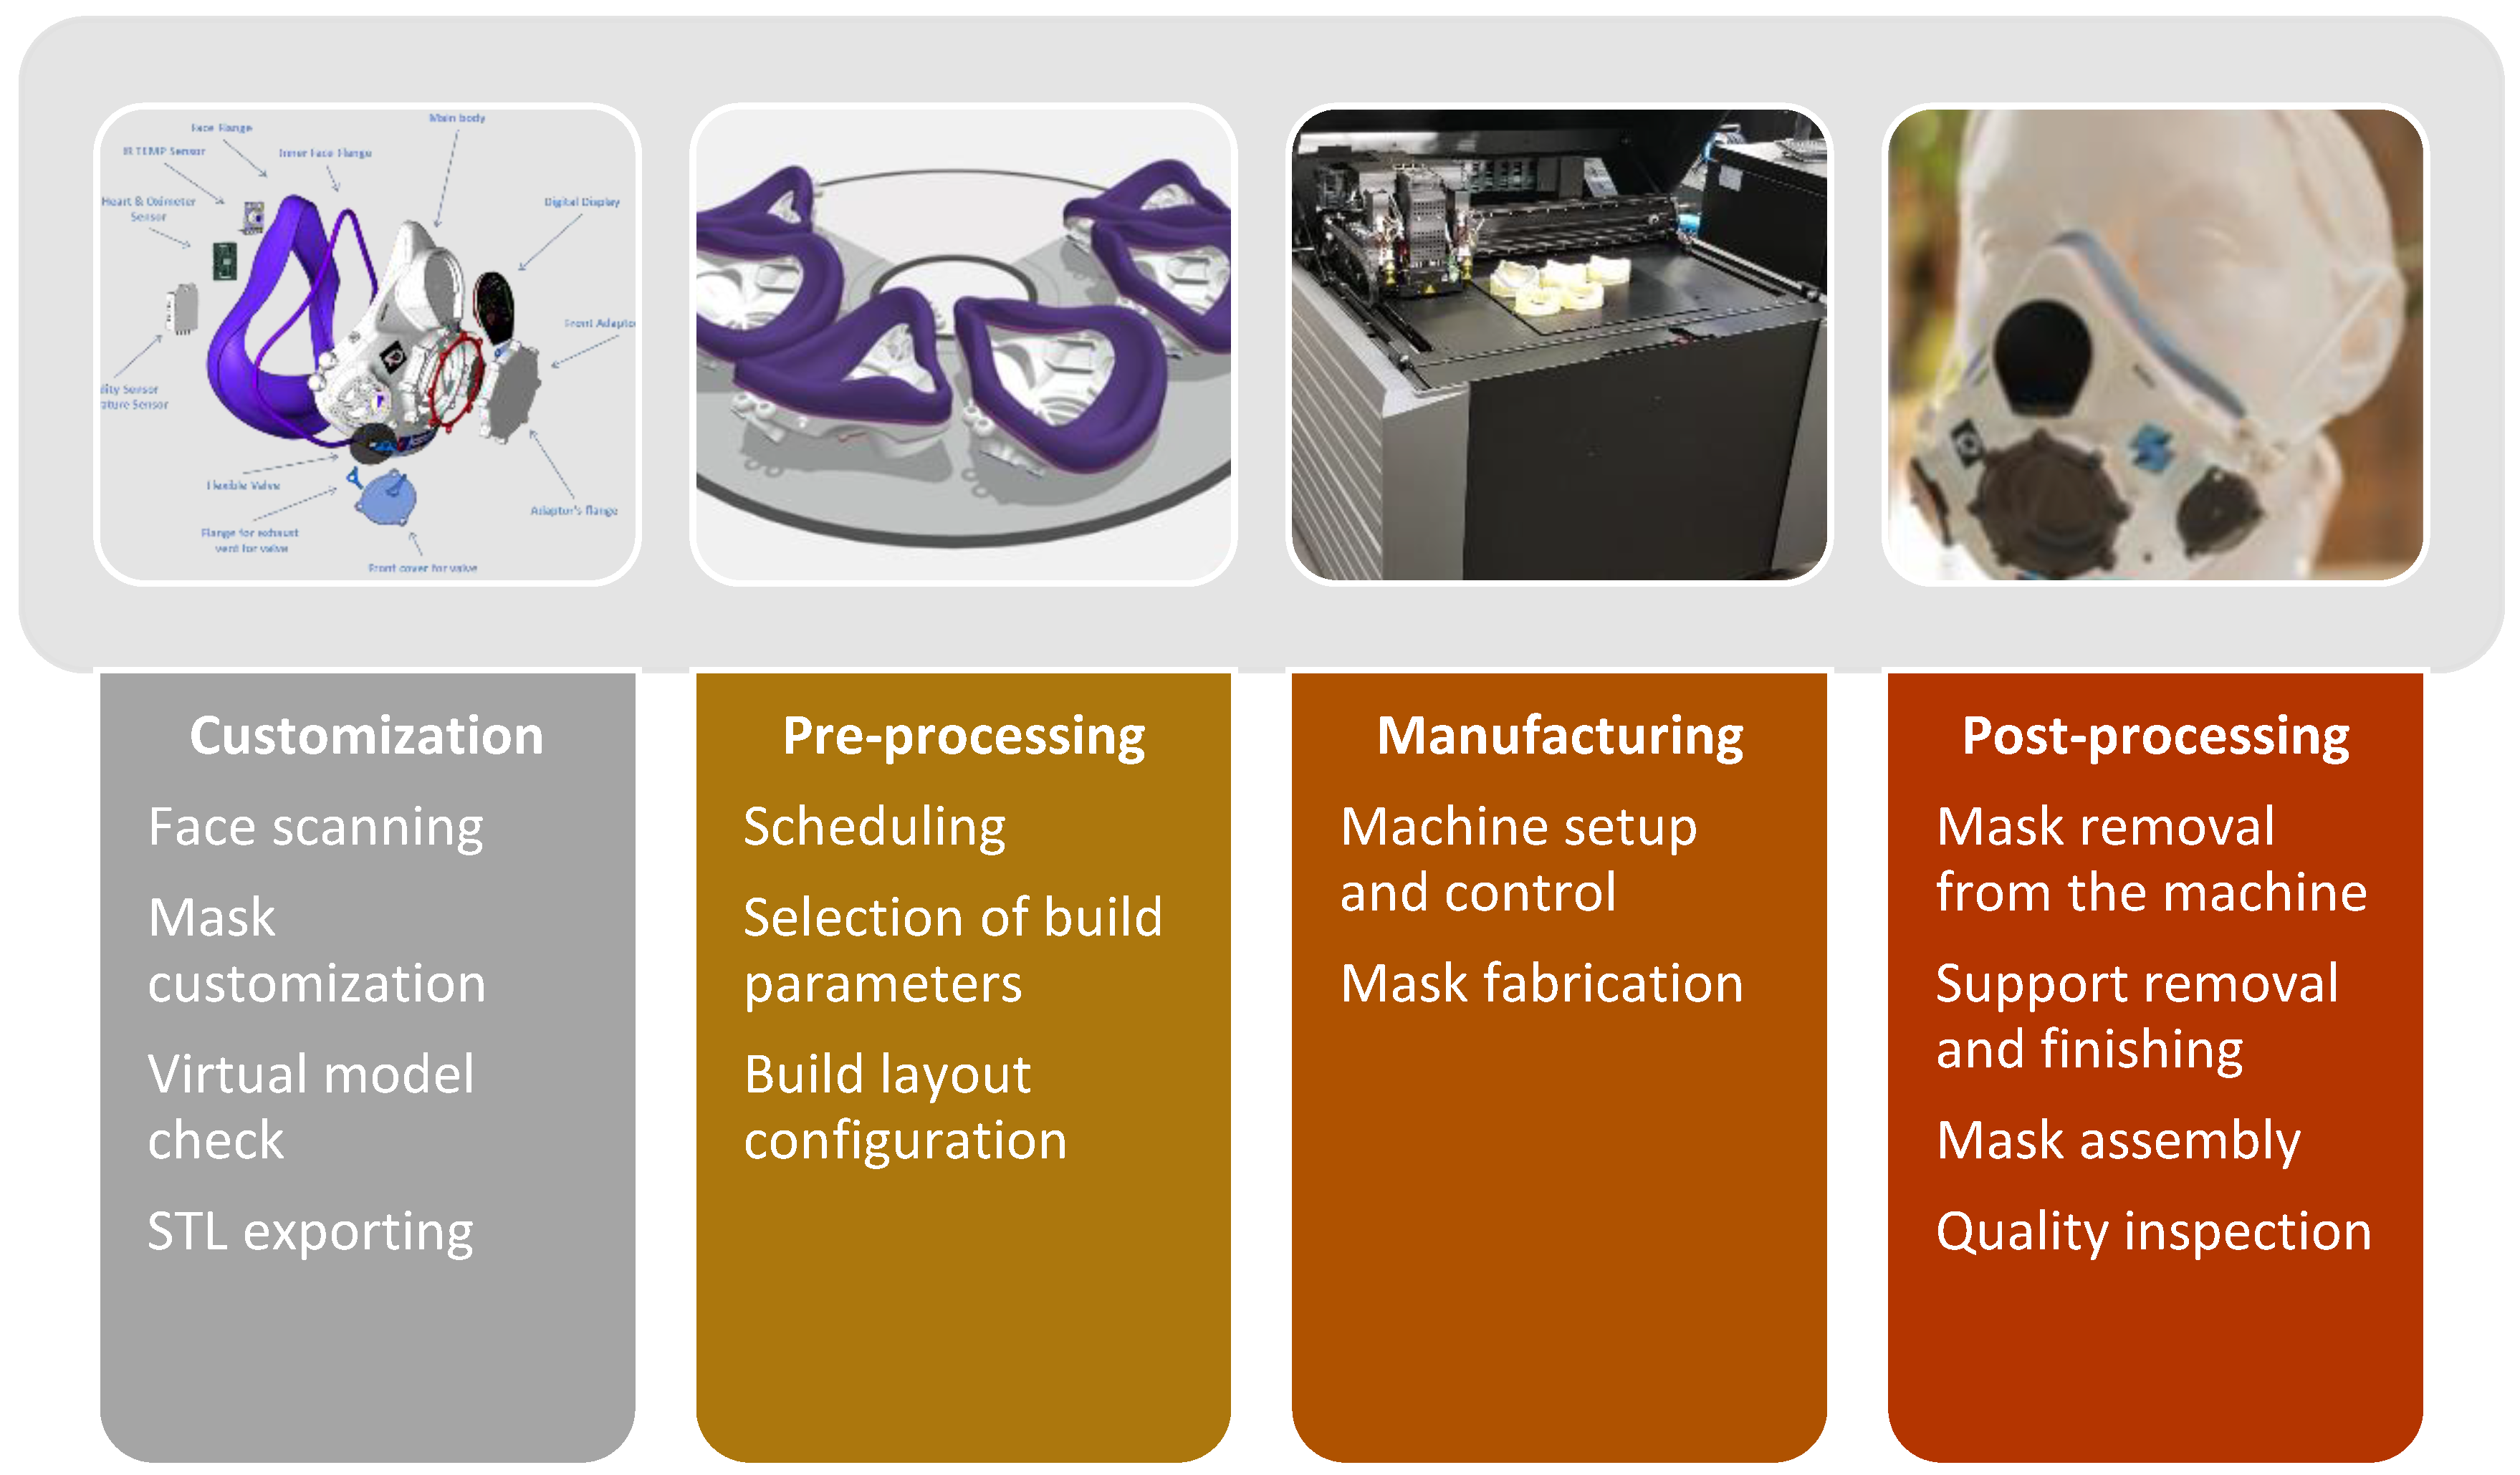
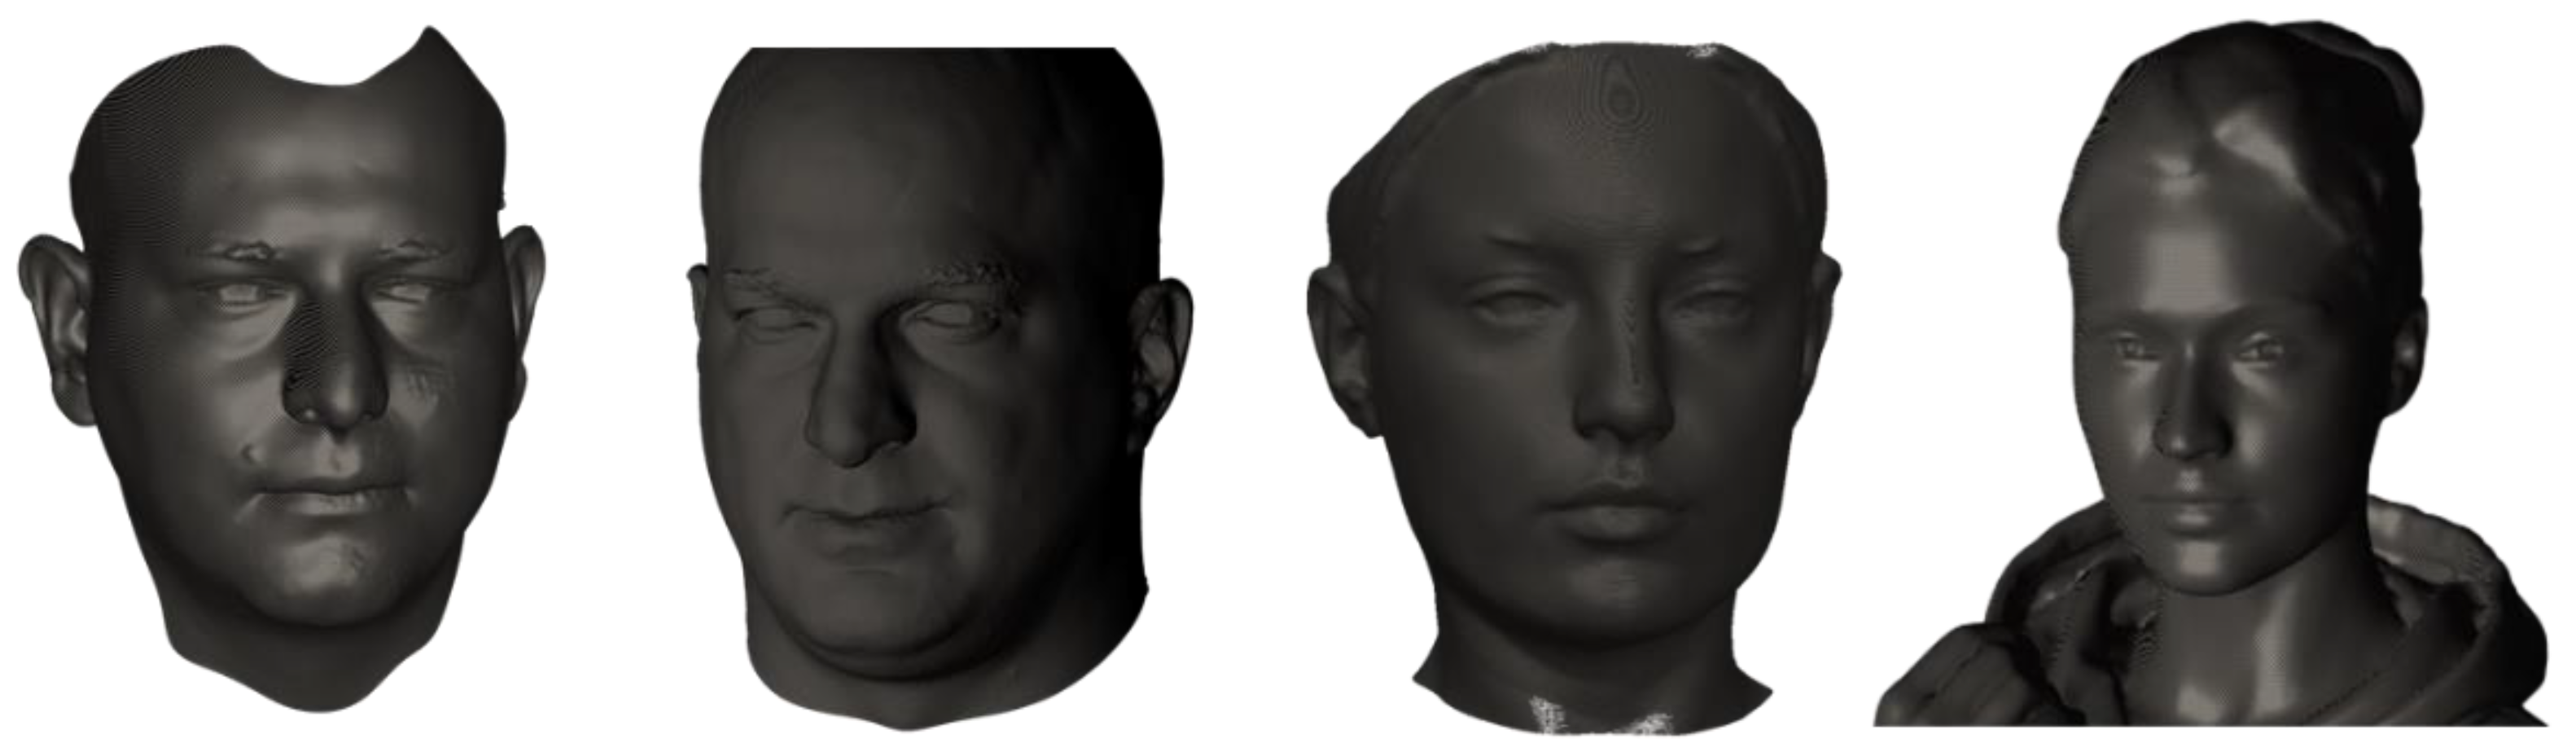
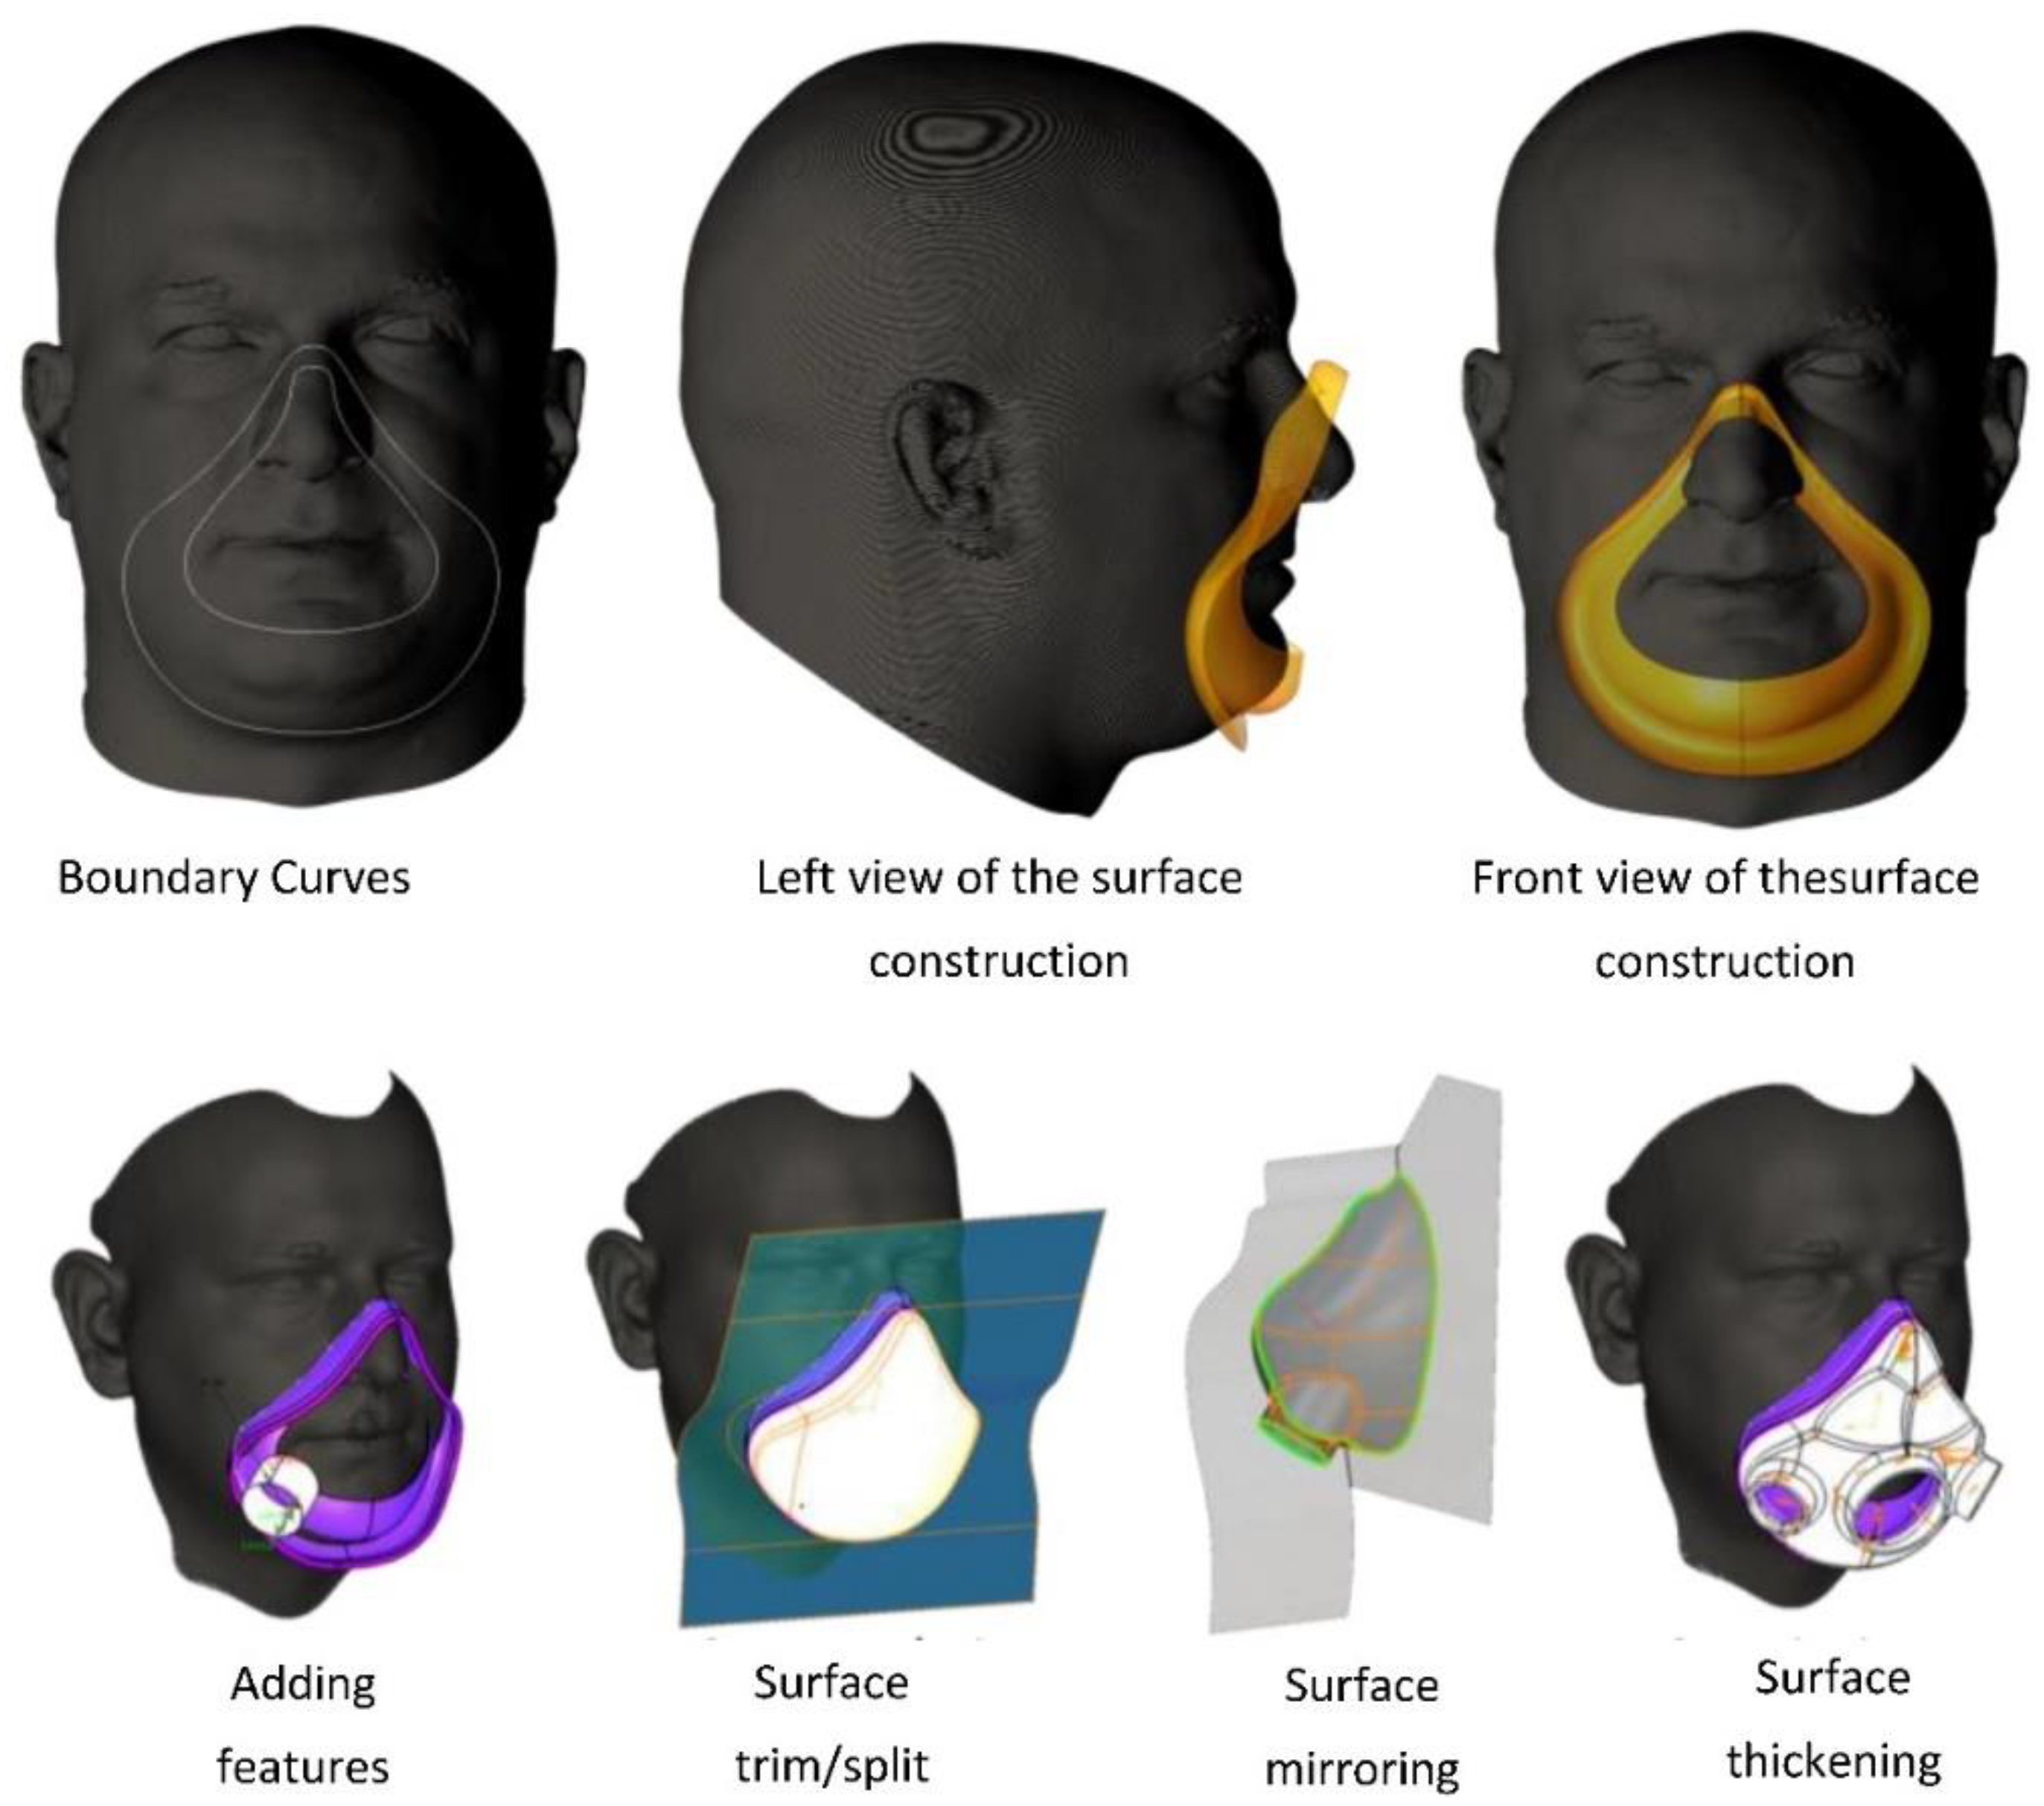
3.1. Design and Customization Phase

The first step in the customization phase concerns the acquisition of data regarding the facial geometry of the user and the construction of the corresponding virtual face model. Data regarding facial geometry can be generated through various methods, such as medical CT or MRI scanning, high resolution photographing or 3D scanning. In the present study, 3D scanning is proposed as the preferable method because it is relatively fast and simple to use in various environments and possesses sufficient accuracy. The employed handheld white light 3D scanner is capable of acquiring 1,500,000 measurements/s at 0.100 mm resolution. Part size ranges between 0.1 m and 4 m, and measurements are accurate within 0.050 mm. The scanner is also capable of capturing color and texture information and its use presents no risk for the eyes, even when used extensively. Acquired measurements are transferred via USB to a dedicated computer, where further processing of the data is performed using the appropriate software.
As recommended by manufacturer, scanner initialization, control and calibration are performed prior to scanning, to account for changes in air temperature and humidity and avoid deviations in scanning performance and accuracy. Scanning parameters such as shutter speed, filter view, resolution and positioning can be also configured by the operator to account for different conditions concerning the environment and the scanning subject.
Following initialization, scanning of the user in either standing or sitting position is performed (Figure 3). During scanning the corresponding software visually notifies the operator for the acquired geometry and whether some areas need re-scanning due to inappropriate distance between the scanner and the user’s face (areas are colored, red, green or blue, ranging from too close to too far, accordingly). During scanning the user must avoid any movement to ensure accurate capturing of face geometry. Fortunately, this requirement poses no problem since the required scanning time is quite short (20–30 s). The acquired raw data, in the form of a point cloud, are further processed to generate a tessellated (triangulated) surface model of the facial geometry for visually reviewing the scanning results (Figure 3). The corresponding mesh model of the facial geometry, can be further processed, cleaned and optimized employing appropriate tools in the software, before its final version in STL, OBJ or WRL form, is exported. Critical parameter, in terms of optimization, is the size of triangles employed, which defines the accuracy and the size of the mesh model. A relatively small size enhances the accuracy of the model at the expense of the relatively big size that may complicate subsequent processing. An optimum trade-off between scanning quality and size must be achieved to avoid over-burdening subsequent customization tasks.
The above-described procedure has been employed for obtaining the facial geometry of three subjects, two male and one female, in an office environment (Figure 4, first three from the left). Despite the fact that the operator had little relevant experience, the whole process proved relatively straightforward and was completed quite fast, taking only a few minutes for each subject. The corresponding STL models were then transferred to the CAD workstation for customizing the mask geometry to fit the users’ facial features. At this stage, two additional STL models of female faces were used to enlarge the size and variety of the investigated sample (Figure 4, right). Virtual models are also based on real people and were acquired online under license for business and commercial use.
Mask model customization begins with importing the face scan STL file. At this stage, the operator must first make sure that the correct units and scale are selected. The STL model is then used as a basis for constructing a surface model which is relatively easier to process in subsequent steps. The corresponding transformation is carried out through special operations (mesh creation/smoothing/cleaning, decimate and surface construction) that are provided by the CAD software and aims at removing errors from the STL file (such as duplicate, disconnected, or degenerate triangles) and optimize the trade-off between the model’s quality and the required computational resources. The extent of mesh processing operations, therefore, depends on the quality of the initial scan model and can vary from a few to several minutes, accordingly.
The generated mesh or surface model provides next the basis for the construction of the face flange. This is achieved by first constructing a set of boundary curves on the mesh model, which are then used to generate a surface that covers the nose and mouth area of the face (Figure 5). For these, operations free-form surface design tools were employed. A similar surface modeling approach was used to construct the original main body of the mask and the inner flange that enhances the connection between the face flange and the main body. The described operations were carried out for all four cases/face models to generate masks that correspond to different sizes and facial features, as well as obtain data and experience in the adopted surface modeling approach.
In terms of time and ease of modelling, performed design tests showed that this part of the process is not as straightforward and requires significant experience by the CAD software user. Creating the boundary curves involves manually adjusting the number and location of individual points along them. Additional curves are also required for constructing the complete surface using multi-section or blend surface tools. Extensive use of surface modeling operations, such as trimming, splitting, and merging of surfaces is also time-consuming and requires significant experience from the user. This practically meant that the initial time required for modeling the whole mask was several hours, but as experience was gained the surface modeling approach was gradually standardized and optimized. This led to significant reduction in modeling time, which accounted for about 2 h for the final case. According to our experience, this is not the minimum of the corresponding learning curve and further time reduction can be achieved through experience and experimentation. In fact, by further experiments and trials with surface modeling tools, the corresponding time has been reduced to approx. 1 h for subsequent cases. Design time can be further reduced by establishing a library of ready-made main body assemblies (the assembly of main body and all other components except the flanges) which correspond to standard/typical face sizes (small, medium, large etc.). This would allow the user to focus only on the design of the face and inner flanges upon which a readily available main body assembly of appropriate size could be attached.
The final operation of the customization phase is exporting the corresponding STL files which are then transferred to the AM machine process planning software for further processing.

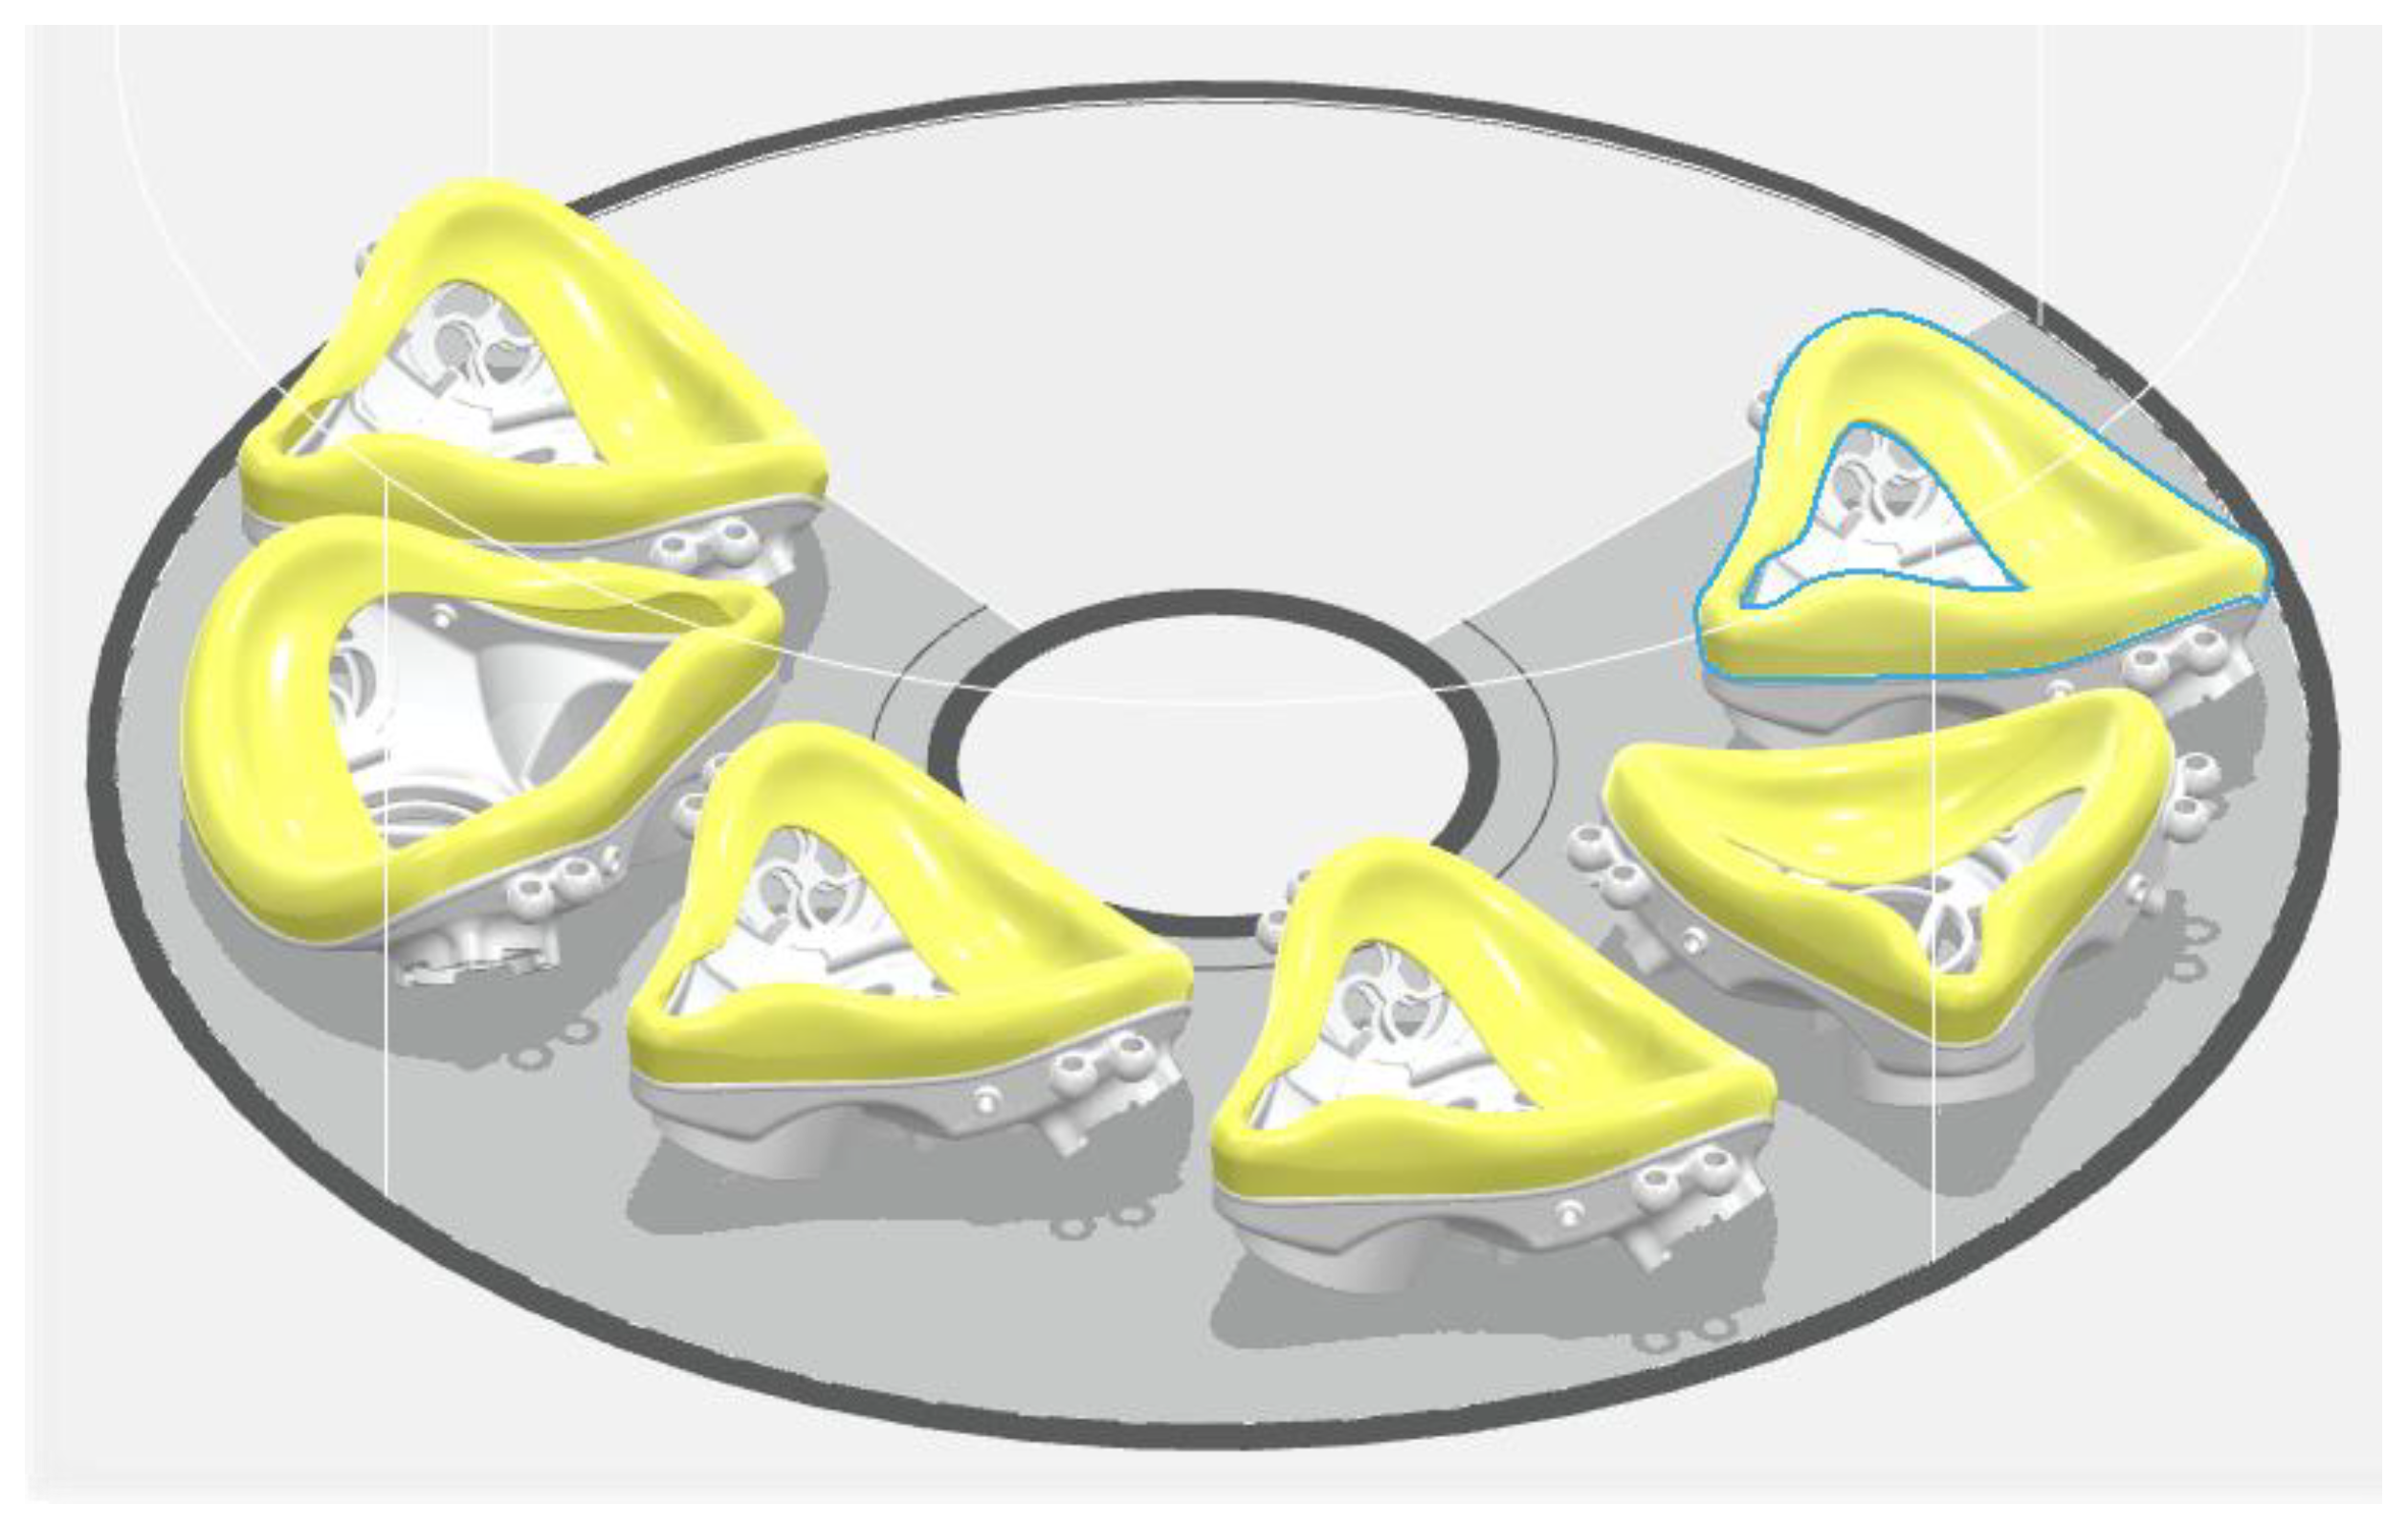
3.2. Process Planning and Fabrication

The MJ system employed for the tests is a Stratasys, Dentajet J5 polyjet printer. The corresponding process-planning software (slicer) allows the definition of basic build parameters, such as part orientation, layer resolution and layout planning of parts on the build platform, as well as the definition of more unique features such as the assignment of material per part and/or part section. A wide variety of materials with variable physical properties (stiffness, hardness, color, translucency, thermal resistance, etc.) are readily available. Furthermore, the software allows the definition of the so-called ‘digital’ materials, which are combinations of two or three base materials, permitting thereby the construction of parts with intermediate properties. An example is presented in Figure 6, which shows mask exhaust valves with various combinations of two basic materials, Agilus and Vero, so that variable rates of hardness, as measured by the corresponding shore A value, can be achieved. These variable hardness valves were then employed in mask prototypes for testing breathing comfort. Corresponding tests results showed that the optimum hardness value for the specific component is in the 30–40, shore A range.
The employed system also allows the use of biocompatible materials [86], which is an essential requirement for face mask components. In the performed tests, two types of biocompatible materials were used: the stiffer and stronger MED610 material and the flexible, rubber-like MED625FLEX material. Both materials are ISO certified for permanent skin contact and use in breathing gas pathways, and can be sterilized via plasma gas sterilization, which is a safe method also for the embedded electronics. The assigned material per mask component is presented in Table 1. Especially for exhaust valves, it should be noted that MED625FLEX has a hardness (shore A) value within the optimum range identified through experimentation.
Following process planning, slicing is performed, and the corresponding files were sent to the polyjet printer for fabrication. Performed fabrication tests involved the fabrication of two masks, one male and one female, in one assembly. Fabrication was carried out in two different build jobs that required approx. 23 h for both jobs.

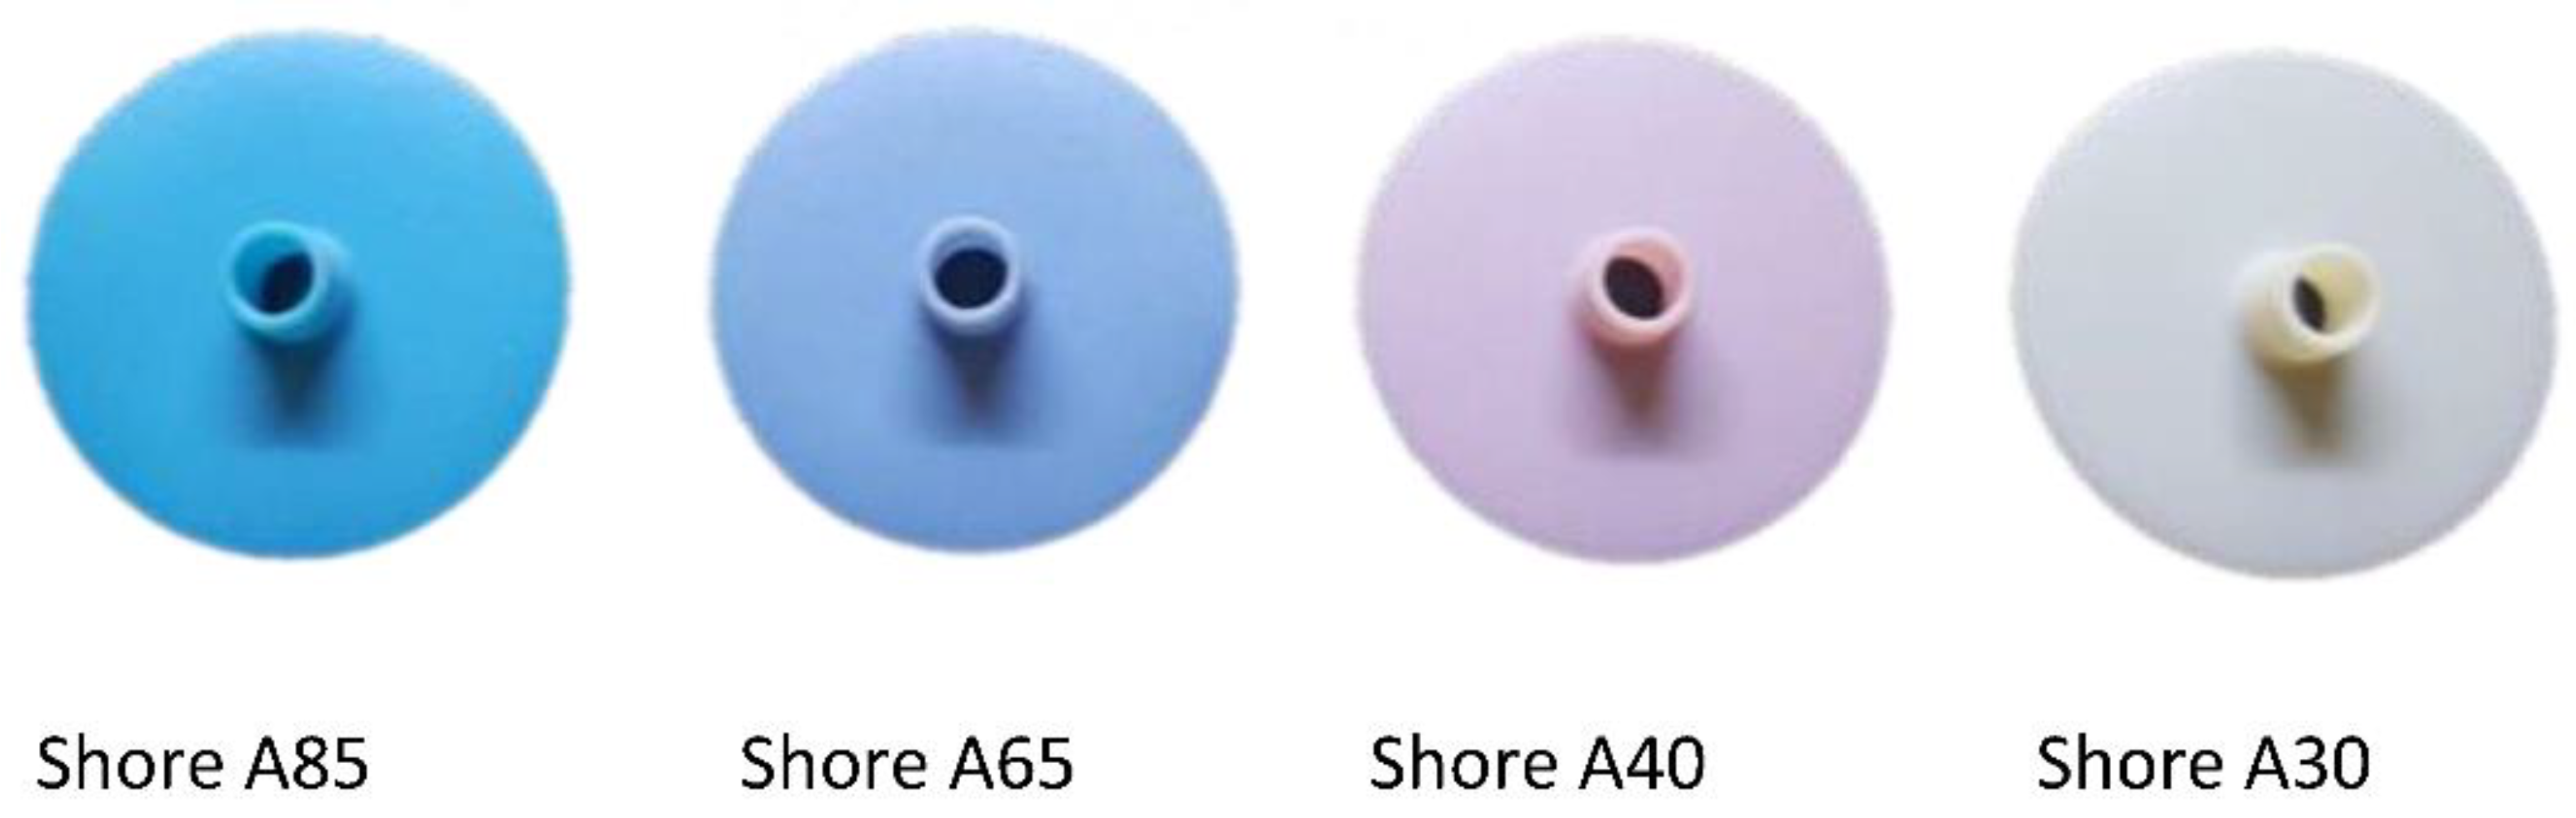
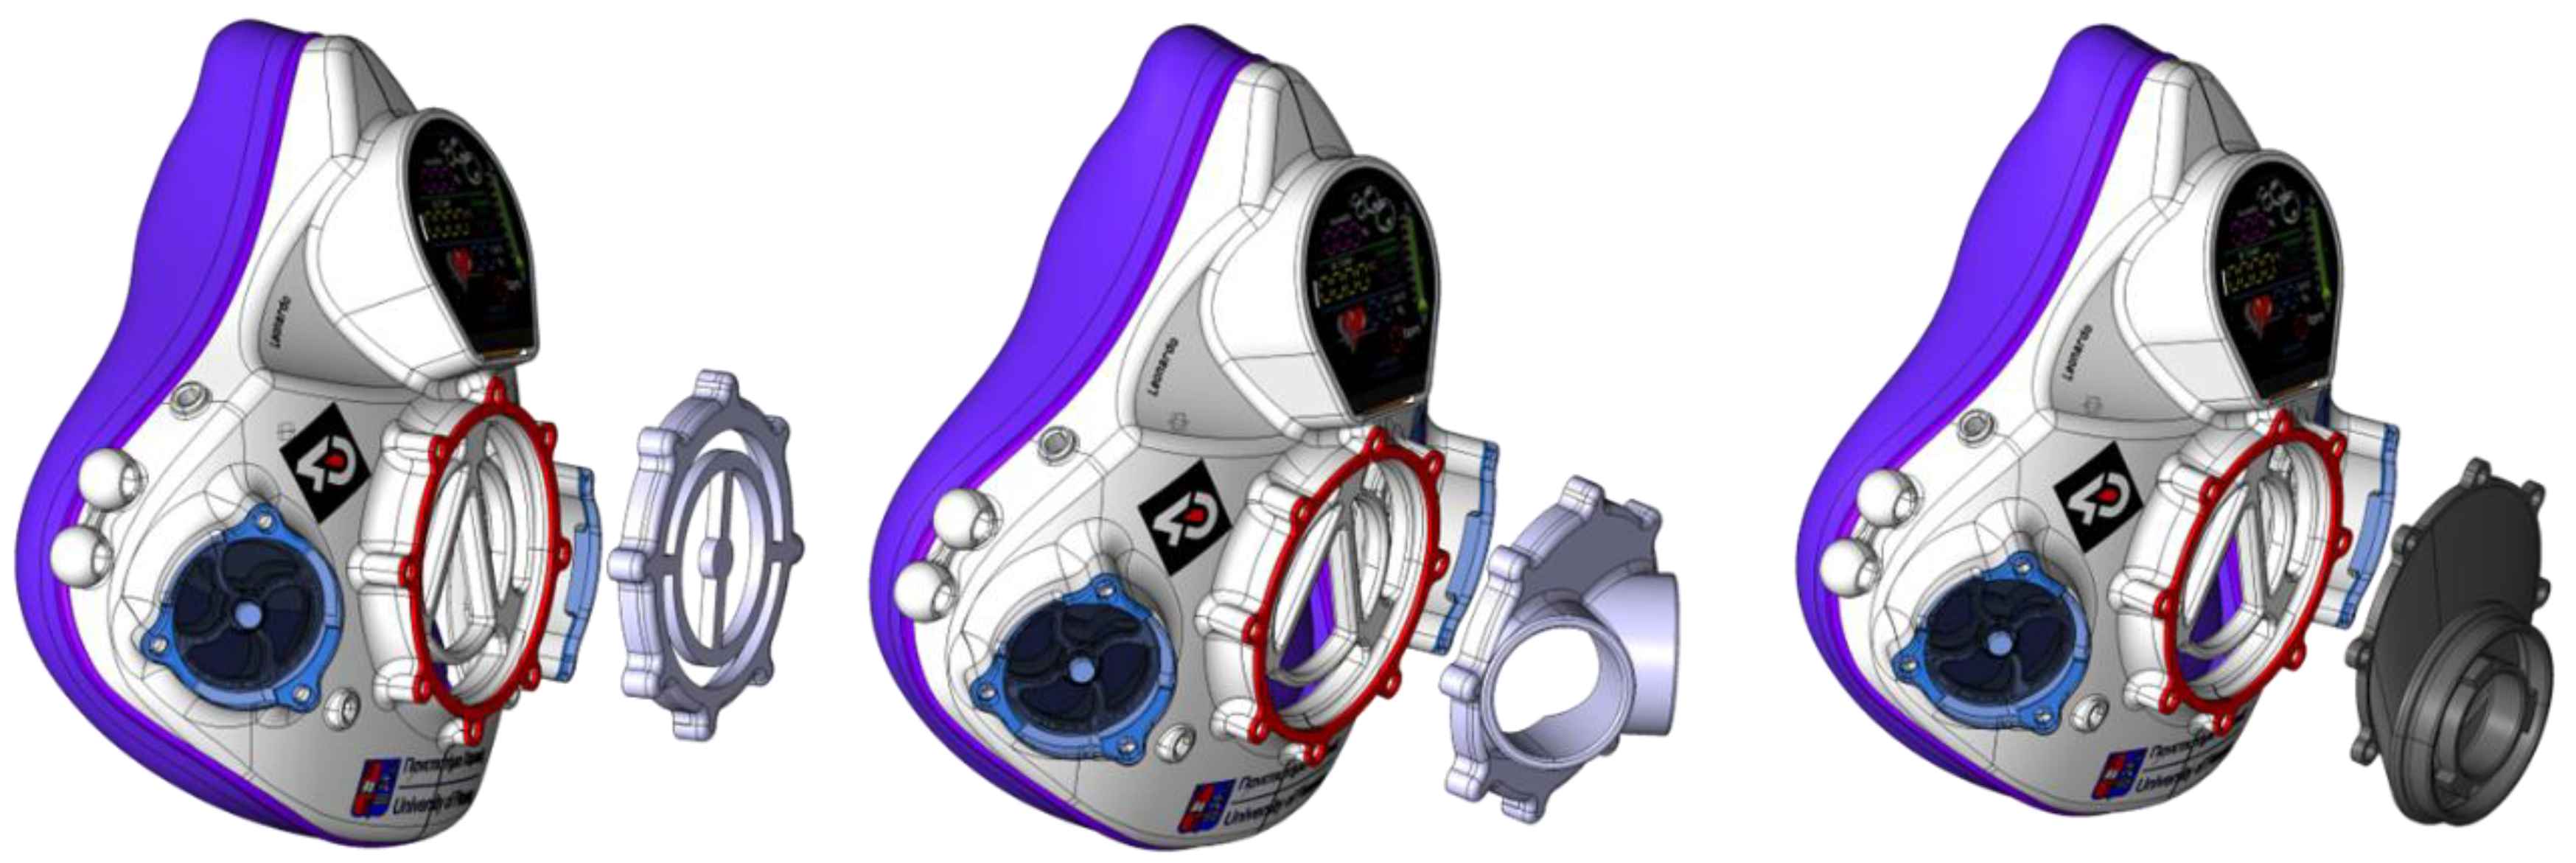
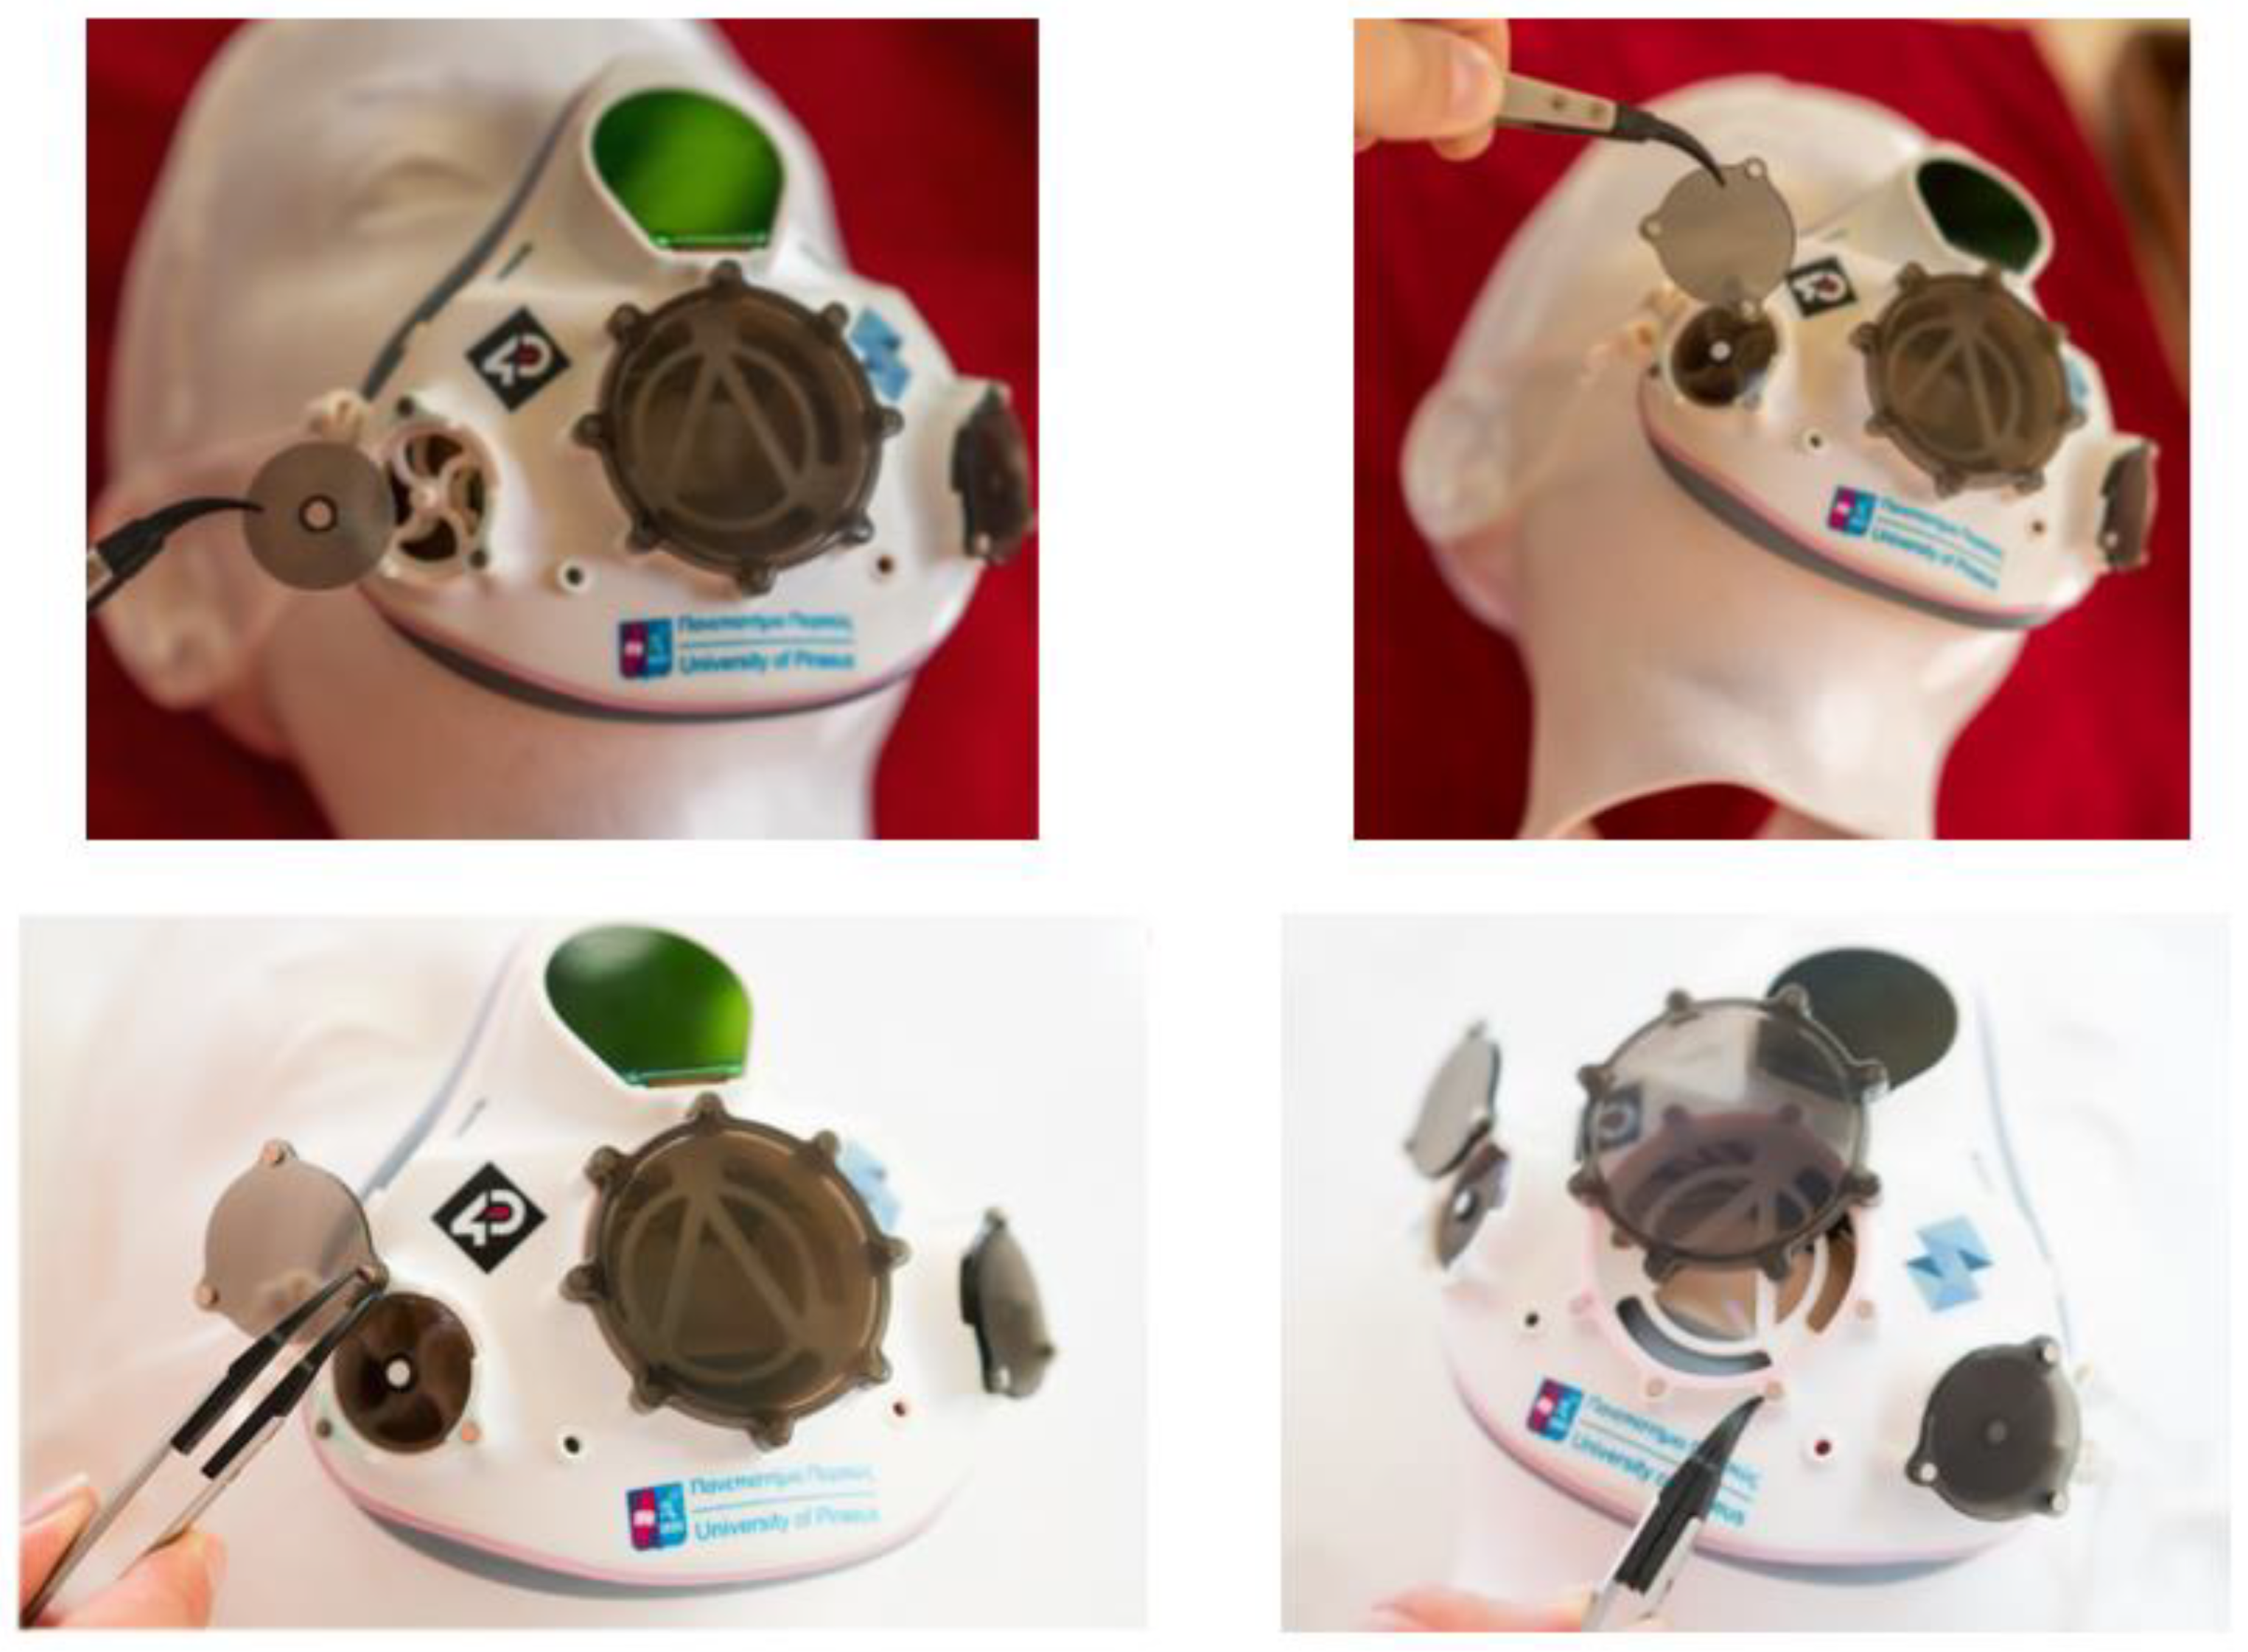
3.3. Post-Processing and Assembly

In the final phase of the process, the MJ parts were post-processed and assembled with the electronic and other components to obtain the final mask. Post-processing involves the removal of supports, which was completed relatively fast and easily since the employed support is water soluble. Cleaned parts were then dried and inspected for flaws, accuracy, and surface quality. Part inspection revealed no major flaws, and no further post-processing (e.g., polishing) was deemed necessary.
Subsequently, the assembly of the mask is performed. The assembly involved the attachment of various MJ parts on the main body, such as the attachment of exhaust valves and filters, is presented in Figure 7. Exhaust valve and filter sections incorporate neodymium magnets to facilitate removal of the corresponding components for sterilization or replacement.
Assembly operations also include the incorporation of electronic components, namely of one humidity sensor, one temperature sensor, and the digital display, as well as the attachment of the corresponding boards and cables. Temperature and moisture sensors provide data regarding both parameters inside the mask, to assess the corresponding level of comfort. The digital display is incorporated for displaying the sensor measurements and is positioned at the center of the main body, above the filter’s adaptor. A unique round display of relatively small size (Figure 8), equipped with an IPS wide viewing angle, 240 × 240-pixel resolution and 64k RGB TFT screen, an embedded microprocessor and onboard serial 16 Mb Flash memory chip (4DSystems PixxiLCD13P) has been selected. The communication with the screen has been established via a UART port, controlled directly from an external PIC18F26K22 microcontroller. In following versions of the mask a pulse oximetry sensor will also be incorporated, implemented as reported in [87], for assessing the heart rate and oxygen saturation levels in blood of wearer.
To perform a validating fit and assembly test, the three types of filter adaptors were also fabricated (Figure 9). Each adaptor facilitates the use of another type of filter: the general purpose adaptor permits the use of any type of certified filter, provided that it is supplied in the appropriate dimensions (in many cases the user may cut the required part from a bigger filter sheet); the second adaptor allows the use of hydrophobic filter membranes that prevent the passage of liquid substances, reducing thereby the risk of colonization and blockage and ensuring efficient operation of the airways and high bacterial filtration efficiency (>99.99%); while the third adaptor permits the incorporation of reusable respirator particulate filters (P2R), which offer improved comfort in breathing as with protection against solid and liquid particles.
To test the fitness of masks on the corresponding faces, the two mask prototypes were fitted on the corresponding faces; the male mask prototype was directly tried on by the corresponding individual, while the female prototype was fitted on the corresponding physical face model. In both cases a very good fit between the mask and the face has been observed. In terms of time, the post processing required approx. 30 min; 20 min for cleaning and inspection of MJ parts and 10 min for assembly of the whole mask and incorporation of electronics and filters.

4. Throughput, Cost and Facilities Analysis

4.1. Throughput Analysis

A basic parameter of a production system is its respective capacity, i.e., the maximum production throughput for a given time period (usually one year). An estimation of capacity is essential for decisions regarding the size of manufacturing facilities, the number and size of equipment used as well as the number of employees. For manufacturing systems incorporating a serial production process, such as the one investigated in the present study, system capacity is defined by the most time-consuming phases (‘bottlenecks’) of the process. According to the results of fabrication tests presented in the previous section, the two phases that are highly likely to act as ‘bottlenecks’ are the fabrication and the customization phases (associated mainly with the CAD modeling of the face flange).
Regarding the fabrication phase, the maximum throughput for most AM systems is, usually, achieved when the machine workspace or platform/tray is fully utilized, i.e., the maximum number of parts is packed in one build job. To investigate how the number of parts per job is related to throughput for the specific case, an analysis of tray layout was performed employing the pre-processing software of the specific MJ machine. The corresponding results are presented in Table 2.
As can be seen in Table 2, a maximum of 6 masks per build job, arranged as shown in Figure 10, is possible. It is also observed that total build time stabilizes at 26 h as the number of part increases. As a result of this there is a significant decrease in build time per part as the number of parts per job increases. This can be attributed to the method of fabrication employed by the specific MJ system which involves a revolving tray separated into three concentric sections that are visited consecutively by the deposition head. Since in the mask case all three sections are visited and the total number of layers per job (defined by the maximum height of parts in a job) is the same no matter how many masks are located in the tray, no increase in total build time is observed as more parts are simultaneously fabricated.
Another interesting observation concerns the estimated material cost per part, which accounts for both part and support materials costs. In this case significant cost gains can be achieved by increasing the number of parts per job. This is probably associated with the deposition head cleaning operation that is performed several times during fabrication. During cleaning, fixed amounts of material are purged in a basket (both model and support) and excess material on the deposition heads is brushed away to ensure sufficient and consistent flow of materials during deposition; hence a larger number of parts per job/tray allows allocation of the corresponding cost into more parts reducing, thereby, the materials cost per mask.
The maximum throughput (capacity) for the fabrication phase Pf can be evaluated by the following equation
P f = n m p j H f t j ,
where nm is the number of employed MJ systems, pj is the number of parts per job, tj is the corresponding job build time and Hf is the total number of fabrication hours per year. Assuming that pj = 6, tj = 26 h and that Hf = 6000 h, i.e., the machine is operating approx. 250 production days per year (considering machine downtime due to planned maintenance and unforeseen problems), the maximum production throughput Pf for a single machine is 1385 masks per year.
In a similar fashion the maximum CAD customization throughput/capacity Pc can be estimated by the following equation
P c = n e p e D c ,
where ne is the number of designers, pe is the number of masks a designer can process per working day (assuming that approx. 1 h per mask is needed), and Dc is the total number of working days per year. Assuming that a designer is employed 230 days per year and that 5 masks per designer and day can be processed (1 h each), it follows that Pc for a single designer is 1150.
Comparing Pc to Pf, the system throughput/capacity PS can be defined as follows.
P s = min ( P c , P f )
Accordingly, the system throughput/capacity complying with the above assumptions and employing one MJ system and one designer/operator equals 1150 masks/year, i.e., the process ‘bottleneck’ is in the customization phase. The process bottleneck can shift to the fabrication phase if a second designer/operator is employed, increasing the system throughput to 1385 masks/year. Likewise, the addition of a second MJ system increases the system throughput to 2300 masks/year shifting again the bottleneck in the customization phase. We, therefore, observe that system throughput can be fine-tuned to satisfy a specific production demand by adjusting the number of MJ and designers/operators employed.

4.2. Cost Analysis

For the evaluation of cost in AM various models have been proposed in the literature [88,89,90,91,92,93,94,95,96,97]. A break-down of total cost into basic elements which are associated mainly with production phases or activities, is the most commonly used approach. Basic costs are then further analyzed into elements according to the technology investigated and the level of accuracy required for the intended application.
Due to the dedicated nature of the production system, where contrary to AM practice only one product is manufactured, a different cost modeling approach has been adopted in the present study. In this approach labor and equipment are considered fixed for a given time period which represents the operational life of the production system. Total labor cost, CL is evaluated as the product of the number of employees, ne, by their yearly salary, se.
C L = n e s e
Total equipment CE cost is evaluated as the sum of costs with the three types of equipment used, i.e., machine (Cm), 3D scanner (Cs) and CAD workstation (Cd) costs.
C E = C m + C s + C d
For the evaluation of the three equipment costs, the respective number of units (nm, ns and nd), procurement cost ( C m p for the MJ machines, C s p for the scanners, and C d p for CAD hardware and software) and maintenance and/or license cost ( C m a for the MJ machines and C d a for CAD hardware and software) are employed.
C m = n m ( C m p + T s C m a )
C s = n s C s p
C d = n d ( C d p + T s C d a )
Based on total labor and equipment costs as well the estimated total throughput PS for the (production capacity) the associated costs per mask ( C l u : labor cost per mask, C m u : MJ machine cost per mask, C s u : scanning cost per mask and C d u : CAD equipment cost per mask) are calculated.
C l u = C l P S
C m u = C m P S
C s u = C s P S
C d u = C d P S
The sum of the above costs per mask, plus the corresponding material cost C r u represents the basic production cost (Equation (13)).
C P u = C l u + C m u + C s u + C d u + C r u
Finally, the total production cost C t u is evaluated by applying an overhead percentage OC (Equation (14)).
C t u = C P u ( 1 + O C )
Overhead costs are associated with secondary cost drivers that include energy consumption, administrative costs and handling/delivery costs. Energy consumption can be considered low, even for the most energy-consuming fabrication phase, where a maximum power consumption of 550 W should be expected in printing mode [98].
According to the above cost model and the throughput analysis presented in the previous section, total and per mask costs can be evaluated for different system configurations. Estimated total and per mask costs for an operational period of 5 years and different production system configurations (systems employing variable number of equipment and employees) are presented in Table 3. Presented estimations are based on previous assumptions regarding fabrication/operations’ times and costs as well as on the assumption that machine workspace is fully utilized (6 masks per job). Based on these assumptions we observe that the cost per mask for system configurations that utilize available machine and labor is around 150€, independent of system throughput. Furthermore, we observe that a significant part of the unit cost is associated with materials and labor costs, which combined represented 60–65% of the total.

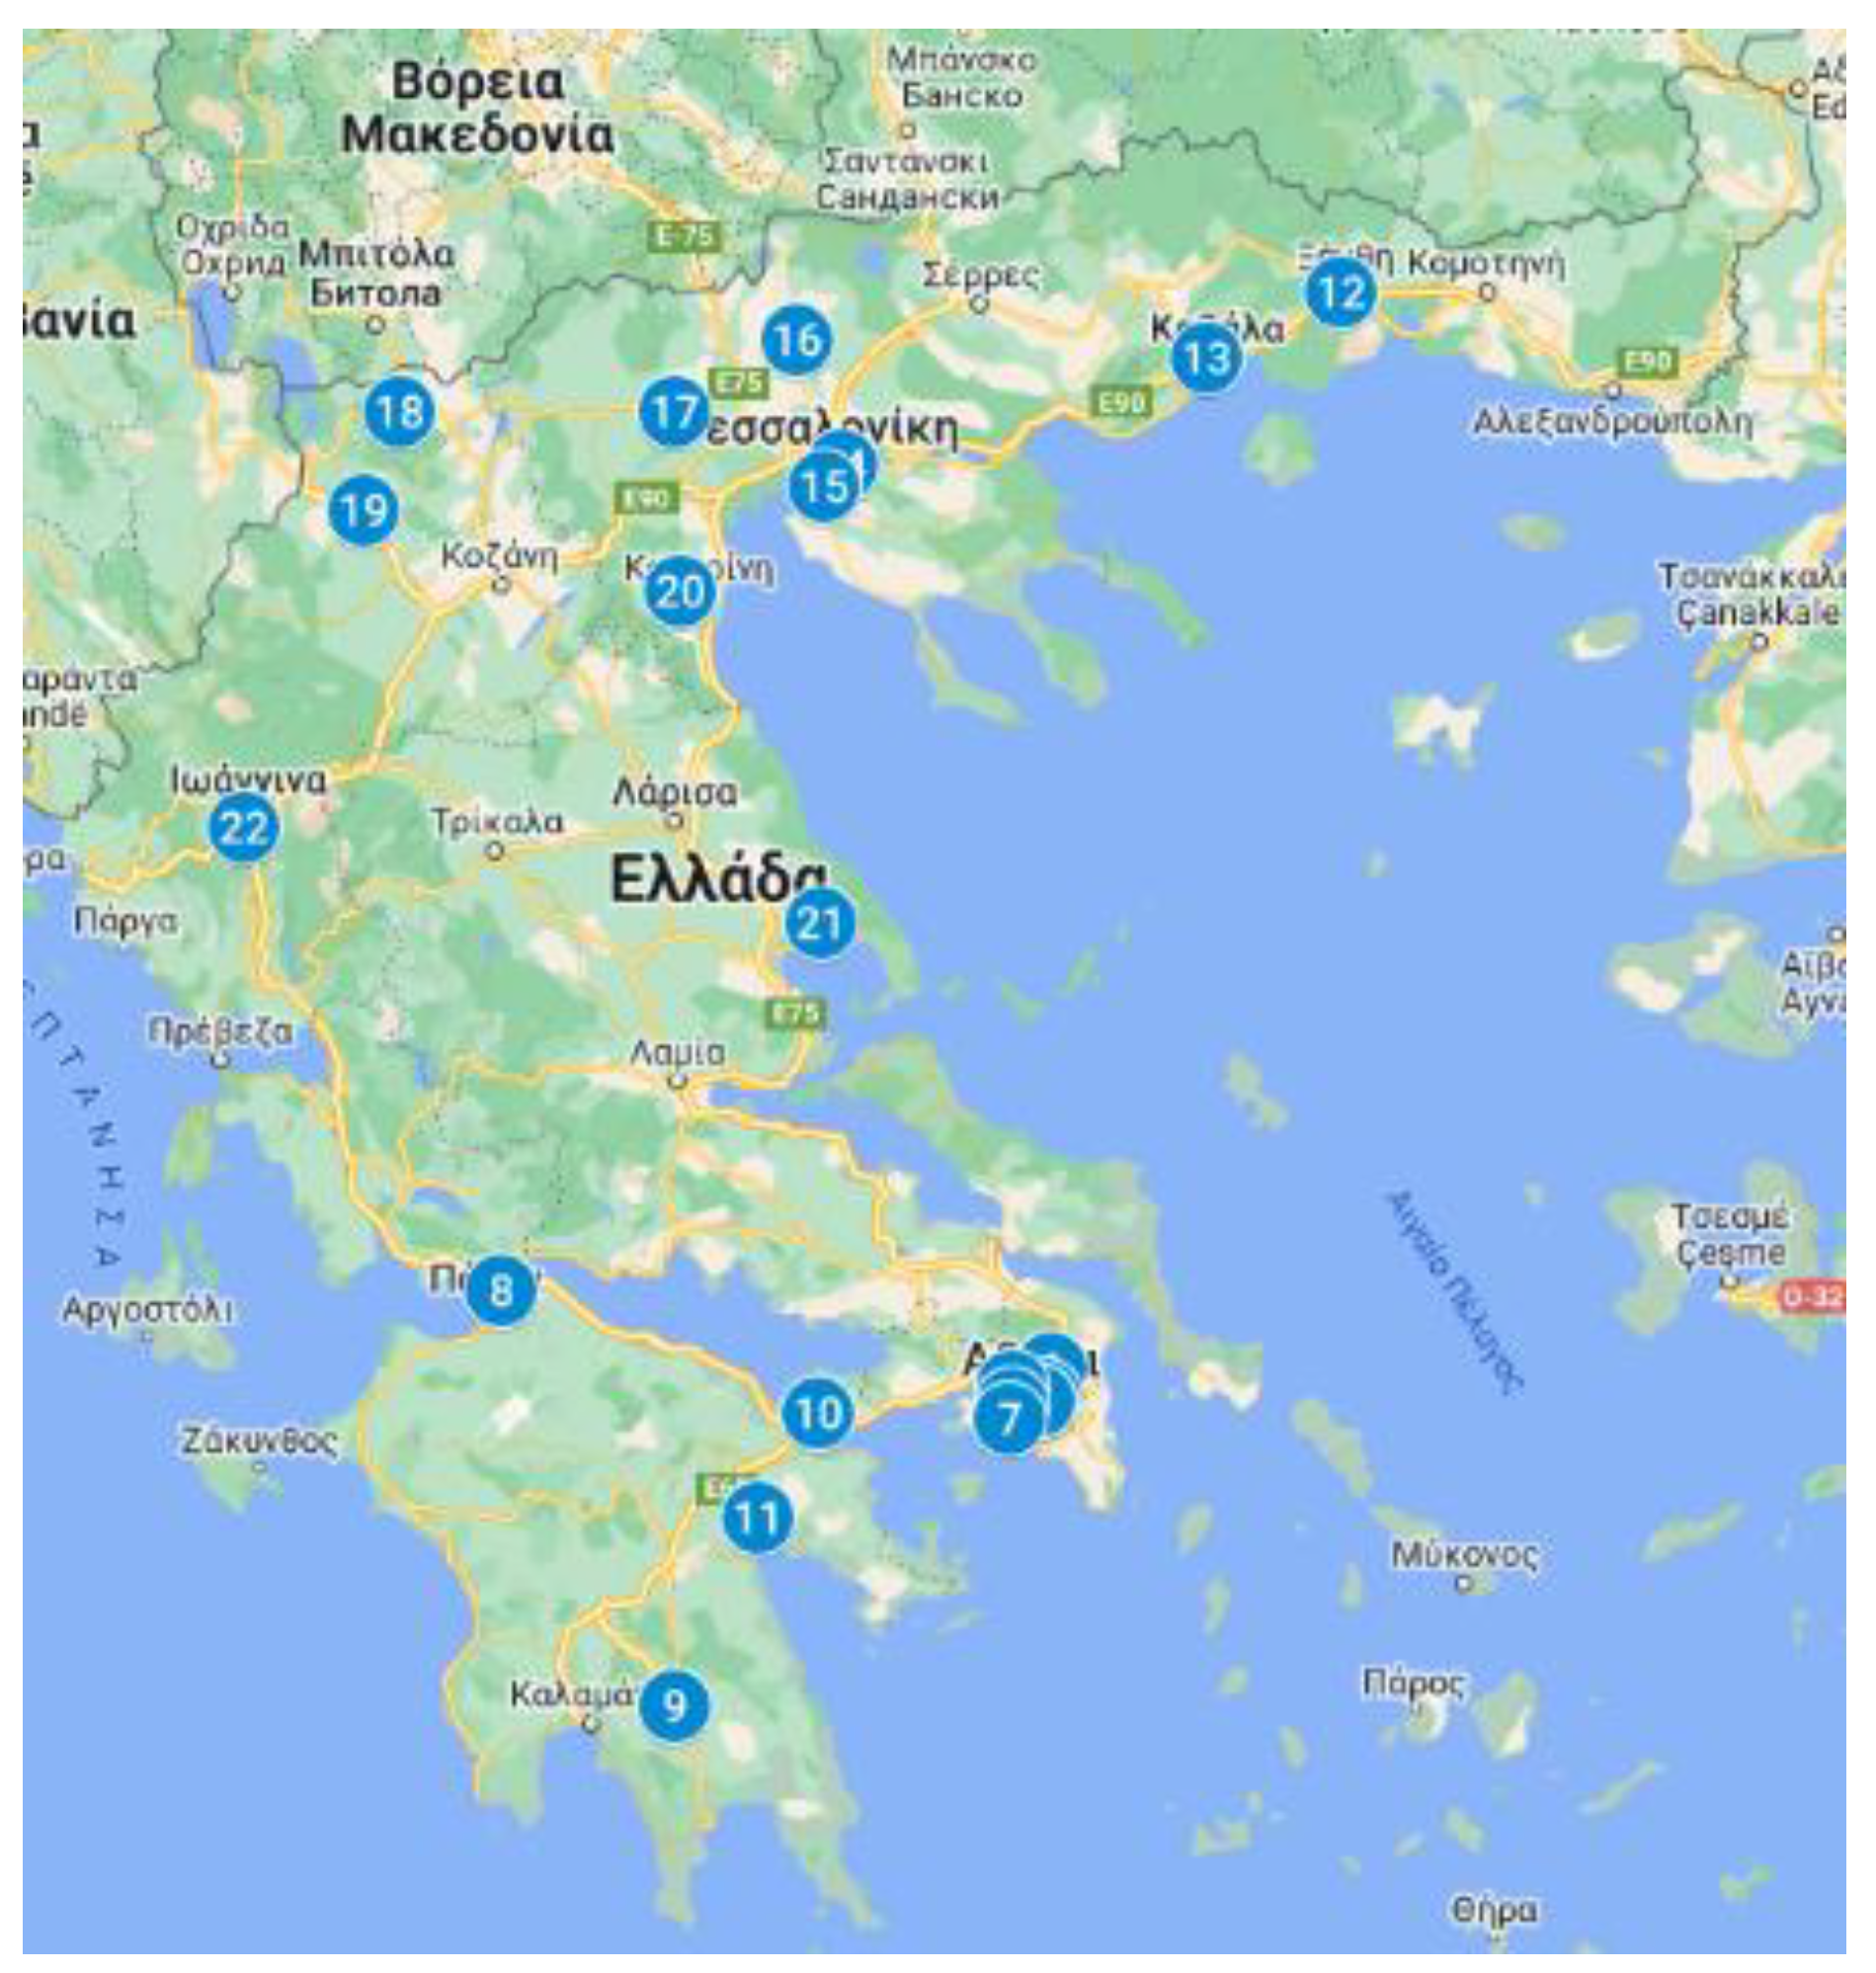
4.3. Facility Analysis

A central issue in production system design is to decide the number of production facilities employed and their geographic location. The corresponding choices combined with previous decisions concerning throughput, process and product have profound impact on the effect on the accomplishment of objectives associated with the five key operational metrics of system performance, namely quality, cost, speed, flexibility, and dependability [23]. Configuration ‘E’, for example, can be realized either in a central facility incorporating all corresponding equipment and employees or as a network of three smaller size facilities, employing at least one piece of the necessary equipment. With respect to key strategic objectives, it can be said that the centralized option favors quality (in the sense of production defects) and low cost because the centralized structure makes administration, control, maintenance, and other operations simpler, while the decentralized favors speed and lower lead times, especially when demand is geographically dispersed. A network approach may also affect quality in terms of service, considering that it may be easier for the customer to interact with the system, e.g., the customer does not have to travel too far for face scanning. Furthermore, the actual throughput of the system may be significantly lower than its theoretical maximum to allow for abrupt increases in demand, e.g., for an emergency situation where a larger than usual number of masks is required for a short period of days, or operational disruptions. In this case the designed spare capacity can be as a strategy to increase the dependability and flexibility of the system.
Identifying the optimum location for one or more facilities is a problem that has been studied extensively over the years and several methods have been proposed to address it [99,100]. In its classical formulation, the facilities (sources, warehouses, plants) should cover a particular geographical area containing several demand centers, of known locations, demand volumes, and transportation rates. In the present study a preliminary study of the problem is performed to gain insight into the characteristics of the specific case. The investigated problem concerns serving the demand of 22 public hospitals located in mainland Greece. Using Google Maps, the geographical position of each hospital was defined, and a map of the corresponding area was constructed (Figure 11). As expected, a large percentage of hospitals are located in the metropolitan area of Athens (hospitals 1–7), where a large part of the total population resides.
A weighting factor (importance) was then assigned to each hospital according to its size, defined by the number of the corresponding medical personnel and the presence and size of an intensive care unit within it (Table 4). It was also assumed that the mask production facilities would be located within these hospitals. This has obvious advantages in terms of nearness to the demand as well as of operational costs since available infrastructure (medical equipment and processes) can be utilized leading to lower operational and administration costs.
To identify optimum locations, the modified p-median method has been employed. The p-median has been selected because it is an established and well-studied facility location method; further information regarding this can be found in [101] and [102]. In the specific context, therefore, the p-median problem concerns locating p AM facilities so that the weighted average distance between hospitals/health-care centers and the facilities is minimized. This is true also for the case under investigation, where demand is geographically dispersed at various healthcare facilities located in various cities. To solve various instances of the specific problem, the LOGWARE software issue [101] has been employed. The corresponding results are presented in Table 5.
In terms of cost, the distributed manufacturing approach should not incur significant additional costs, based on the prior assumptions that there is full capacity utilization (actual throughput is close to its maximum value) and that individual units are housed inside the selected hospitals; hence there is no need for standalone facilities and the corresponding costs. Furthermore, possible additional material handling and warehouse costs, due to the larger number of facilities, are expected to be compensated by lower costs in shipping and delivery of the masks to customers due to the lower mean distance between them and the facilities.
On the other hand, if actual throughput is less than designed capacity, as a means to enhance the system’s resilience and responsiveness, the unit cost per mask will obviously increase. Some examples of the estimated costs for distributed networks of manufacturing facilities with spare capacity are shown in Table 6 (equipment costs, labor costs and labor productivity are the same with those used in Table 3). In system configuration ‘H’, for example, a network of 3 manufacturing facilities located at hospitals 2, 7 and 16, as shown in Table 6, is examined. Mask demand is expected to be around 2000 masks per year, which is roughly half system capacity (4154 masks per year). Assuming that demand is evenly distributed across the whole period and that the system is designed to produce masks are fast as possible (minimize lead time) it follows that the mean number of parts per job is approx. 3. Based on the above, the allocated cost per mask is obviously higher than the corresponding costs for a network of fully utilized facilities with similar capacity (configurations ‘E’ and ‘F’ in Table 3).

5. Discussion

The study of the face mask/respirator case provides some useful insights regarding the problems and decisions that arise during the design phase of a DDM production system. These issues can be grouped into three major areas: product design; process and capacity design; and facility planning and allocation.
Regarding product design, the results of the study underscore the importance of considering the constraints and exploiting the capabilities of the MJ technology that serves as the basis for the DDM production system. For the specific case, the main constraint is associated with the limited availability of materials with the required physical properties and biocompatibility. This constraint, however, is partially alleviated by the possibility of employing multiple materials and combining them to achieve intermediate properties and functionality. According to the results of the cost analysis, materials costs represent a significant portion of the total cost; hence minimizing the volume/weight of the product is an objective that should be given proper consideration during product design. Careful consideration should also be given to the effect that product design choices have on other production phases, besides machine part fabrication. Critical, for the investigated case, is the customization phase, and the construction of the personalized mask virtual model in particular. Associated tasks require significant expertise and time; hence, simplifying or automating them through appropriate design choices will reduce both production cost and time.
As expected, the mask fabrication phase is the most time-consuming and costly phase of the production process. Achieving a high machine and material utilization rate is, therefore, very important to minimize production cost per unit and maximize throughput. On the other hand, lower machine utilization may be desirable to minimize lead time and to be able to deal with abrupt increases in demand. Excess production capacity can be achieved either by employing more MJ machines of medium size, such as the one in the present study, or by employing machines of larger build volume. In both cases additional costs will incur, increasing thereby the fabrication cost per unit. A possible way to reduce these excess associated costs would be to employ the equipment to other similar biomedical applications (e.g., production of medical tools and pre-surgery models) in times of ‘stable’ demand, while reserving the machines for dedicated mask fabrication in cases of emergency.
The production phase associated with the least cost and time was process planning, since the product features are to a large extent fixed, and process planning parameters, such as optimum part orientation and build layout, are predefined and standard. Post-processing tasks, namely cleaning, assembly and part inspection, require also minimal labor effort and do not therefore significantly affect production cost and time. This, however, will not probably be the case in an actual production setting where more thorough functional testing and quality control will most likely be required. Quality control has not been considered in the present study because it needs all aspects of product and process to be finalized; nevertheless, it is an important issue that must be taken into account in actual practice. Additional post-processing operations may also be required to improve the functionality of the mask, applying e.g., protective coating to enhance mask sealing and endurance. To define the extent that such operations are needed requires thorough testing that will be conducted in future stages of the research.
Process and cost analysis led to the identification of another issue that is probably worth further investigation, namely the incorporation of additional AM technologies in the DDM production system. Lower cost extrusion or photopolymer-processing 3D printing systems could, for example, be employed for the fabrication of mask components that do not have high accuracy tolerances or come to direct contact with the face, in order to reduce processing costs. This of course requires a redesign of the mask to ensure proper fitting between various components and facilitate assembly.
The study provided also some useful Insights regarding the choice of centralization rate for the required facilities. A central DDM facility affects positively cost and possibly quality by enabling central control and inspection of equipment. The investigated case, however, seems to favor a decentralized approach where a network of production facilities is dispersed across the required geographical area. The network approach is considered favorable because it mainly facilitates the customization phase by lowering the distance between the scanning facilities and the customers. The same could be argued for lead time but the extent that delivery lead time is improved depends on the size of the geographical size. Extra cost associated with a decentralized facility network can be minimized if production facilities are located within existing healthcare facilities, which is relatively straightforward considering the limited installation requirements of 3D scanning equipment and MJ systems.

6. Concluding Remarks

In the present paper the design of a DDM system for customized products is investigated. The proposed methodological framework, which considers the interrelated aspects of product design, process design and facility planning, is applied for the case of a medical face mask that is customized to the facial characteristics of the user. Fabrication tests indicate the feasibility of the approach, both in technical and economic terms. The results of cost and throughput analysis underscore the importance of machine utilization for minimizing fabrication cost per unit. Fabrication cost per unit, for the specific case, is associated both with machine utilization and material consumption, which are both optimized with higher machine workspace utilization. Estimated costs are expectedly higher than those of mass-produced products but not prohibitively high. Since both material and machine costs are expected to decrease as MJ technology further matures, future production costs for customized masks are, also, expected to decrease.
One of the aspects of mask design that requires further research concerns the incorporation of sensors and their functionality. The authors are currently investigating issues concerned with the location and function of the sensors, as well that of the accompanying electronics. Synergetic use of AM systems based on different technologies to produce different mask components could also be an interesting topic for future research. Regarding usage, preliminary tests indicate that the mask fits perfectly on the face and can be used comfortably for prolonged periods of time; actual tests, however, in real settings are required to validate these preliminary findings. Finally, an interesting subject for further research is to investigate facility size and location issues assuming that the DDM system is employed for the production of multiple products, besides the custom-made mask, with uncertain and/or stochastic demand.

Author Contributions

Conceptualization, L.B., T.P. and J.G.; Methodology, L.B., V.C., T.P. and J.G.; Software, L.B. and T.P.; Validation, L.B.; Formal Analysis, V.C. and J.G.; Investigation, L.B., T.P. and V.C.; Writing—Original Draft Preparation, L.B., V.C. and T.P.; Writing—Review and Editing, J.G.; Visualization, L.B., T.P. and V.C.; Supervision, J.G. All authors have read and agreed to the published version of the manuscript.

Funding

This research received no external funding.

Institutional Review Board Statement

All subjects gave their informed consent for inclusion before they participated in the study. The study was conducted in accordance with the Declaration of Helsinki, and the protocol was approved by the Ethics Committee of Industrial Technology & Management Dept. of the University of Piraeus (Project: Development and Production via AM of a Customized Face Mask for Medical Use).

Informed Consent Statement

Written informed consent has been obtained from all subjects involved in the study to publish this paper.

Acknowledgments

The authors would like to thank Panagiotis Diamantopoulos (University of Athens, Medical School, Physiology Lab) for his very helpful and insightful comments regarding the design and perceived usage of the mask. The authors would, also, like to express their most sincere gratitude to Stratasys Ltd. and 4th Dimension Technologies S.A. for providing polyjet printing, CAD and 3D scanning resources and materials during the whole course of the research. Finally, the provision of female virtual models by 3dscanstore (special thanks to James Busby), and digital display devices by 4D Systems (special thanks to Yema Akbar) is gratefully acknowledged.

Conflicts of Interest

The authors declare no conflict of interest.

References

  1. Levy, G.N.; Schindel, R.; Kruth, J.P. Rapid manufacturing and rapid tooling with layer manufacturing (LM) technologies, state of the art and future perspectives. CIRP Ann. 2003, 52, 589–609. [Google Scholar] [CrossRef]
  2. Gibson, I.; Rosen, D.; Stucker, B. Development of Additive Manufacturing Technology. In Additive Manufacturing Technologies, 2nd ed.; Springer: New York, NY, USA, 2015; pp. 19–42. [Google Scholar]
  3. Chen, D.; Heyer, S.; Ibbotson, S.; Salonitis, K.; Steingrímsson, J.G.; Thiede, S. Direct digital manufacturing: Definition, evolution, and sustainability implications. J. Clean. Prod. 2015, 107, 615–625. [Google Scholar] [CrossRef]
  4. Cerdas, F.; Juraschek, M.; Thiede, S.; Herrmann, C. Life cycle assessment of 3D printed products in a distributed manufacturing system. J. Ind. Ecol. 2017, 21, S80–S93. [Google Scholar] [CrossRef]
  5. Manero, A.; Smith, P.; Koontz, A.; Dombrowski, M.; Sparkman, J.; Courbin, D.; Chi, A. Leveraging 3D printing capacity in times of crisis: Recommendations for COVID-19 distributed manufacturing for medical equipment rapid response. Int. J. Environ. Res. Public Health 2020, 17, 4634. [Google Scholar] [CrossRef] [PubMed]
  6. Wan, J.; Cai, H.; Zhou, K. Industrie 4.0: Enabling technologies. In Proceedings of the 2015 International Conference on Intelligent Computing and Internet of Things, Harbin, China, 17–18 January 2015. [Google Scholar]
  7. Rauch, E.; Dallasega, P.; Matt, D.T. Distributed manufacturing network models of smart and agile mini-factories. Int. J. Agil. Syst. Manag. 2017, 10, 185–205. [Google Scholar] [CrossRef]
  8. Dalenogare, L.S.; Benitez, G.B.; Ayala, N.F.; Frank, A.G. The expected contribution of Industry 4.0 technologies for industrial performance. Int. J. Prod. Econ. 2018, 204, 383–394. [Google Scholar] [CrossRef]
  9. Attaran, M. Additive Manufacturing: The Most Promising Technology to Alter the Supply Chain and Logistics. J. Serv. Sci. Manag. 2017, 10, 189–205. [Google Scholar] [CrossRef] [Green Version]
  10. Azarian, M.; Yu, H.; Solvang, W.D. Integrating Additive Manufacturing into a Virtual Industry 4.0 Factory. In Lecture Notes in Electrical Engineering; Wang, Y., Martinsen, K., Yu, T., Wang, K., Eds.; Springer: Singapore, 2021; Volume 737, pp. 587–594. [Google Scholar]
  11. Mellor, S.; Hao, L.; Zhang, D. Additive manufacturing: A framework for implementation. Int. J. Prod. Econ. 2014, 149, 194–201. [Google Scholar] [CrossRef] [Green Version]
  12. Gaub, H. Customization of mass-produced parts by combining injection molding and additive manufacturing with Industry 4.0 technologies. Reinf. Plast. 2016, 60, 401–404. [Google Scholar] [CrossRef]
  13. Srinivasan, R.; Giannikas, V.; McFarlane, D.; Thorne, A. Customising with 3D printing: The role of intelligent control. Comput. Ind. 2018, 103, 38–46. [Google Scholar] [CrossRef]
  14. Kreiger, M.; Pearce, J.M. Environmental life cycle analysis of distributed three-dimensional printing and conventional manufacturing of polymer products. ACS Sustain. Chem. Eng. 2013, 1, 1511–1519. [Google Scholar] [CrossRef]
  15. Laskurain-Iturbe, I.; Arana-Landín, G.; Landeta-Manzano, B.; Uriarte-Gallastegi, N. Exploring the influence of industry 4.0 technologies on the circular economy. J. Clean. Prod. 2021, 321, 128944. [Google Scholar] [CrossRef]
  16. Hettiarachchi, B.D.; Brandenburg, M.; Seuring, S. Connecting additive manufacturing to circular economy implementation strategies: Links, contingencies and causal loops. Int. J. Prod. Econ. 2022, 246, 108414. [Google Scholar] [CrossRef]
  17. Wohlers, T.; Tim Caffrey, T. 3D Printing and Additive Manufacturing State of the Industry; Wohlers Associates, Inc.: Fort Collins, CO, USA, 2014. [Google Scholar]
  18. Conner, B.P.; Manogharan, G.P.; Martof, A.N.; Rodomsky, L.M.; Rodomsky, C.M.; Jordan, D.C.; Limperos, J.W. Making sense of 3-D printing: Creating a map of additive manufacturing products and services. Addit. Manuf. 2014, 1, 64–76. [Google Scholar] [CrossRef]
  19. Najmon, J.C.; Raeisi, S.; Tovar, A. Review of additive manufacturing technologies and applications in the aerospace industry. In Additive Manufacturing for the Aerospace Industry; Froes, F., Boyer, R., Eds.; Elsevier: Amsterdam, The Netherlands, 2019; pp. 7–31. [Google Scholar]
  20. Simons, M. Additive manufacturing—a revolution in progress? Insights from a multiple case study. Int. J. Adv. Manuf. Technol. 2018, 96, 735–749. [Google Scholar] [CrossRef]
  21. Kretzschmar, N.; Chekurov, S.; Salmi, M.; Tuomi, J. Evaluating the readiness level of additively manufactured digital spare parts: An industrial perspective. Appl. Sci. 2018, 8, 1837. [Google Scholar] [CrossRef] [Green Version]
  22. Khajavi, S.H.; Partanen, J.; Holmström, J. Additive manufacturing in the spare parts supply chain. Comput. Ind. 2014, 65, 50–63. [Google Scholar] [CrossRef]
  23. Eyers, D.R.; Potter, A.T. Industrial Additive Manufacturing: A manufacturing systems perspective. Comput. Ind. 2017, 92, 208–218. [Google Scholar] [CrossRef]
  24. Salmi, M.; Akmal, J.S.; Pei, E.; Wolff, J.; Jaribion, A.; Khajavi, S.H. 3D printing in COVID-19: Productivity estimation of the most promising open source solutions in emergency situations. Appl. Sci. 2020, 10, 4004. [Google Scholar] [CrossRef]
  25. Durão, L.F.C.; Christ, A.; Anderl, R.; Schützer, K.; Zancul, E. Distributed manufacturing of spare parts based on additive manufacturing: Use cases and technical aspects. Procedia CIRP 2016, 57, 704–709. [Google Scholar] [CrossRef]
  26. Khajavi, S.H.; Holmström, J.; Partanen, J. Additive manufacturing in the spare parts supply chain: Hub configuration and technology maturity. Rapid Prototyp. J. 2018, 24, 1178–1192. [Google Scholar] [CrossRef] [Green Version]
  27. Kostidi, E.; Nikitakos, N.; Progoulakis, I. Additive Manufacturing and Maritime Spare Parts: Benefits and Obstacles for the End-Users. J. Mar. Sci. Eng. 2021, 9, 895. [Google Scholar] [CrossRef]
  28. Rupp, M.; Buck, M.; Klink, R.; Merkel, M.; Harrison, D.K. Additive manufacturing of steel for digital spare parts–A perspective on carbon emissions for decentral production. Clean. Environ. Syst. 2022, 4, 100069. [Google Scholar] [CrossRef]
  29. González-Varona, J.M.; Poza, D.; Acebes, F.; Villafáñez, F.; Pajares, J.; López-Paredes, A. New business models for sustainable spare parts logistics: A case study. Sustainability 2020, 12, 3071. [Google Scholar] [CrossRef] [Green Version]
  30. Ballardini, R.M.; Ituarte, I.F.; Pei, E. Printing spare parts through additive manufacturing: Legal and digital business challenges. J. Manuf. Technol. Manag. 2018, 29, 958–982. [Google Scholar] [CrossRef] [Green Version]
  31. Heinen, J.J.; Hoberg, K. Assessing the potential of additive manufacturing for the provision of spare parts. J. Oper. Manag. 2019, 65, 810–826. [Google Scholar] [CrossRef] [Green Version]
  32. Eyers, D.R.; Potter, A.T.; Gosling, J.; Naim, M.M. The flexibility of industrial additive manufacturing systems. Int. J. Oper. Prod. Manag. 2018, 38, 2313–2343. [Google Scholar] [CrossRef] [Green Version]
  33. Basak, S.; Baumers, M.; Holweg, M.; Hague, R.; Tuck, C. Reducing production losses in additive manufacturing using overall equipment effectiveness. Addit. Manuf. 2022, 56, 102904. [Google Scholar] [CrossRef]
  34. Achillas, C.; Aidonis, D.; Iakovou, E.; Thymianidis, M.; Tzetzis, D. A methodological framework for the inclusion of modern additive manufacturing into the production portfolio of a focused factory. J. Manuf. Syst. 2015, 37, 328–339. [Google Scholar] [CrossRef]
  35. Stavropoulos, P.; Foteinopoulos, P.; Papacharalampopoulos, A.; Bikas, H. Addressing the challenges for the industrial application of additive manufacturing: Towards a hybrid solution. Int. J. Lightweight Mater. Manuf. 2018, 1, 157–168. [Google Scholar] [CrossRef]
  36. Gibson, I.; Rosen, D.; Stucker, B. Design for additive manufacturing. In Additive Manufacturing Technologies, 2nd ed.; Springer: New York, NY, USA, 2015; pp. 399–435. [Google Scholar]
  37. Doubrovski, Z.; Verlinden, J.C.; Geraedts, J.M.P. Optimal design for additive manufacturing: Opportunities and challenges. In Proceedings of the 16th Design for Manufacturing and the Life Cycle Conference, Washington, DC, USA, 28–31 August 2011; ASME: New York, NY, USA; pp. 635–646. [Google Scholar]
  38. Yang, S.; Zhao, Y.F. Additive manufacturing-enabled design theory and methodology: A critical review. Int. J. Adv. Manuf. Technol. 2015, 80, 327–342. [Google Scholar] [CrossRef]
  39. Thompson, M.K.; Moroni, G.; Vaneker, T.; Fadel, G.; Campbell, R.I.; Gibson, I.; Bernard, A.; Schulz, J.; Graf, P.; Ahuja, B.; et al. Design for Additive Manufacturing: Trends, opportunities, considerations, and constraints. CIRP Ann. 2016, 65, 737–760. [Google Scholar] [CrossRef] [Green Version]
  40. Wiberg, A.; Persson, J.; Ölvander, J. Design for additive manufacturing–a review of available design methods and software. Rapid Prototyp. J. 2019, 25, 1080–1094. [Google Scholar] [CrossRef] [Green Version]
  41. Plocher, J.; Panesar, A. Review on design and structural optimisation in additive manufacturing: Towards next-generation lightweight structures. Mater. Des. 2019, 183, 108164. [Google Scholar] [CrossRef]
  42. Alfaify, A.; Saleh, M.; Abdullah, F.M.; Al-Ahmari, A.M. Design for additive manufacturing: A systematic review. Sustainability 2020, 12, 7936. [Google Scholar] [CrossRef]
  43. Strong, D.; Kay, M.; Conner, B.; Wakefield, T.; Manogharan, G. Hybrid manufacturing–integrating traditional manufacturers with additive manufacturing (AM) supply chain. Addit. Manuf. 2018, 21, 159–173. [Google Scholar] [CrossRef]
  44. Strong, D.; Kay, M.; Conner, B.; Wakefield, T.; Manogharan, G. Hybrid manufacturing—Locating AM hubs using a two-stage facility location approach. Addit. Manuf. 2019, 25, 469–476. [Google Scholar] [CrossRef]
  45. Verboeket, V.; Khajavi, S.H.; Krikke, H.; Salmi, M.; Holmström, J. Additive manufacturing for localized medical parts production: A case study. IEEE Access 2021, 9, 25818–25834. [Google Scholar] [CrossRef]
  46. Emelogu, A.; Marufuzzaman, M.; Thompson, S.M.; Shamsaei, N.; Bian, L. Additive manufacturing of biomedical implants: A feasibility assessment via supply-chain cost analysis. Addit. Manuf. 2016, 11, 97–113. [Google Scholar] [CrossRef]
  47. Emelogu, A.; Chowdhury, S.; Marufuzzaman, M.; Bian, L. Distributed or centralized? A novel supply chain configuration of additively manufactured biomedical implants for southeastern US States. CIRP J. Manuf. Sci. Technol. 2019, 24, 17–34. [Google Scholar] [CrossRef]
  48. Chowdhury, S.; Francis, J.; Marufuzzaman, M.; Bian, L. Supply chain cost analysis for additively manufactured biomedical implants. Int. J. Syst. Sci. Oper. Logist. 2020, 7, 275–290. [Google Scholar] [CrossRef]
  49. Chowdhury, S.; Shahvari, O.; Marufuzzaman, M.; Francis, J.; Bian, L. Sustainable design of on-demand supply chain network for additive manufacturing. IISE Trans. 2019, 51, 744–765. [Google Scholar] [CrossRef]
  50. Rinaldi, M.; Caterino, M.; Fera, M.; Manco, P.; Macchiaroli, R. Technology selection in green supply chains-the effects of additive and traditional manufacturing. J. Clean. Prod. 2021, 282, 124554. [Google Scholar] [CrossRef]
  51. Jimo, A.; Braziotis, C.; Rogers, H.; Pawar, K. Additive manufacturing: A framework for supply chain configuration. International J. Prod. Econ. 2022, 253, 108592. [Google Scholar] [CrossRef]
  52. Singh, S.; Prakash, C.; Ramakrishna, S. Three-dimensional printing in the fight against novel virus COVID-19: Technology helping society during an infectious disease pandemic. Technol. Soc. 2020, 62, 101305. [Google Scholar] [CrossRef] [PubMed]
  53. Advincula, R.C.; Dizon, J.R.C.; Chen, Q.; Niu, I.; Chung, J.; Kilpatrick, L.; Newman, R. Additive manufacturing for COVID-19: Devices, materials, prospects, and challenges. MRS Commun. 2020, 10, 413–427. [Google Scholar] [CrossRef] [PubMed]
  54. Choong, Y.Y.C.; Tan, H.W.; Patel, D.C.; Choong, W.T.N.; Chen, C.H.; Low, H.Y.; Tan, M.J.; Patel, C.D.; Chua, C.K. The global rise of 3D printing during the COVID-19 pandemic. Nat. Rev. Mater. 2020, 5, 637–639. [Google Scholar] [CrossRef]
  55. Larrañeta, E.; Dominguez-Robles, J.; Lamprou, D.A. Additive manufacturing can assist in the fight against COVID-19 and other pandemics and impact on the global supply chain. 3d Print. Addit. Manuf. 2020, 7, 100–103. [Google Scholar] [CrossRef]
  56. Vordos, N.; Gkika, D.A.; Maliaris, G.; Tilkeridis, K.E.; Antoniou, A.; Bandekas, D.V.; Mitropoulos, A.C. How 3D printing and social media tackles the PPE shortage during COVID-19 pandemic. Saf. Sci. 2020, 130, 104870. [Google Scholar] [CrossRef] [PubMed]
  57. AMCPR—Assessing the Role of Additive Manufacturing in Support of the U.S. COVID-19 Response. Available online: https://www.americamakes.us/wp-content/uploads/2021/12/Full-Report-Assessing-the-Role-of-AM-in-Support-of-the-US-COVID-19-Response.pdf (accessed on 27 July 2022).
  58. Colorado, H.A.; Mendoza, D.E.; Lin, H.T.; Gutierrez-Velasquez, E. Additive manufacturing against the Covid-19 pandemic: A technological model for the adaptability and networking. J. Mater. Res. Technol. 2021, 16, 1150. [Google Scholar] [CrossRef] [PubMed]
  59. Davies, S.; O’Connor, D.; Griffiths, L. The Latest 3D Printing Efforts against COVID-19. Available online: https://www.tctmagazine.com/additive-manufacturing-3d-printing-news/live-blog-how-the-3d-printing-industry-fighting-covid-19/ (accessed on 25 July 2022).
  60. Equbal, A.; Akhter, S.; Sood, A.K.; Equbal, I. The usefulness of additive manufacturing (AM) in COVID-19. Ann. 3d Print. Med. 2021, 2, 100013. [Google Scholar] [CrossRef]
  61. Tarfaoui, M.; Nachtane, M.; Goda, I.; Qureshi, Y.; Benyahia, H. Additive manufacturing in fighting against novel coronavirus COVID-19. Int. J. Adv. Manuf. Technol. 2020, 110, 2913–2927. [Google Scholar] [CrossRef]
  62. Naghshineh, B.; Carvalho, H. The implications of additive manufacturing technology adoption for supply chain resilience: A systematic search and review. Int. J. Prod. Econ. 2021, 247, 108387. [Google Scholar] [CrossRef]
  63. Bharti, N.; Singh, S. COVID-19: The use of 3D printing to address PPE shortage during a pandemic—A safety perspective. ACS Chem. Health Saf. 2020, 27.6, 335–340. [Google Scholar] [CrossRef] [PubMed]
  64. Pearce, J.M. Distributed manufacturing of open source medical hardware for pandemics. J. Manuf. Mater. Processing 2020, 4, 49. [Google Scholar] [CrossRef]
  65. Clifton, W.; Damon, A.; Martin, A.K. Considerations and cautions for three-dimensional-printed personal protective equipment in the COVID-19 crisis. 3d Print. Addit. Manuf. 2020, 7, 97–99. [Google Scholar] [CrossRef]
  66. Novak, J.I.; Loy, J. A quantitative analysis of 3D printed face shields and masks during COVID-19. Emerald Open Res. 2020, 2, 42. [Google Scholar] [CrossRef]
  67. Amin, D.; Nguyen, N.; Roser, S.M.; Abramowicz, S. 3D printing of face shields during COVID-19 pandemic: A technical note. J. Oral Maxillofac. Surg. 2020, 78, 1275–1278. [Google Scholar] [CrossRef] [PubMed]
  68. Armijo, P.R.; Markin, N.W.; Nguyen, S.; Ho, D.H.; Horseman, T.S.; Lisco, S.J.; Schiller, A.M. 3D printing of face shields to meet the immediate need for PPE in an anesthesiology department during the COVID-19 pandemic. Am. J. Infect. Control. 2021, 49, 302–308. [Google Scholar] [CrossRef] [PubMed]
  69. Lemarteleur, V.; Fouquet, V.; Le Goff, S.; Tapie, L.; Morenton, P.; Benoit, A.; Vennat, E.; Zamansky, B.; Guilbert, T.; Depil-Duval, A.; et al. 3D-printed protected face shields for health care workers in Covid-19 pandemic. Am. J. Infect. Control. 2021, 49, 389–391. [Google Scholar] [CrossRef]
  70. Neijhoft, J.; Viertmann, T.; Meier, S.; Söhling, N.; Wicker, S.; Henrich, D.; Marzi, I. Manufacturing and supply of face shields in hospital operation in case of unclear and confirmed COVID-19 infection status of patients. Eur. J. Trauma Emerg. Surg. 2020, 46, 743–745. [Google Scholar] [CrossRef]
  71. Celik, H.K.; Kose, O.; Ulmeanu, M.E.; Rennie, A.E.; Abram, T.N.; Akinci, I. Design and additive manufacturing of medical face shield for healthcare workers battling coronavirus (COVID-19). Int. J. Bioprinting 2020, 6, 286. [Google Scholar] [CrossRef] [PubMed]
  72. Lindsley, W.G.; Noti, J.D.; Blachere, F.M.; Szalajda, J.V.; Beezhold, D.H. Efficacy of face shields against cough aerosol droplets from a cough simulator. J. Occup. Environ. Hyg. 2014, 11, 509–518. [Google Scholar] [CrossRef] [PubMed]
  73. Salimnia, H.; Meyer, M.P.; Mitchell, R.; Fairfax, M.R.; Gundel, A.; Guru, N.; Chopra, T. A laboratory model demonstrating the protective effects of surgical masks, face shields, and a combination of both in a speaking simulation. Am. J. Infect. Control. 2021, 49, 409–415. [Google Scholar] [CrossRef] [PubMed]
  74. Swennen, G.R.; Pottel, L.; Haers, P.E. Custom-made 3D-printed face masks in case of pandemic crisis situations with a lack of commercially available FFP2/3 masks. Int. J. Oral Maxillofac. Surg. 2020, 49, 673–677. [Google Scholar] [CrossRef] [PubMed]
  75. Cai, M.; Li, H.; Shen, S.; Wang, Y.; Yang, Q. Customized design and 3D printing of face seal for an N95 filtering facepiece respirator. J. Occup. Environ. Hyg. 2018, 15, 226–234. [Google Scholar] [CrossRef]
  76. Piombino, P.; Committeri, U.; Norino, G.; Vaira, L.A.; Troise, S.; Maglitto, F.; Mariniello, D.; De Riu, G.; Califano, L. Facing COVID-19 pandemic: Development of custom-made face mask with rapid prototyping system. J. Infect. Dev. Countries 2021, 15, 51–57. [Google Scholar] [CrossRef]
  77. Thomas, C.N.; Schroder, L.K.; Cole, P.A. Ten days to implementation of 3D-printed masks for a level-I orthopaedic trauma practice during the COVID-19 pandemic. JBJS 2020, 102, e95. [Google Scholar] [CrossRef]
  78. Tino, R.; Moore, R.; Antoline, S.; Ravi, P.; Wake, N.; Ionita, C.N.; Morris, J.M.; Decker, S.J.; Sheikh, A.; Rybicki, F.J.; et al. COVID-19 and the role of 3D printing in medicine. 3d Print. Med. 2020, 6, 1–8. [Google Scholar] [CrossRef] [Green Version]
  79. Moretti, F. MY FACE MASK: 3D Printed Face Mask with a Replaceable Filter. Available online: https://www.3dwasp.com/en/3d-printed-mask-from-3d-scanning/ (accessed on 25 July 2022).
  80. Arezki, A.; Melega, T.; Nussbaum, J. A Mask for All. Available online: https://www.amaskforall.com/index.html (accessed on 25 July 2022).
  81. Longhitano, G.A.; Nunes, G.B.; Candido, G.; da Silva, J.V.L. The role of 3D printing during COVID-19 pandemic: A review. Prog. Addit. Manuf. 2021, 6, 19–37. [Google Scholar] [CrossRef]
  82. Gierthmuehlen, M.; Kuhlenkoetter, B.; Parpaley, Y.; Gierthmuehlen, S.; Köhler, D.; Dellweg, D. Evaluation and discussion of handmade face-masks and commercial diving-equipment as personal protection in pandemic scenarios. PLoS ONE 2020, 15, e0237899. [Google Scholar] [CrossRef] [PubMed]
  83. Bezek, L.B.; Pan, J.; Harb, C.; Zawaski, C.E.; Molla, B.; Kubalak, J.R.; Marr, L.C.; Williams, C.B. Additively manufactured respirators: Quantifying particle transmission and identifying system-level challenges for improving filtration efficiency. J. Manuf. Syst. 2021, 60, 762–773. [Google Scholar] [CrossRef] [PubMed]
  84. WHO—Mask Use in the Context of COVID-19. Available online: https://www.who.int/publications/i/item/advice-on-the-use-of-masks-in-the-community-during-home-care-and-in-healthcare-settings-in-the-context-of-the-novel-coronavirus-(2019-ncov)-outbreak (accessed on 26 July 2022).
  85. FDA—3D Printing of Medical Devices, Accessories, Components, and Parts during the COVID-19 Pandemic. Available online: https://www.fda.gov/medical-devices/coronavirus-covid-19-and-medical-devices/3d-printing-medical-devices-accessories-components-and-parts-during-covid-19-pandemic (accessed on 26 July 2022).
  86. Stratasys—Materials Catalogue, Polyjet Biocompatible Materials. Available online: https://www.stratasys.com/materials/search/biocompatible (accessed on 26 July 2022).
  87. Vourvoulakis, J.; Bilalis, L. Real-time pulse oximetry extraction using a lightweight algorithm and a task pipeline scheme. In Proceedings of the 10th International Conference on Modern Circuits and Systems Technologies (MOCAST), Thessaloniki, Greece, 5–7 July 2021; IEEE: Piscataway, NJ, USA. [Google Scholar]
  88. Ruffo, M.; Tuck, C.; Hague, R. Cost estimation for rapid manufacturing-laser sintering production for low to medium volumes. Proc. Inst. Mech. Eng. Part B J. Eng. Manuf. 2006, 220, 1417–1427. [Google Scholar] [CrossRef] [Green Version]
  89. Lindermann, C.; Jahnke, U.; Moi, M.; Koch, R. Analyzing product lifecycle costs for a better understanding of cost drivers in additive manufacturing. In Proceedings of the 2012 International Solid Freeform Fabrication Symposium, Austin, TX, USA, 6–8 August 2012; Beaman, J., Bourell, D., Crawford, R., Marcus, H., Conner Seepersad, C., Eds.; University of Texas at Austin: Austin, TX, USA, 2012; pp. 177–188. [Google Scholar]
  90. Rickenbacher, L.; Spierings, A.; Wegener, K. An integrated cost-model for selective laser melting (SLM). Rapid Prototyp. J. 2013, 19, 208–214. [Google Scholar] [CrossRef]
  91. Schröder, M.; Falk, B.; Schmitt, R. Evaluation of cost structures of additive manufacturing processes using a new business model. Procedia CIRP 2015, 30, 311–316. [Google Scholar] [CrossRef] [Green Version]
  92. Thomas, D.S.; Gilbert, S.W. Costs and cost effectiveness of additive manufacturing. NIST Spec. Publ. 2014, 1176, 12. [Google Scholar]
  93. Baumers, M.; Dickens, P.; Tuck, C.; Hague, R. The cost of additive manufacturing: Machine productivity, economies of scale and technology-push. Technol. Forecast. Soc. Change 2016, 102, 193–201. [Google Scholar] [CrossRef]
  94. Charalambis, A.; Davoudinejad, A.; Tosello, G.; Pedersen, D.B. Cost estimation of a specifically designed direct light processing (DLP) additive manufacturing machine for precision printing. In Proceedings of the 17th EUSPEN International Conference & Exhibition, Hannover, Germany, 29 May–2 June 2017; Bosse, H., Denkena, B., Dröder, K., Hoffmeister, H.-W., Eds.; EUSPEN: Hannover, Germany, 2017. [Google Scholar]
  95. Costabile, G.; Fera, M.; Fruggiero, F.; Lambiase, A.; Pham, D. Cost models of additive manufacturing: A literature review. Int. J. Ind. Eng. Comput. 2017, 8, 263–283. [Google Scholar] [CrossRef]
  96. Tosello, G.; Charalambis, A.; Kerbache, L.; Mischkot, M.; Pedersen, D.B.; Calaon, M.; Hansen, H.N. Value chain and production cost optimization by integrating additive manufacturing in injection molding process chain. Int. J. Adv. Manuf. Technol. 2019, 100, 783–795. [Google Scholar] [CrossRef] [Green Version]
  97. Ding, J.; Baumers, M.; Clark, E.A.; Wildman, R.D. The economics of additive manufacturing: Towards a general cost model including process failure. Int. J. Prod. Econ. 2021, 237, 108087. [Google Scholar] [CrossRef]
  98. Stratasys—J5 series User Guide. Available online: https://support.stratasys.com/SupportCenter/HTML5UserGuides/J5-Series_UG_Jul_2022/Content/3_Topics_Introducing/Electrical%20Specifications.htm?Highlight=power%20consumption (accessed on 25 July 2022).
  99. Klose, A.; Drexl, A. Facility location models for distribution system design. Eur. J. Oper. Res. 2005, 162, 4–29. [Google Scholar] [CrossRef]
  100. Melo, M.T.; Nickel, S.; Saldanha-Da-Gama, F. Facility location and supply chain management–A review. Eur. J. Oper. Res. 2009, 196.2, 401–412. [Google Scholar] [CrossRef]
  101. Ballou, R.H. Business Logistics/Supply Chain Management: Planning, Organizing, and Controlling the Supply Chain, 5th ed.; Pearson: Upper Saddle River, NJ, USA, 2004. [Google Scholar]
  102. Daskin, M.S.; Maass, K.L. The p-median problem. In Location Science; Laporte, G., Nickel, S., Saldanha da Gama, F., Eds.; Springer: Cham, Switzerland, 2015; pp. 21–45. [Google Scholar]
Figure 1. Schematic representation of the basic mask components and assembly.
Jmmp 06 00126 g001
Figure 2. The four phases of the mask production process.
Jmmp 06 00126 g002
Figure 3. Face modeling process: Face scanning and mesh model processing (top), and export in STL form.
Jmmp 06 00126 g003
Figure 4. Virtual models of two male (left) and two female (right) individuals.
Jmmp 06 00126 g004
Figure 5. Construction of boundary curves and surfaces for the face flange and the main body.
Jmmp 06 00126 g005
Figure 6. Valves fabricated with different combinations of two base materials to achieve different levels of hardness.
Jmmp 06 00126 g006
Figure 7. Assembly of the exhaust valve, main filter, and the corresponding covers on the main body.
Jmmp 06 00126 g007
Figure 8. Photographs of the employed visual display device during testing (left) and assembled on the mask (right).
Jmmp 06 00126 g008
Figure 9. CAD representations of the mask equipped with the three adaptors (left to right): the general-purpose adaptor, the hydrophobic membrane filter adaptor, and the particulate filter adaptor.
Jmmp 06 00126 g009
Figure 10. Screenshot of the machine tray layout, as generated by the process planning software.
Jmmp 06 00126 g010
Figure 11. Map showing the location and identification number of the hospitals considered in the present study.
Jmmp 06 00126 g011
Table 1. Assigned material per mask component.
ComponentMaterial
Face FlangeMED625FLX
Inner FlangeMED625FLX
Main BodyMED610
AdaptorsMED610
Adaptor for 3M FilterMED610
Front Valve CoverMED610
Flexible Valve LeafMED625FLX
Front adaptor flangeMED625FLX
Flange for exhaust ventMED625FLX
Table 2. Build time and material costs for various tray layout configurations.
Number of Parts per JobJob Build Time (h)Build Time per Part (h)Job Materials Cost (€)Materials Cost per Part (€)
123.523.50101101
22613.0016482
3268.6722575
4266.5028872
5265.2034068
6264.3338464
Table 3. Cost analysis for different system configurations.
System ConfigurationsABCDEF
Operational period (years)555555
Number of designers/operators122334
Designers/Operators annual salary (€)35,00035,00035,00035,00035,00035,000
Number of MJ machines112233
MJ machine purchase cost (€)100,000100,000100,000100,000100,000100,000
MJ machine annual maintenance cost (€)10,00010,00010,00010,00010,00010,000
Number of 3D scanners111113
3D scanner purchase cost (€)30,00030,00030,00030,00030,00030,000
Number of CAD systems122334
CAD hardware purchase cost (€)200020002000200020002000
CAD software annual license fee (€)100010001000100010001000
Masks per designer and day555555
Overhead (%)20%20%20%20%20%20%
Parts per job666666
Capacity/Throughput
CAD throughput (parts/year)115023002300345034504600
MJ throughput (parts/year)138513852770277041544154
System capacity115013852300277034504154
System Costs
Total machine cost (€)150,000150,000300,000300,000450,000450,000
Total scanner cost (€)30,00030,00030,00030,00030,00090,000
Total CAD equipment cost (€)700014,00014,00021,00021,00028,000
Total labor cost (€)175,000350,000350,000525,000525,000700,000
Total System Costs362,000544,000694,000876,0001,026,0001,268,000
Unit Costs
Machine cost/mask (€)26.0921.6626.0921.6626.0921.67
Scanner cost/mask (€)5.224.332.612.171.744.33
CAD cost/mask (€)1.222.021.221.521.221.35
Labor cost/mask (€)30.4350.5430.4337.9130.4333.70
Material cost/mask (€)64.0064.0064.0064.0064.0064.00
Overhead (€)25.3928.5124.8725.4524.7025.01
Total cost per mask152.35171.07149.22152.70148.17150.06
Table 4. Geographical position and weighting factor of hospitals considered in the study.
HospitalLatitudeLongitudeWeighting Factor
Hospital 138.0723.816.86
Hospital 238.0023.788.35
Hospital 337.9823.765.78
Hospital 437.9823.764.84
Hospital 538.0223.6710.23
Hospital 637.9723.667.12
Hospital 737.9323.655.49
Hospital 838.3021.799.65
Hospital 937.0922.421.27
Hospital 1037.9422.952.14
Hospital 1137.6422.730.45
Hospital 1241.1224.872.18
Hospital 1340.9424.383.80
Hospital 1440.6423.045.52
Hospital 1540.5822.973.18
Hospital 1640.9922.871.82
Hospital 1740.7922.421.27
Hospital 1840.7921.411.53
Hospital 1940.5121.281.40
Hospital 2040.2922.452.34
Hospital 2139.3522.962.92
Hospital 2239.6220.8411.86
Table 5. Optimum locations of mask manufacturing facilities for different distributed manufacturing networks.
Number of FacilitiesFacility LocationServed Hospitals
1Hospital 21–22
2Hospital 21–11
Hospital 1612–22
3Hospital 2 1–2, 5, 8
Hospital 73–4, 6–7, 9–11
Hospital 1612–22
4Hospital 51–2, 5
Hospital 73–4, 6–7, 9–11
Hospital 228, 22
Hospital 161–4, 6, 9–20
5Hospital 51–2, 5
Hospital 73–4, 6–7, 9–11
Hospital 88
Hospital 1612–21
Hospital 2222
Table 6. Cost analysis for different system configurations of a distributed manufacturing system.
System ConfigurationsGHIJ
Number of manufacturing facilities 2345
Designers2455
MJ Systems2345
3D scanners2345
CAD systems2345
Overhead (%)20%20%20%20%
Parts per job3344
Capacity/Throughput
CAD capacity2300460057505750
MJ capacity2770415455396924
System capacity2300415455395750
Actual throughput1385207736924615
Spare Capacity915207718471135
System Costs
Total machine cost (€)300,000450,000600,000750,000
Total scanner cost (€)60,00090,000120,000150,000
Total CAD workstation cost (€)14,00021,00028,00035,000
Total labor cost (€)350,000700,000875,000875,000
Total System Costs (€)724,0001,261,0001,623,0001,810,000
Unit Costs
Machine cost/mask (€)43.3343.3332.5032.50
Scanner cost/mask (€)8.678.676.506.50
CAD cost/mask (€)2.022.021.521.52
Labor cost/mask (€)50.5667.4147.4037.92
Material cost/mask (€)75.0075.0072.0072.00
Overhead (€)35.9239.2931.9830.09
Total cost per mask (€)215.49235.72191.90180.52
Publisher’s Note: MDPI stays neutral with regard to jurisdictional claims in published maps and institutional affiliations.

