Article

In-Process Chatter Detection in Milling: Comparison of the Robustness of Selected Entropy Methods

by
Barbora Hauptfleischová
1,*,
Lukáš Novotný
1,*,
Jiří Falta
1,
Martin Machálka
2 and
Matěj Sulitka
1
1
Department of Production Machines and Equipment (RCMT), Faculty of Mechanical Engineering, Czech Technical University in Prague, 128 00 Prague, Czech Republic
2
TAJMAC-ZPS, a.s., 763 02 Zlín, Czech Republic
*
Authors to whom correspondence should be addressed.
J. Manuf. Mater. Process. 2022, 6(5), 125; https://doi.org/10.3390/jmmp6050125
Submission received: 14 September 2022 / Revised: 14 October 2022 / Accepted: 18 October 2022 / Published: 21 October 2022
(This article belongs to the Special Issue Surface Integrity in Metals Machining)

Abstract

:
This article deals with the issue of online chatter detection during milling. The aim is to achieve a verification of the reliability and robustness of selected methods for the detection of chatter that can be evaluated on the machine tool in real time by using the accelerometer signal. In the introductory part of the paper, an overview of the current state of the art in the field of chatter detection is summarized. Entropic methods have been selected that evaluate the presence of chatter from the qualitative behavior of the signal rather than from the magnitude of its amplitude, because the latter can be affected by the transmission of vibrations to the accelerometer position. Another criterion for selection was the potential for practical implementation in a real-time evaluation of the accelerometer signal, which is nowadays quite commonly installed on machine tools. The robustness of the methods was tested with respect to tool compliance, which affects both chatter occurrence and vibration transfer to the accelerometer location. Therefore, the study was carried out on a slender milling tool with two different overhangs and on a rigid roughing tool. The reference stability assessment for each measurement was based on samples of the machined surface. The signals obtained from the accelerometer were then post-processed and used to calculate the chatter indicators. In this way, it was possible to compare different methods in terms of their ability to achieve reliable in-process detection of chatter and in terms of the computational complexity of the indicator.

1. Introduction

The issue of chatter detection in machining has been a topic in practice for a long time. In practice, the boundary between stable and unstable machining in milling is often visualized by using the stability lobe diagram (SLD). Stability lobe diagrams (SLDs) are usually used to select stable cutting conditions. An experimental methodology for determining SLDs in milling operations is described in [1]. The same main authors also provide a very comprehensive review of the chatter issues, which is presented in [2]. Here, the state of research in the field of self-excited chatter is summarized, including strategies that can be used to achieve stable machining. The paper also includes a review of methods for in-process evaluation of chatter generation. A more recent paper [3] summarizes the chatter issue with a focus on milling technology. It covers topics such as process damping, tool throw, gyroscopic effect, and the importance of these areas in predicting chatter. The article also includes an overview of chatter detection techniques. The most recent review article found that addresses chatter in milling is [4]. According to this article, more than 100 research papers addressing the issue of online chatter detection have been published every year since 2011. The chatter detection topic is also one of the larger chapters covered in detail in [4]. Feature extraction methods play an essential role in the field of real-time chatter detection. The authors of [4] clearly summarize the features in the signal according to the predominant time, frequency, and time-frequency domains and list the features here. In the time domain, the main concern is the computation of statistical indices using raw measured signals.
In the frequency domain, enough data usually needs to be collected first to perform the necessary transformation. The evaluation of chatter can then be based on the knowledge that chatter alters the significant frequencies contained in the signal. The time-frequency domain is often used to extract features from the signal. For example, fast Fourier transform or methods based on wavelet techniques can be employed here. In practice, the idea is to decompose the signal into meaningful parts—components—so that the necessary information (features) can be evaluated from them.
In practice, chatter detection requires the use of signals measured directly on the machine. Usually these are signals from accelerometers. Cutting force signals from dynamometers or acoustic emission signals are less common in practice. This may be due, among other reasons, to the cost of these sensors and their lower versatility. In the research sphere, however, a relatively large number of scientific papers deal with force as an input signal, for example, [5,6,7,8]. The microphone signal is used even less frequently (e.g., in [9]). Less frequent also are current signals from motors (e.g., [10]), torque-force combinations (e.g., [11]) and other types of signals. A very interesting approach is presented in [12] wherein the authors work with cutting force estimation by using an observer based on a drive model where relevant signals from the machine axis drive are the input. The use of actuator signals can be complicated by the closed-loop nature of the control system or the problem of accessing fast high-frequency data. However, if available, signals from electric actuators can be an interesting alternative or complement to signals from accelerometers, which is addressed in papers such as [10,13]. The paper [10] uses a stable/unstable milling support vector machine (SVM) to evaluate the states. It is a machine learning method that is based on the analysis of the electrical signal from the spindle and the use of neural networks. However, the current signal is not obtained directly from the machine system but using Hall sensors on all phases of the spindle. The paper [13] relies on the information available in the CNC machine at high clock speed to utilize the spindle current signal. The signal is transmitted in real time via a digital interface to an external PC, where chatter evaluation is addressed by using frequency detection in the spectrum. Despite the use of an external PC, the described method has a certain potential for practical application. For any detection method to be used in practice, it needs to be deployed on a suitable platform, which can be, for example, the NI cRIO platform. Such a system can be similar to the one described in [14].
However, the most commonly used sensors in chatter detection are probably accelerometers despite some inferior characteristics (noise etc.). These also seem to have the highest potential for application in practice. The installation of accelerometers is becoming increasingly common [4]. These sensors are generally more affordable and reliable and their installation can be noninvasive. Accelerometers find applications in other areas such as machine tool quality improvement. This area is dealt with, for example, in [15], where the authors describe various sensing technologies that are applicable to the area of predictive maintenance, which is dealt with by one of the world’s leading machine tool manufacturers (DMG MORI). The authors follow up this paper with [16], where the accelerometer signal is used for multiple functions at the same time—both for evaluating chatter information and for machine tool condition monitoring for predictive maintenance. An overview of usable sensors is quite comprehensively covered in an article focusing on intelligent spindles [17]. A summary of the possibilities of measurement, signal processing, and chatter evaluation in milling and turning is also summarized in [18].
The processing and evaluation of chatter from the measured input signals can occur either online on the machine, or afterward with delay, or offline. The results can be used, for example, to achieve a stable cutting process by changing its parameters. The methods that have the greatest potential for practical application are those that can be deployed online on the machine in milling by using built-in acceleration sensors. These methods will be given more attention below.
An interesting method for real-time chatter detection in milling is presented in [19]. It is based on the calculation of a chatter indicator based on cyclostationary theory. The calculation involves a signal from a three-axis accelerometer and additional information from an encoder about the spindle rotation. The presented approach is suitable for both constant speed machining (CSM) and spindle speed variation (SSV) machining. The results were verified on the machine under different cutting conditions. Another paper that focuses directly on online chatter detection in milling is [20]. The authors first remove periodic components from the input signals and then work with an advanced spectral analysis technique called subspace-based spectral estimation, “which can obtain superhigh frequency resolution with a small number of data samples”. They also introduce a “Normalized cyclostationary Energy Ration chatter indicator” (NER) for the chatter evaluation. The authors measure both acceleration and force in their experiments. For the chatter detection alone, they only rely on the acceleration signal for better application in engineering practice. The appropriate chatter detection is not only important for process optimization but also for machine tool performance testing. The authors of [21] presented a method for operational machine tool testing where chatter is identified by using a combined criterion of harmonic dominant frequency, vibration amplitude in the frequency spectrum, and workpiece surface quality.
Another series of papers use the empirical mode decomposition (EMD) method or its more advanced variant, ensemble empirical mode decomposition (EEMD) for signal processing. These methods are generally designed for chatter detection in the signal, but are not directly designed for online detection. For real-time use, some types of chatter indicator are then considered for computation. For example, the authors of [22] use the EEMD method, but for real-time evaluation only the described “nonlinear dimensionless indicators” are considered. A very extensive work is presented in [23]. The presented approach to chatter detection in milling uses energy aggregation-based Hilbert–Huang transform (HHT). In the described method, EMD (or EEMD) is performed first, followed by Hilbert spectral analysis (HSA). Chatter indicators are again introduced to evaluate the chatter online, here it is the “Normalized Energy Ratio of the Most Powerful IMF”, NER, and again the indicator CV—Coefficient of Variation of the energy-limited Hilbert–Huang spectrum. A similar approach was taken by the authors of [24]. Another paper [25] uses p-leader multifractal features for online chatter detection. Interestingly, the paper compares it with other methods such as EEMD itself, but it cannot be directly used for real-time detection.
Another approach for chatter detection in milling is described in [26]. The authors propose using a power spectral entropy (∆PSE) indicator. The variational mode decomposition (VMD) method is used to separate the signal components in which chatter is to be detected. The authors mention the small endpoint effect and less mode mixing as the main advantage of VMD over EMD/EEMD. A similar approach was previously taken by the authors of [27], when they computed the “energy entropy” as an indicator from signals that were previously decomposed by VMD and wavelet packet decomposition (WPD) techniques. The authors describe the method as excellent performance, but also note that the choice of basis functions (wavelet) still requires some expertise to achieve good results. In this case, the authors do not explicitly mention the use of their results for online detection. Methods that are based on the calculation of signal entropy can generally have great potential for practical application. By using them, numerical indicators that can indicate chatter can apparently be calculated in real-time without large demands on computing power. Among the other methods found, mention can be made of the coarse-grained entropy rate (CER), which was presented in [28] and further applied to the case of turning in [29] and milling in [30]. Another potentially interesting one is the numerical indicator calculated by the Rényi entropy method [31], which works with data in the frequency domain. As the last of the list, the paper [32] will be mentioned here, which uses the power spectral entropy (PSE) calculation, which is still combined with the standard deviation (SD) and fractal dimension (FD) criteria into one “multi-indicator” criterion.
A specific approach is presented by works that use machine learning-based methods for chatter detection. The paper [9] works with hybrid machine learning techniques. “The custom machine learning architecture is deployed in parallel with a physics-based method to improve the robustness of online chatter detection”. The authors mention that it is possible to work with signals from microphones or accelerometers. They use the microphone signal in their tests. The chatter detection itself is based on energy. However, the authors of the paper [33] make some improvements and declare very high reliability of chatter detection.
To conclude the review, it can be stated that methods that can be deployed online on the machine by using built-in acceleration sensors have probably the greatest potential for practical application. In particular, approaches that are based on a type of MRA (multiresolution analysis) method and then use a type of chatter indicator in real time can be considered promising.
The aim of this paper is to verify the applicability of selected methods for in-process detection of chatter during milling from a machine-mounted accelerometer. The selection of the methods considered the fact that the accelerometer position and the dynamics of the machine, tool, and workpiece affect the measured vibration amplitudes. Therefore, entropic methods were selected that evaluate the qualitative behavior (degree of disorder) of the signal rather than its amplitude. Due to the aforementioned effects of dynamics on the transmission of vibration from the cut to the accelerometer location, the robustness of the methods was tested by using different tool types—a compliant slender tool and a rigid tool. Because one of the methods also used fractal dimension and standard deviation as chatter indicators, these indicators were included in the comparison. The results presented in this paper allow a relative comparison of the selected chatter indicators in terms of their ability to detect unstable machining and in terms of their computational complexity for practical implementation on the machine tool.
The article is organized as follows. First, the selected methods for chatter identification will be presented and compared in Section 2. For each method, its mathematical description and the specific conditions under which the method was applied by the authors of this paper will be given. In Section 3, a description of the experiments that were performed with different tools and cutting conditions will be given. The aim is to distinguish whether there is sufficient transfer of vibration to a location where it is practical to place the accelerometer even if the vibration occurs dominantly on a compliant instrument. Therefore, measurements were made on both a compliant slender end mill as well as a rigid shoulder mill. In these experiments, accelerometer data was acquired for later offline processing and a classification of the machining stability was performed by the machine operator. This evaluation considered mainly the resulting surface quality. To complement this, a comparison was made with the stability predicted from the measured FRFs on the tool and the cutting coefficients for steel. In Section 4, sample experimental data are selected for each type of experiment, from which individual chatter indicators are then computed. This way, the selected methods can be compared in an illustrative way. The results of the methods are confronted with the evaluation of the machine operator. The results of this comparison are discussed in detail in Section 5.

2. Selected Methods for Chatter Identification

Three different methods for identifying chatter chosen from the literature are briefly introduced in this section. Coarse-grained entropy rate [28] is an example of a time-domain method, Rényi entropy [29] analyzes the frequency-domain, and the multi-indicator method [31] considers both, as it comprises three separate indicators. All these methods are described in the respective papers as being suitable for industry use.
The parameters for the application of each method in further sections of this paper are given after a short theoretical description. For further details of the definitions, see the respective reference articles.

2.1. Coarse-Grained Entropy Rate (CER)

2.1.1. CER Definition

The first method chosen for comparison is the coarse-grained entropy rate (CER) introduced theoretically in [28]. In [29], CER is presented as a chatter indicator in case of turning on a lathe with increasing cutting depth and turning frequency. The authors analyzed the experiment time series from three-axis dynamometer with a sampling frequency of 5 kHz. They identified a fixed threshold value of 0.2, independent of the cutting conditions, meaning that if CER is lower than this value, the machining is unstable and chatter appears. The method is said to be ready for industry application even though it was used on offline data.
Let us denote z t the signal values measured in discrete time samples t and define random variables
X i t = z t i 1 τ ,   i = 1 ,   , m ,
for a fixed time delay τ and a fixed parameter m . The marginal redundancy, i.e., a measure of the average information about the last variable X m = z t + m 1 τ in the previous m 1 variables, is then defined as
R X 1 , , X m 1 | X m = x 1 x m p x 1 , , x m log p x 1 , , x m p x 1 , , x m 1 p x m   ,
where p is the probability distribution function.
As stated in [29], for a stationary dynamical process, these marginal redundancies are functions only of the dimension m and of the time delay τ , not of the time itself. Therefore, it is possible to write
R m , τ = R ( z t ,   z t + τ , ,   z ( t + m 2 τ | z t + m 1 τ ) ,
and
R m = τ = τ 0 τ m a x R m , τ τ m a x τ 0 .
Then we can define the coarse-grained entropy rate (CER) used as a chatter indicator as
C E R = R m , τ 0 R m R m τ m a x .
Due to the normalization by τ m a x , the value of CER is in the interval 0 , 1 . Lower values indicate deterministic and predictable processes, while greater values of CER mean random processes.
In nonstationary parts of the signal, such as the start of cutting, the indicator might be unreliable as it was derived for a stationary signal. However, from experience these changes are usually fast, so if we choose a rather short time series to be analyzed in each step, these transition uncertainties should not propagate too far.
On the other hand, this time series must be also long enough to capture the cutting dynamics. The choice of the number of points in a time series, N , depends also on other parameters. In [29], a comparison of CER values for different numbers of points N and for different maximum time delays τ m a x is made for a fixed number of marginal equiquantization bins Q = 4 , used to compute the probability functions, parameter m = 2 , and minimum time lag τ 0 = 0 . In [28], they state that this relation should hold:
N m 1 τ m a x Q m + 1 .  

2.1.2. Choice of Parameters

Based on this relation, the discussion from [29], and on the sampling frequency 32.768 kHz of accelerometer data from our experiment, we chose the parameters values Q = 4 , m = 4 , N = 6553 (i.e., time interval length 0.2   s ), τ 0 = 0 and τ m a x = 30 in units of sampling time.

2.2. Rényi Entropy (RE)

2.2.1. Rényi Entropy Definition

Another method chosen for this comparison is frequency-domain Rényi entropy as introduced in [31]. It was applied to force data measured by a dynamometer with 20 kHz sampling frequency. The milling experiments were conducted with various spindle speed settings and continuously decreasing axial cutting depth. Coolant was used. The authors showed that Rényi entropy performed better in comparison with the more widely used Shannon entropy. Moreover, apart from the time series length, no additional parameters need to be chosen, which makes the method more robust and easier to use.
To calculate the Rényi entropy indicator, the spectrum of the time series is computed first by using FFT with the Hanning window. Only half of the symmetric spectrum is used. The spectral lines corresponding to the tooth passing frequency and its two neighboring harmonics are set to 0. Then the amplitude spectrum sequence Y i is normalized to have a sum equal to 1,
β i = Y i j = 1 [ N / 2 ] Y j .
The Rényi entropy is then
H α = 1 1 α   log 2 β i α β i = 1 1 α log 2 β i α ,   α > 0 ,   α 1 .

2.2.2. Choice of Parameters

According to [31], we choose α = 3 and normalize the entropy so that its value lies in interval 0 , 1 and is independent of the time series length N :
R E = H 3 log 2 [ N / 2 ]
It only remains to set the time series length. The authors chose 0.2 s as a compromise that requires reasonable computing time and its spectral resolution is still sufficient. We kept this value even though our sampling frequency is higher. It is still fast enough to be applied in real-time on the machine; however, we use only offline data, as was done also in [31].
In [31], no fixed threshold is given to identify chatter. It is only stated that with the occurrence of chatter, the frequency-domain Rényi entropy significantly decreases.

2.3. Standard Deviation (SD), Fractal Dimension (FD), and Power Spectral Entropy (PSE)

2.3.1. Multi-Indicators Introduction

In [32], three indicators were considered together in order to identify chatter more precisely. The authors state that the standard deviation reflects the changes in signal energy and amplitude in the time domain, so its value should be higher in the case of chatter. Fractal dimension increases with the increase of signal fragmentation, which is said to be another typical characteristic of chatter. Lastly, power spectral entropy describes the distribution of the signal frequencies, so it should capture the concentration of frequency components at the chatter frequencies, and thus decrease with the onset of chatter.
Before the computation of these indicators, the signal sample is decomposed to intrinsic mode functions (IMFs) by an improved empirical mode decomposition method (improved EMD) as described in [32]. The modification of the standard EMD eliminates mode mixing that is considered as the main problem of this decomposition. Then the sum of the three most significant IMFs, i.e., the IMFs with the highest relative energy compared to the original signal sample, are taken to create a new signal sample, which should thus contain only the important information and be filtered from noise.
The authors then take the indicators computed for this new signal as characteristic vectors in 3D space, train a support vector machine model (SVM), and claim that chatter can be identified with this method online on the machine tool without any human intervention.

2.3.2. Choice of Parameters

In this paper, the SVM model is not considered, the aim is simply to assess each indicator’s ability to identify chatter independently and compare it with other methods.
In [32], the method is presented on the accelerometer data from several milling experiments with both constant and increasing radial cutting depth. The sampling frequency used in [32] is 5120 Hz. The minimum length of a time series segment is set as 150 points, but it is not explicitly stated what length is actually used for the results in the paper.
The sampling frequency of the signal used for testing of this method in the following section is 32.768 kHz. The time interval of 0.2 s remains the same. The number of points is 6553, as it satisfies this condition and it is the same as for the other methods.

3. Experimental Setup and Measurement

The aim of the experimental validation of the identification algorithms is to test their reliability and performance on signals from the accelerometer on the spindle. This placement is chosen because it is relatively close to the process, but at the same time at a close distance, so that the method can be applied in normal working operation.
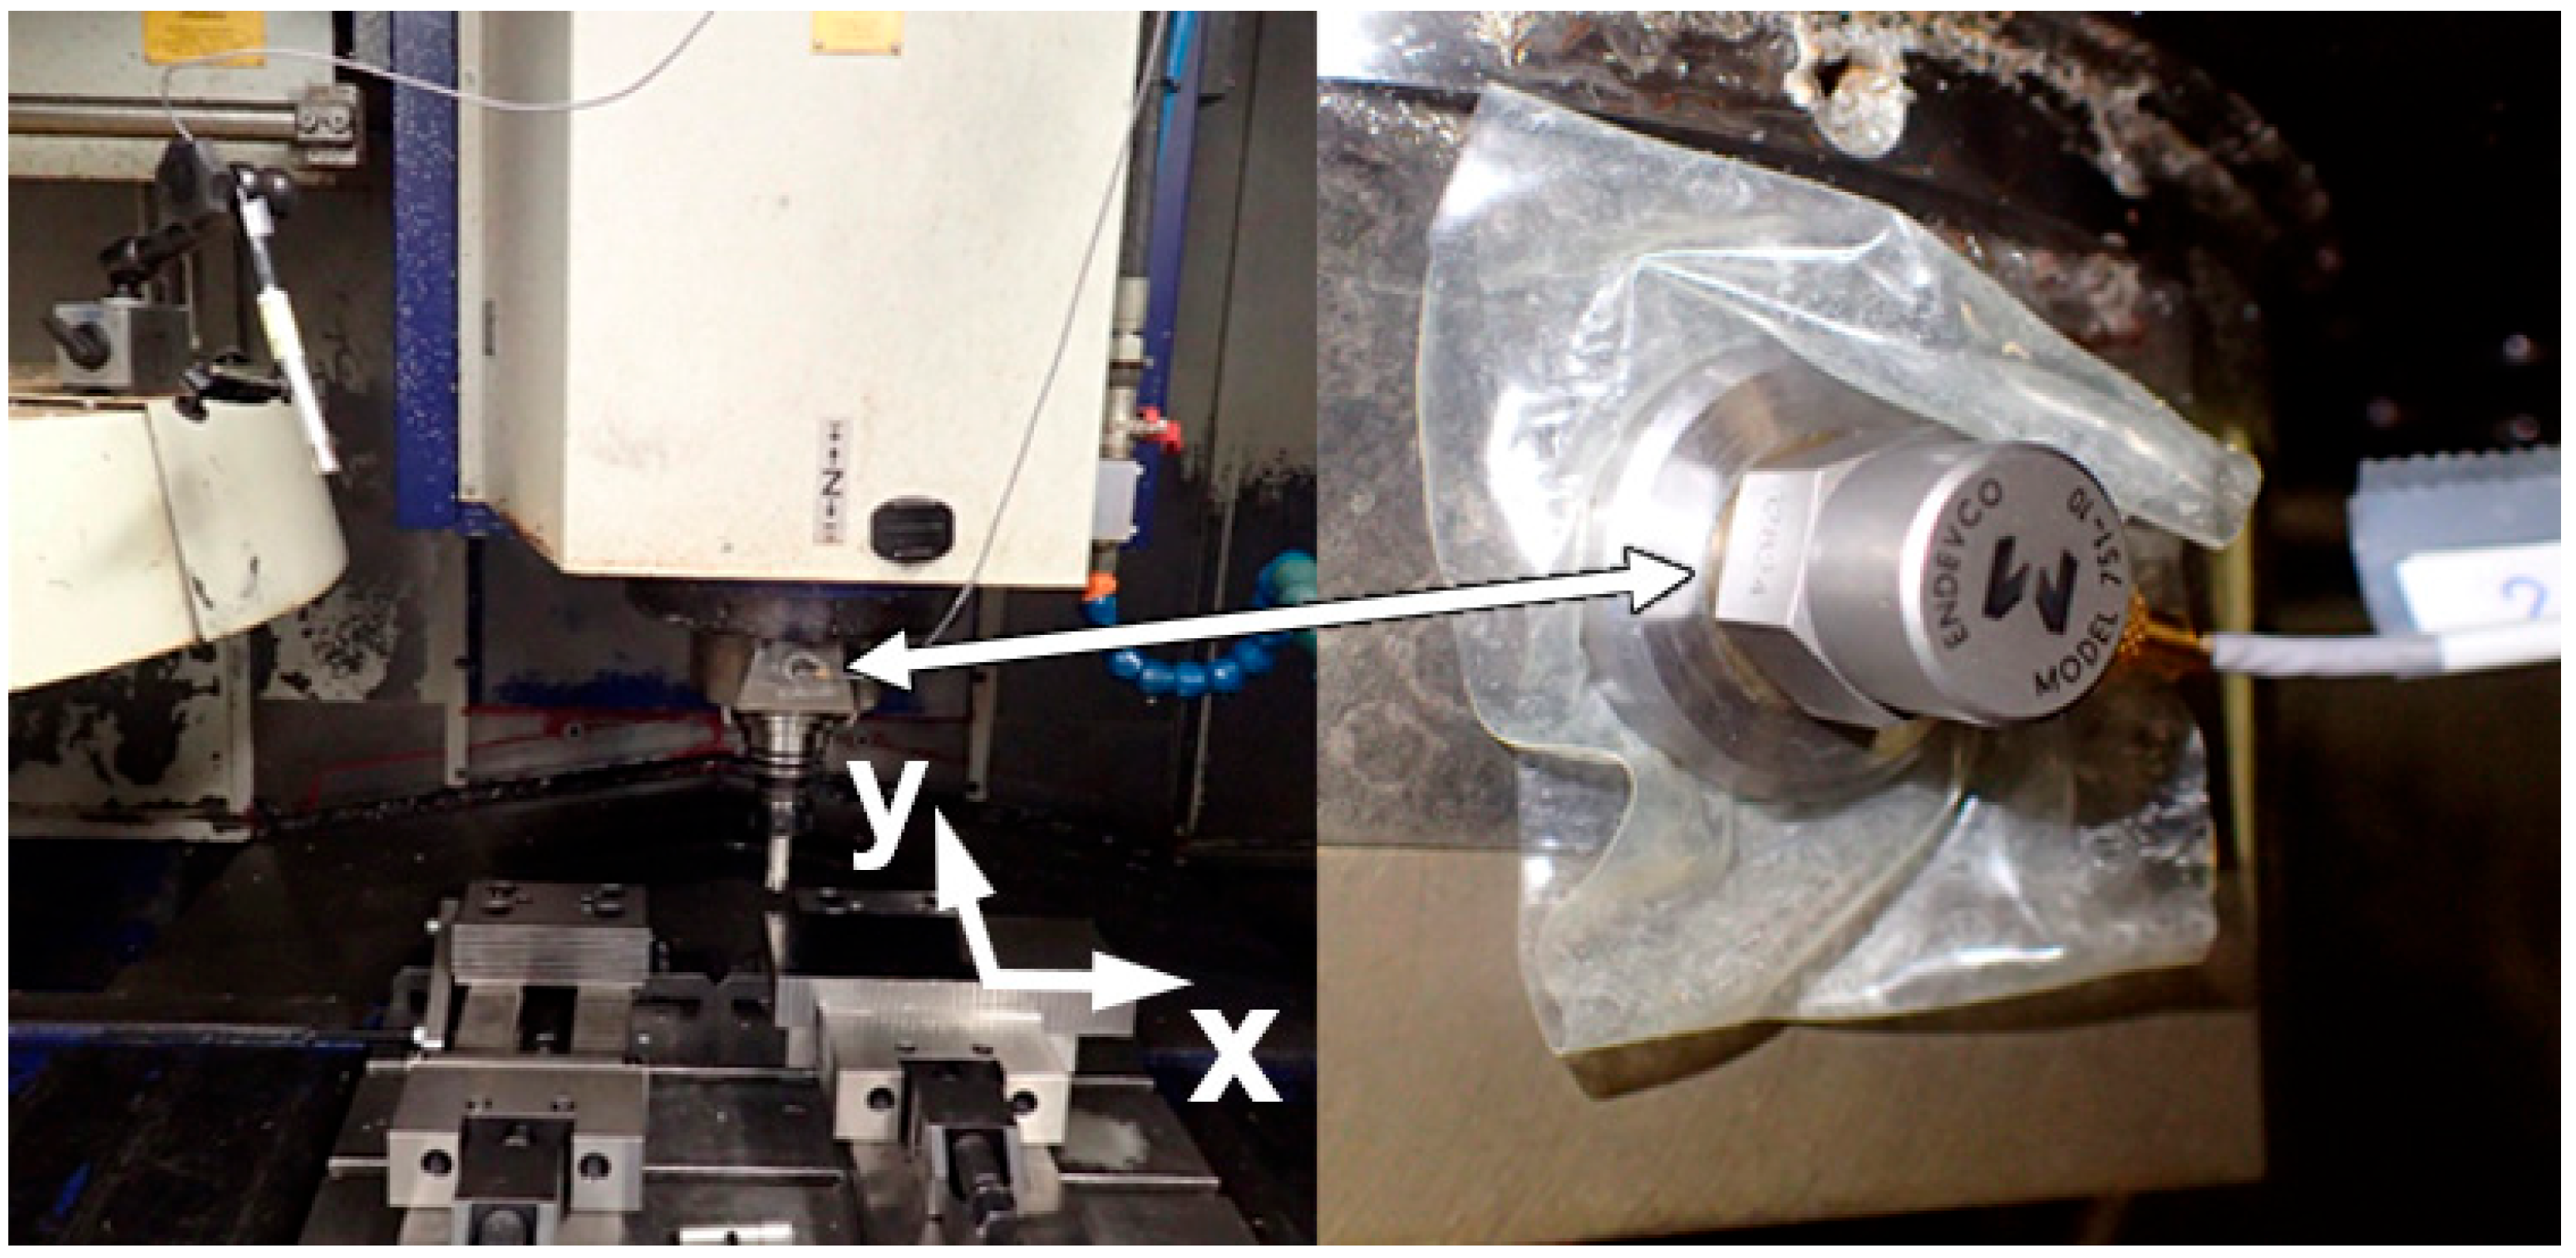
The milling tests were carried out on a three-axis CNC milling machine tool MCFV 5050 LN to test the real-time reliability of chatter identification. The setup is shown in Figure 1. First, the dynamic compliance of the clamped tool was measured in two mutually perpendicular X and Y directions. Technological tests were performed to find the stability limit. Then, several technological tests with various cutting conditions were performed to provide examples of stable and unstable machining. During these tests, the spindle unit vibration was measured by means of a uniaxial accelerometer in the Y-axis direction. The feed in the tests was in the Y-axis direction.
A basic summary of the performed experiments with information of used cutting tools and operations is presented in Table 1. Each experiment consists of multiple tests with various cutting conditions, a detailed description is given in Table A1. The tool used for Experiments 1 and 2 is end mill Iscar HP E90AN-D16-4-C16-07-C (inserts HP ANKT 070208PNTR) in a holder PILANA MCT 40xER32 DL which represent compliant slender tools. Two sets of slot milling tests were conducted with it, using tool overhangs of 30 mm and 50 mm. The second cutting tool is Walter F4042.B.050.Z05.15 (inserts ADMT160608R-F56) in a holder Walter SK40 D22 A52 with an overhang of 71 mm which represents rigid roughing tools. Experiment 3 consists of slot milling with this tool. The cutting tools used can be seen in Figure 2.

3.1. Identification of Structural Dynamics

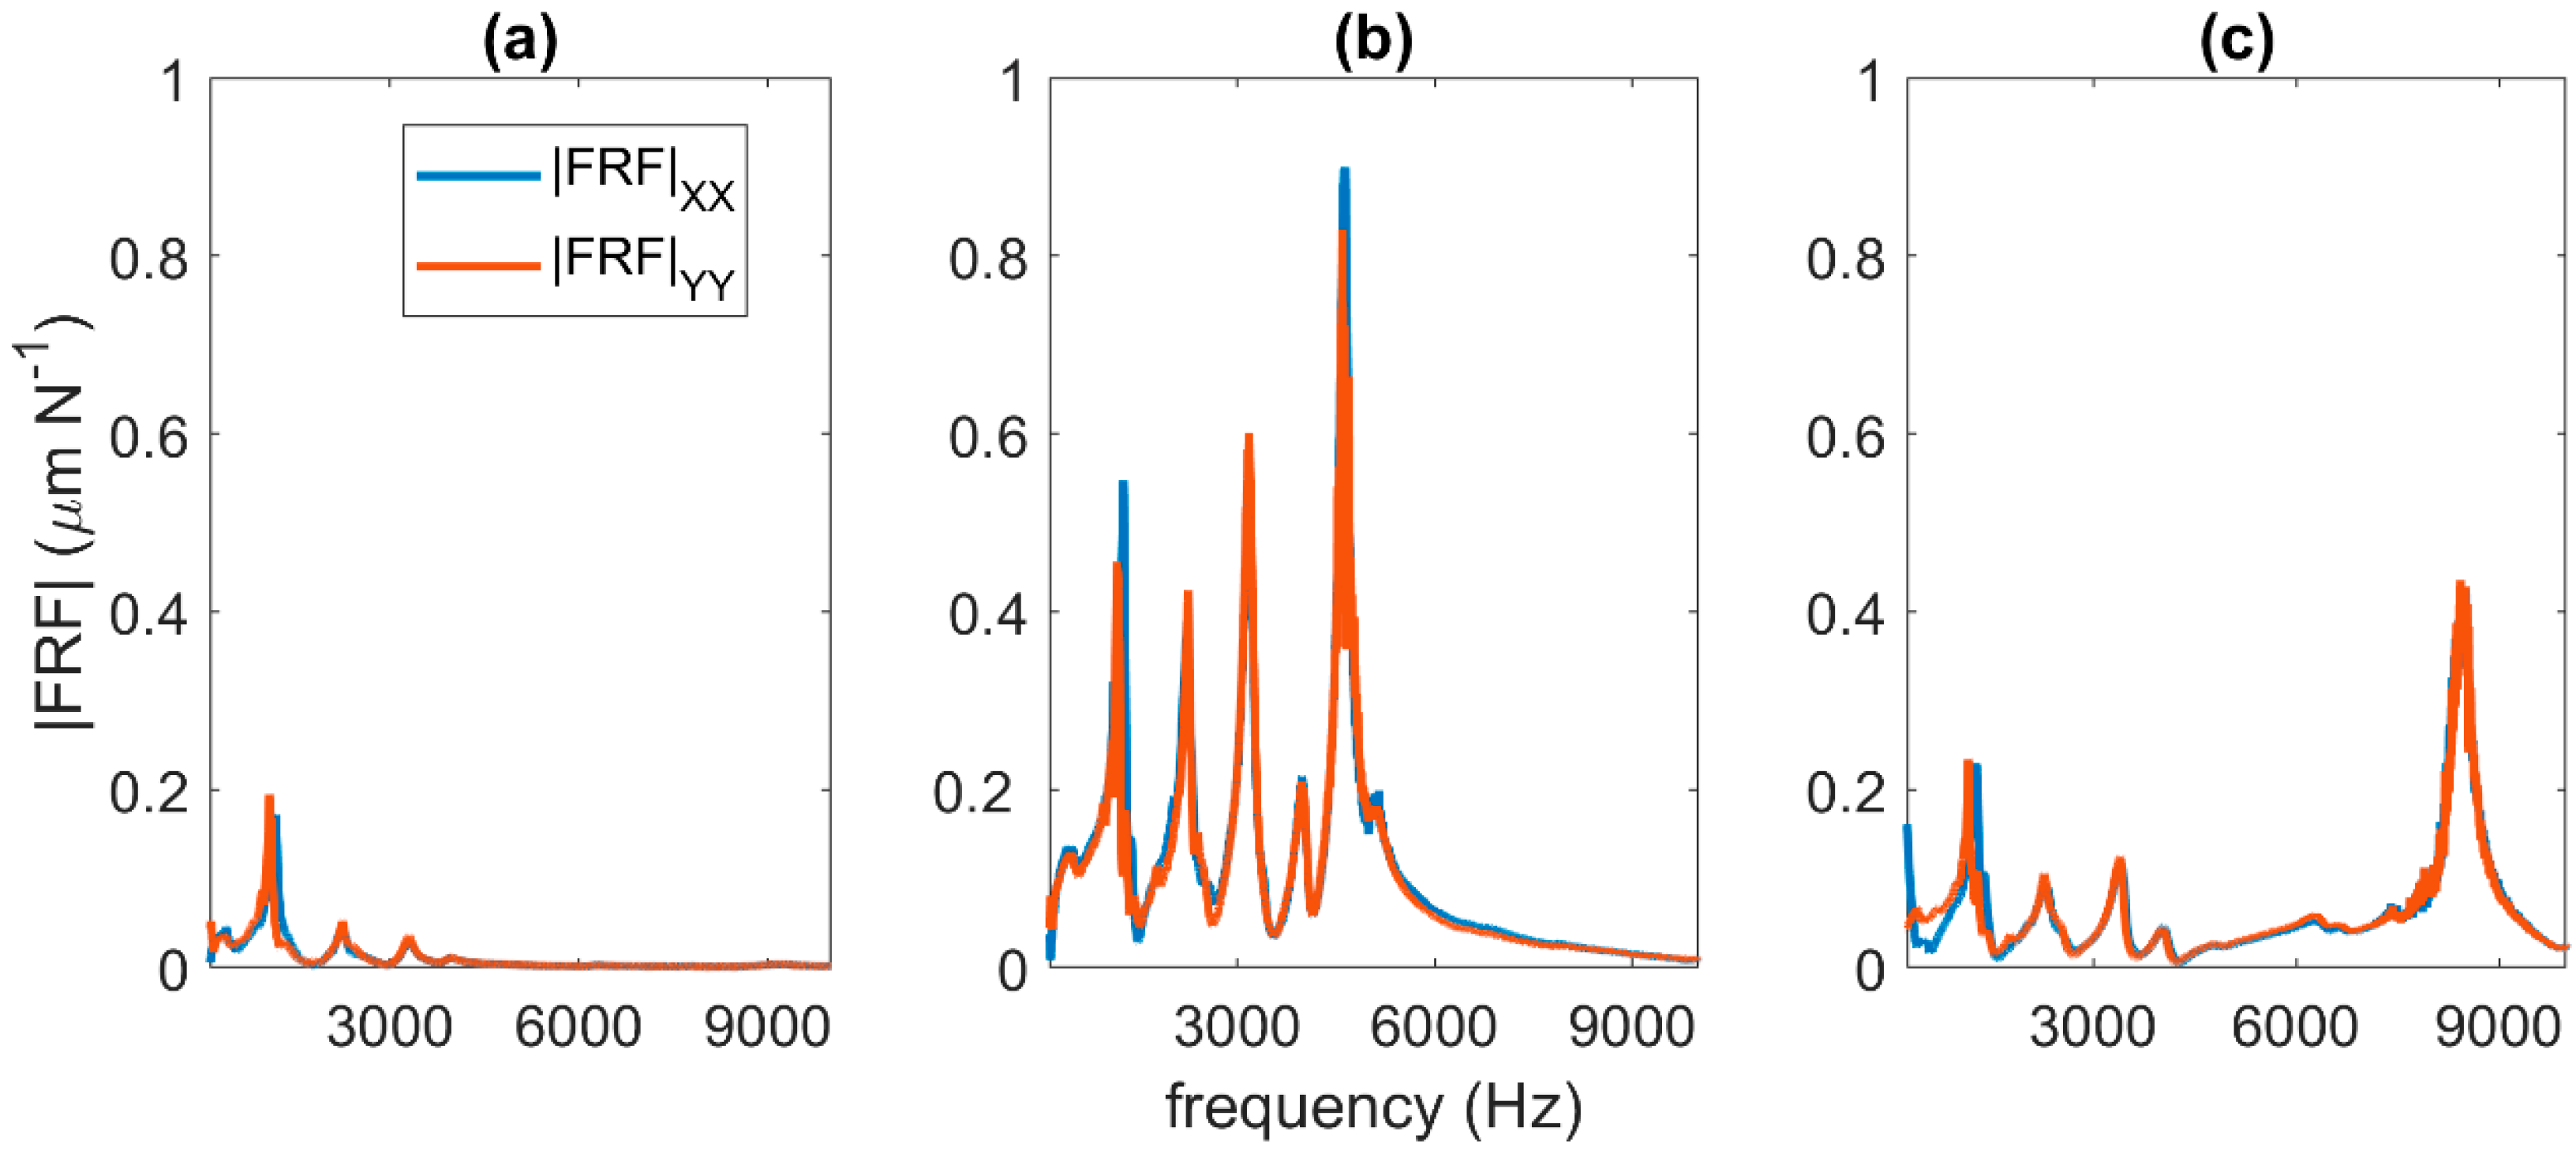
The FRF measurements were performed with an apparatus consisting of the PULSE analyzer, the modal hammer Brüel & Kjaer 8206-003, and the uniaxial accelerometer PCB 352A21. The tool direct responses were measured in the X and Y directions. The absolute values of the resulting FRFs are in Figure 3. These FRFs are used for stability prediction.
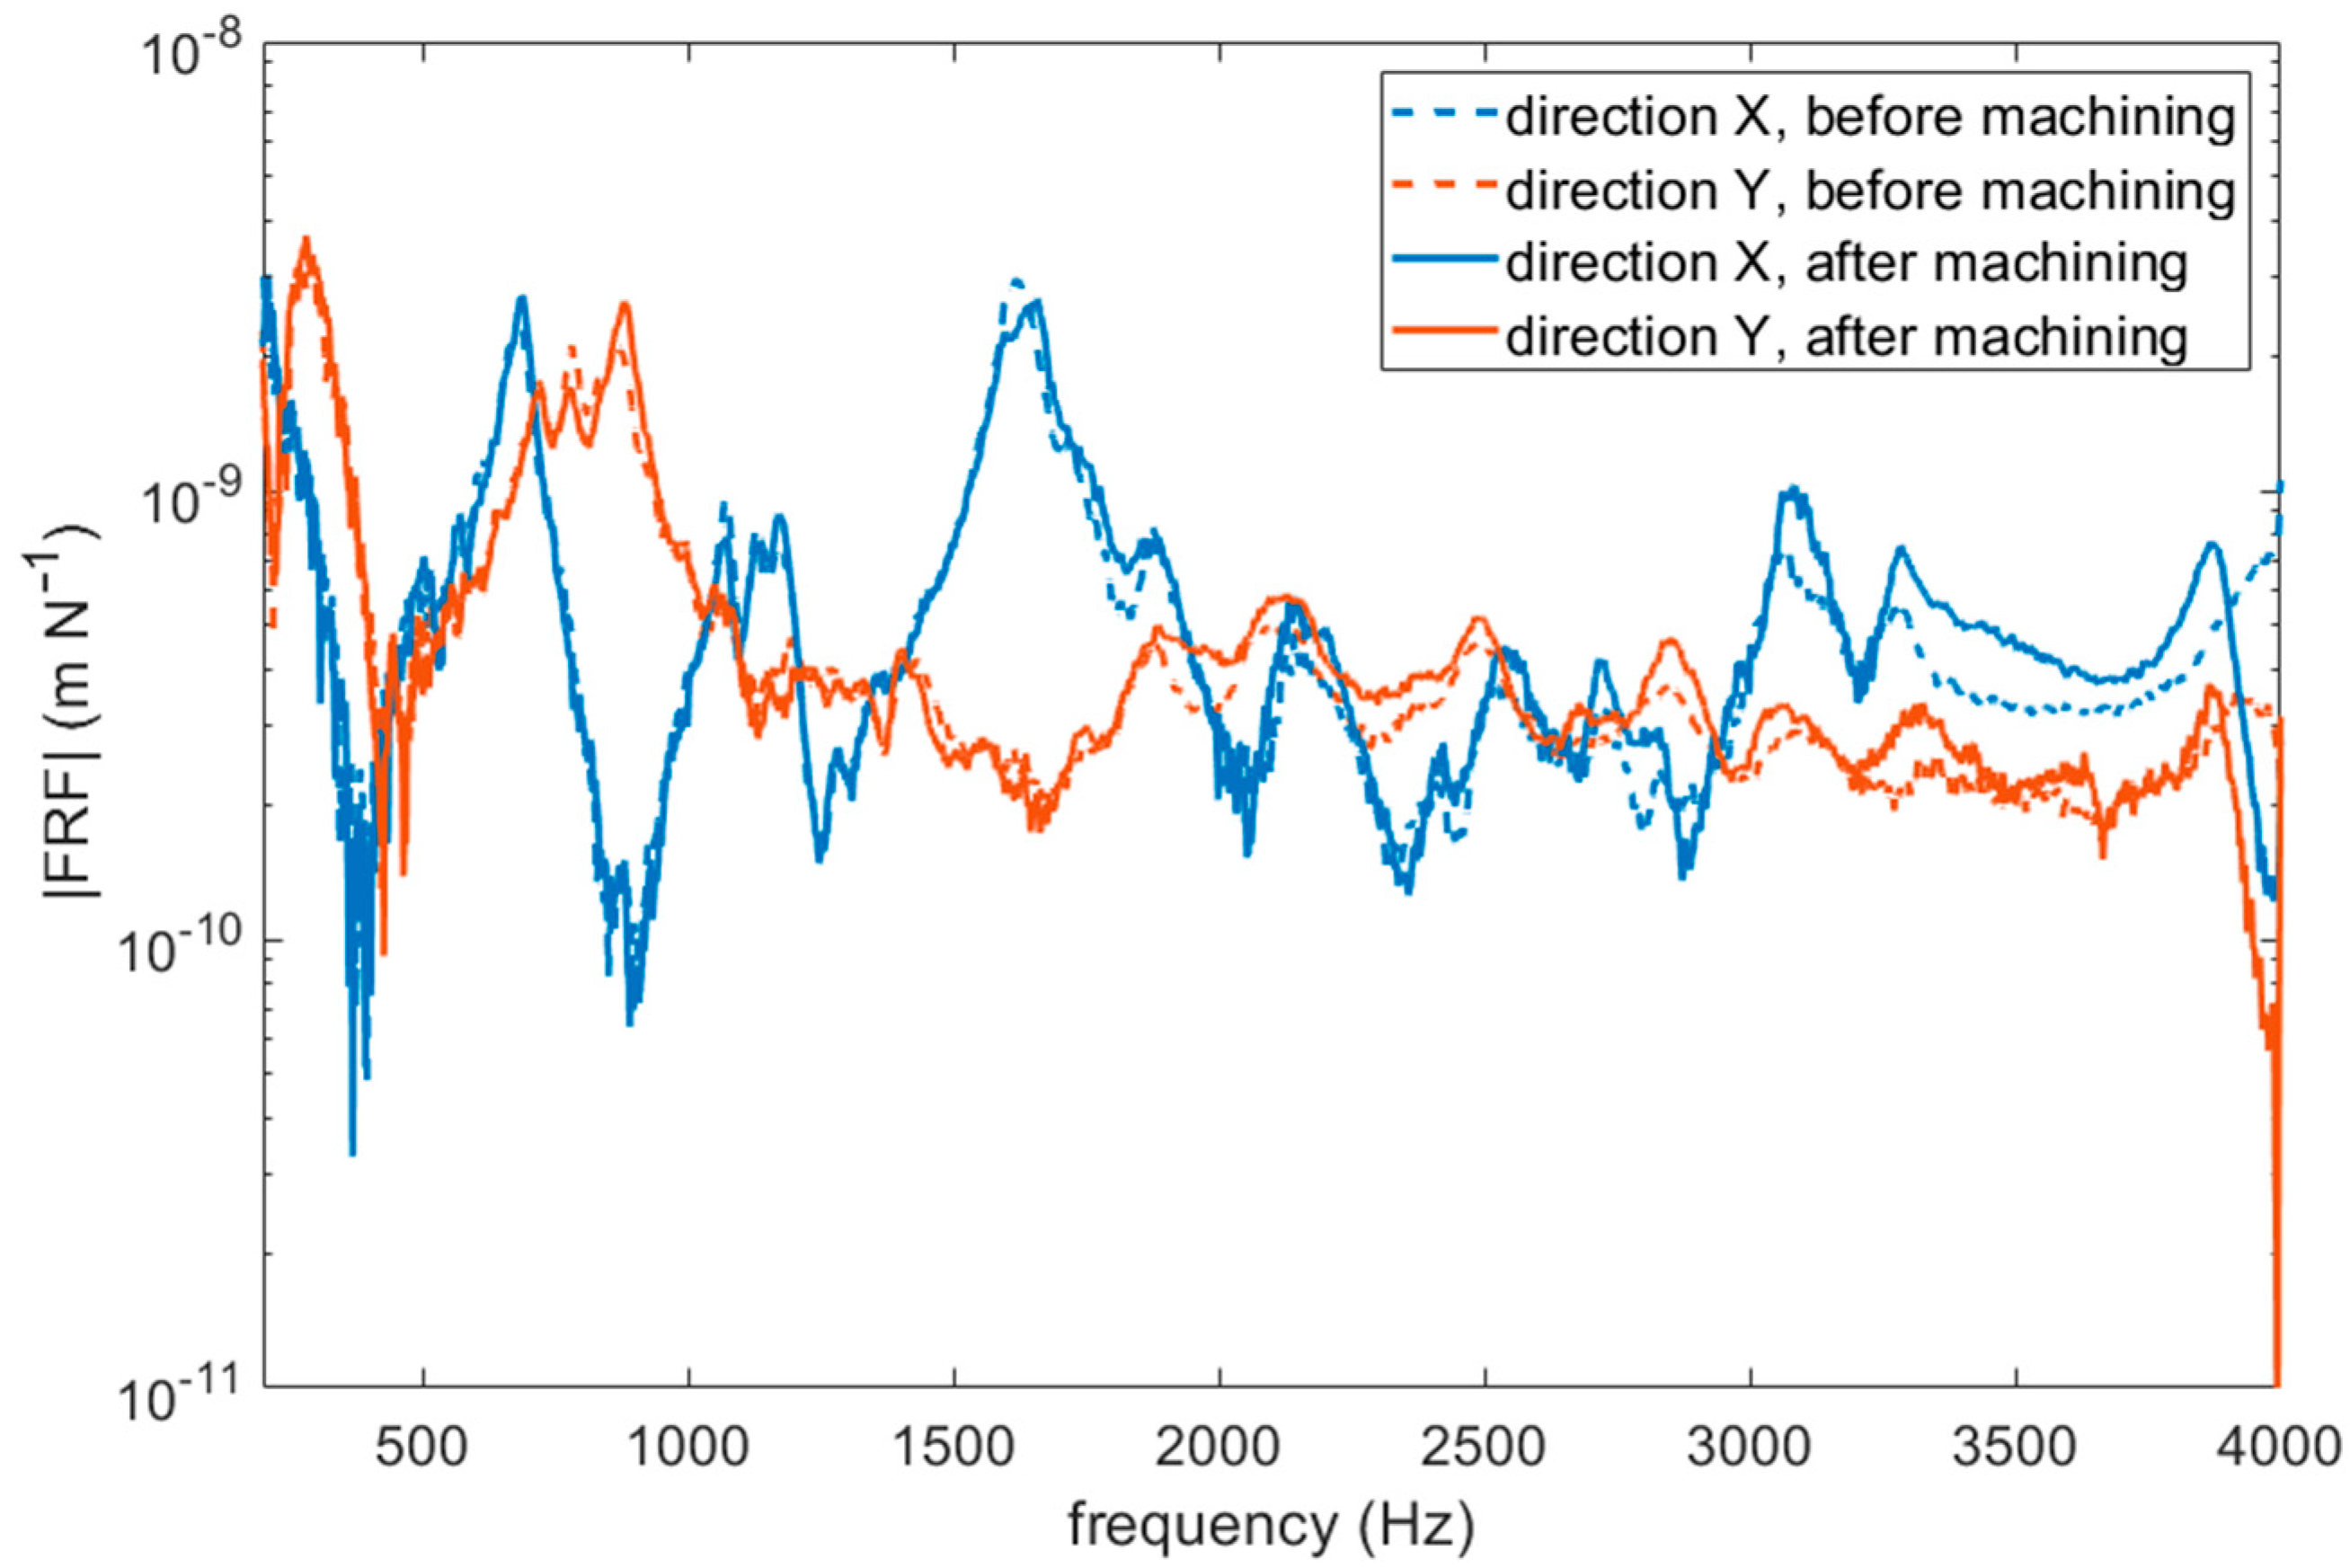
The workpiece was a steel (ISO C60E4) block clamped on a working table. The workpiece is significantly less compliant than the tools, and hence it is not considered important for the onset of chatter (see Figure 3). This check is important for testing the sensitivity of stability indicators to the dynamic properties of the tool.

3.2. Process Monitoring Setup

During machining, the acceleration in direction -Y was sensed with a uniaxial accelerometer (Endevco 751-10) mounted on the spindle (on a magnet) (see Figure 1). The vibration signals were sampled by using a data acquisition card and transmitted to a computer which was used to store and process the signals. The sampling frequency was set at 32.768 kHz.

3.3. Machining Tests Process Parameters

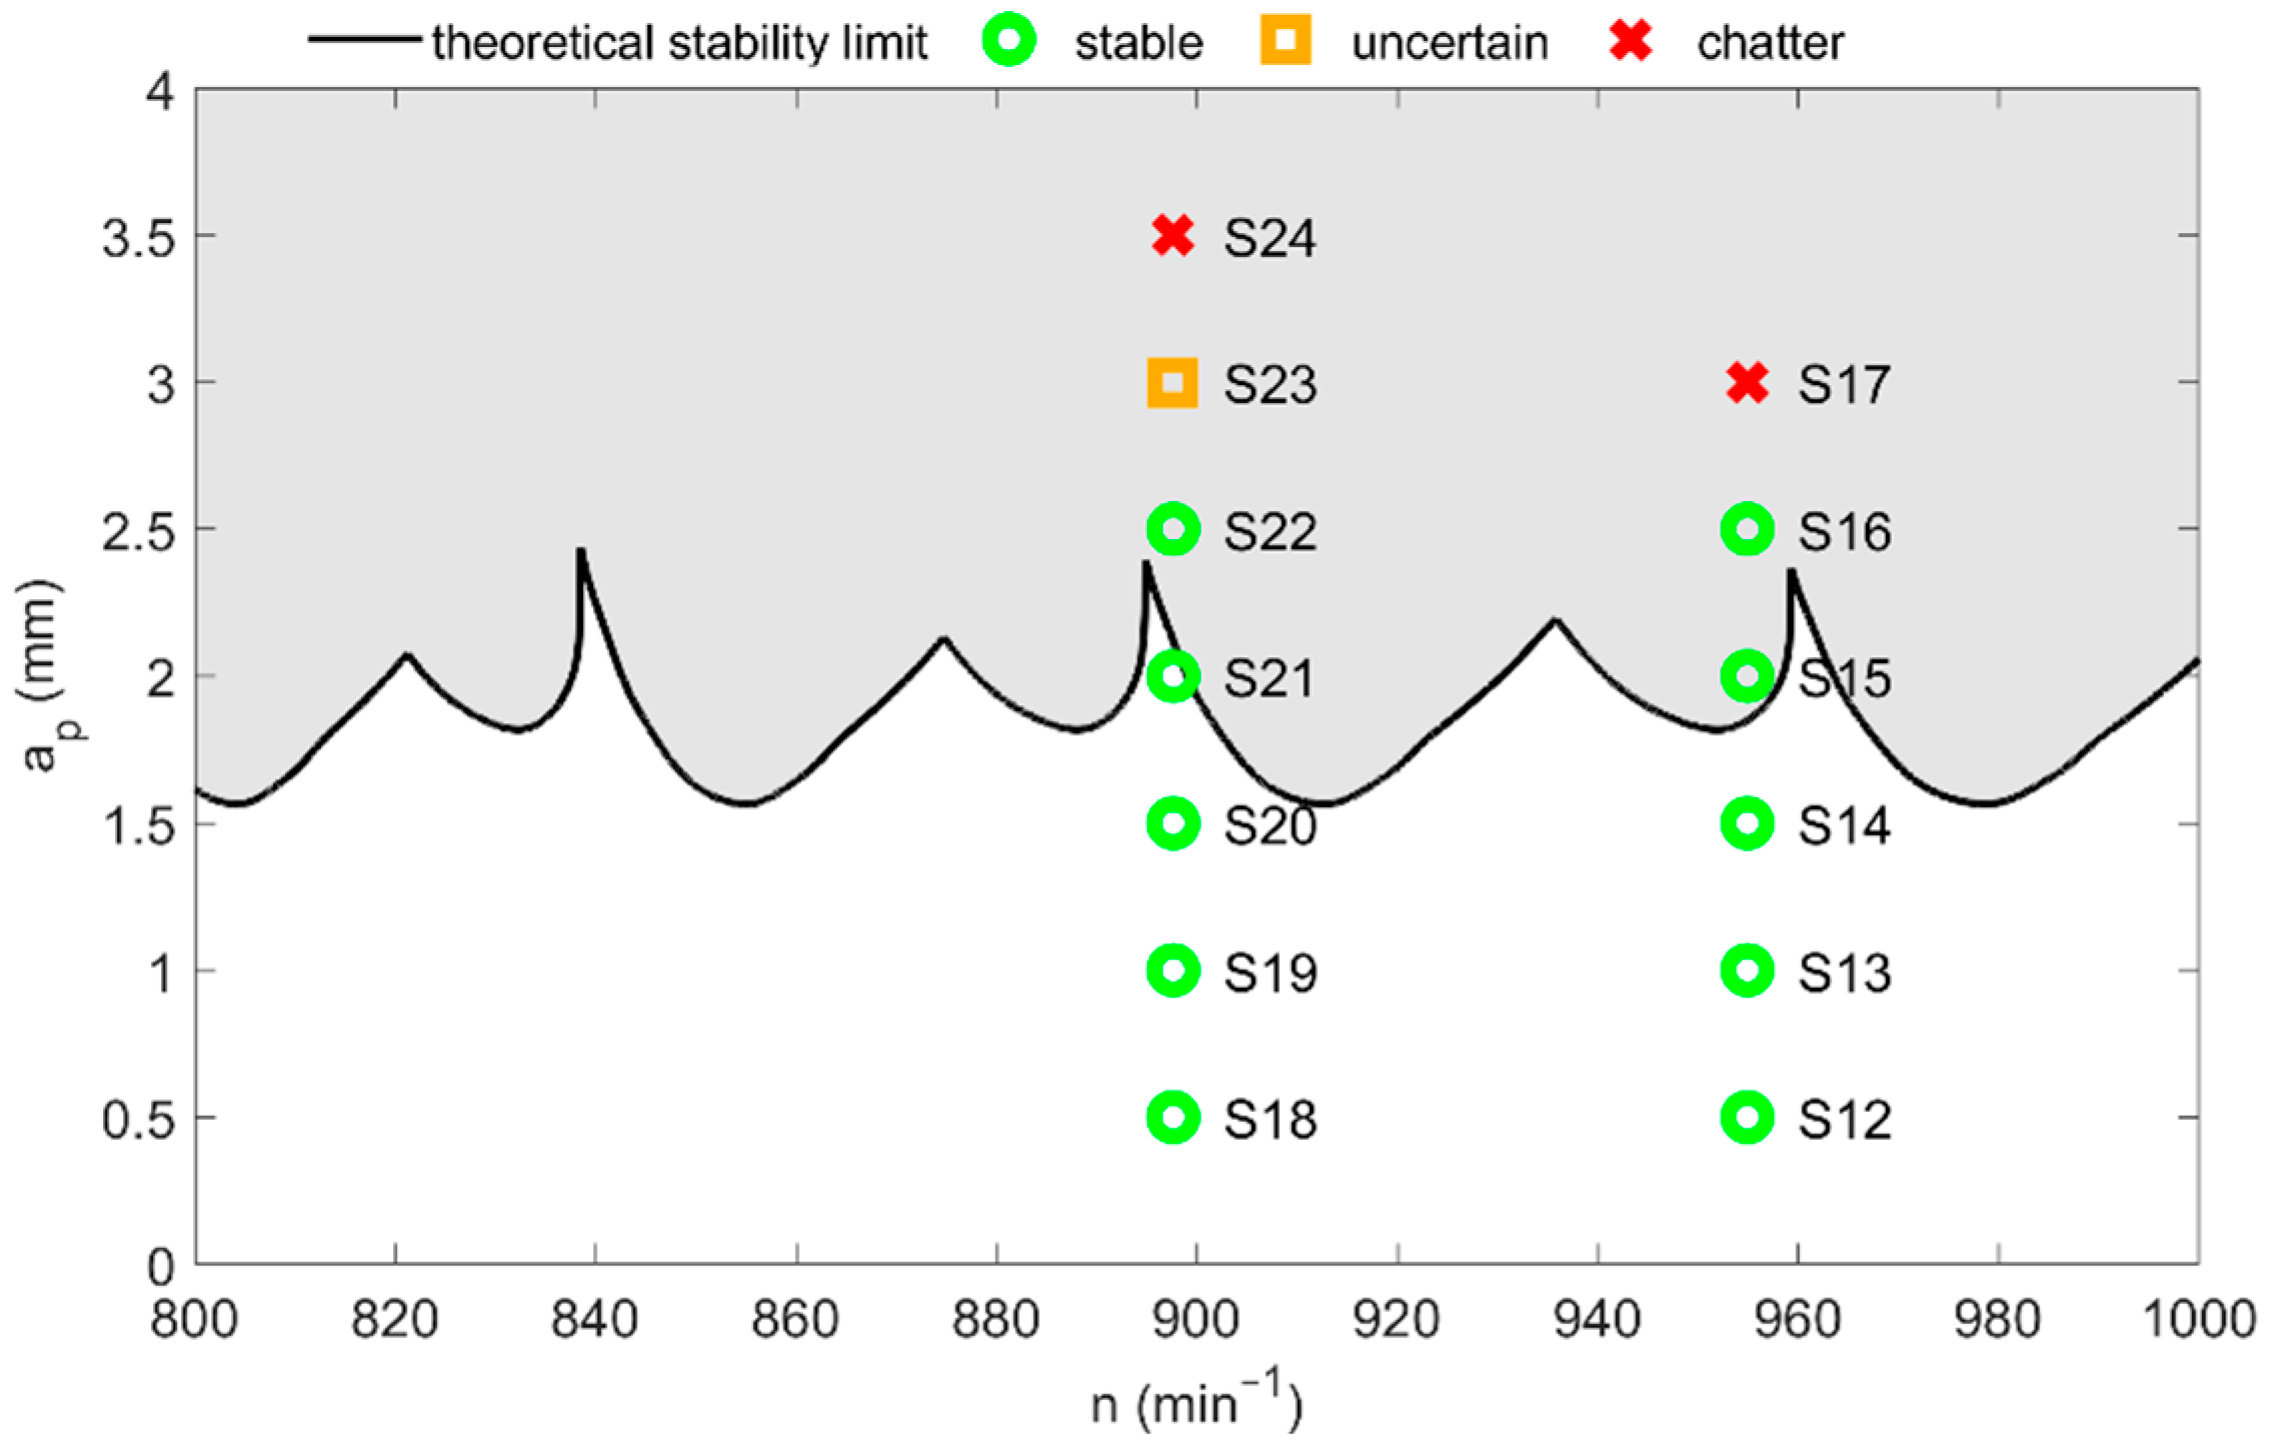
The main parameter affecting the occurrence of self-excited vibration is the depth of cut. Tests with the slender tool were carried out at spindle speeds of 2188, 2984, and 3780 rpm and for an axial depth of cut of 0.5 mm and 1 mm (Experiment 1, slender end mill, 50 mm overhang) and of 2 and 3 mm (Experiment 2, slender end mill, 30 mm overhang). The speed per tooth was 0.1 mm. Tests in Experiment 3 (shoulder mill) were performed at spindle speeds of 898 and 955 rpm with the axial depth of cut varying from 0.5 to 3.5 mm in increments of 0.5 mm. The speed per tooth was set to 0.15 mm for Experiment 3. All tests were carried out without coolant.

3.4. Machining Stability Prediction

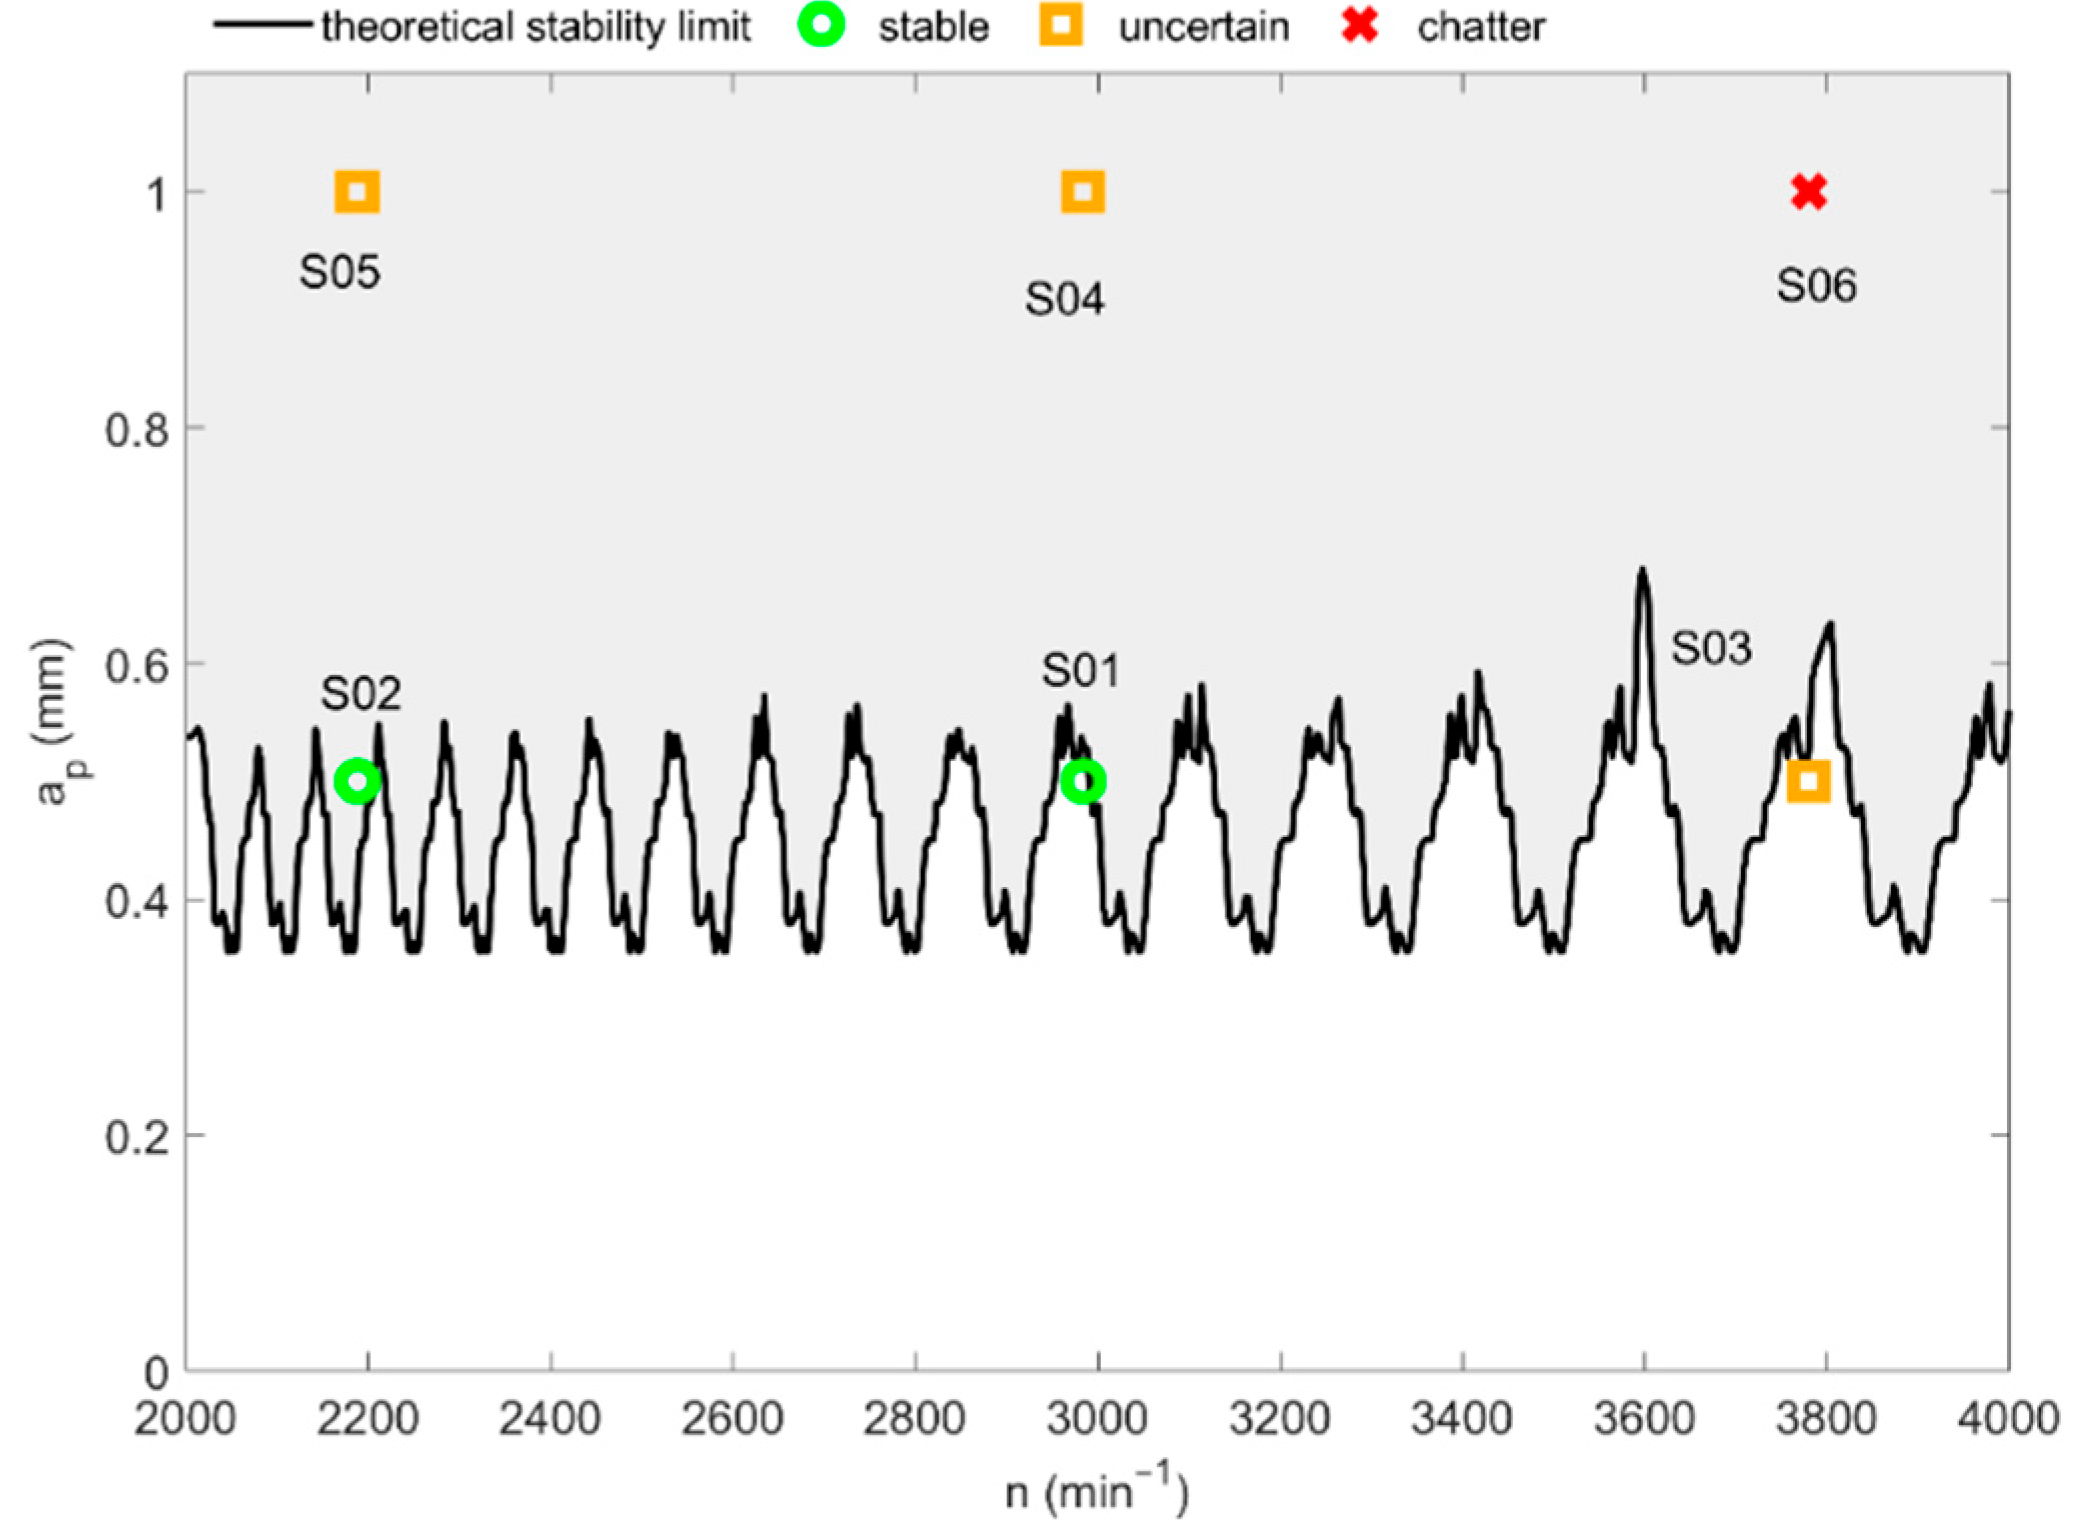
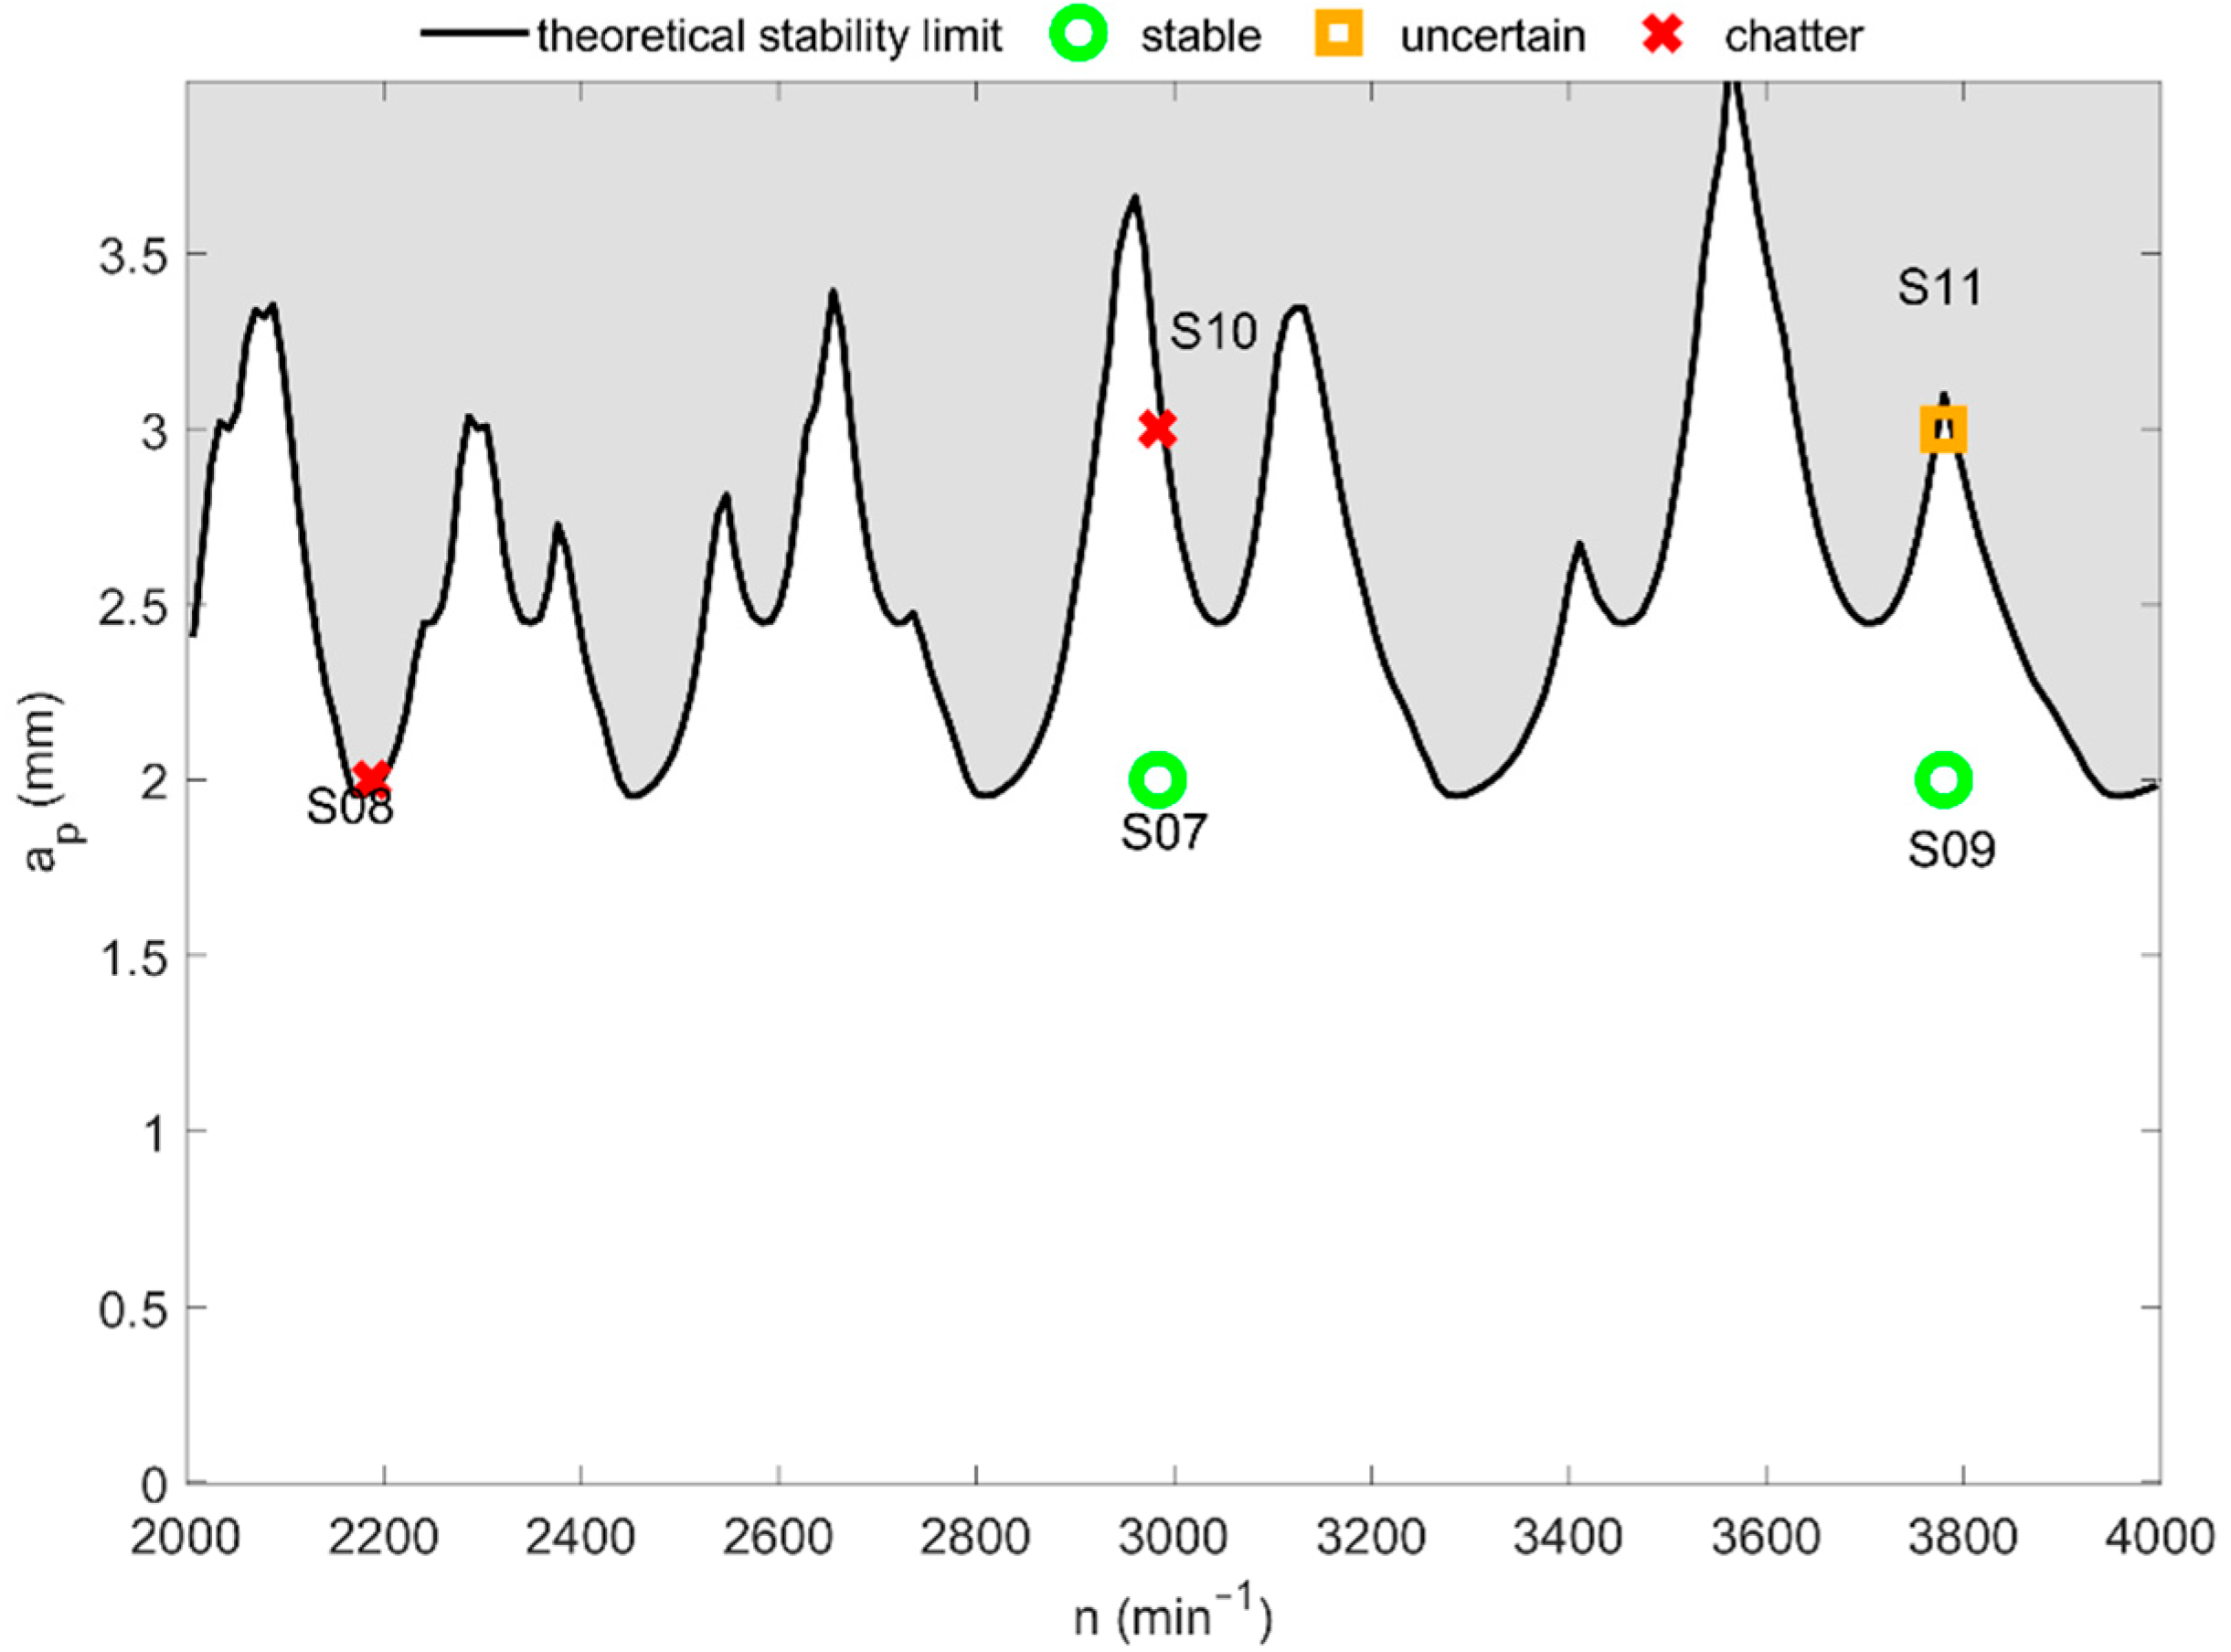
In this subsection, a comparison with the stability predicted from the measured FRF on the tool and the cutting coefficients for steel is made for illustration. The FRFs for each tool are available as electronic Supplementary Material in mat format, with the first column containing the frequency (Hz), the second column containing the direct FRF in the X direction (m/N), and the third column containing the direct FRF in the Y direction. The stability prediction from the FRF shown by the lobe diagram is based on the ZOA method introduced by [34] for the cylindrical tool. An empirical shifted linear model of the cutting force is used in the stability analysis, as in the paper. The coefficients used are based on the force measurements on the material and are K c t = 1720   N   mm 2   and K c n = 860   N   mm 2 .   Workpiece FRF at directions X and Y for before and after machining tests are shown in Figure 4. The stability diagrams for the slender end mill are shown in Figure 5 and Figure 6, and for the rigid shoulder mill in Figure 7.

4. Data Processing by Using Chatter Identification Methods

In this paper, matrix plots are used as a visual means of comparing methods. These allow multiple methods and records to be compared simultaneously. In the following paragraphs, the procedures for calculating and displaying each indicator in a matrix graph will be generally summarized. A comment on the content evaluation will fill the following subsections of the paper.
All analyzed signals have the same sampling frequency of 32.768 kHz. For each signal, the indicators are computed every 0.1 s from the previous 0.2 s signal interval. The length of this time interval affects the indicator value and it is chosen based on the discussion in the cited papers (see Section 2). The choice of other parameters needed to be specified for each method is also explained there. All indicators are computed for offline measured acceleration signals in Matlab software (2021a).
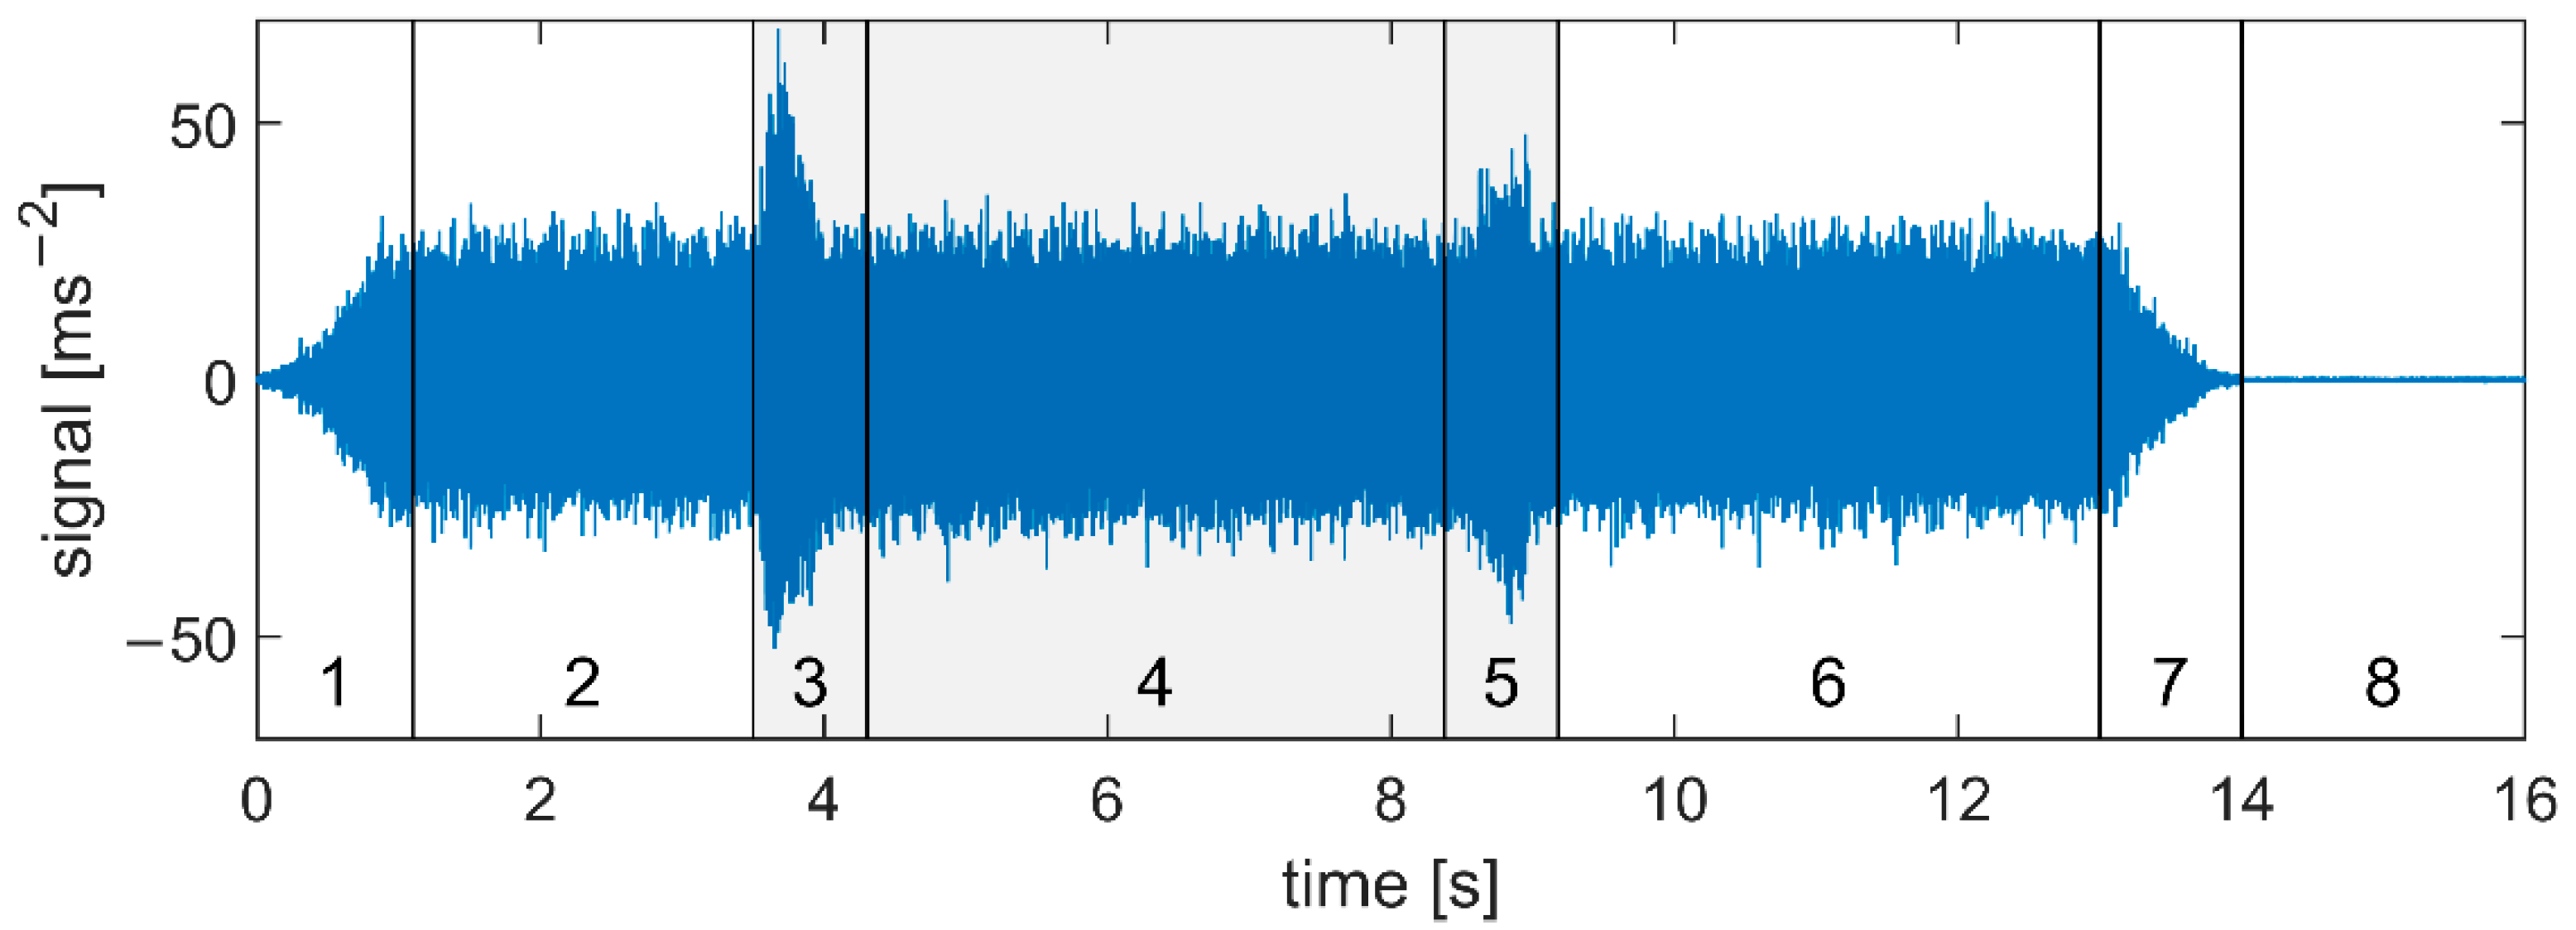
For each of the experiment settings, described in Section 3, one stable and one unstable signal is chosen for analysis. The decision whether a signal is stable or not is based on the operator’s evaluation and the surface quality. The whole milling process is recorded, including the start and the end of the cut, in some signals even with some of the noise after switching off the spindle. This allows us to distinguish the indicator values in three different states—for noise when the spindle is off, in air-cut, and in cut—and in the transitions between them. See Figure 8 for an example of these parts of the signal S07 from a slot milling test (its cutting conditions are described in Table A1 in Appendix A).
As the main difference between stable and unstable machining lays in the signal energy and distribution of frequencies, complementary spectral characteristics are computed for each signal. The coarse view of both is acquired from the spectrum of the whole in-cut part of the signal. More detailed analysis of the energy evolution in time is made by computing the spectrum of 0.2 s time interval every 0.1 s and taking the maximum of its amplitudes (further denoted by MA).
The scale of the graphs of spectrum and MA is notably different in the case of chatter, which is caused by various factors. First, the spectrum is calculated from the whole part when the tool is in contact with the workpiece (parts 3–5 in Figure 8), so it includes also the start and end of cut where the signal energy is generally lower. Furthermore, the most significant frequency varies in time, so the frequency with the highest amplitude in some time interval of 0.2 s might contain less energy during the rest of the cut. Lastly, the spectrum computed only from 0.2 s might be less precise than when computed from the whole in-cut part. However, as we are interested in the evolution in time, not in the exact values, the obtained results are sufficient for the given purpose.
The grey area in the graphs signifies the part of the signal when the tool was at least partially in cut. Peaks in the values of the indicators can be seen right after the beginning and before the end of cutting in several cases. These values are probably not very reliable as the process is changing very dynamically when only a part of the cutting tool is in contact with the material.
CER value below 0.2 is said to identify chatter, as discussed in [29], so it is plotted in the graphs to allow a quick evaluation. For other indicators, no fixed threshold is set. Vaguely, chatter is indicated by a sharp decline in RE and PSE and by a sharp rise in FD and SD.

4.1. Experiment 1: Slender End Mill, D = 16 mm, Overhang 50 mm

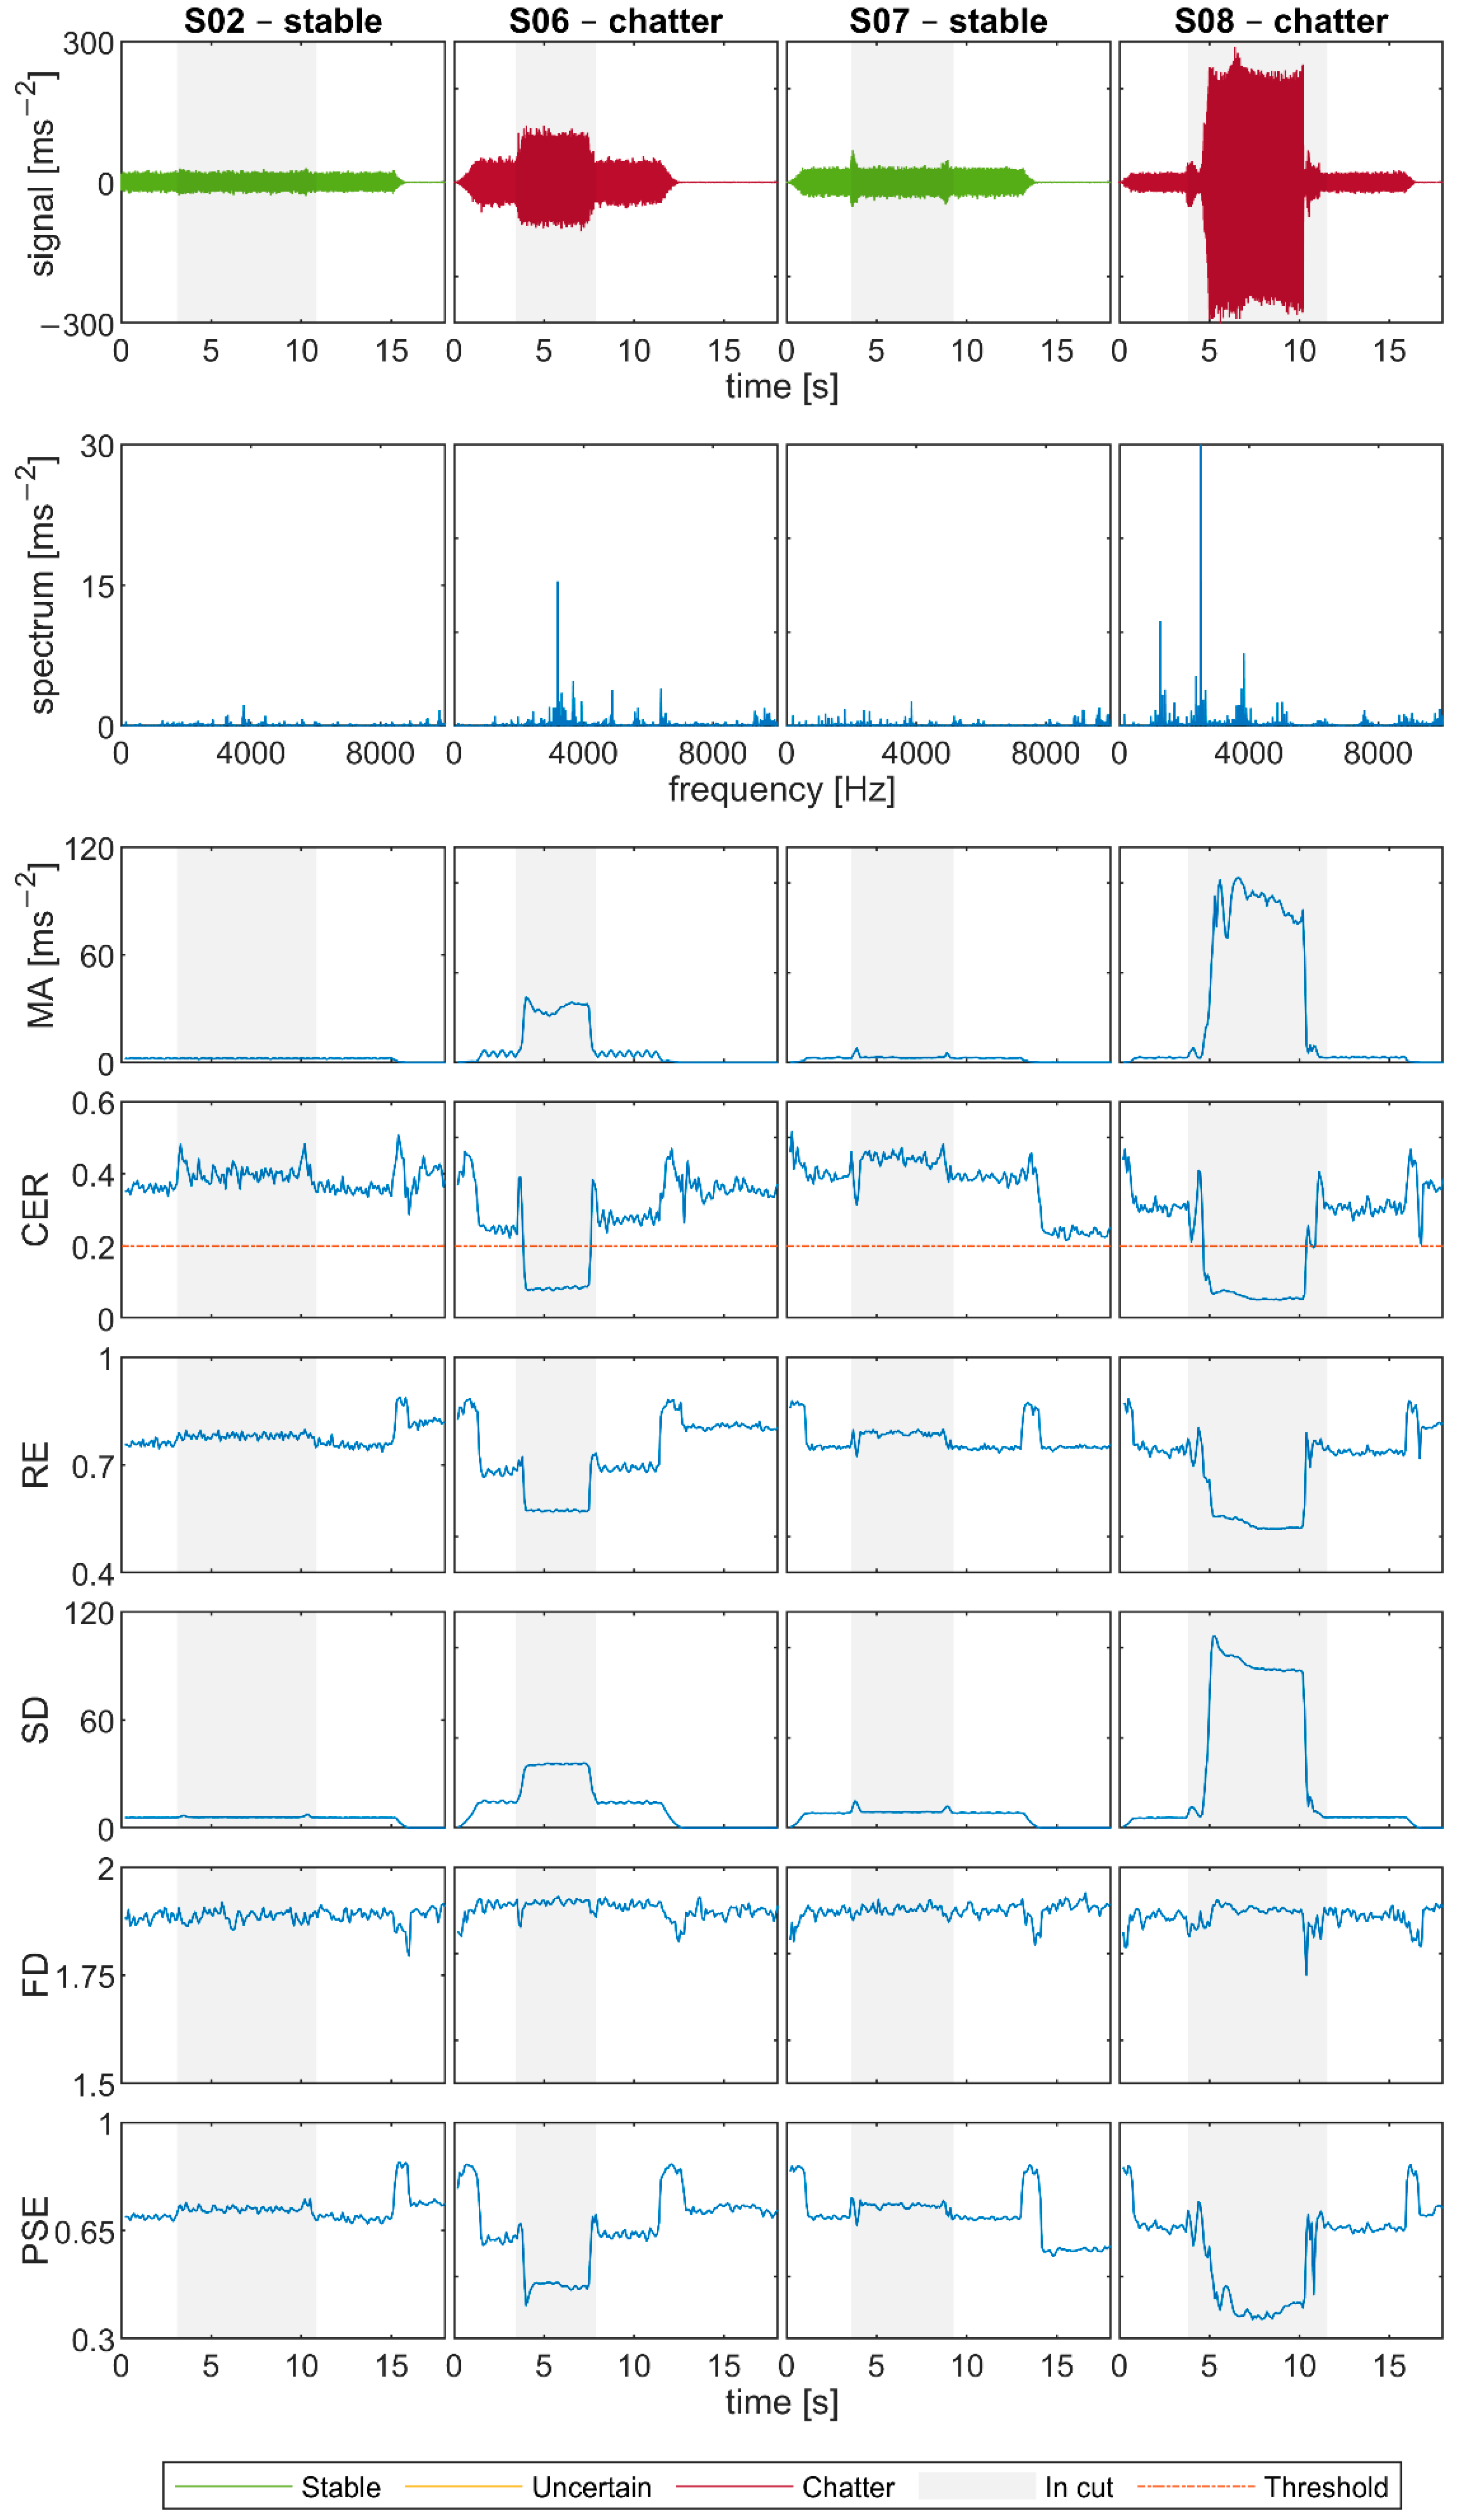
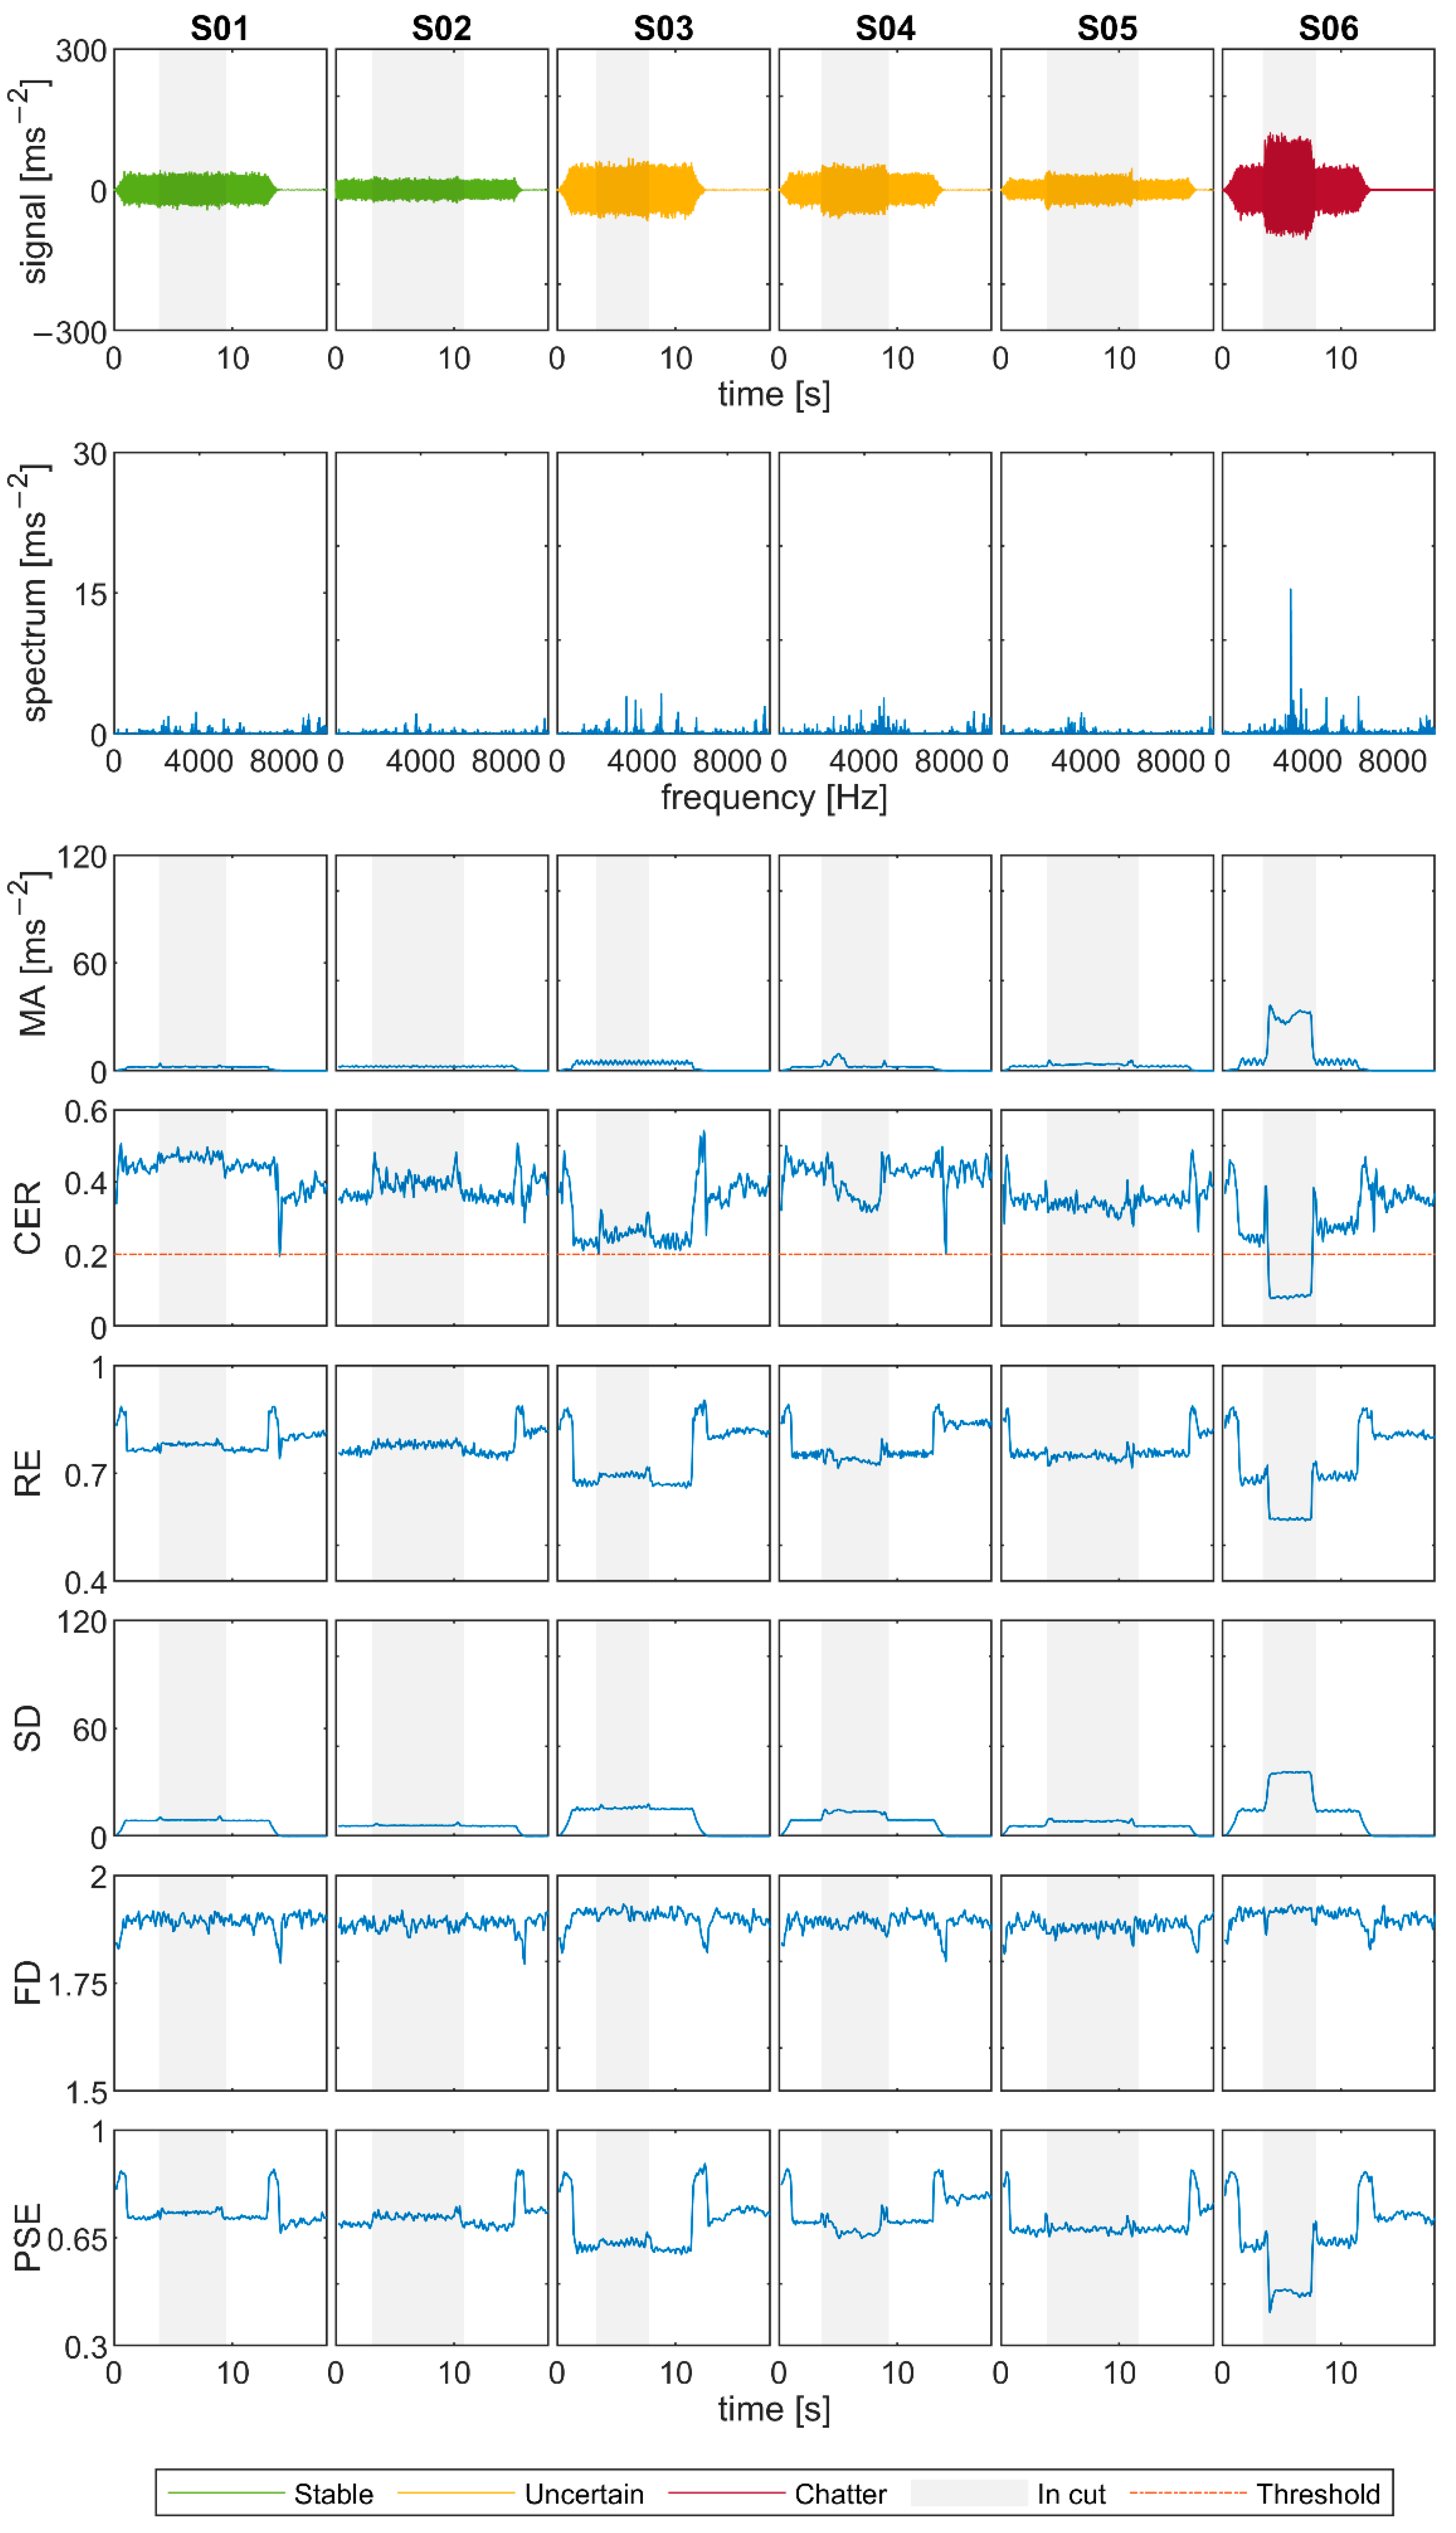
Two tests with different cutting conditions were selected from Experiment 1, one stable (S02) according to the surface evaluation, and one unstable (S06). The surface quality of the respective slots can be seen in Figure 9, and the signals are displayed in the first two columns of Figure 10.
In the graph of the signal S02, there is almost no difference in amplitude between the air-cut and in-cut part. The spectrum of the in-cut part is rather evenly distributed, and no clusters at specific frequencies are visible. The surface is smooth and without any significant marks. This together confirms the stability of this machining process.
All considered methods accordingly identified the stability of S02. Three entropic indicators even slightly rise in the in-cut part in comparison with the air-cut and CER stays high above the proposed threshold. The SD has a low value throughout the whole time when the spindle is on and no significant change is visible at the start of cutting. FD oscillates around the same value throughout the whole signal, the only visible difference can be seen when the spindle is switched off.
Signal S06 was evaluated as unstable, which corresponds to its deteriorated surface, frequencies clusters in the spectrum of the in-cut signal part, and the graph of maximum amplitudes (MA) that are much higher in the cut than elsewhere.
The values of the entropic indicators CER, RE, and PSE drop significantly in the cut and thus correctly identify chatter. CER even decreases far below the proposed threshold. SD grows in cut, as the signal amplitudes do. Changes in FD are visible at the start and end of the cut, but otherwise it has a similar value in air-cut and in cut, so it fails at identifying chatter. However, it is worth noting that there is a qualitative difference in FD graphs. While it changes rapidly in S02 and in air-cut of S06, the indicator keeps a much more constant value in the cutting part of S06.

4.2. Experiment 2: Slender End Mill, D = 16 mm, Overhang 30 mm

Stable signal S07 and unstable signal S08 from Experiment 2 are shown in Figure 10. The signal S07 is stable according to the surface quality (see Figure 9), and to the spectral characteristics. The entropic indicators stay high in the cutting part. SD is low apart from a slight peak in the start and the end of cut. However, nothing can be concluded from FD, only that its value is changing rapidly as in S02.
The signal S08 was denoted as unstable; however, the chatter does not start immediately after the start of cut. The onset of chatter is visible from the surface in Figure 9 approximately 1.5 cm from the edge. Accordingly, the signal graph and maximum amplitude show this delay, as well as SD indicator. The entropic criteria grow first in the cutting part and then drop in the appropriate moment. FD is slightly higher in cut than in air-cut and it oscillates more slowly in comparison with the stable signal S07.

4.3. Experiment 3: Shoulder Mill, D = 50 mm

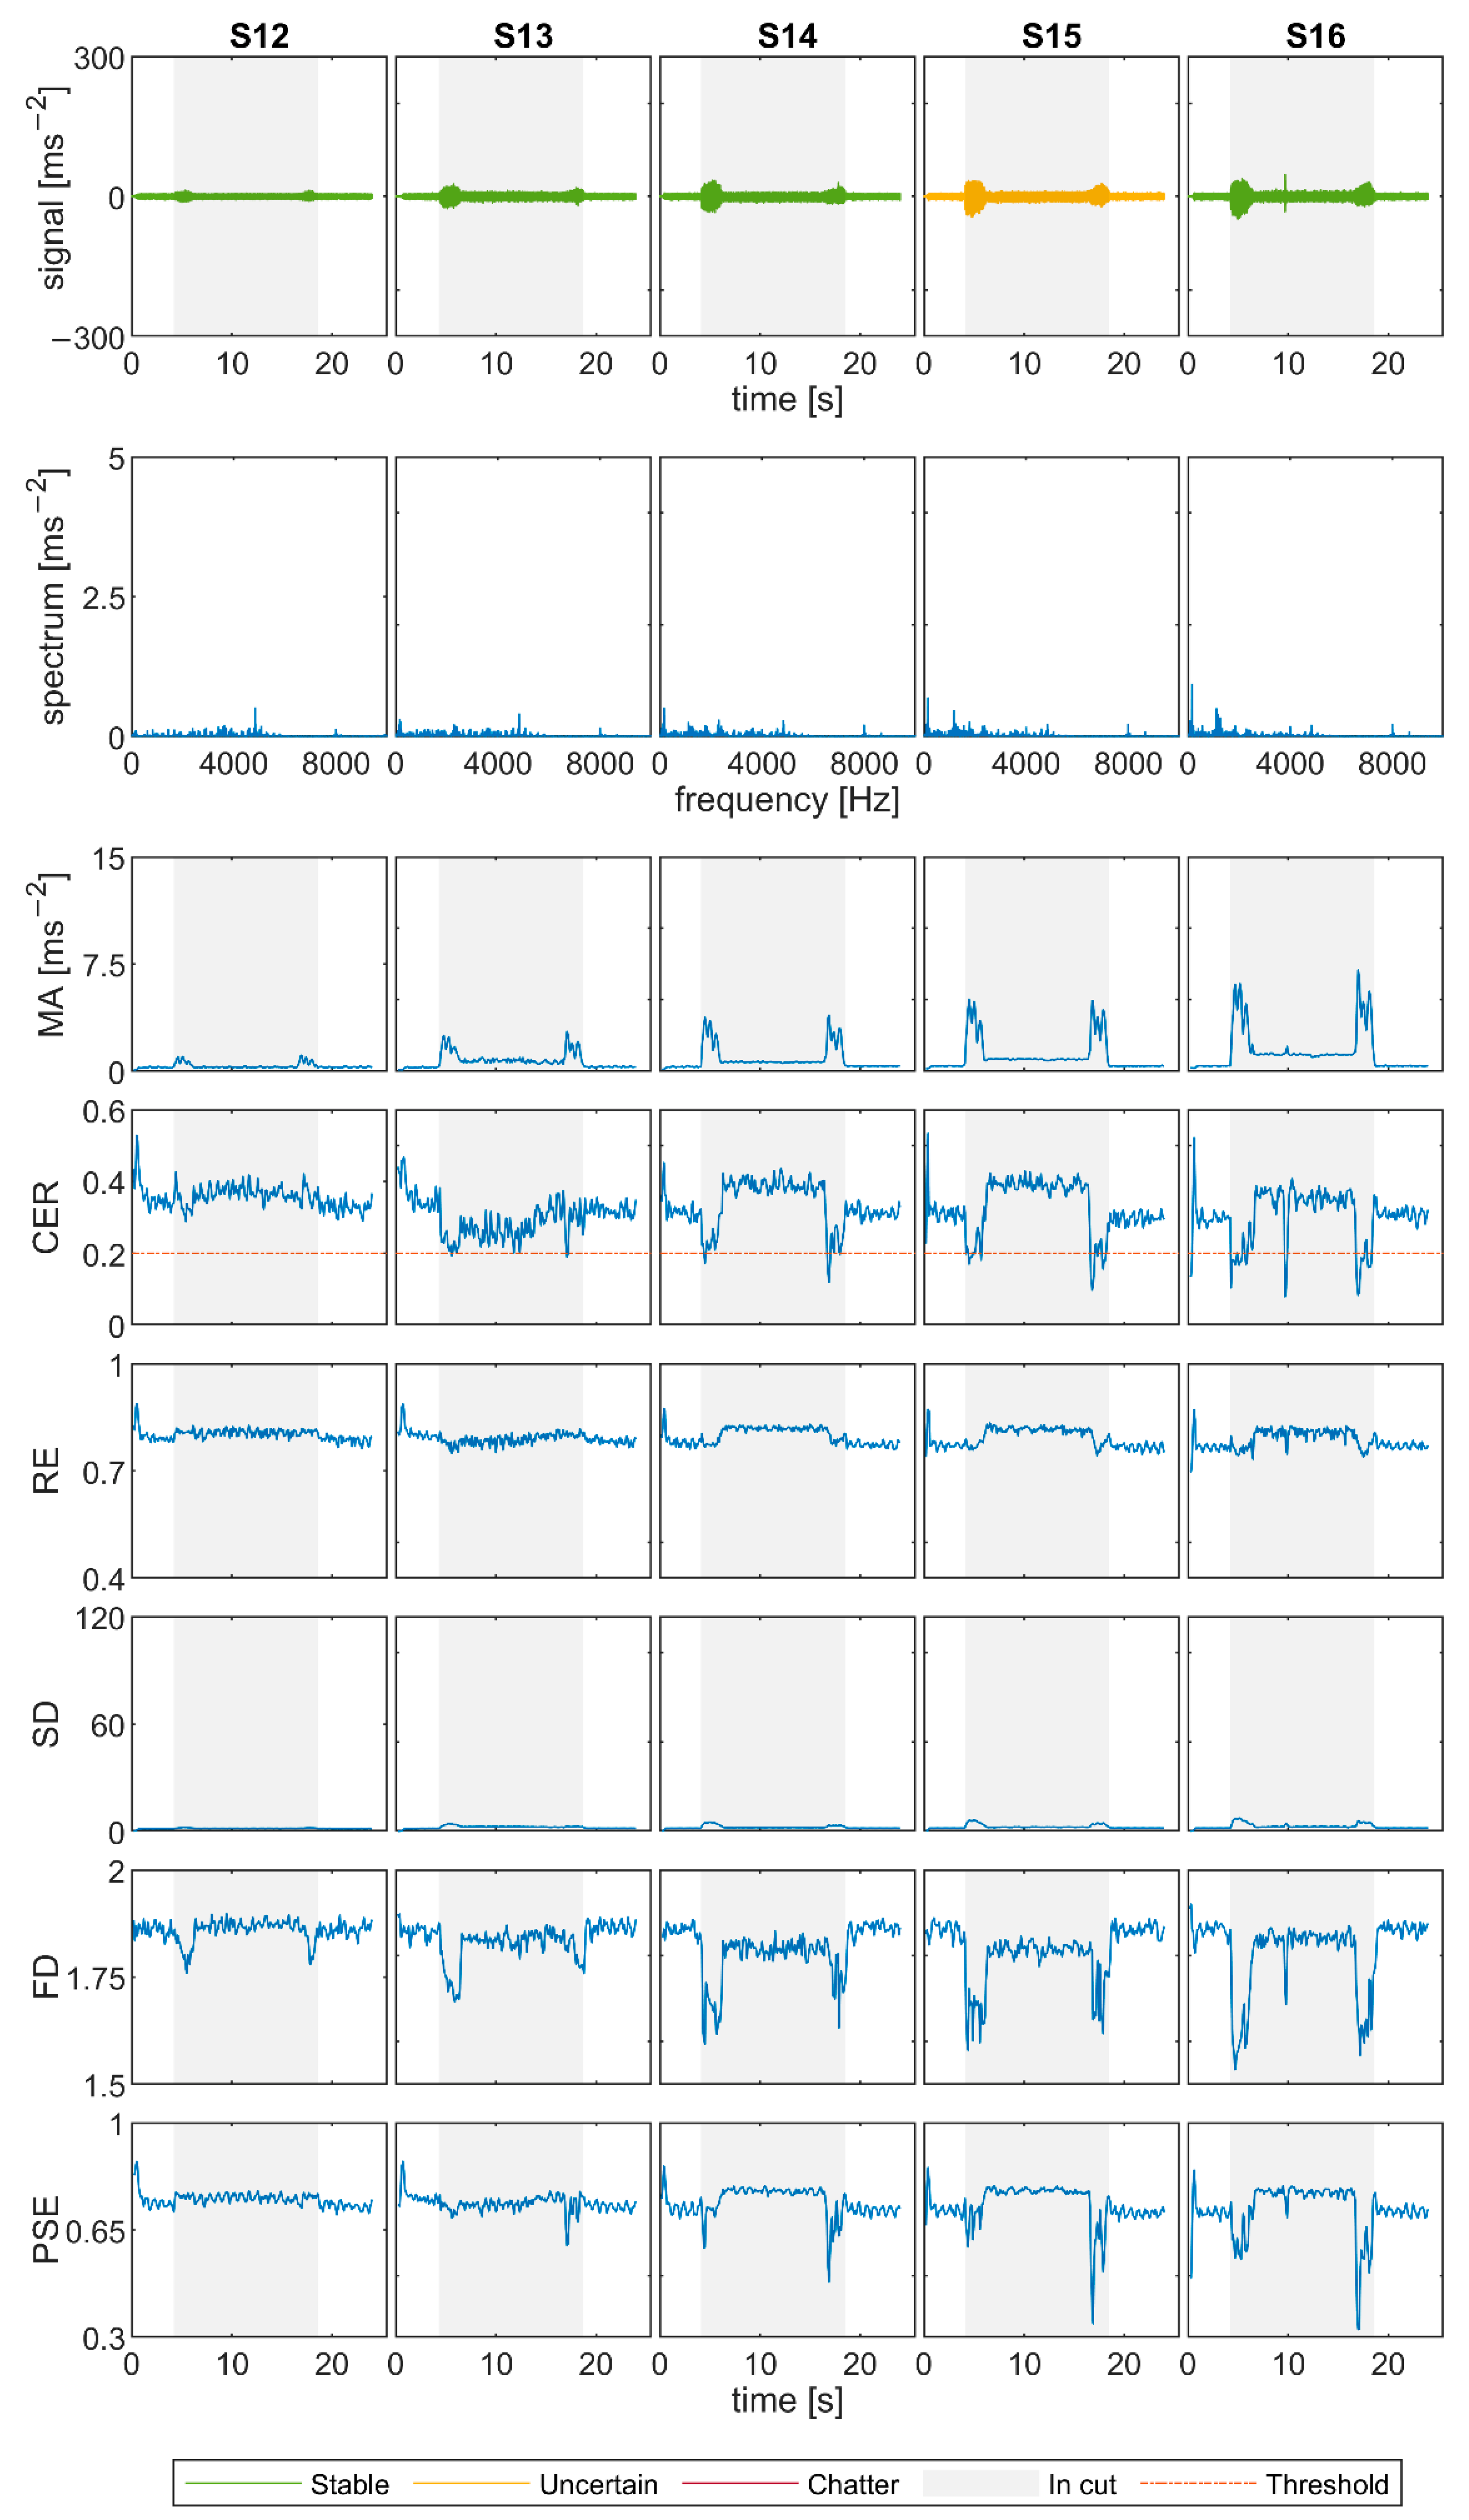
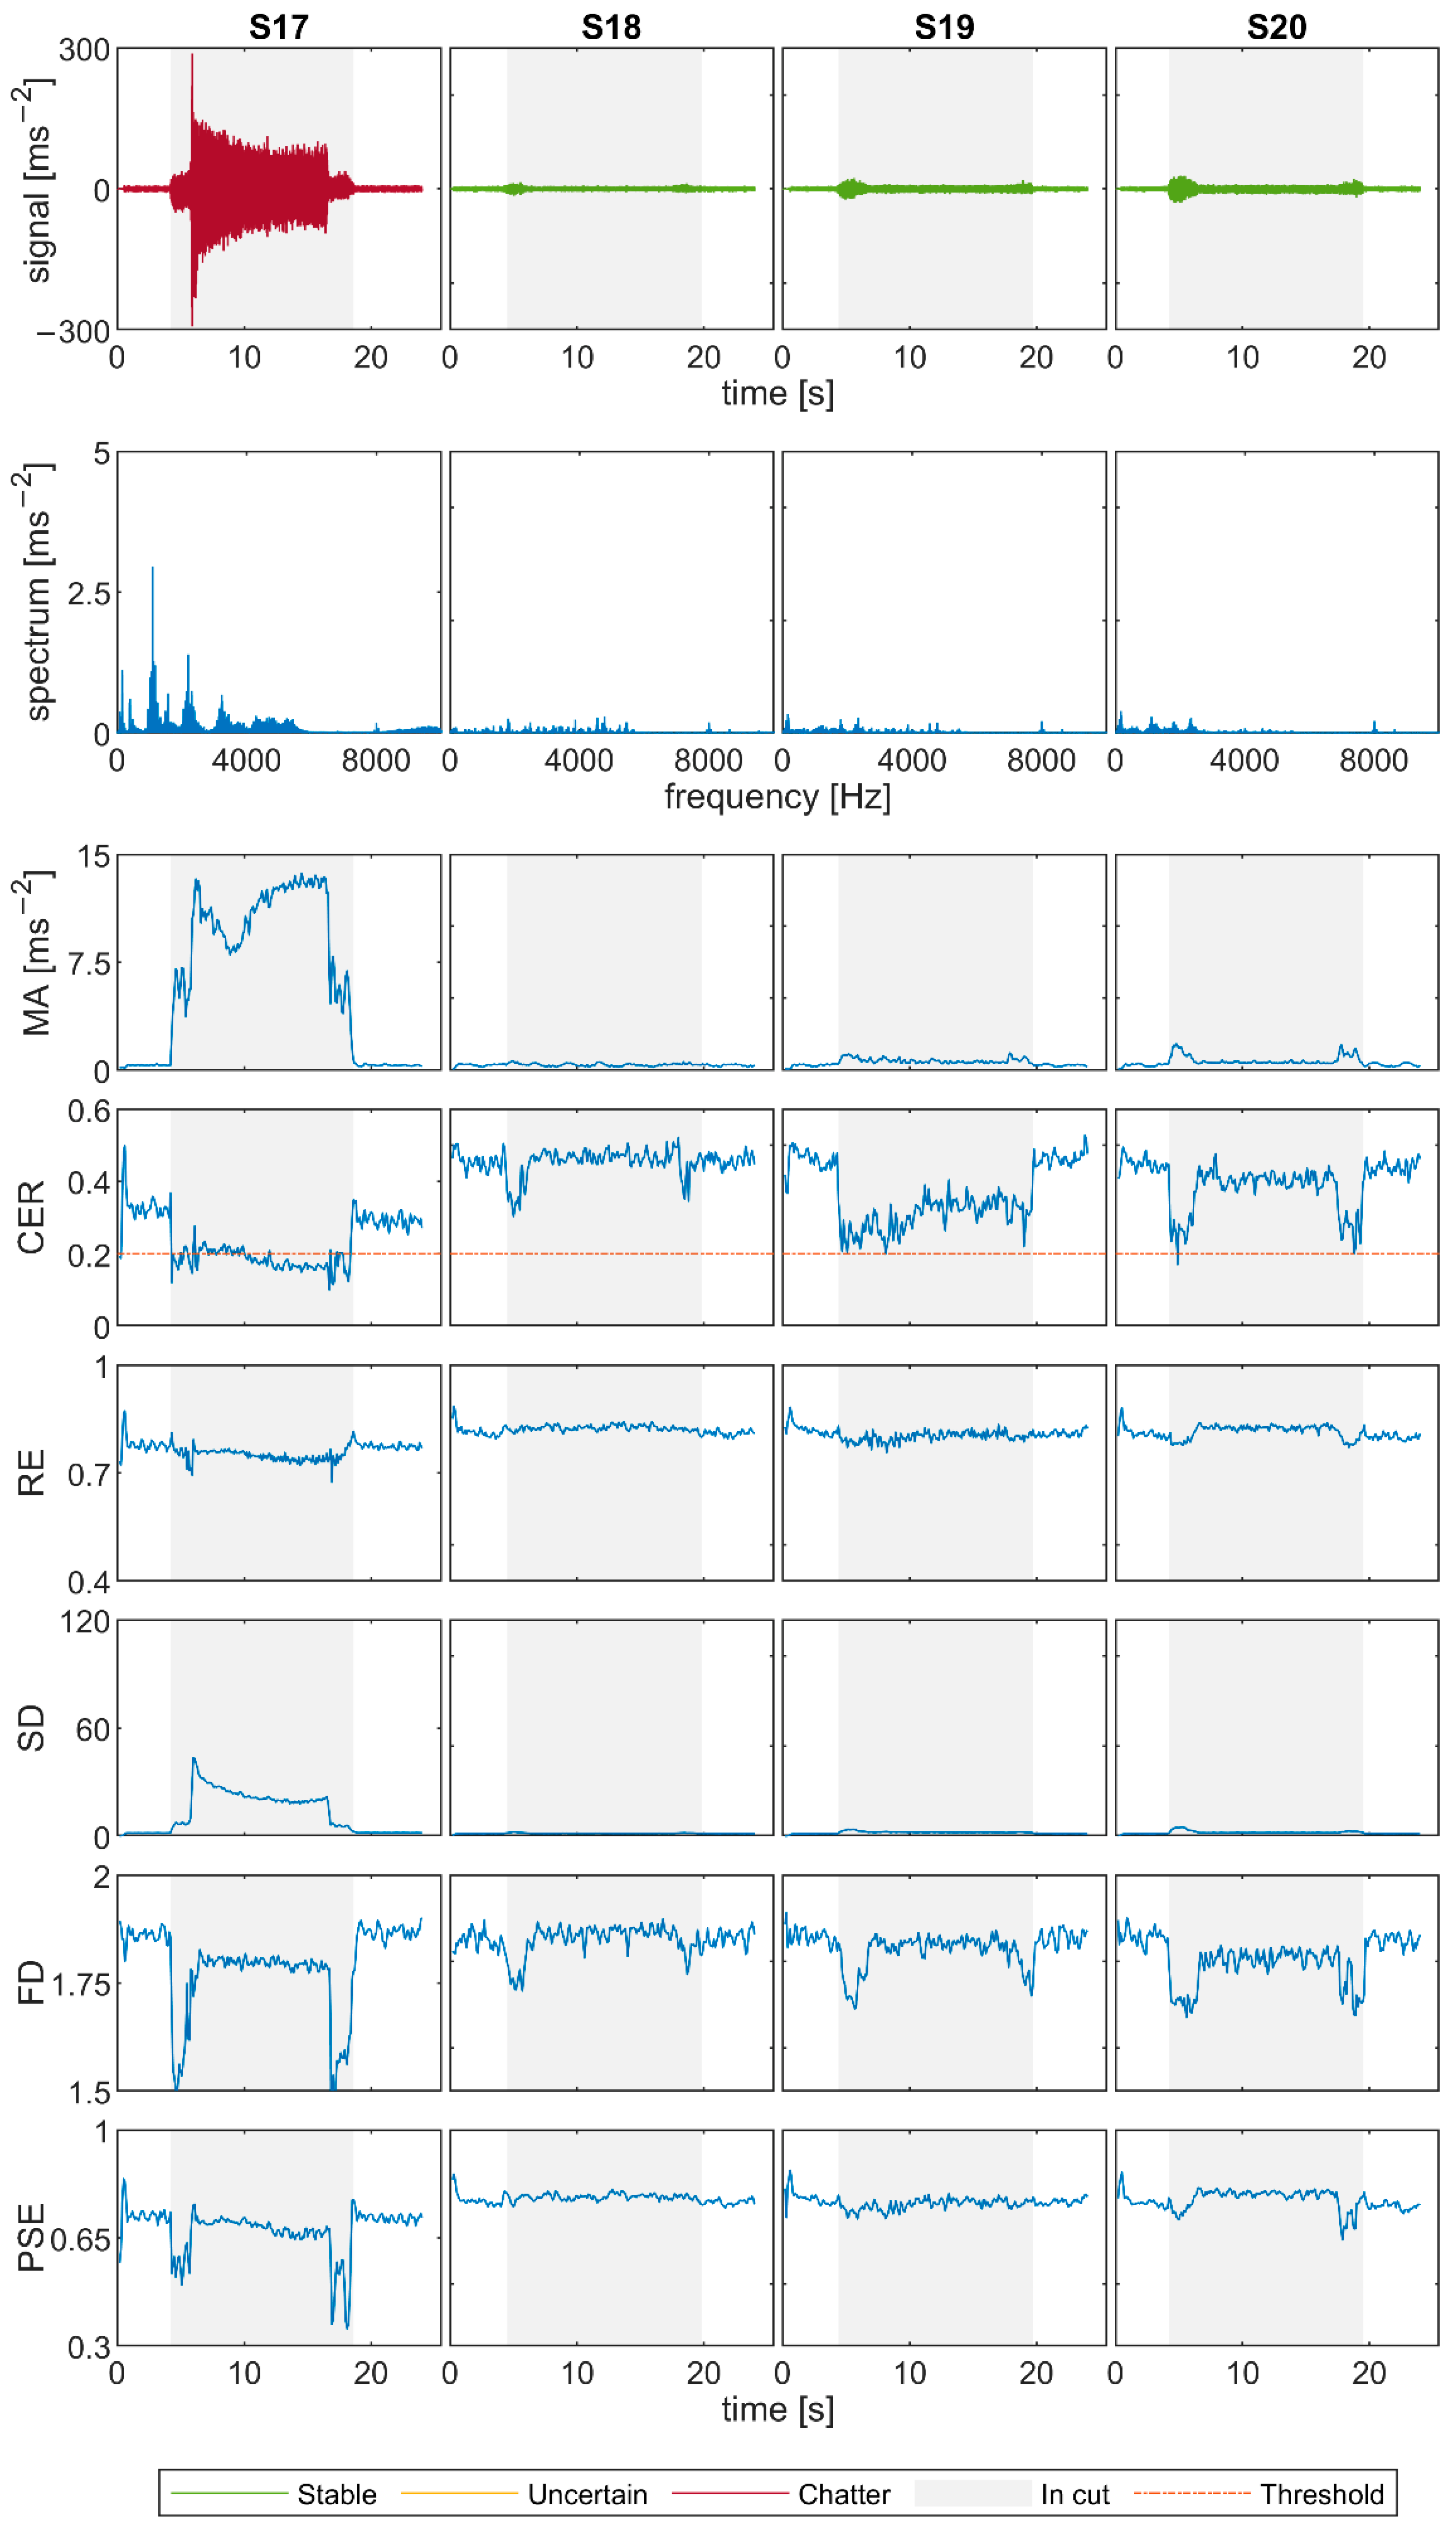
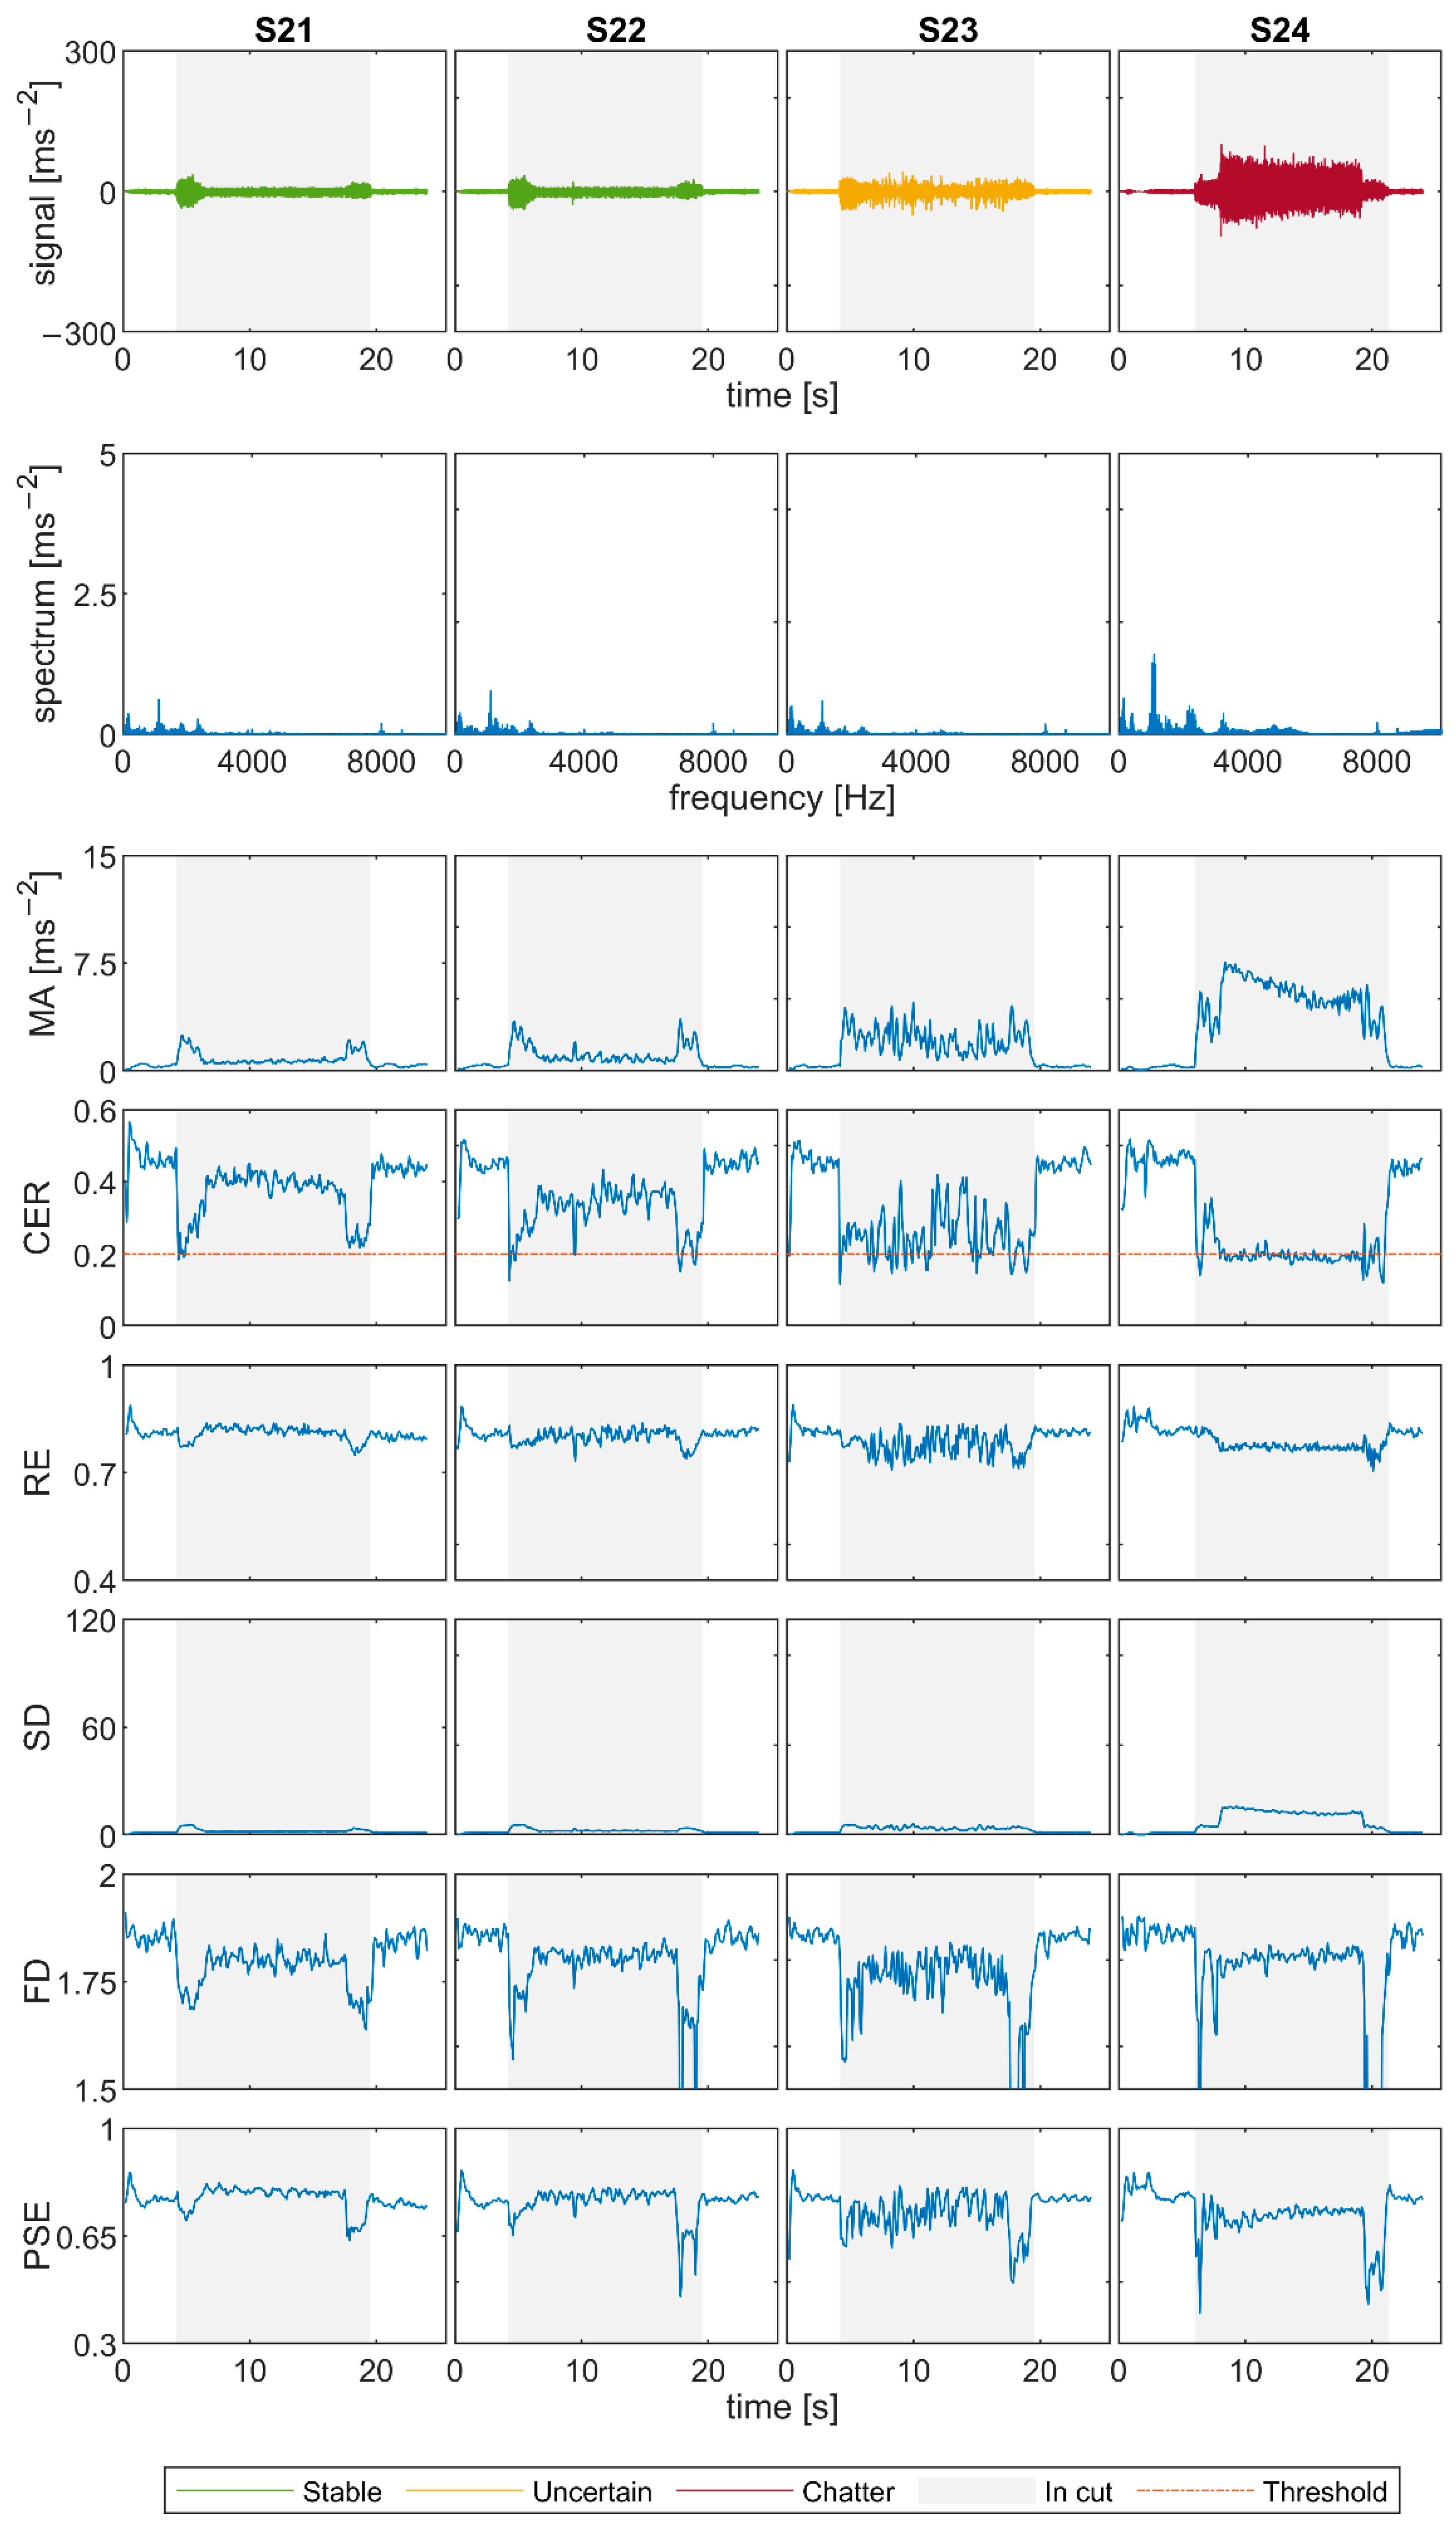
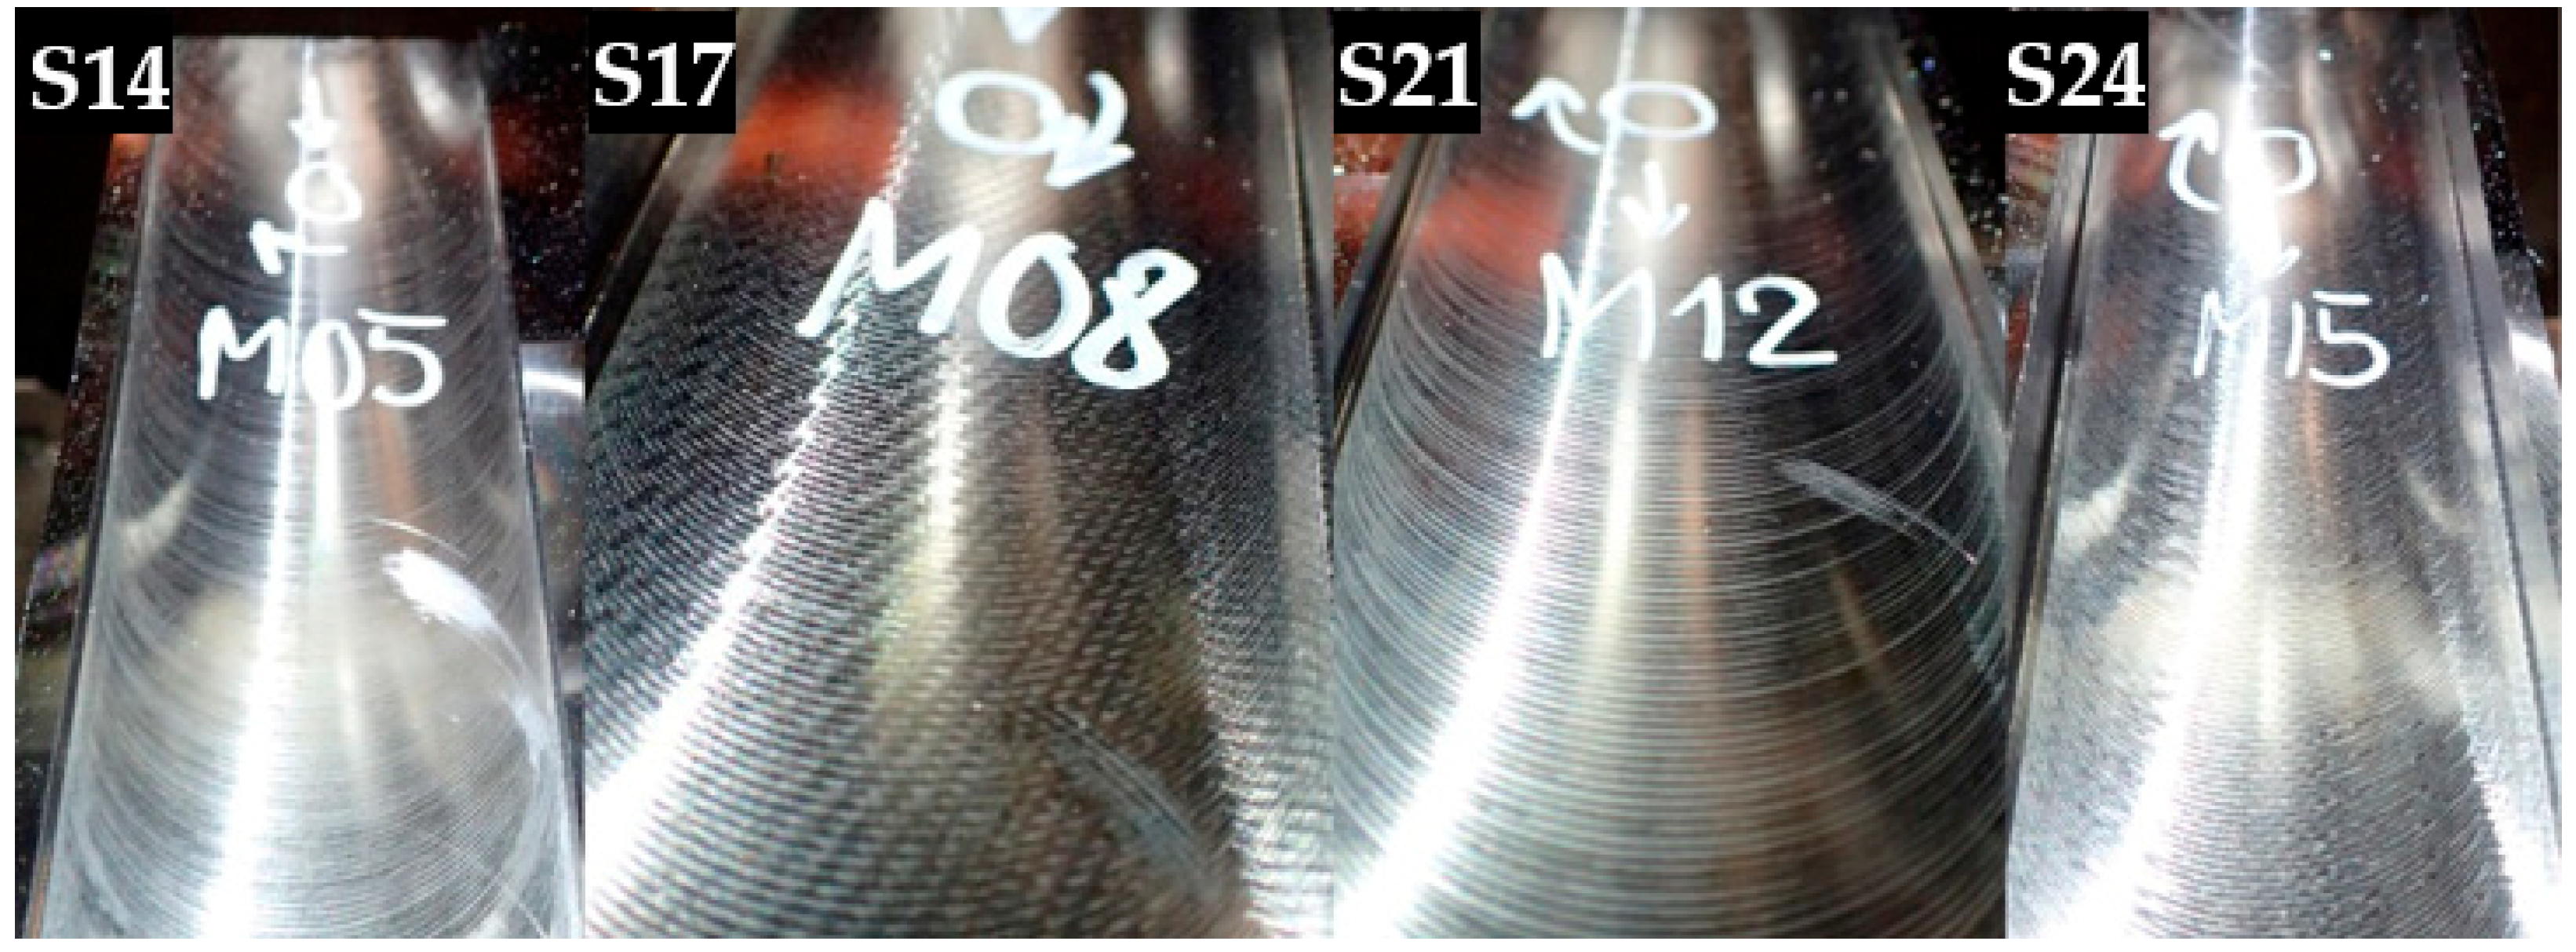
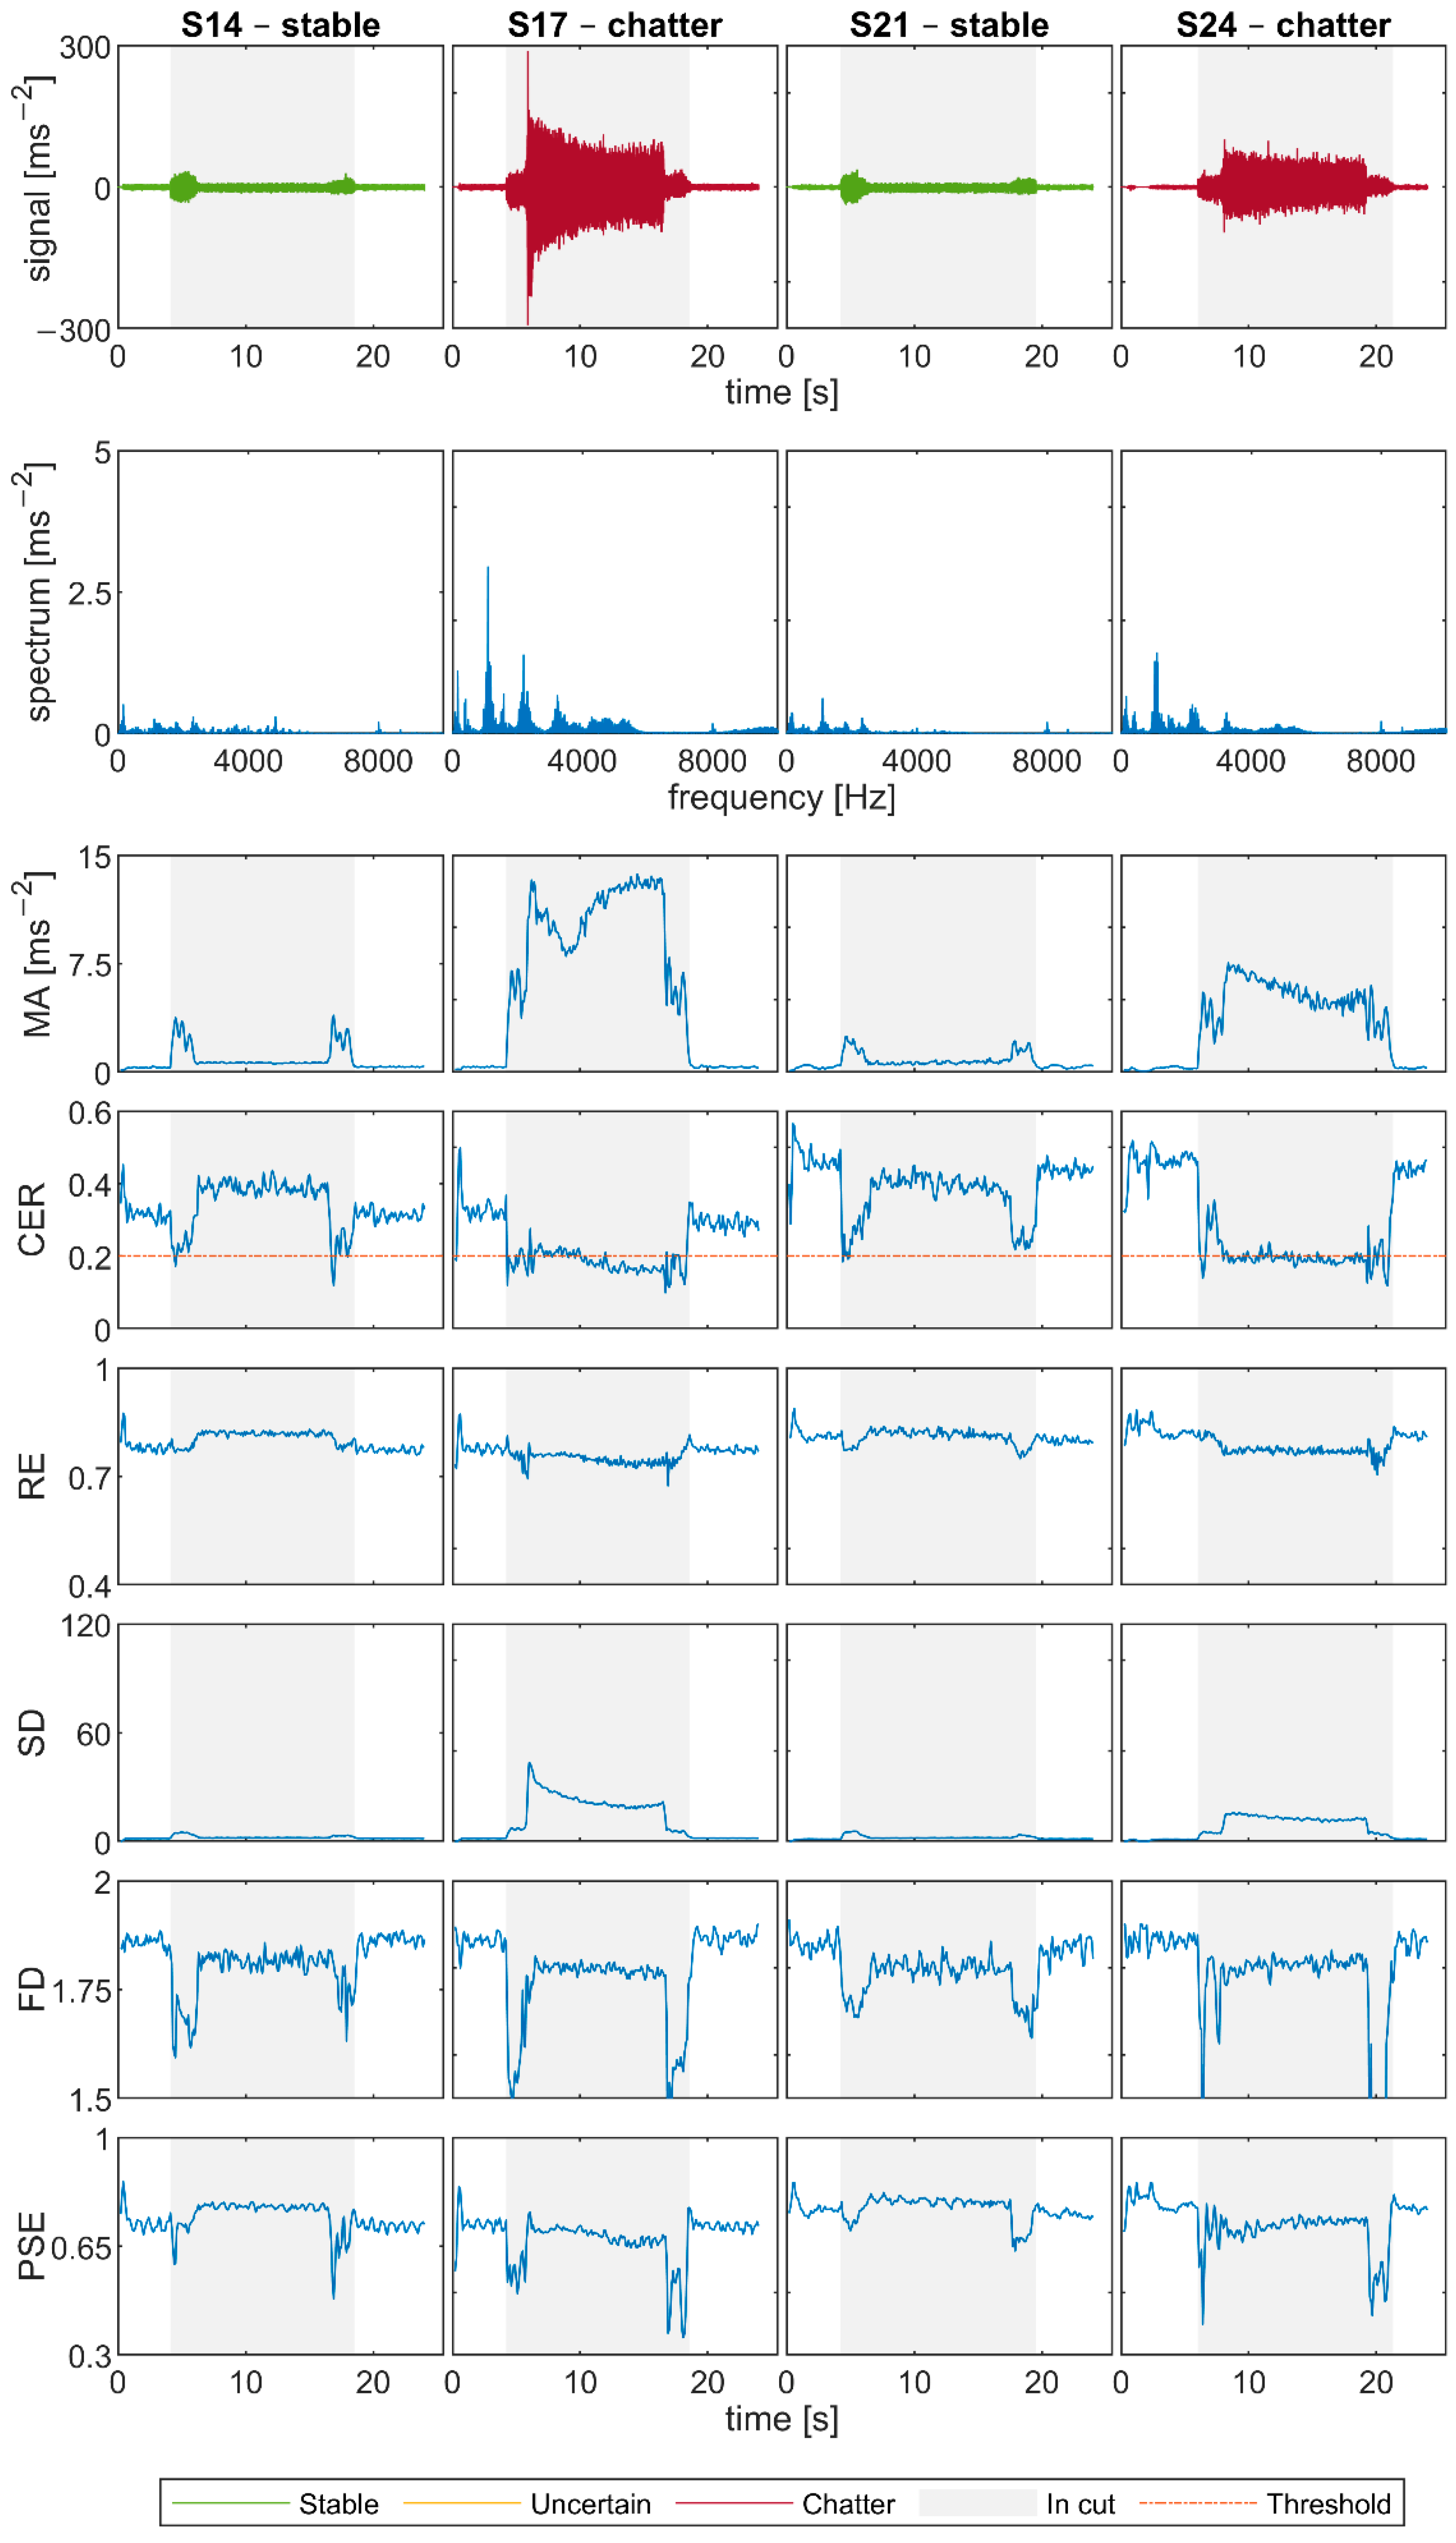
Stable tests S14 and S21 and unstable S17 and S24 were chosen from Experiment 3, see Figure 11 for the surface quality and Figure 12 for the signals. Due to the diameter of the cutting tool of 50 mm, which is bigger than in Experiments 1 and 2, the graphs are quite different. The transition state between the air-cut and the cutting part takes longer, and so the discrepant values on the borders of the grey area of the graphs are more noticeable. Moreover, the chatter frequencies of unstable signals are lower and with smaller amplitudes. Nevertheless, there is still a significant difference between the spectral characteristics and the surface quality of stable S14 and S21 and unstable S17 and S24.
For the chosen signals, all indicators except FD more or less decisively state if the tests are stable or unstable, based on the comparison with the air-cut values. FD looks smoother for S17 and S24 as for previous unstable signals, but it is even slightly lower than for S14 and S21, which is the opposite of the indicator’s expected behavior in case of chatter. RE and PSE have similar values for all four signals, with PSE showing slightly greater differences. Nevertheless, for S17 and S24, they are lower than in stable cases, and moreover they both decrease in comparison with the air-cut values. This suggests that although the exact values depend on the cutting conditions, it might be reasonable to compare the in-cut and air-cut values of these indicators. SD increases significantly for chatter cases as supposed. Lastly, CER stays high above the threshold 0.2 for S14 and S21, and it decreases sharply for signals S17 and S24, even though it is less apparent than in Experiments 1 and 2, and in some parts its value rather oscillates around the threshold.

5. Discussion of Results and Methods Comparison

One of the main objectives was to select a suitable in-process chatter indicator and test its robustness with respect to different tools and their respective cutting force loadings. Although intuitively it was expected that the chatter detection efficiency would be higher for rigid roughing tools with higher force loads and low compliance between the tool tip and accelerometer position, on the contrary, higher sensitivity of the indicators was observed for the slender cutting tool. Below is a summary of the indicators used and their evaluation.
Coarse-grained entropy rate (CER) proved to be a robust method that identifies chatter for various cutting conditions. Its values in the transition parts of the signal during the start and end of the cut might be unreliable and falsely detect chatter even in stable cases (as in S14 and S21). However, once the cutting tool is fully in cut, CER value indicates whether the chatter appears or not. Therefore, it might be reasonable to use some combination with other criteria (e.g., spindle torque) to decide whether the tool is fully in cut or not. The threshold proposed in [29], although identified for turning, worked well also for the milling experiments in this paper. For the chosen signals, CER value in the cut was always significantly above the threshold in stable cases and below for chatter, except for S17 and S24 where it was comparable with the threshold value in a part of the cutting. See Figure A1, Figure A2, Figure A3, Figure A4 and Figure A5 in Appendix A for more examples.
Rényi entropy (RE) consistently identifies chatter in Experiments 1 and 2 performed with the slender end mill; however, the indicator is less decisive in Experiment 3 performed with the shoulder mill where the values are very similar for stable and unstable machining. It can be concluded that this method is more dependent on the tool dynamic properties. Presented experiments and the cited paper [31] suggest that it works well in the case of a slender cutting tool (a cutting tool of diameter 16 mm was used in Experiments 1 and 2, and a cutting tool of diameter 10 mm was used in the cited paper), while it is less reliable for a massive cutting tool (the cutting tool in Experiment 3 had diameter 50 mm). Computation of RE is very fast (see Table 2), but it requires information about the spindle speed and number of teeth which would need to be set for each machining operation when used in industry.
In the case of the multi-indicators method, the standard deviation (SD) appears sensitive at first sight, but its disadvantage is its dependence on the absolute magnitude of the vibration. Without a close knowledge of the dynamics of the machine, tool and process, it would be difficult to set a generally valid threshold for chatter.
The difference between power spectral entropy (PSE) values in stable and in unstable machining is very significant in the case of end mill measurements and less notable in shoulder mill measurements. Similarly, as CER, PSE does not give decisive results in S17 and S24. However, overall it is a consistent method, and it is less dependent on cutting conditions than RE.
Finally, fractal dimension (FD) was not found to be useful compared to other methods. It can be stated that it recognizes chatter in case S08, but it is less convincing than any other method. In other cases, it has similar values for both stable and unstable machining, or it is even lower for the unstable machining, which is the opposite of the expected behavior. Considering also that computing FD is incomparably more demanding than the other methods (see Table 2), we cannot confirm this method as being applicable in industry.
The above experiments were performed with accelerometer data acquired at a sampling rate of 32.768 kHz. This value is high enough even for relatively slender tools with high eigenfrequencies. The time interval of each evaluation was 0.2 s.
In terms of real-time processing, all methods except FD can be used according to the comparison performed. For practical deployment, one of the available platforms of industrial PC manufacturers, e.g., Beckhoff Automation or the cRIO platform (National Instruments Corp.), is considered. These allow both the implementation of the necessary fast calculations and the connection of an accelerometer or other additional signals (e.g., spindle torque). At the same time, communication with the machine tool can be implemented to ensure the machine’s response to the chatter detection.

6. Conclusions

This paper deals with the study of methods for the online identification of chatter in milling, with the main aim of testing their robustness for practical applications. Each selected method uses a chatter indicator assessing signal entropy, energy, or fragmentation, and is suitable for processing acceleration signals. The novelty of the paper is the comparison of the performance of the methods for both rigid and slender cutting tools, which differ significantly in dynamic compliance. Furthermore, the computational complexity of the algorithms was evaluated with respect to the considered online application.
Specifically, the methods compared are coarse-grained entropy rate (CER), Rényi entropy (RE), standard deviation (SD), fractal dimension (FD) and power spectral entropy (PSE). Their assessment was performed post-process on a set of accelerometer measurements from three different experiments. In total, 24 different milling records at different cutting conditions were evaluated. A detailed overview of the conditions is given in Table 2 and Table A1.
Of the criteria tested, the CER criterion appears to be the most useful, showing the ability to reliably detect chatter at different cutting conditions and on both cutting tools, which represent systems with different dynamics. At the same time, this criterion allows relatively fast computation and is therefore suitable for deployment in online chatter detection. A certain problem in practical deployment is the possibility of false detection of instability during transients when the instrument enters and exits the cut. For this reason, it seems appropriate to combine the CER criterion with one of the other criteria. Such a criterion could be, for example, the variation of the milling spindle load.
The transmission of vibrations from the process to the location of the accelerometer in the spindle unit of the machine tool is significantly affected by the tool compliance. One of the main contributions of this study is the testing of the robustness and effectiveness of the presented algorithms for various cutting tools and cutting conditions.
Prospectively, similar measurements are planned on larger machines for which the peaks of dominant compliance may be at orders of magnitude lower frequencies and, conversely, on even more slender long cutting tools where the transmission of tool vibration to the spindle, where the accelerometer is located, could be an issue. For the slender end mills used in the experiments performed here, this negative effect was not observed to be significant for the chatter detection.
Supplementary Materials

The following supporting information can be downloaded at https://www.mdpi.com/article/10.3390/jmmp6050125/s1; The FRFs for each cutting tool are available as electronic supplementary material in mat format

Author Contributions

Conceptualization, L.N., J.F., M.M. and M.S.; data curation, B.H.; formal analysis, B.H., L.N. and J.F.; funding acquisition, M.M. and M.S.; investigation, L.N. and J.F.; methodology, L.N., J.F. and M.S.; project administration, M.M. and M.S.; resources, L.N. and J.F.; software, B.H.; supervision, M.S.; validation, B.H., L.N. and J.F.; visualization, B.H.; writing—original draft, B.H., L.N. and J.F.; writing—review and editing, B.H., L.N., J.F., M.M. and M.S. All authors have read and agreed to the published version of the manuscript.

Funding

The authors would like to acknowledge funding support from the Czech Ministry of Education, Youth and Sports under the project CZ.02.1.01/0.0/0.0/16_026/0008404 “Manufacturing Technology and Precision Engineering” financed by the OP RDE (ERDF). The project is also co-financed by the European Union.

Data Availability Statement

Not applicable.

Acknowledgments

The authors would like to thank Miroslav Janota for performing the experiments and modal testing, and Tereza Matvijová for her help with writing the code for computing the chatter indicators.

Conflicts of Interest

The authors declare no conflict of interest. The funders had no role in the design of the study; in the collection, analyses, or interpretation of data; in the writing of the manuscript; or in the decision to publish the results.

Appendix A

Table A1. Cutting conditions for all performed tests. Stability is the evaluation based on the surface quality.
Experiment 1: slender end mill, overhang 50 mm
n [1/min]vc [m/min]fz [mm]ae [mm]ap [mm]stability
S0129841500.1160.5stable
S0221881100.1160.5stable
S0337801900.1160.5uncertain
S0429841500.1161.0uncertain
S0521881100.1161.0uncertain
S0637801900.1161.0chatter
Experiment 2: slender end mill, overhang 30 mm
n [1/min]vc [m/min]fz [mm]ae [mm]ap [mm]stability
S0729841500.1162.0stable
S0821881100.1162.0chatter
S0937801900.1162.0stable
S1029841500.1163.0chatter
S1137801900.1163.0uncertain
Experiment 3: shoulder mill
n [1/min]vc [m/min]fz [mm]ae [mm]ap [mm]stability
S129551500.15500.5stable
S139551500.15501.0stable
S149551500.15501.5stable
S159551500.15502.0uncertain
S169551500.15502.5stable
S179551500.15503.0chatter
S188981410.15500.5stable
S198981410.15501.0stable
S208981410.15501.5stable
S218981410.15502.0stable
S228981410.15502.5stable
S238981410.15503.0uncertain
S248981410.15503.5chatter
Figure A1. Signals from Experiment 1—slender end mill, overhang 50 mm.
Jmmp 06 00125 g0a1
Figure A2. Signals from Experiment 2—slender end mill, overhang 30 mm.
Jmmp 06 00125 g0a2
Figure A3. Signals from Experiment 3—shoulder mill.
Jmmp 06 00125 g0a3
Figure A4. Signals from Experiment 3—shoulder mill.
Jmmp 06 00125 g0a4
Figure A5. Signals from Experiment 3—shoulder mill.
Jmmp 06 00125 g0a5

References

  1. Quintana, G.; Ciurana, J.; Teixidor, D. A new experimental methodology for identification of stability lobes diagram in milling operations. Int. J. Mach. Tools Manuf. 2008, 48, 1637–1645. [Google Scholar] [CrossRef]
  2. Quintana, G.; Ciurana, J. Chatter in machining processes: A review. Int. J. Mach. Tools Manuf. 2011, 51, 363–376. [Google Scholar] [CrossRef]
  3. Yue, C.; Gao, H.; Liu, X.; Liang, S.Y.; Wang, L. A review of chatter vibration research in milling. Chin. J. Aeronaut. 2019, 32, 215–242. [Google Scholar] [CrossRef]
  4. Zhu, L.; Liu, C. Recent progress of chatter prediction, detection and suppression in milling. Mech. Syst. Signal Process. 2020, 143, 106840. [Google Scholar] [CrossRef]
  5. Yang, K.; Wang, G.; Dong, Y.; Zhang, Q.; Sang, L. Early chatter identification based on an optimized variational mode decomposition. Mech. Syst. Signal Process. 2019, 115, 238–254. [Google Scholar] [CrossRef]
  6. Tangjitsitcharoen, S.; Pongsathornwiwat, N. Development of chatter detection in milling processes. Int. J. Adv. Manuf. Technol. 2013, 65, 919–927. [Google Scholar] [CrossRef]
  7. Li, K.; He, S.; Li, B.; Liu, H.; Mao, X.; Shi, C. A novel online chatter detection method in milling process based on multiscale entropy and gradient tree boosting. Mech. Syst. Signal Process. 2020, 135, 106385. [Google Scholar] [CrossRef]
  8. Mohammadi, Y.; Ahmadi, K. Frequency domain analysis of regenerative chatter in machine tools with Linear Time Periodic dynamics. Mech. Syst. Signal Process. 2019, 120, 378–391. [Google Scholar] [CrossRef]
  9. Rahimi, M.H.; Huynh, H.N.; Altintas, Y. On-line chatter detection in milling with hybrid machine learning and physics-based model. CIRP J. Manuf. Sci. Technol. 2021, 35, 25–40. [Google Scholar] [CrossRef]
  10. Lamraoui, M.; El badaoui, M.; Guillet, F. Chatter Detection in CNC Milling Processes Based on Wiener-SVM Approach and Using Only Motor Current Signals. Mech. Mach. Sci. 2014, 23, 567–578. [Google Scholar] [CrossRef]
  11. Tansel, I.N.; Li, M.; Demetgul, M.; Bickraj, K.; Kaya, B.; Ozcelik, B. Detecting chatter and estimating wear from the torque of end milling signals by using Index Based Reasoner (IBR). Int. J. Adv. Manuf. Technol. 2012, 58, 109–118. [Google Scholar] [CrossRef]
  12. Yamato, S.; Nakanishi, K.; Suzuki, N.; Kakinuma, Y. Development of Automatic Chatter Suppression System in Parallel Milling by Real-Time Spindle Speed Control with Observer-Based Chatter Monitoring. Int. J. Precis. Eng. Manuf. 2021, 22, 227–240. [Google Scholar] [CrossRef]
  13. Aslan, D.; Altintas, Y. On-line chatter detection in milling using drive motor current commands extracted from CNC. Int. J. Mach. Tools Manuf. 2018, 132, 64–80. [Google Scholar] [CrossRef]
  14. Urbikain, G.; de Lacalle, L.L. MoniThor: A complete monitoring tool for machining data acquisition based on FPGA programming. SoftwareX 2020, 11, 100387. [Google Scholar] [CrossRef]
  15. Fujishima, M.; Mori, M.; Nishimura, K.; Ohno, K. Study on Quality Improvement of Machine Tools. Procedia CIRP 2017, 59, 156–159. [Google Scholar] [CrossRef]
  16. Fujishima, M.; Mori, M.; Narimatsu, K.; Irino, N. Utilisation of IoT and sensing for machine tools. J. Mach. Eng. 2019, 19, 38–47. [Google Scholar] [CrossRef]
  17. Cao, H.; Zhang, X.; Chen, X. The concept and progress of intelligent spindles: A review. Int. J. Mach. Tools Manuf. 2017, 112, 21–52. [Google Scholar] [CrossRef]
  18. Kuljanic, E.; Sortino, M.; Totis, G. Multisensor approaches for chatter detection in milling. J. Sound Vib. 2008, 312, 672–693. [Google Scholar] [CrossRef]
  19. Albertelli, P.; Braghieri, L.; Torta, M.; Monno, M. Development of a generalized chatter detection methodology for variable speed machining. Mech. Syst. Signal Process. 2019, 123, 26–42. [Google Scholar] [CrossRef]
  20. Chen, D.; Zhang, X.; Zhao, H.; Ding, H. Development of a novel online chatter monitoring system for flexible milling process. Mech. Syst. Signal Process. 2021, 159, 107799. [Google Scholar] [CrossRef]
  21. Kolář, P.; Janota, M.; Švéda, J.; Kozlok, T. Method for Safe Experimental Testing of Machine Tool Usable Spindle Power. MM Sci. J. 2021, 2021, 5167–5174. [Google Scholar] [CrossRef]
  22. Cao, H.; Zhou, K.; Chen, X. Chatter identification in end milling process based on EEMD and nonlinear dimensionless indicators. Int. J. Mach. Tools Manuf. 2015, 92, 52–59. [Google Scholar] [CrossRef]
  23. Fu, Y.; Zhang, Y.; Zhou, H.; Li, D.; Liu, H.; Qiao, H.; Wang, X. Timely online chatter detection in end milling process. Mech. Syst. Signal Process. 2016, 75, 668–688. [Google Scholar] [CrossRef]
  24. Wan, S.; Li, X.; Chen, W.; Hong, J. Investigation on milling chatter identification at early stage with variance ratio and Hilbert-Huang transform. Int. J. Adv. Manuf. Technol. 2018, 95, 3563–3573. [Google Scholar] [CrossRef]
  25. Chen, Y.; Li, H.; Hou, L.; Bu, X.; Ye, S.; Chen, D. Chatter detection for milling using novel p-leader multifractal features. J. Intell. Manuf. 2020, 33, 121–135. [Google Scholar] [CrossRef]
  26. Li, X.; Wan, S.; Huang, X.; Hong, J. Milling chatter detection based on VMD and difference of power spectral entropy. Int. J. Adv. Manuf. Technol. 2020, 111, 2051–2063. [Google Scholar] [CrossRef]
  27. Zhang, Z.; Li, H.; Meng, G.; Tu, X.; Cheng, C. Chatter detection in milling process based on the energy entropy of VMD and WPD. Int. J. Mach. Tools Manuf. 2016, 108, 106–112. [Google Scholar] [CrossRef]
  28. Paluš, M. Coarse-grained entropy rates for characterization of complex time series. Phys. D Nonlinear Phenom. 1996, 93, 64–77. [Google Scholar] [CrossRef] [Green Version]
  29. Gradišek, J.; Govekar, E.; Grabec, I. Using coarse-grained entropy rate to detect chatter in cutting. J. Sound Vib. 1998, 214, 941–952. [Google Scholar] [CrossRef]
  30. Jiang, Y.X.; Du, B.; Zhang, P.; Deng, S.P.; Qi, Y.M. Online Monitoring Recognition Theory Based on the Time Series of Chatter. Adv. Mater. Res. 2013, 819, 160–164. [Google Scholar] [CrossRef]
  31. Chen, Z.; Li, Z.; Niu, J.; Zhu, L. Chatter detection in milling processes using frequency-domain Renyi entropy. Int. J. Adv. Manuf. Technol. 2020, 106, 877–890. [Google Scholar] [CrossRef]
  32. Ji, Y.; Wang, X.; Liu, Z.; Wang, H.; Jiao, L.; Wang, D.; Leng, S. Early milling chatter identification by improved empirical mode decomposition and multi-indicator synthetic evaluation. J. Sound Vib. 2018, 433, 138–159. [Google Scholar] [CrossRef]
  33. Caliskan, H.; Kilic, Z.M.; Altintas, Y. On-Line Energy-Based Milling Chatter Detection. J. Manuf. Sci. Eng. 2018, 140, 111012. [Google Scholar] [CrossRef]
  34. Budak, E.; Altintas, Y. Analytical Prediction of Chatter Stability in Milling—Part 1: General Formulation. J. Dyn. Syst. Meas. Control 1998, 120, 22–30. [Google Scholar] [CrossRef]
Figure 1. Experimental setup and position of the sensor on the spindle. The uniaxial accelerometer is oriented in the Y direction (detail on the right side).
Jmmp 06 00125 g001
Figure 2. Cutting tools used for chatter identification: (a) Iscar E90AN, (b) Walter F4042.
Jmmp 06 00125 g002
Figure 3. Dynamic properties at the tool tip. (a) Rigid shoulder mill Walter F4042 of 50 mm diameter. (b) End mill Iscar E90AN, 16 mm diameter, 50 mm overhang. (c) End mill Iscar E90AN, 16 mm diameter, 30 mm overhang.
Jmmp 06 00125 g003
Figure 4. Workpiece FRF at directions X and Y for before and after machining tests.
Jmmp 06 00125 g004
Figure 5. Stability lobe diagram for the slender end mill Iscar E90AN based on measured FRF and compared with machining stability tests: overhang L = 50 mm (Experiment 1).
Jmmp 06 00125 g005
Figure 6. Stability lobe diagram for the slender end mill Iscar E90AN based on measured FRF and compared with machining stability tests: overhang L = 30 mm (Experiment 2).
Jmmp 06 00125 g006
Figure 7. Stability lobe diagram for the rigid shoulder mill Walter F4042 based on measured FRF and compared with machining stability tests (Experiment 3).
Jmmp 06 00125 g007
Figure 8. Detail of signal S07. Spindle switched on (1), air-cut (2), start of cut (3), full cut (4), end of cut (5), air-cut (6), spindle switched off (7), noise (8). The grey area shows where the cutting tool is in the cut.
Jmmp 06 00125 g008
Figure 9. Surfaces from Experiments 1 and 2. The measurements S02 and S07 were identified as stable according to the surface, S06 and S08 as chatter.
Jmmp 06 00125 g009
Figure 10. Signals from Experiment 1, slender end mill, overhang 50 mm: stable signal S02, chatter in signal S06. Signals from Experiment 2, slender end mill, overhang 30 mm: stable signal S07, chatter in signal S08.
Jmmp 06 00125 g010
Figure 11. Surfaces from Experiment 3. The measurements S14 and S21 were identified as stable according to the surface, S17 and S24 as chatter.
Jmmp 06 00125 g011
Figure 12. Signals from Experiment 3, shoulder mill. Stable signals S14, S21, chatter in signals S17, S24.
Jmmp 06 00125 g012
Table 1. Summary of performed experiments.
Experiment 1Experiment 2Experiment 3
Cutting toolIscar HP E90AN-D16-4-C16-07-CWalter F4042.B.050.Z05.15
TypeEnd-millShoulder mill
Diameter16 mm50 mm
Length90 mm40 mm
No. teeth45
InsertsHP ANKT 070208PNTRADMT160608R-F56
HolderPILANA MCT 40xER32 DLWalter SK40 D22 A52
Overhang50 mm30 mm71 mm
SignalsS01–S06S07–S11S12–S24
Table 2. Average time required for computation of 1 indicator value from 0.2 s time interval.
CERRESDFDPSE
0.0046 s0.0005 s0.0884 s0.7933 s0.0888 s
Publisher’s Note: MDPI stays neutral with regard to jurisdictional claims in published maps and institutional affiliations.