1. Introduction
In spite of many years of active study of the anomalous phenomena observed in geophysical fields before earthquakes, the problem of forecasting powerful earthquakes still remains rather urgent and demands special attention. One of the most significant markers of an approaching earthquake is the intensification of the release of the radioactive gases
Rn,
Rn, and their short-lived daughter products from rocks under the stimulating influence of the changes in the strained lithosphere medium during the period of earthquake preparation. This phenomenon was reported in many investigation works, which were accomplished in a variety of seismically active regions [
1,
2,
3,
4,
5,
6]. According to [
7], in the seismic region of Northern Tien Shan, usually an earthquake preparation process starts to reveal itself among the radon exhalation data (3–4) months before the seismic event, and is especially clearly manifested (1–2) weeks before the earthquake.
For the detection of anomalies of radon emanation of seismic origin, it is convenient to use the registration of the intensity of gamma radiation emitted by the radioactive nuclei-products of the
Rn decay [
8]. The method of gamma radiation monitoring in the energy range of tens of keV—a few MeV has shown itself as an effective indirect tool for monitoring the current radon content and the timely detection of the indications of possible earthquakes. For example, a significant increase in the level of radiation background was observed a few days before the M5.2 and M6.7 earthquakes in Northern Taiwan [
9]. An anomalous rise in gamma ray intensity was also detected some days before the local earthquake swarms in the East of Taiwan in March and May 2014 and during the two weeks preceding the M5.9 Fangly earthquake. After the exclusion of the possible temperature effect, the authors [
10] supposed the prognostic significance of these radiation increases. In [
11], it is shown that a single strong earthquake or a swarm of close local earthquakes can influence the gamma ray background even outside of seismically active regions.
Nevertheless, in a number of studies, such as [
4,
12,
13], the authors stressed the selection difficulty of the impact of the processes of seismological origin on the radon concentration among the multitude of different effects of non-tectonic nature, such as soil humidity, precipitation, etc. The interfering effects can cause fluctuations in radon content in the near-surface atmosphere similar to the earthquake precursors or mask the real release of radon from the depth of the lithosphere, which can be restored only through a special mathematic procedure [
14]. As an illustration, in [
15], the dependence of radon emanation on the weather was found even at a level ∼10 m deep under the surface of the ground. According to [
16], the majority of anomalies observed during the pre-earthquake period in the records of gamma ray intensity might be connected with meteorological, hydrological, and other environmental phenomena instead of seismic processes, since the radiation time series reflect a wide spectrum of various physical effects. The direct influence of the weather and other local factors on the intensity of radiation background was demonstrated in many publications, e.g., [
11,
15,
17,
18,
19]. Consequently, processing the prolonged time series of radon concentration measurements demands the application of specific mathematical methods [
10,
14,
18].
The literature data of recent decades are convincing regarding the necessity of comprehensively monitoring the parameters of the geophysical environment in order to prove or disprove the involvement of identified anomalies in the earthquake preparation process. Increased attention has been paid to the study of the relationship between the dynamics of lithospheric processes and the appearance of disturbances in the ionosphere that precede large earthquakes [
20,
21,
22,
23]. Comprehensive monitoring makes it possible to trace the relationship between the deformation of the earth’s crust, radon exhalation, and gamma radiation. The rise of radiation background in the near-surface atmosphere leads to ionization of the atmospheric boundary layer, which, according to the authors of the lithosphere-atmosphere-ionosphere coupling concept [
24,
25,
26], is one of the initial links in the chain of disturbance propagation from the lithosphere up to ionospheric heights.
There exist numerous appropriate methods for the investigation of seismo-ionospheric disturbances, among which the radiophysics method of Doppler ionosphere sounding is one of the most effective [
24,
25,
26,
27,
28,
29]. The method of Doppler sounding at a low-inclined radio pass is also used in the present work [
30].
An important condition for research on seismogenic anomalies in geophysical fields is the localization of the measuring equipment near the sources of strong earthquakes. Such is the geographical region of the mountain ridges Zailiysky Alatau and Kungey Alatau in Northern Tien Shan, which encompasses the sources of several disastrous earthquakes: the Vernen (M7.3, 1887), Chilick (M8.3, 1889), and Kemin (M8.2, 1911) earthquakes. Here resides an experimental base of the Institute of the Ionosphere, the “Orbita” radio-polygon (N43.05831, E76.97361; 2750 m above the sea level), and the Tien Shan mountain scientific station of the Lebedev Physical Institute (N43.03519, E76.94139; 3340 m a.s.l.).
Another prerequisite for the said research activity was the existence of a multipurpose experimental complex at the Tien Shan mountain station, which includes the detectors of high-energy cosmic rays, the gamma and neutron detectors, a weather station, acoustic receivers, etc., all well suitable for prolonged multichannel monitoring of the surrounding environmental background [
31,
32,
33]. Additionally, among these other positive factors, there is the unique location of the Doppler ionosonde at the “Orbita” radio-polygon, which makes ionospheric study possible within a distance of up to (200–250) km from the radio-wave projection point, including the sources of the Vernen and Kemin earthquakes. The main goal of using such a complex combination of investigation methods is to consistently track the propagation in geophysical media of anomalous disturbances of a presumably seismic origin from the lithosphere and up to the lithosphere heights.
Taking into account the rare recurrence of powerful earthquakes, a rather prolonged observation period is needed to confidently verify the connection of any detected anomaly with the preparation process of a earthquake. This circumstance stipulates the necessity of the continuous monitoring of various physical parameters in the surrounding environment, which at the Tien Shan station has been nearly uninterruptedly proceeding during the last decade.
The subject of the publication is to present the results of a complex monitoring of gamma radiation intensity, both in the near-surface atmosphere and at the depth of 40 m in a deep borehole, as well as the Doppler shift measurements of radio wave reflected from the ionosphere. The data presented here were acquired on the eve of several earthquakes. Additionally, the possibility is discussed of the propagation of the revealed seismogenic disturbances over the chain of lithosphere-atmosphere-ionosphere coupling.
2. Experimental Technique
2.1. Detectors of the Gamma Radiation Background
For monitoring the intensity of gamma radiation in the surrounding environment of the Tien Shan mountain station, scintillation detectors are used, the sensitive part of which consists of an inorganic NaI(Tl) crystal optically coupled with a photomultiplier tube. Such scintillators have a rather high efficiency, on the order of (20–80)% of gamma ray detection in the energy range of tens of keV—a few MeV.
By registration of radiation intensity, the gamma detectors operate in pulse-counting mode. From the anode output of the photomultiplier tube, electric pulses with their amplitudes proportional to the energy of gamma ray quanta absorbed in the scintillator come to a set of amplitude discriminators with monotonously increasing operation thresholds, which ensure the separate registration of gamma ray signals at once in a number of energy diapasons, starting from 30 keV and going up to (1.5–2) MeV. For each energy range, the procedure of intensity measurement consists of counting, by the means of a digital scaler scheme, the shaped pulses which have come from the output of corresponding discriminator during a fixed exposition time. Typically, the length of exposition in monitoring experiments at the Tien Shan station equals 10 s. As has been revealed in the course of the considered study, such a rather high temporal resolution of the intensity measurement was crucial for the disclosure of the weak and short time variations in the radiation background.
An absolute energy calibration of discriminator thresholds was done using the etalon sources of gamma radiation made on the basis of Am, Na, Co, and Cs radioactive isotopes.
Of the two gamma radiation detectors used in the considered experiment, the one having the scintillator crystal with a size of (ø150 × 110) mm was installed inside a wooden building under a light 1 mm thick iron roof, where the temperature varied between the limits of (10–14) C in dependence of the season of the year. Another one, with the size (ø40 × 40) mm, operated under the surface of the ground at a depth of ∼40 m in a deep borehole (see below).
More detailed descriptions of the detectors applied at the Tien Shan mountain station for monitoring the various kinds of radiation background in the surrounding environment can be found in [
31,
34].
2.2. The Underground Detectors in a Deep Borehole
At the territory of the Tien Shan mountain station, at an altitude of 3340 m a.s.l., there exists a borehole which is convenient to use for the investigation of seismogenic effects. The total depth of the borehole is of about 300 m; its bottom part is filled with water up to level of ∼150 m. There are four digital thermometers with automatic temperature recording installed both at the surface of the ground close to the borehole and inside the latter at the levels of 1 m, 25 m, and 40 m.
Additionally, a gamma detector with a small-sized, (ø40 × 40) mm, scintillator was installed in the borehole at the depth of 40 m with the purpose of monitoring the intensity of gamma radiation in the subsoil layers of rock. It was found that, at this depth, the temperature remains nearly constant during the whole year and equals (2.500 ± 0.001) C. Thus, the temperature conditions inside the borehole ensure the stable operation of both the scintillation detector and its electronic equipment. Besides temperature stability, such a disposition of the detector deep underground permits if to avoid the influence of local weather on the measured radiation background.
The counting rate registration of the signals from the gamma detector placed in the borehole is made quite in the same way as for the detectors operating at the surface of the ground. The analog discriminator part of the electronic equipment is hosted in a light cabin near the upper end of the borehole and is kept there under stabilized temperature conditions of (20 ± 0.25), independently of the season of the year. The transmission of the analog pulse signals from the depth of the detector location up to the discriminator board is made over a pair of twisted wires connected to an operational amplifier with differential inputs.
Another piece of experimental equipment installed in the borehole is a microphone for continuous monitoring of the level of acoustic noises of presumably seismic origin. The microphone, with a sensitivity of 25 mV/Pa in the frequency range of (0.5–10) kHz, was placed at a depth of 50 m. Its analogue output signal is transmitted to the surface via a symmetric connection line made of a pair of twisted wires. The operation of the signal is made by an integrated circuitry of 12-bit analog-to-digital conversion (ADC) placed in a cabin, which is installed near the upper opening of the borehole. Taking into account the microphone sensitivity parameter of 25 mV/Pa and the amplification coefficient of the analogue electronic tract, which stands before the ADC input, the ADC code corresponds to an absolute value of acoustic pressure p of about 0.05 Pa (3 dB) in the point of the microphone disposition, while corresponds to Pa (4 dB). The highest possible code for 12-bit conversion, , corresponds to a pressure of Pa (5 dB).
Throughout the measurement time, the digitization of the microphone signal gone on continuously with a moderate periodicity of 1 ms (1 kHz). To allow the digitization period to agree more adequately with the range of the microphone sensitivity, an integral envelope of the signal was detected immediately during the measurements and recorded along the original signal. This detection was made by an active low-pass analogue filter, which was included in the electronic tract of signal operation. The integration time constant of the filter circuit equals 7 ms, i.e., to a few periods of the original signal with its kHz order frequency.
A more detailed description of the acoustic detector is given in [
33,
35].
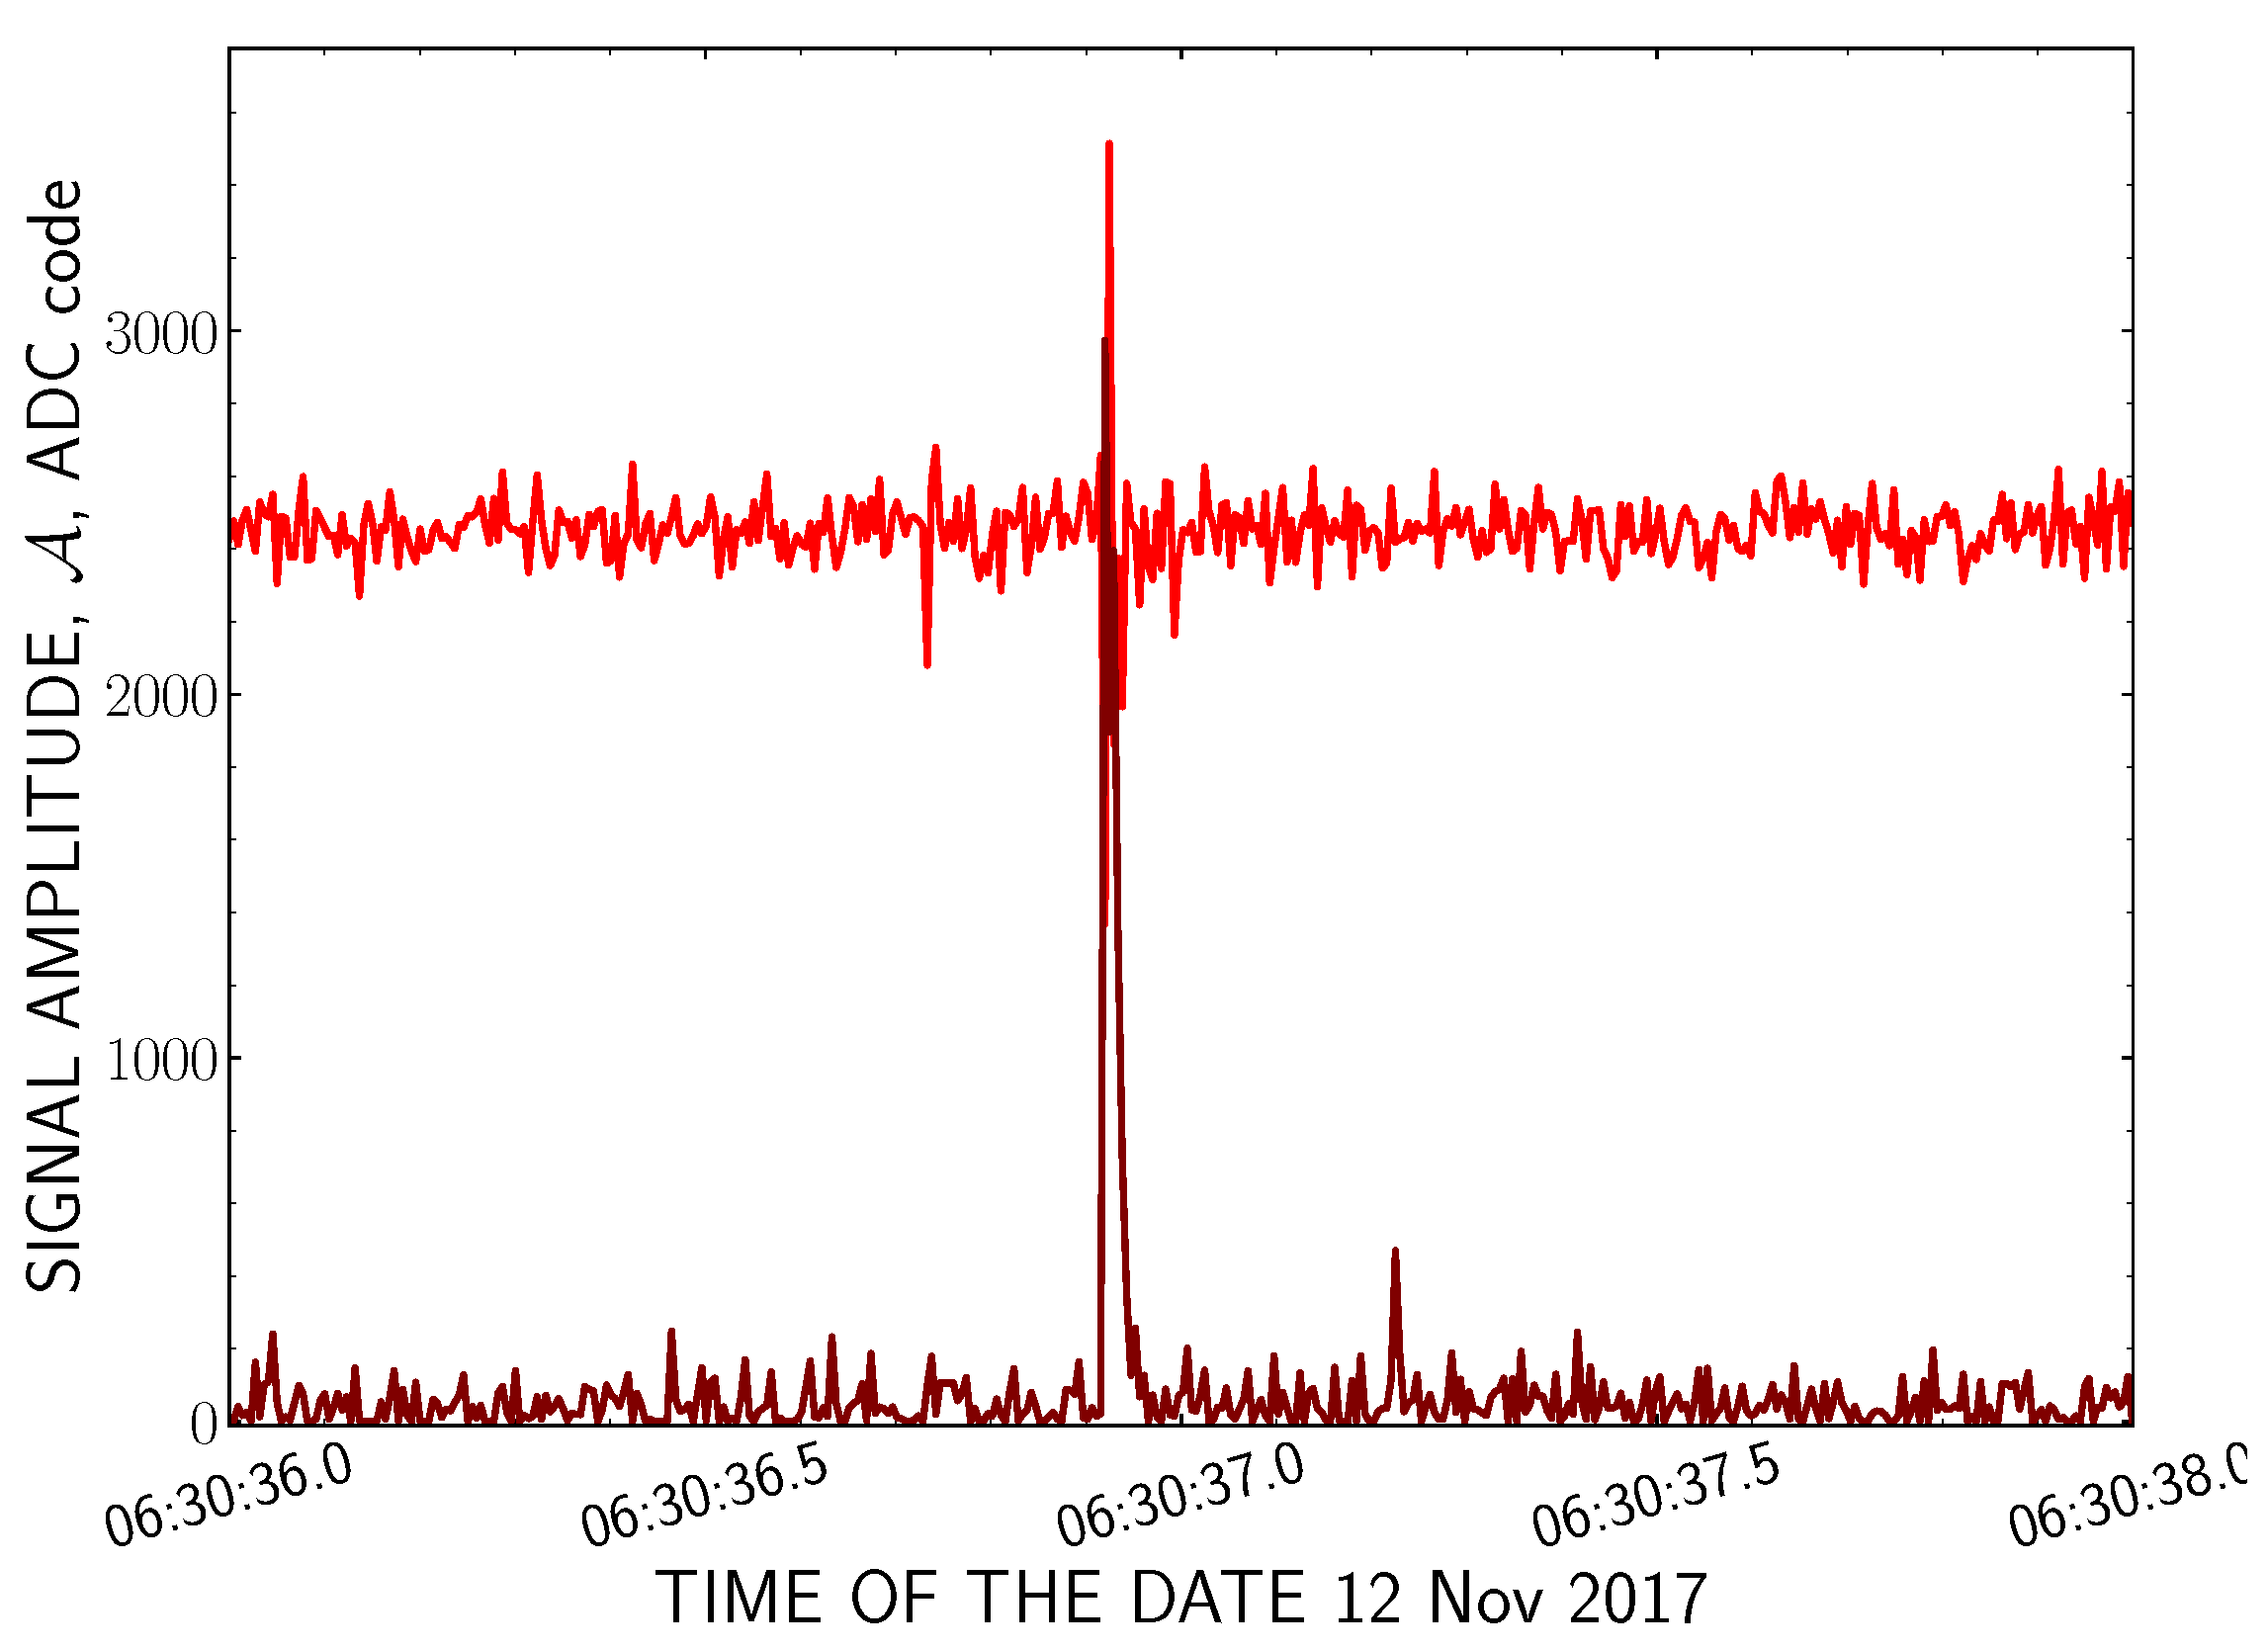
Practically, it was convenient to use as a characteristic measure of the current level of acoustic noise the amount of the short-time, ∼(10–15) ms, outburst peaks with an amplitude above some pre-defined threshold,
, which have been detected in the record of the envelope signal during a fixed period of time (typically, one minute). A sample of such a record of the acoustic signal is shown in
Figure 1; the threshold of ADC code
for the peak-counting procedure in the considered experiment was accepted to be equal to 300.
2.3. The Doppler Sounding Equipment
The search for an ionospheric response to the activation of seismic processes in the considered experiment was made with the use of a hard- and software complex for Doppler measurements of the ionosphere signal on a low-inclined radio-pass [
30]. The radio-receiving part of the complex was placed at the radio-polygon “Orbita” of the Institute of Ionosphere, 2.6 km apart from the detector system of the Tien Shan mountain station. The transmitter was hosted at a distance of 16 km from the receiver and was separated from the latter by a mountain ridge. Additionally, the signals of some far broadcasting radio-stations located at distances of up to 4000 km were used for this purpose. The frequency range of the radio-complex operation is (3–10) MHz; switching of the working frequency is made under the control of an automatic program in dependency of the time of day and season of the year.
The measurement of the Doppler shift frequency of radio waves reflected from the ionosphere was based on the phase-locked loop (PLL) operation principle, which permits one to convert the Doppler frequency into proportional voltage at the output of the phase detector. The width of the holdoff band of the PLL loop applied in the current experiment is 15 Hz, and the non-linearity of its frequency conversion characteristic did not exceed 0.46%, which is quite sufficient for high-quality measurements of the ionospheric Doppler shift.
Figure 1.
Sample record of the acoustic detector data: the upper distribution is the original microphone signal, while the lower one is its smoothed envelope detected by the low-pass filter. The short-time peaks are seen in the envelope distribution.
Figure 1.
Sample record of the acoustic detector data: the upper distribution is the original microphone signal, while the lower one is its smoothed envelope detected by the low-pass filter. The short-time peaks are seen in the envelope distribution.
3. Experimental Data
3.1. The Variation in the Background Flux of Gamma Rays in the Subsoil Rock Layers and Near-Surface Atmosphere
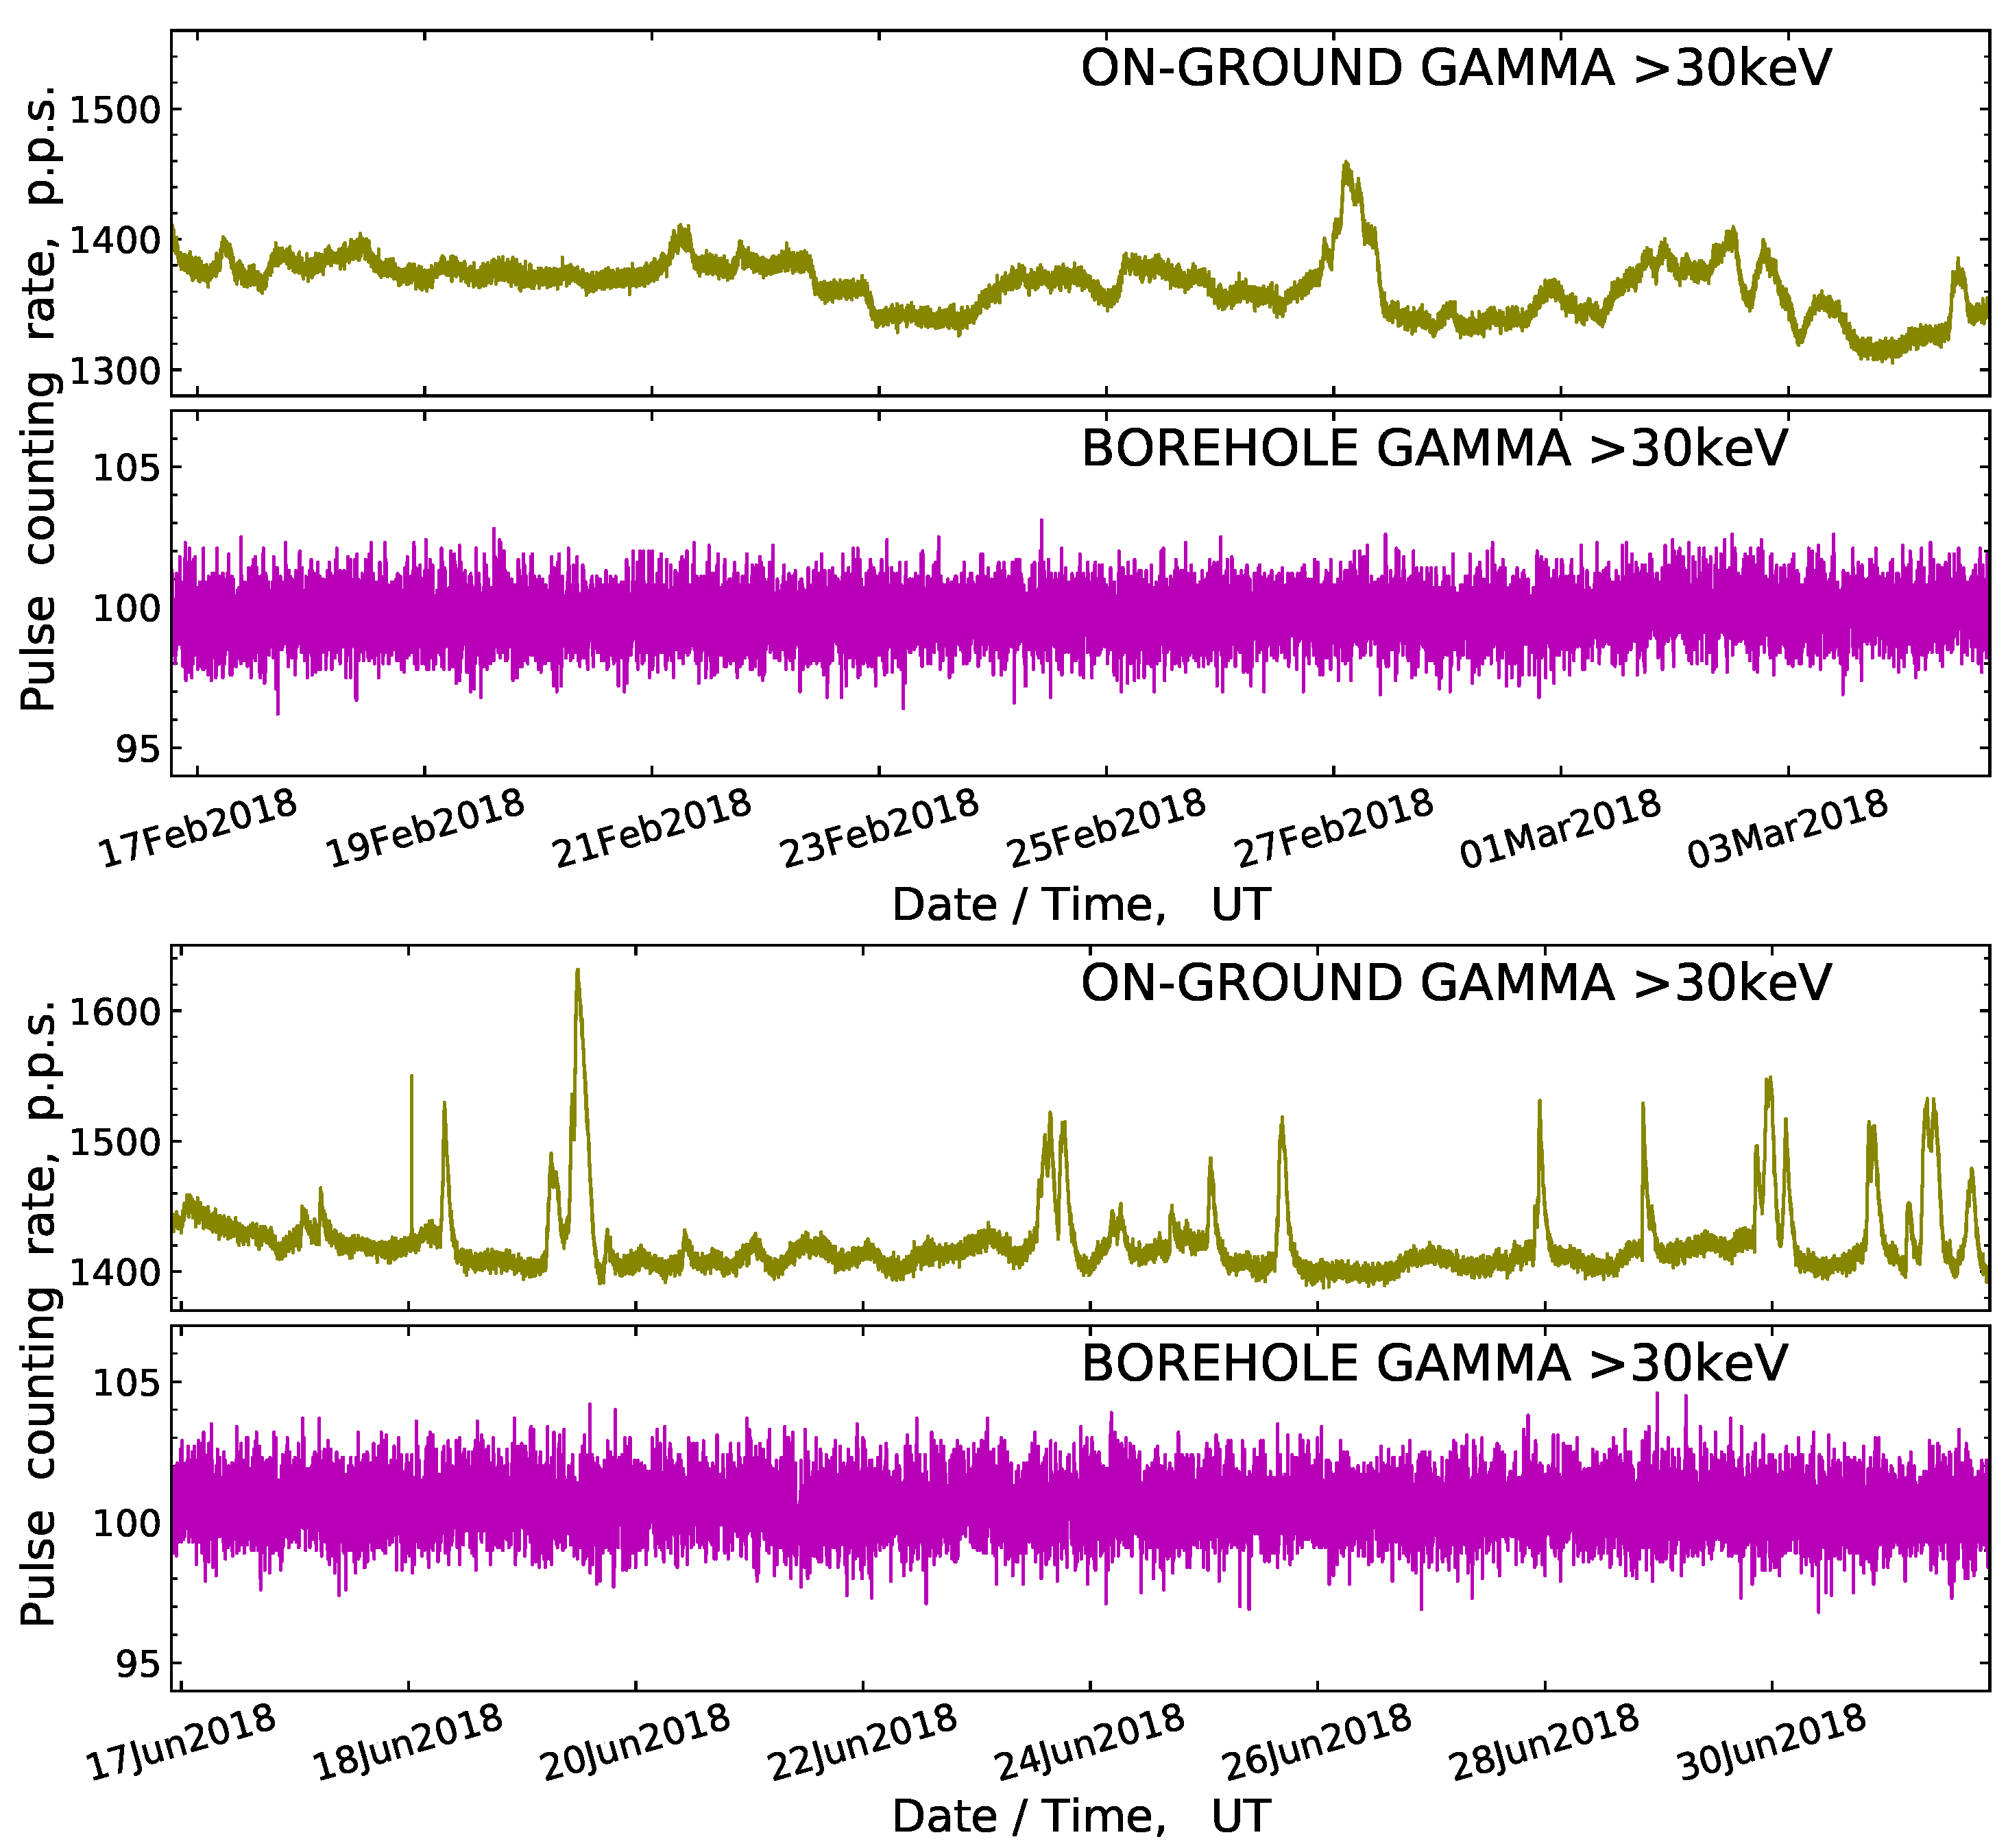
Figure 2 demonstrates a sample of typical monitoring data of the intensity of gamma radiation as measured at the Tien Shan station by the detectors installed at the surface of the ground and at the depth of 40 m in the borehole. As is explained in
Section 2, the monitoring of the intensity of gamma ray signals in both detectors was done with 10 s periodicity and for a number of energy thresholds of registered gamma ray quanta. The data plotted in
Figure 2 relate to the range with the minimum energy threshold of registered gamma rays,
30 keV, and all intensity values there are expressed in the units of the counting rate, i.e., they are normalized to the amount of the pulse signals, which come per one second (p.p.s.) in a given energy range of the corresponding detector.
There is an essential difference in
Figure 2 between the time histories of gamma ray intensity recorded in the near-surface atmosphere by the surface detector and the measurements of the subsoil radiation background in the borehole. Firstly, the intensity of gamma rays above the surface of the ground varies in noticeably wider limits than in the borehole: if the relative variation of the counting rate values
in the atmosphere equals ∼11% in the winter season and ∼17% in summer, in the underground environment, it remains about 8% independent of the time of year. Besides random fluctuation, in the time series of the surface detector, a quasi-sinusoidal oscillation with a period duration close to one day can also be seen.
Secondly, an appreciable difference exists between the average levels of the radiation background measured in the atmosphere by the surface detector in winter, s, and in summer, s. In contrast, corresponding estimations for the counting rate data of the detector installed in the borehole are practically the same, s and s, i.e., their difference remains in the limits of statistical fluctuation.
At last, multiple short-time peaks of the counting rate with a relative amplitude of up to a few tens of percents and typical duration of (1−2) h can be seen in the plots of the surface detector data, especially during the summer season. These are the imprints of precipitation fallout in the form of snow, rain, or hail, which caused a temporary increase in the local radioactive background in the near-surface atmosphere [
17] but practically did not exert any influence on the intensity of the subsoil gamma rays measured by the borehole detector.
Thus, it can be stated that for the search of a feeble effect such as the anomalies specific to the times of approaching earthquakes, a proper method may be the monitoring of the subsoil radiation background in the energy range of a few tens—hundreds of keV at the depth of a few tens of meters under the surface of the ground. The data on radiation intensity thus obtained are free from the influence of local weather, as well as of diurnal and seasonal effects. A proper device for this purpose may be an underground gamma detector installed at the depth of 40 m in the borehole of the Tien Shan mountain station.
3.2. Peculiarities of Radiation Background in the Times of Earthquake Preparation
At the present time, the monitoring of geophysical parameters at the Tien Shan mountain station has been continuing for about a decade. During this period, there were 7 earthquake events observed with an epicenter in the limits of the Dobrovolsky radius [
36] relative to the position of the observation point, i.e., the station together with its detectors was within the zone of earth’s crust deformation connected to the earthquake. All these events are listed in
Table 1. The four leading columns of this table contain the designations of the earthquake time and epicenter coordinates; the magnitude
M and the depth of the earthquake focus [
37]; an estimation of the Dobrovolsky radius calculated as
km; and the distance from the epicenter point to the borehole.
At the time of the earthquakes mentioned in
Table 1 continuous monitoring of the ionizing radiation background at the Tien Shan station was ongoing, either with the use of the gamma ray detector installed above the surface of the soil, or with the one put into the borehole, or with both (see
Section 2).
As is seen in the plots of
Figure 2, generally, the original results of gamma intensity monitoring constitute a time-series-type distribution, in which there hardly can be found any perceivable deviation above the usual statistic fluctuations and imprints of various interfering effects. Thus, a need exists for a special analysis procedure for searching amongst these data for any unusual effects that could appear in the time periods preceding earthquake. In the course of operation of the monitoring data gained in the considered experiment such procedure has been elaborated indeed. Next, this procedure is explained in detail using the example of the 19 January 2020 earthquake event.
To enhance the statistical reliability of the values in each distribution point and reduce the effect of random fluctuations, an averaging of the original time series was made: a mean of 60 neighbouring points in the distribution was calculated, so that the resulting series of the intensity measurements had the temporal resolution of s, and the time coordinates of its points were set in the middle of each of the subsequent 600 s long time intervals. Afterwards, the averaged time series were additionally processed by the running average filter with the kernel length of 100 points.
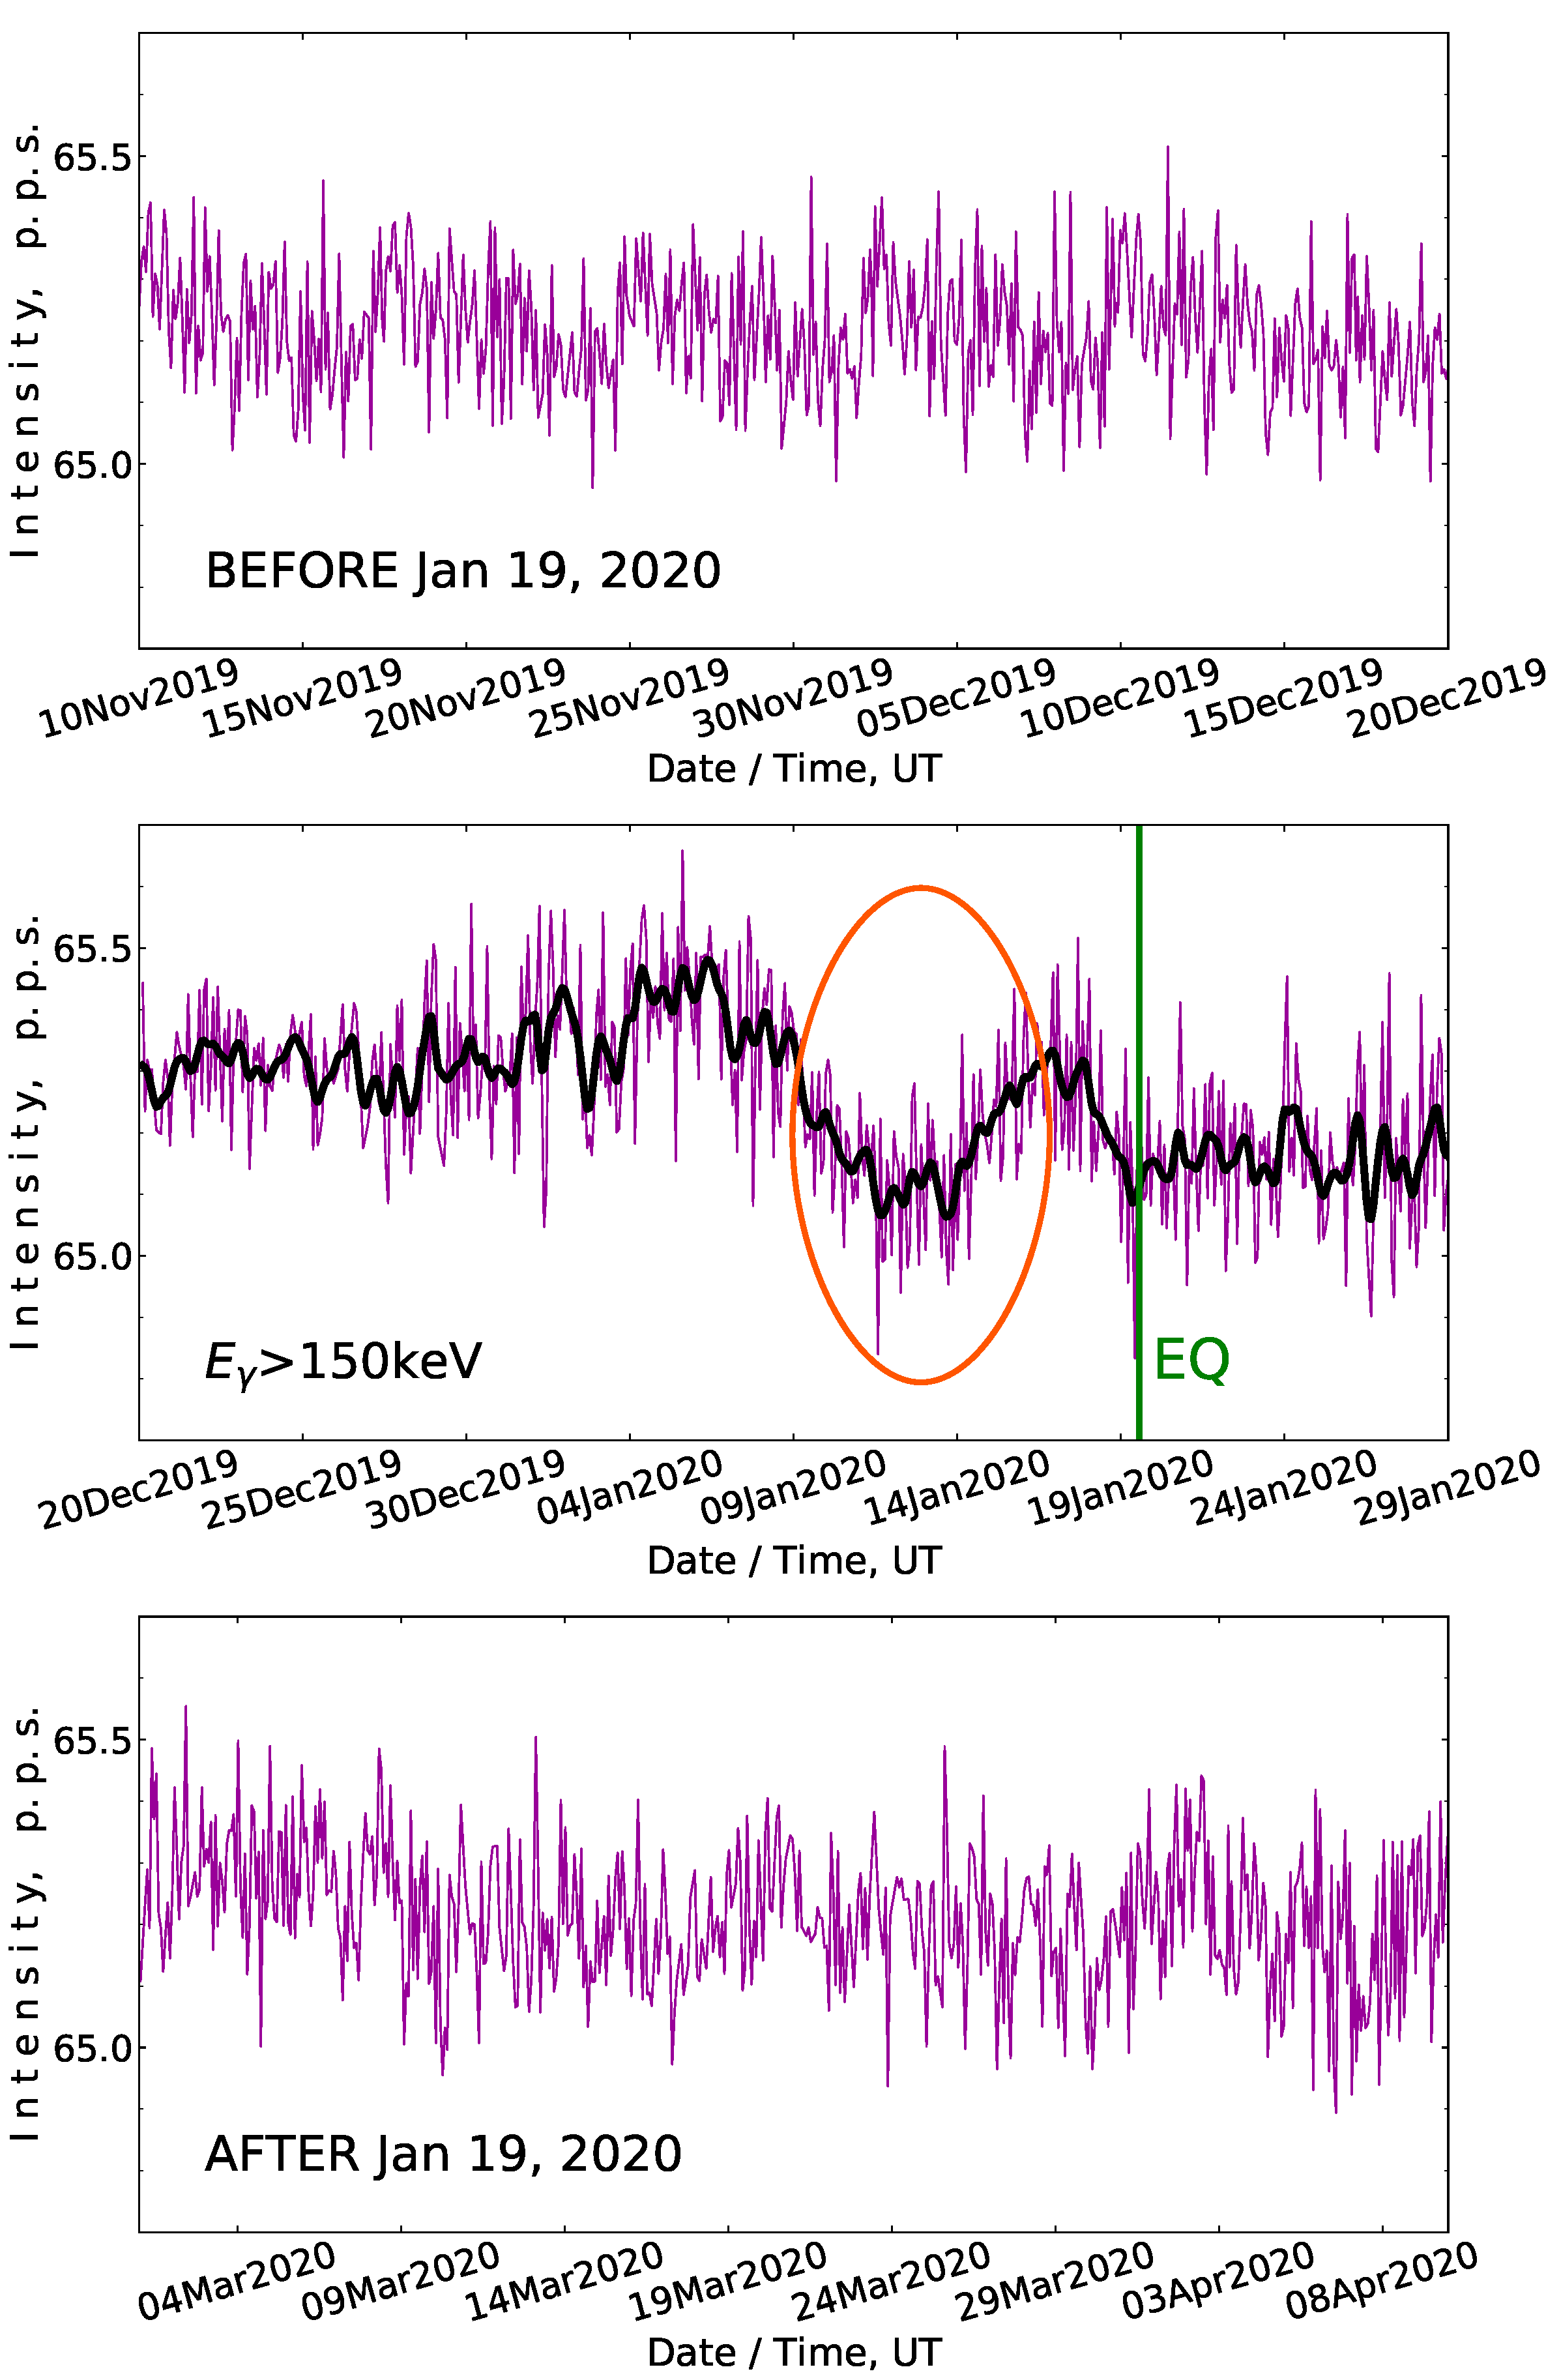
The smoothed distribution, which appears after the application of such an averaging and filtering procedure, is shown, piecewise, in the plots of
Figure 3. As before, the values of the radiation intensity in this figure are expressed in the p.p.s. units, and only the data which correspond to the second amplitude channel with the energy threshold of detected gamma ray quanta of 150 keV are considered here. The time distribution that results from the averaging of the original data is shown by the thin line in all three graphs, while the result of the additionally applied filtering is shown by the thick black curve in the middle panel only. Among the three plot frames in
Figure 3, the upper one corresponds to the time period significantly preceding the moment of the 19 January 2020 earthquake, the middle one overlaps this moment, and the data acquired much later than the earthquake are reproduced in the bottom plot. Each plot in the figure covers a prolonged time lapse of the order of a few weeks.
As is seen in
Figure 3, the smoothed intensity distribution remains rather uniform over the whole time span presented, with the only exception in the dates immediately preceding the earthquake event, where a characteristic bay-like drop is seen in the two curves of the middle panel, both the averaged and filtered ones. The duration of the time delay between the minimum of the deepening in the smoothed curves and the moment of the earthquake equals about (7–8) days. It was found that, most prominently, the depression reveals itself in the distribution of the intensity of gamma ray quanta detected by the borehole detector with the energy threshold of 150 keV; in the other energy ranges of the same detector, the smoothing procedure fails to find any perceptible irregularities in that time.
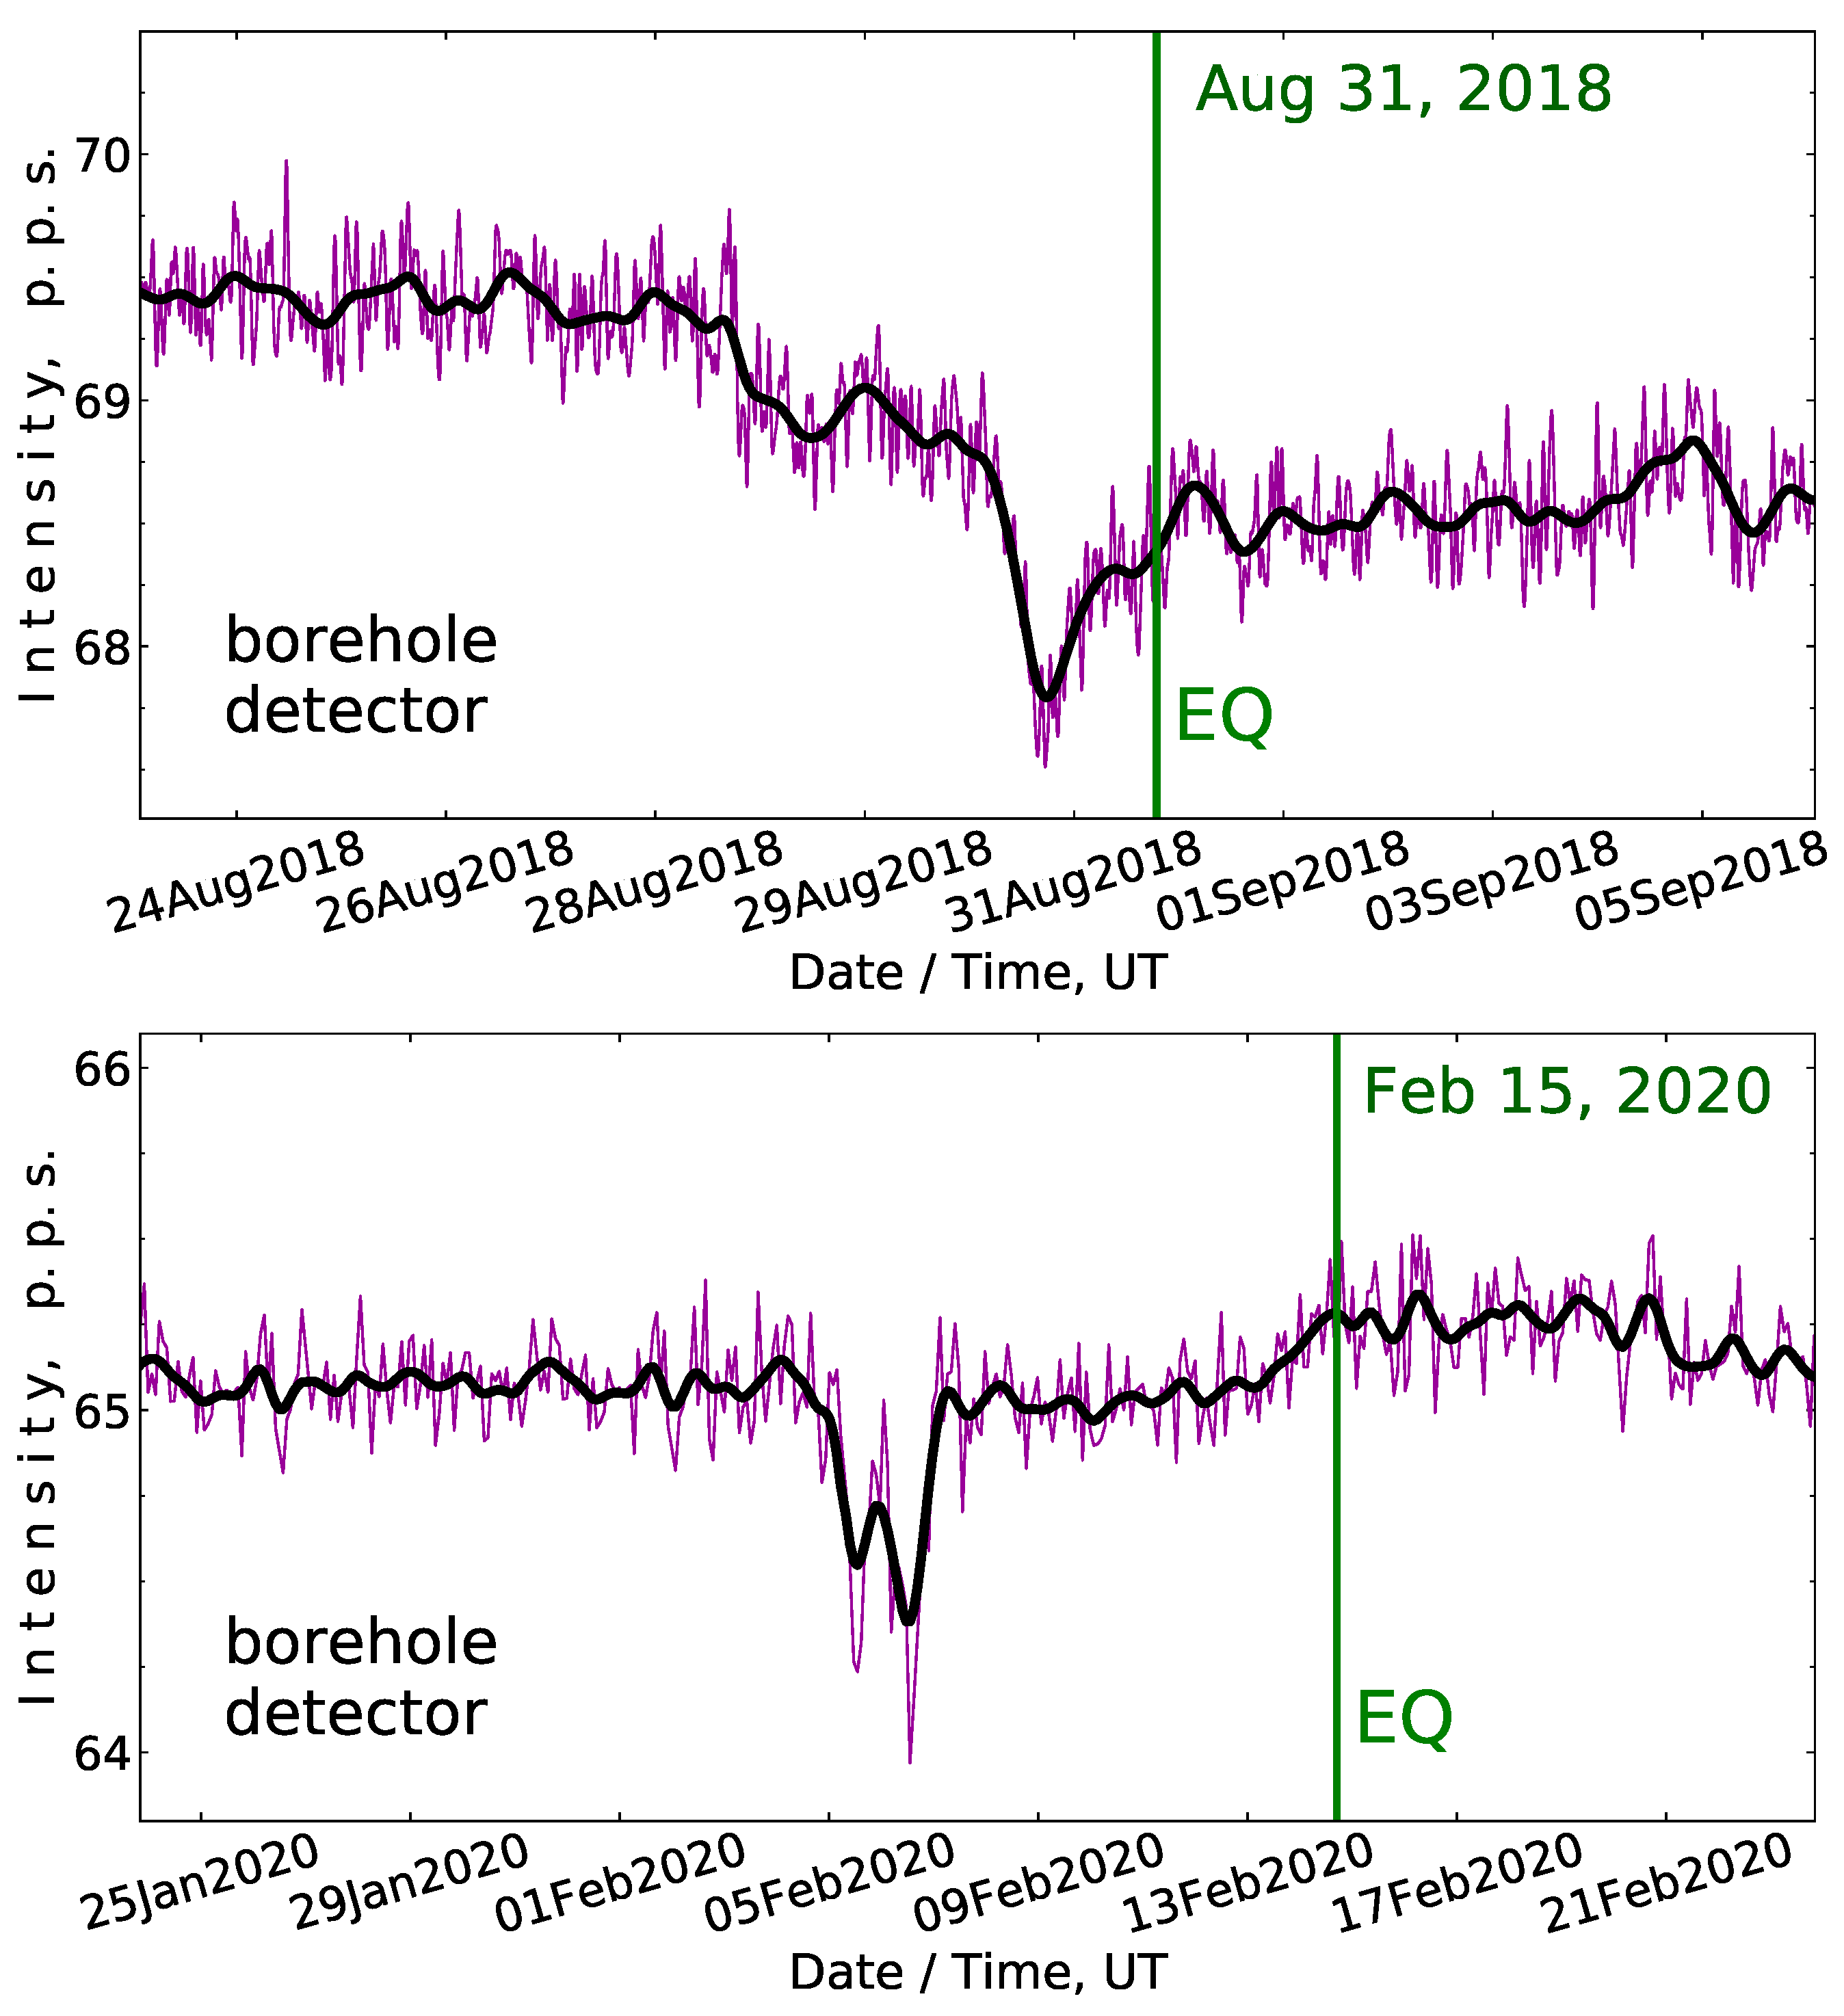
In the course of long-term monitoring measurements at the Tien Shan station, it was revealed that such a bay-like drop with a typical relative depth of 0.3–0.5% in the smoothed intensity records of (100–200) keV gamma rays is a rather characteristic phenomenon which was regularly reproduced in the time periods preceding the relatively close and powerful earthquakes from
Table 1 (i.e., those in which the station was within the Dobrovolsky distance). Sometimes, besides the intensity record of the borehole detector, it succeeds at also finding a similar drop in the data of the gamma detector that was operating above the surface of the ground (see
Section 2). A few other illustrative examples of the same kind are presented in
Figure 4. In
Table 1 the presence or absence of the bay-like drop effect in the intensity records of the underground and surface detectors on the eve of an earthquake is marked in two special columns (the “+” label means presence; since the detector in the borehole was installed only near the end of the year 2017, two leading cells in the corresponding column remain unfilled). It is seen that in all these cases, anomalies in the smoothed intensity curves were found in the pre-earthquake time.
The most right column of
Table 1 contains estimations of the time delay between the earthquake and the minimum point of the preceding bay-like drop. As is seen there, these delays vary between the limits of (2–8) days, with a mean of ∼5 days, which makes the newly found effect of bay-like drops to be interesting from the viewpoint of timely earthquake forecast.
A bay-like drop in the time distribution of gamma radiation similar to those described here, together with a decrease in the flux of thermal neutrons in the near-surface atmosphere, was also observed at the Tien Shan station before the 1 May 2011 M5.8 earthquake event; the results then acquired were reported in [
38].
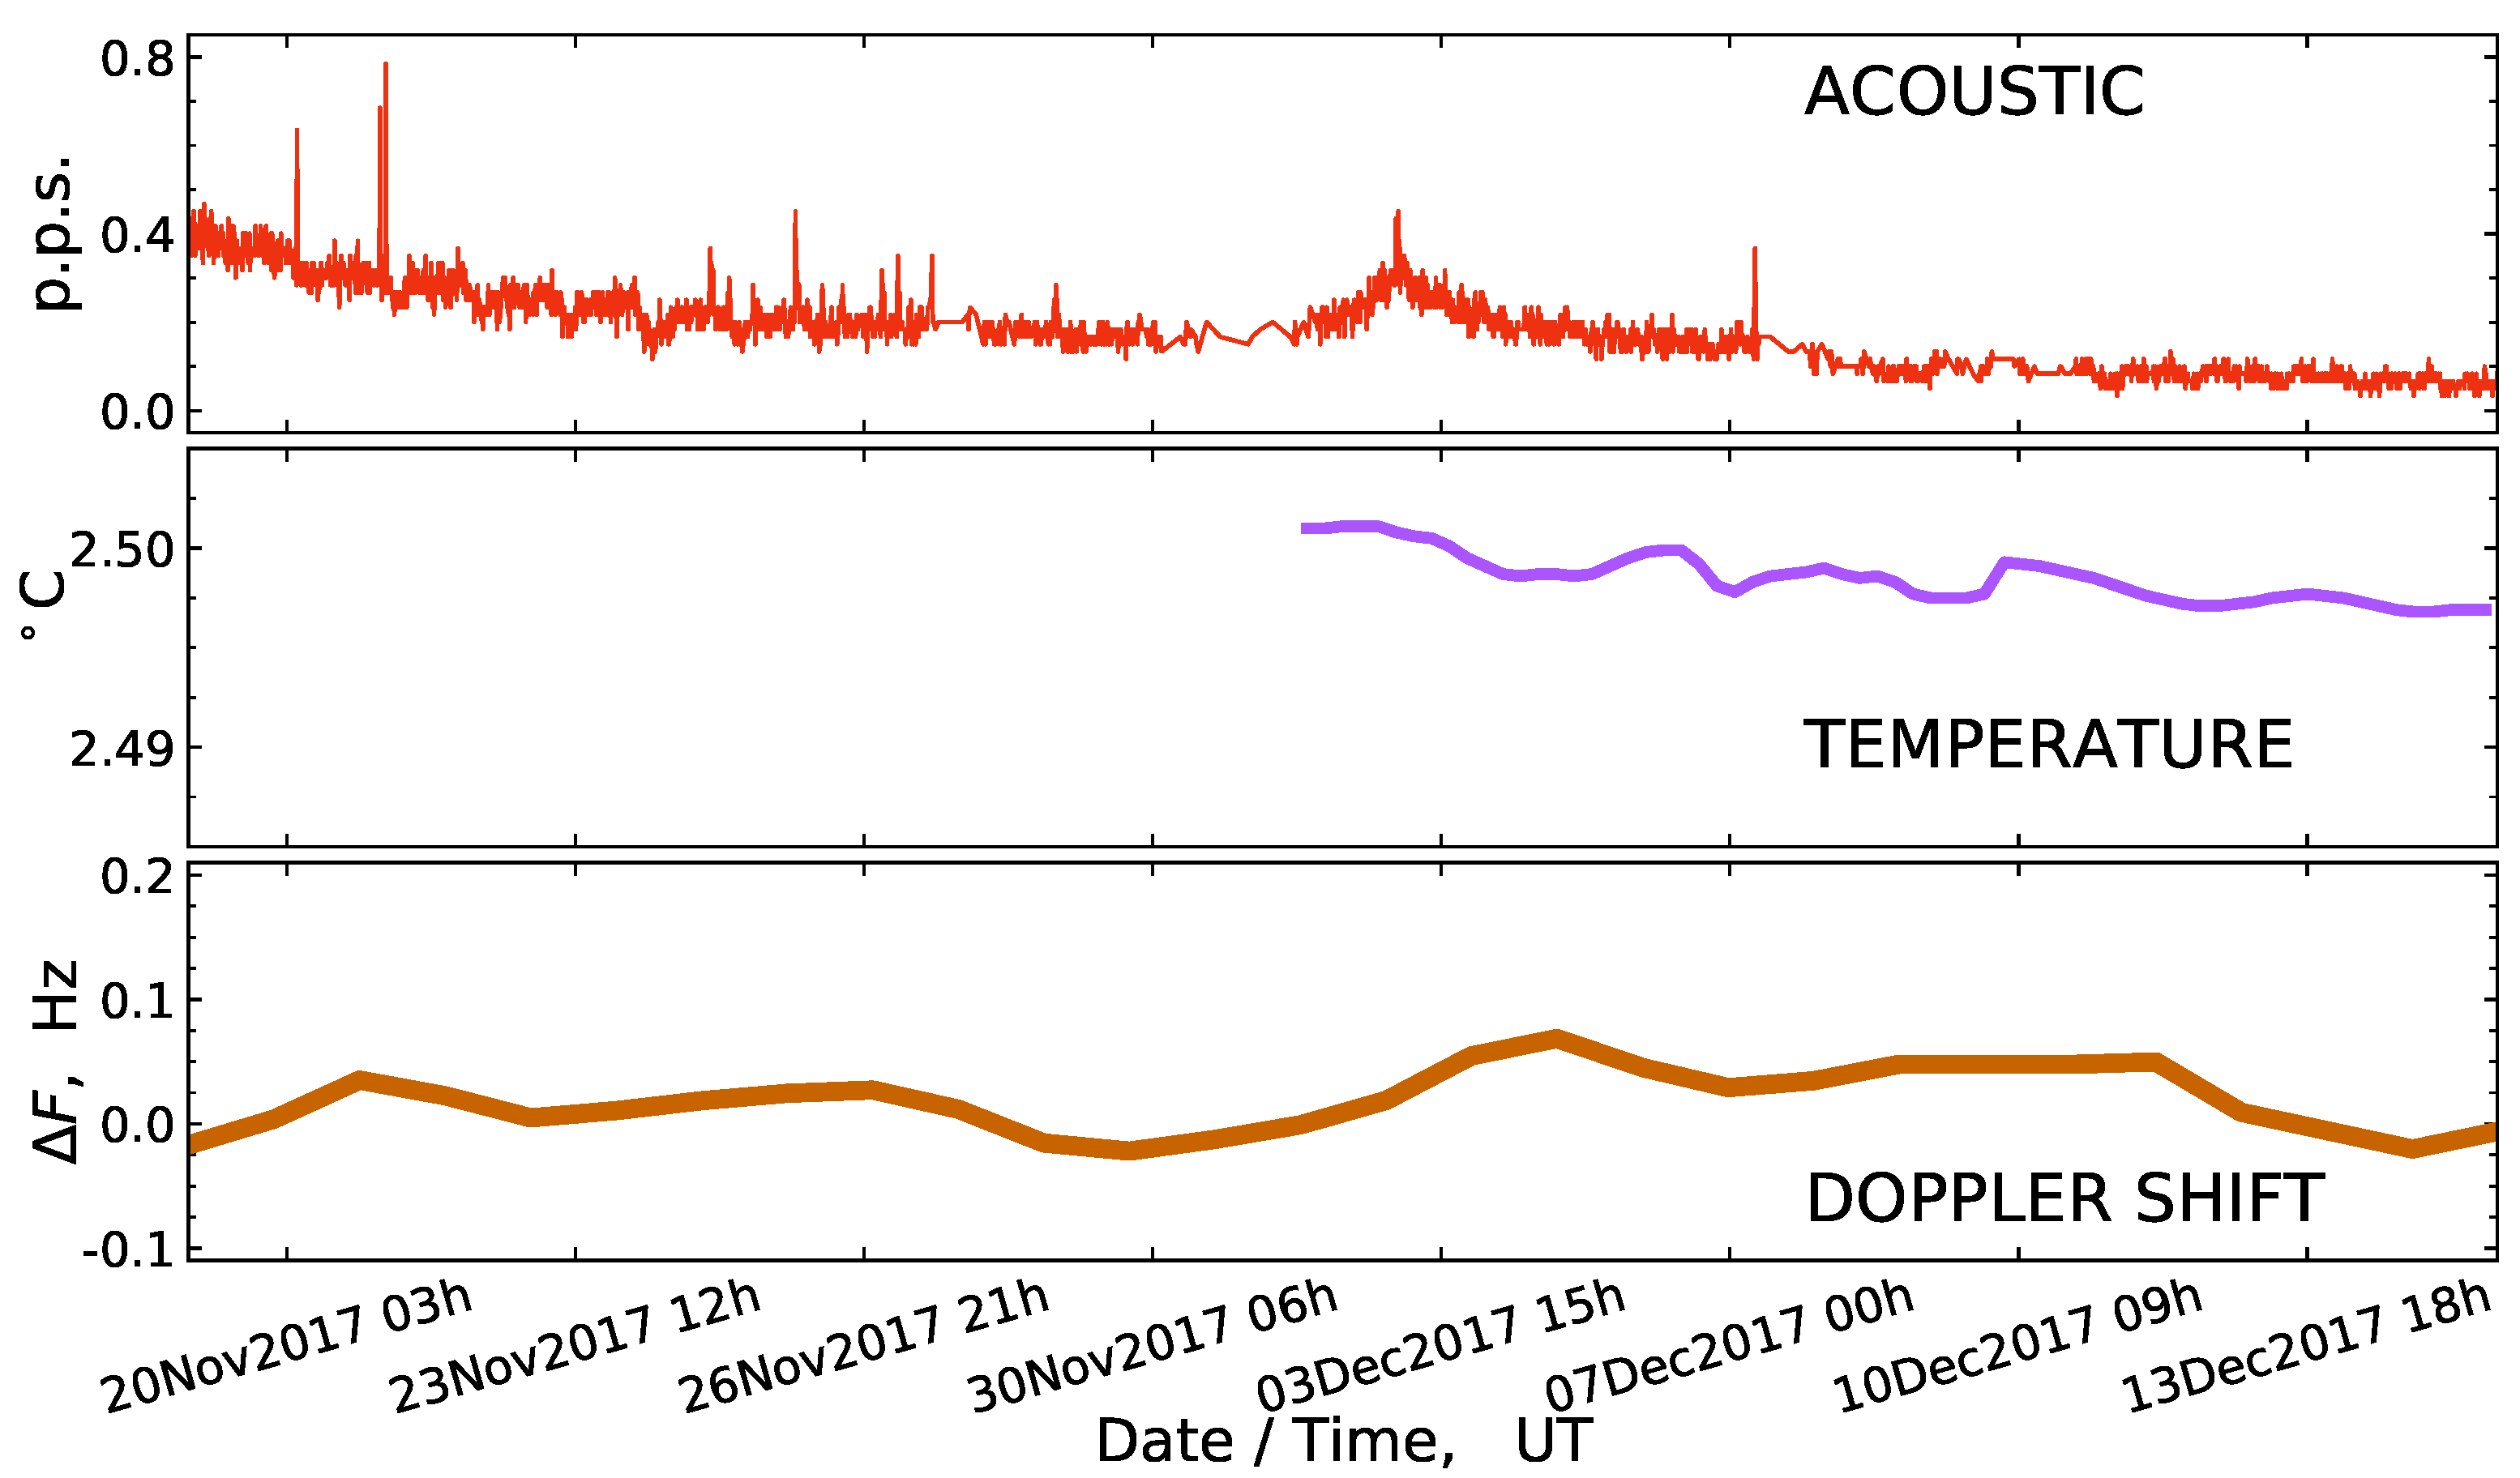
3.3. The Close Earthquake Event of 30 December 2017
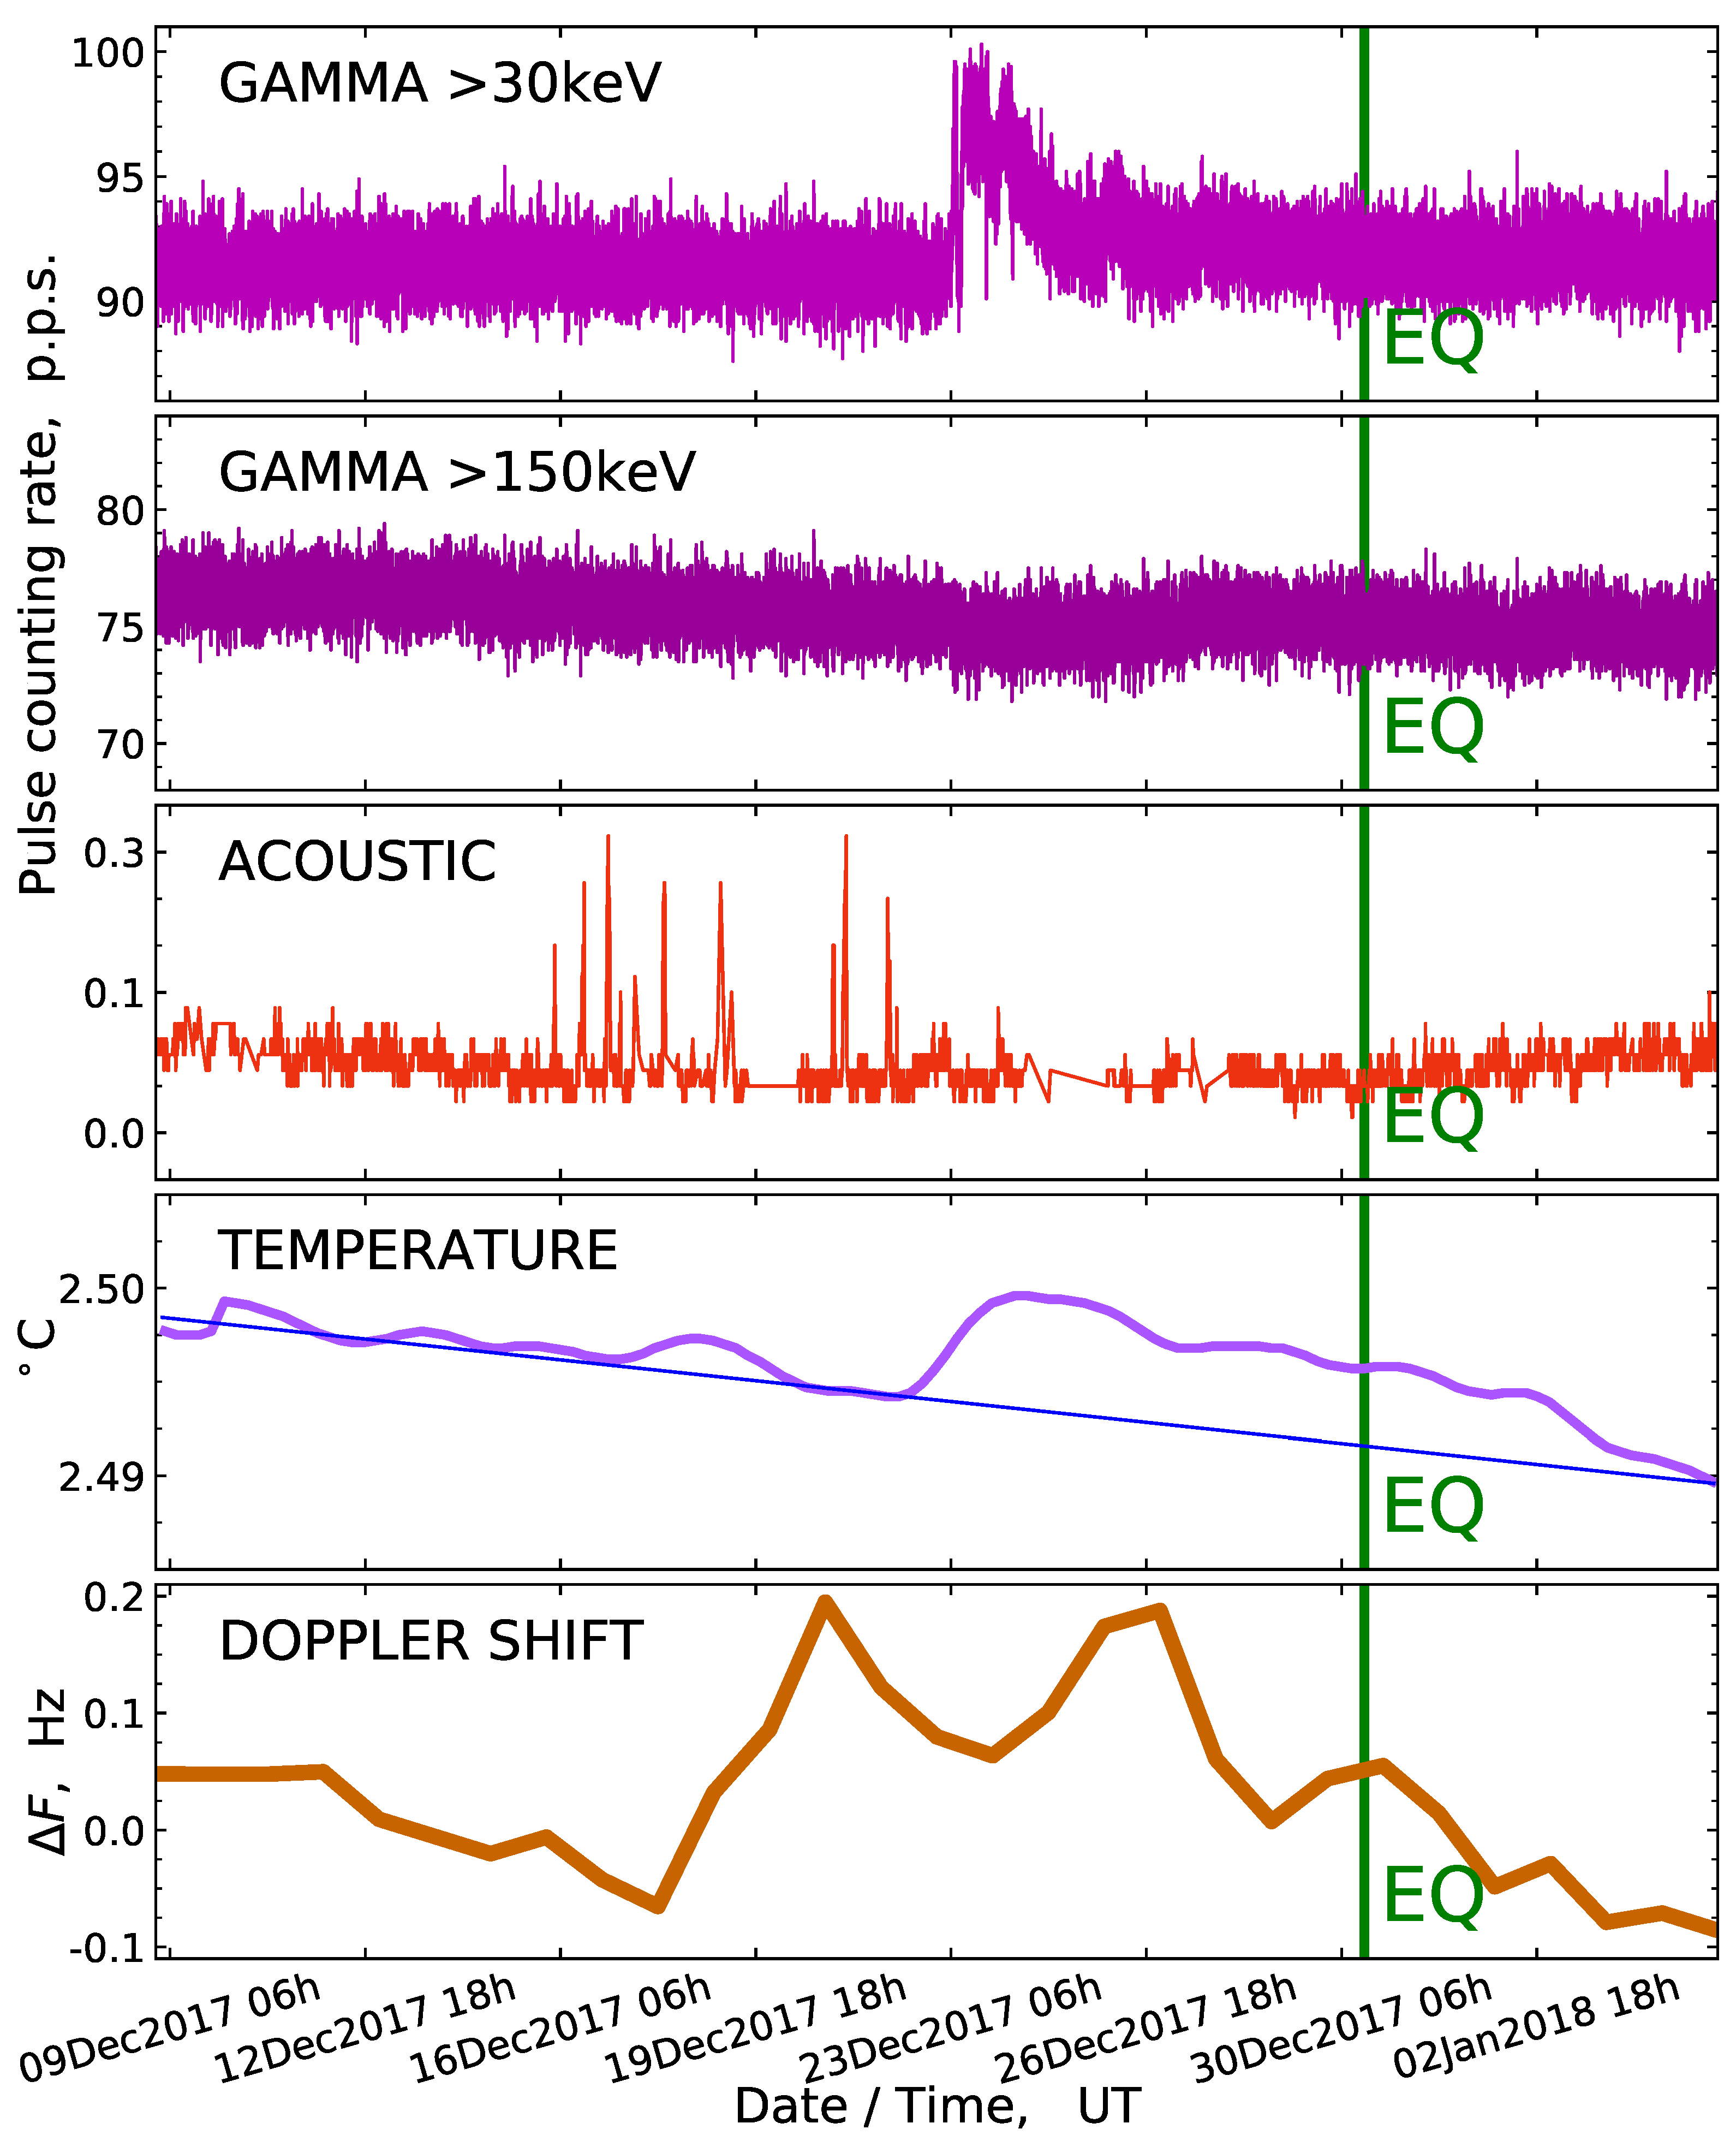
On the date of 30 December 2017, an M4.2 earthquake occurred that had a focus location in nearest vicinity of the borehole at the Tien Shan mountain station, only ∼5.3 km from the station and at a ∼10 km depth. Such a uniquely close position of an epicenter permitted us to register in detail the anomalous effects in the behaviour of various geophysical parameters, which were detected in the time period preceding this event. The results of this study are presented in the following plots.
Figure 5 presents the data acquired at the earthquake time from the detectors operating in the borehole of the Tien Shan station. As follows from the two upper frames of this figure, ∼7 days before the earthquake, an anomalous outburst of soft gamma rays was detected in the borehole, with its energy spectrum limited below 150 keV, and with a total duration achieving ∼2 days. During the next 3 days after the outburst, the counting rate of low-energy gamma quanta remained noticeably disturbed. An enhanced level of soft radiation intensity in the borehole was maintained until a few days (2–3 January) after the earthquake. The maximum excess of the gamma ray intensity at the peak of the detected outburst was ∼10% above the preceding background level. Taking into account the area of the scintillator crystal, ∼75 cm
, and a ∼(30–50)% registration probability of gamma ray quanta in the tens of keV energy range [
31,
34], an absolute additional flux of the soft gamma radiation at the peak of the burst can be estimated as ∼(3–5) cm
s
.
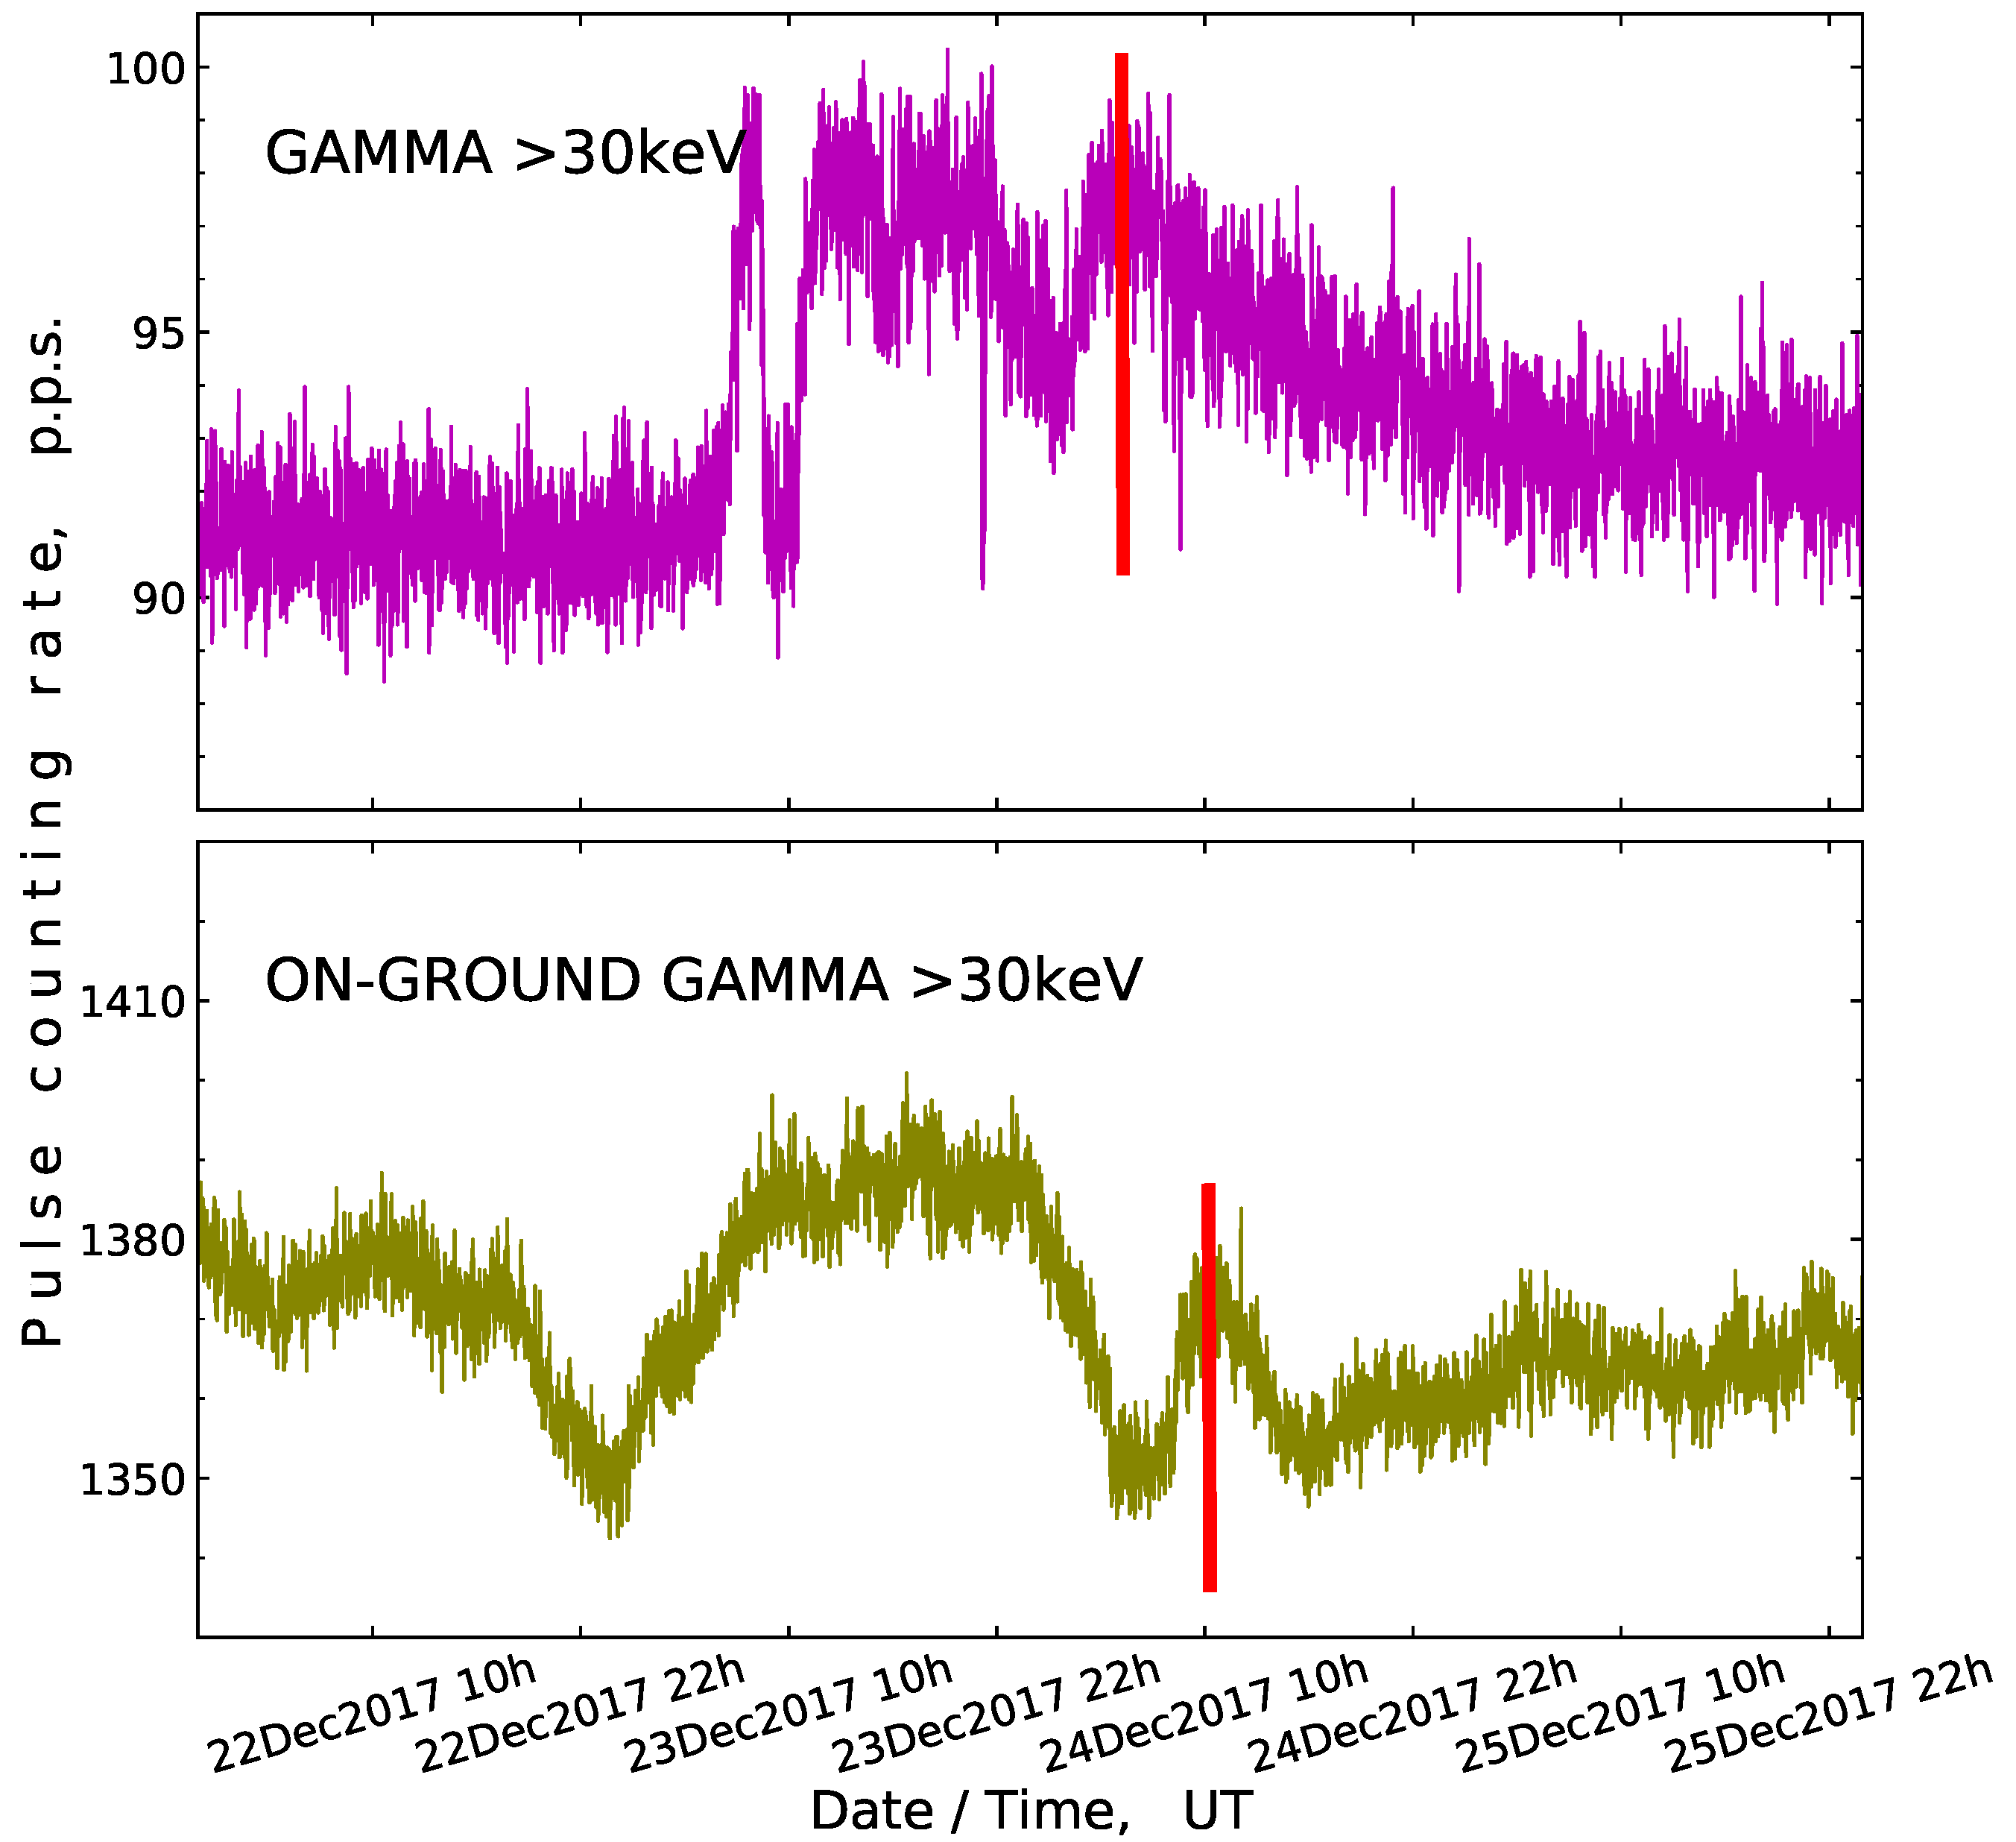
Comparison of radiative response to the approaching earthquake between the data of the underground and surface gamma detectors is made in
Figure 6. As was mentioned above, in the near-surface atmosphere, the radiation fluxes are largely influenced by precipitations and variation of the atmospheric temperature and pressure, but in the time of the gamma ray outburst on 23–24 December, any factors of that sort were absent. As follows from
Figure 6, the time distribution of gamma ray intensity measured above the surface of the ground has a much more smoothed shape than the time series of the borehole scintillator, which permits us to trace even the thin structure of the detected radiation disturbance. Besides, an increase of the radiation background in the near-surface atmosphere appears ∼5 h later than the outburst of gamma rays in the borehole. Seemingly, this delay corresponds to the migration time of seismogenic radioactive elements from subsoil layers onto the surface.
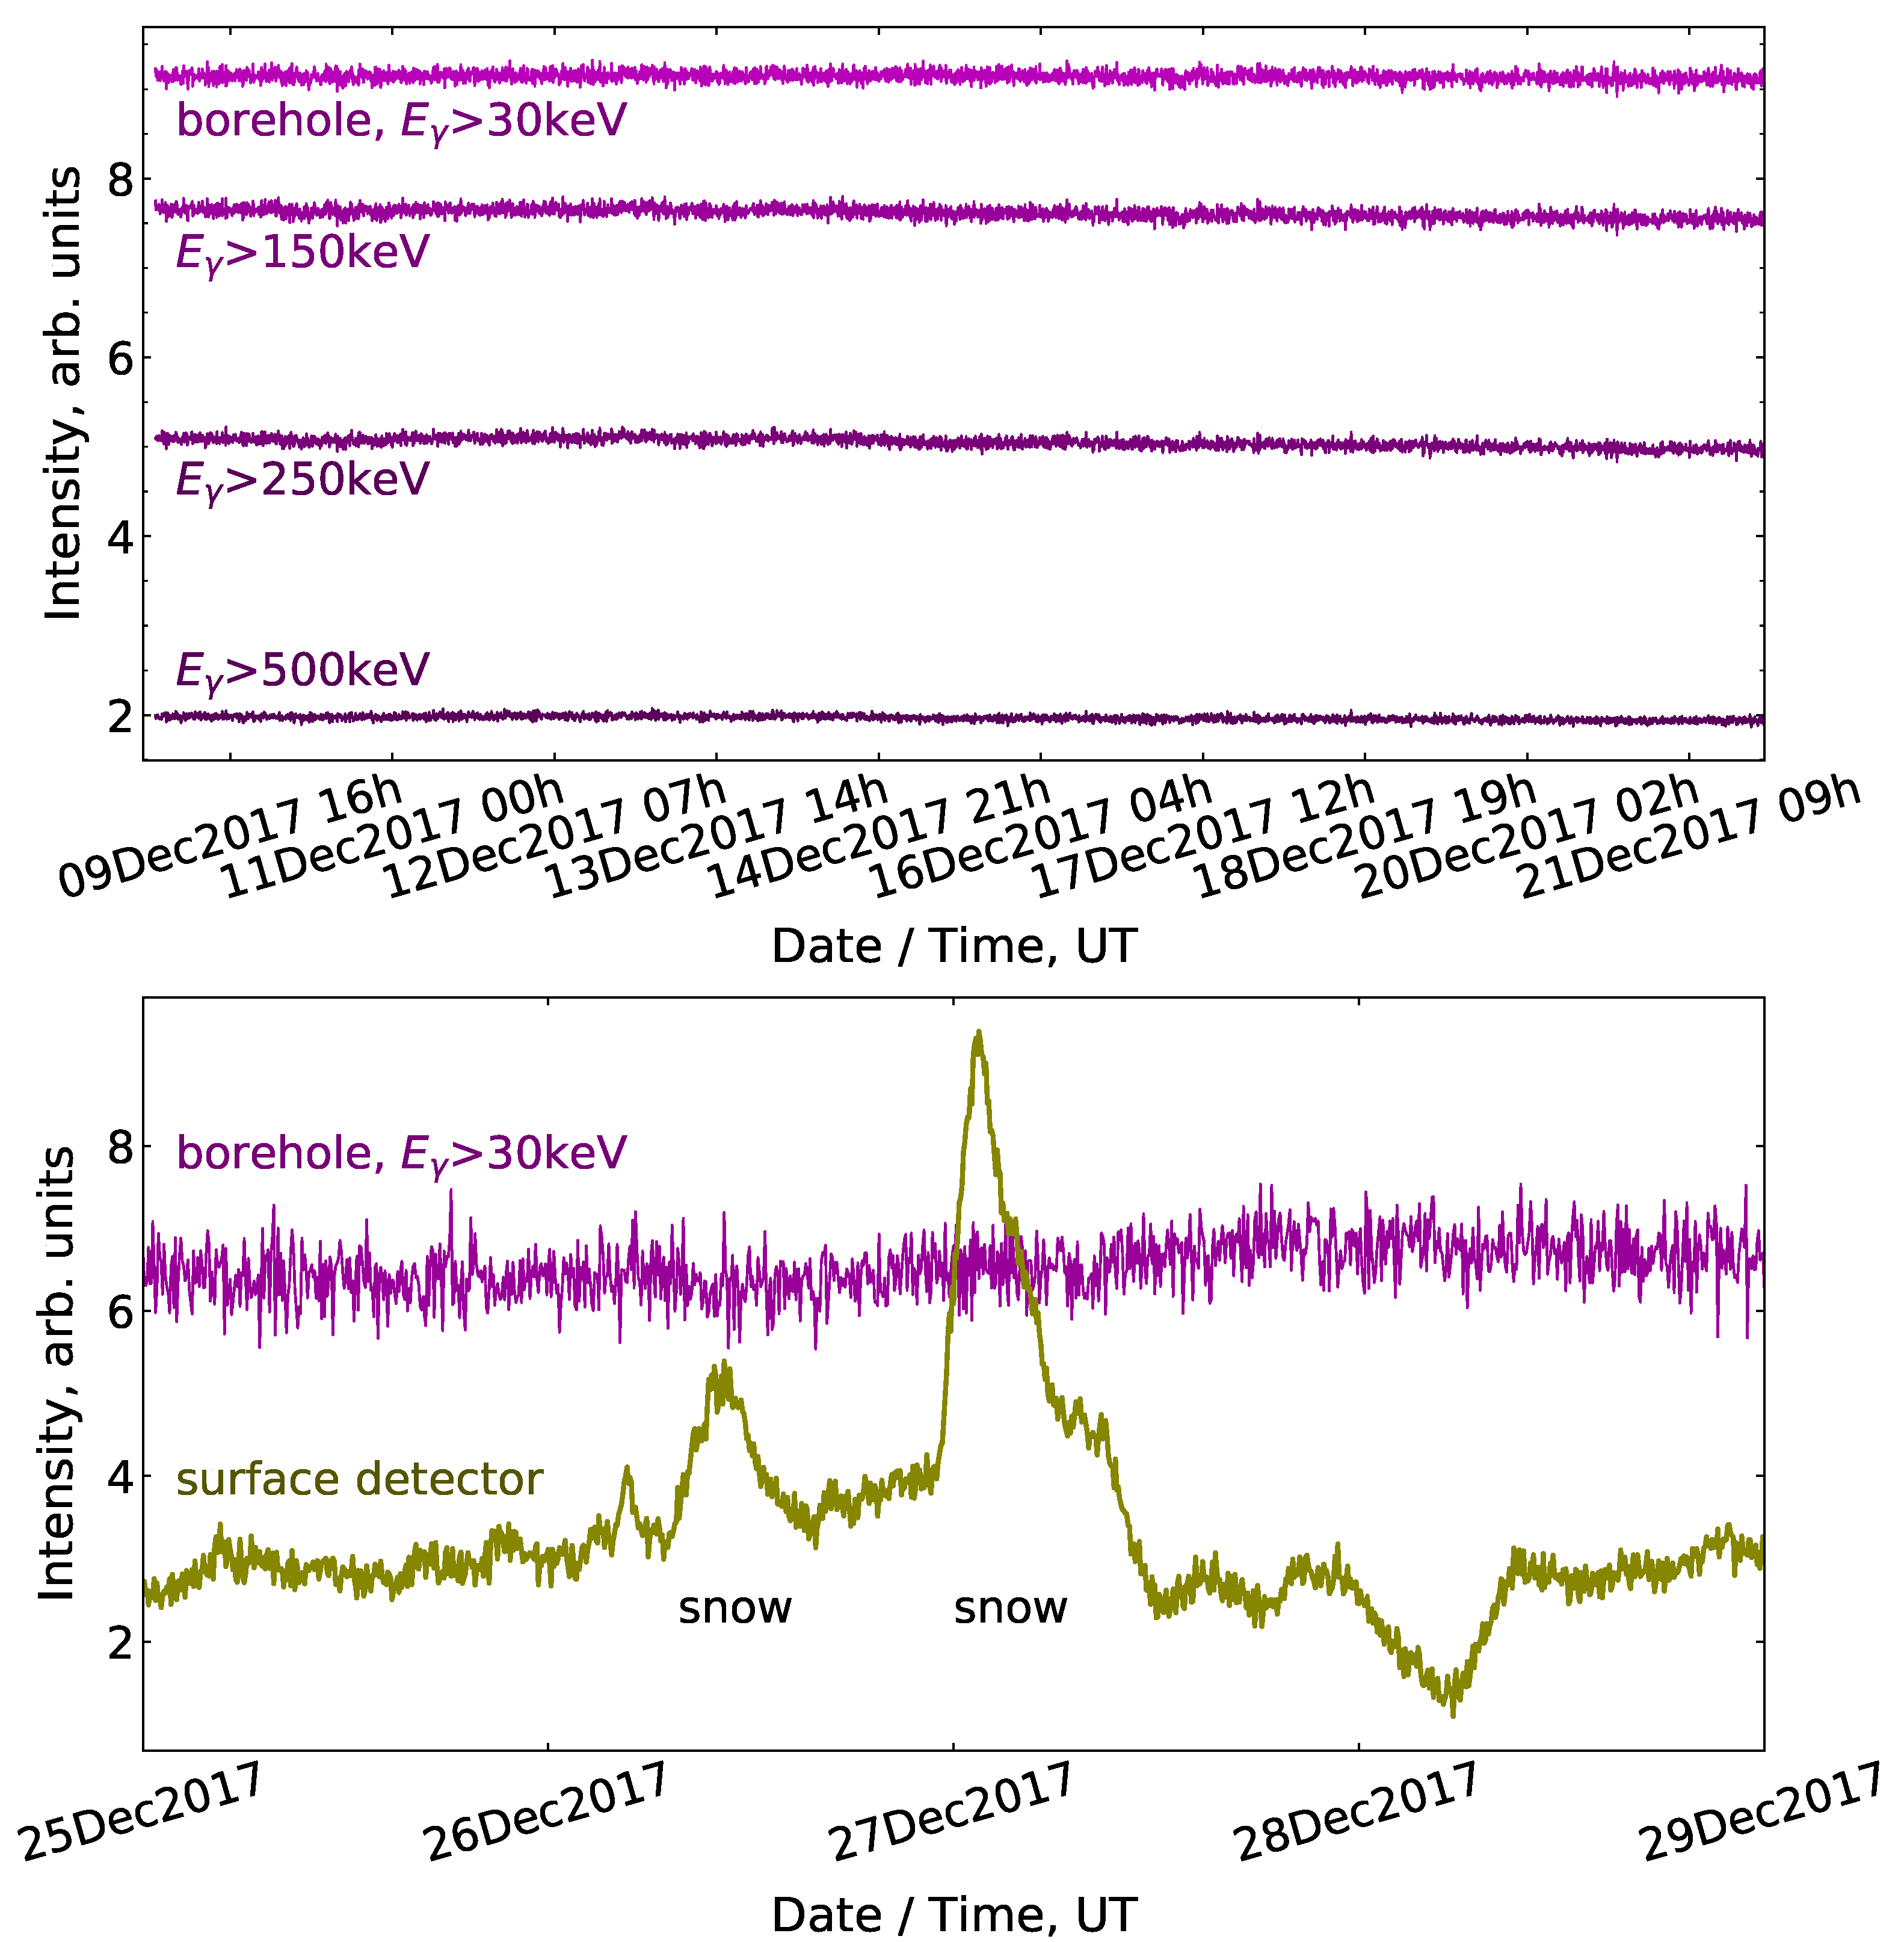
In
Figure 7, the records of signal intensity in gamma detectors are shown, which were written in the two time periods immediately before and after the burst of soft radiation on 23–24 December 2017. The time distributions presented here were previously smoothed in accordance with the procedure described in
Section 3.2. In the upper panel of
Figure 7, it is seen that before the outburst, the radiation background in the borehole remained undisturbed. As follows from the plot in the bottom panel, it was not influenced even in the periods of two intensive snowfalls, which occurred on 26 and 27 December and left their imprints in the data of the surface detector. These data confirm the reliability of the soft radiation increase in subsoil layers that was detected in the low-threshold channel of the borehole detector around the earthquake time.
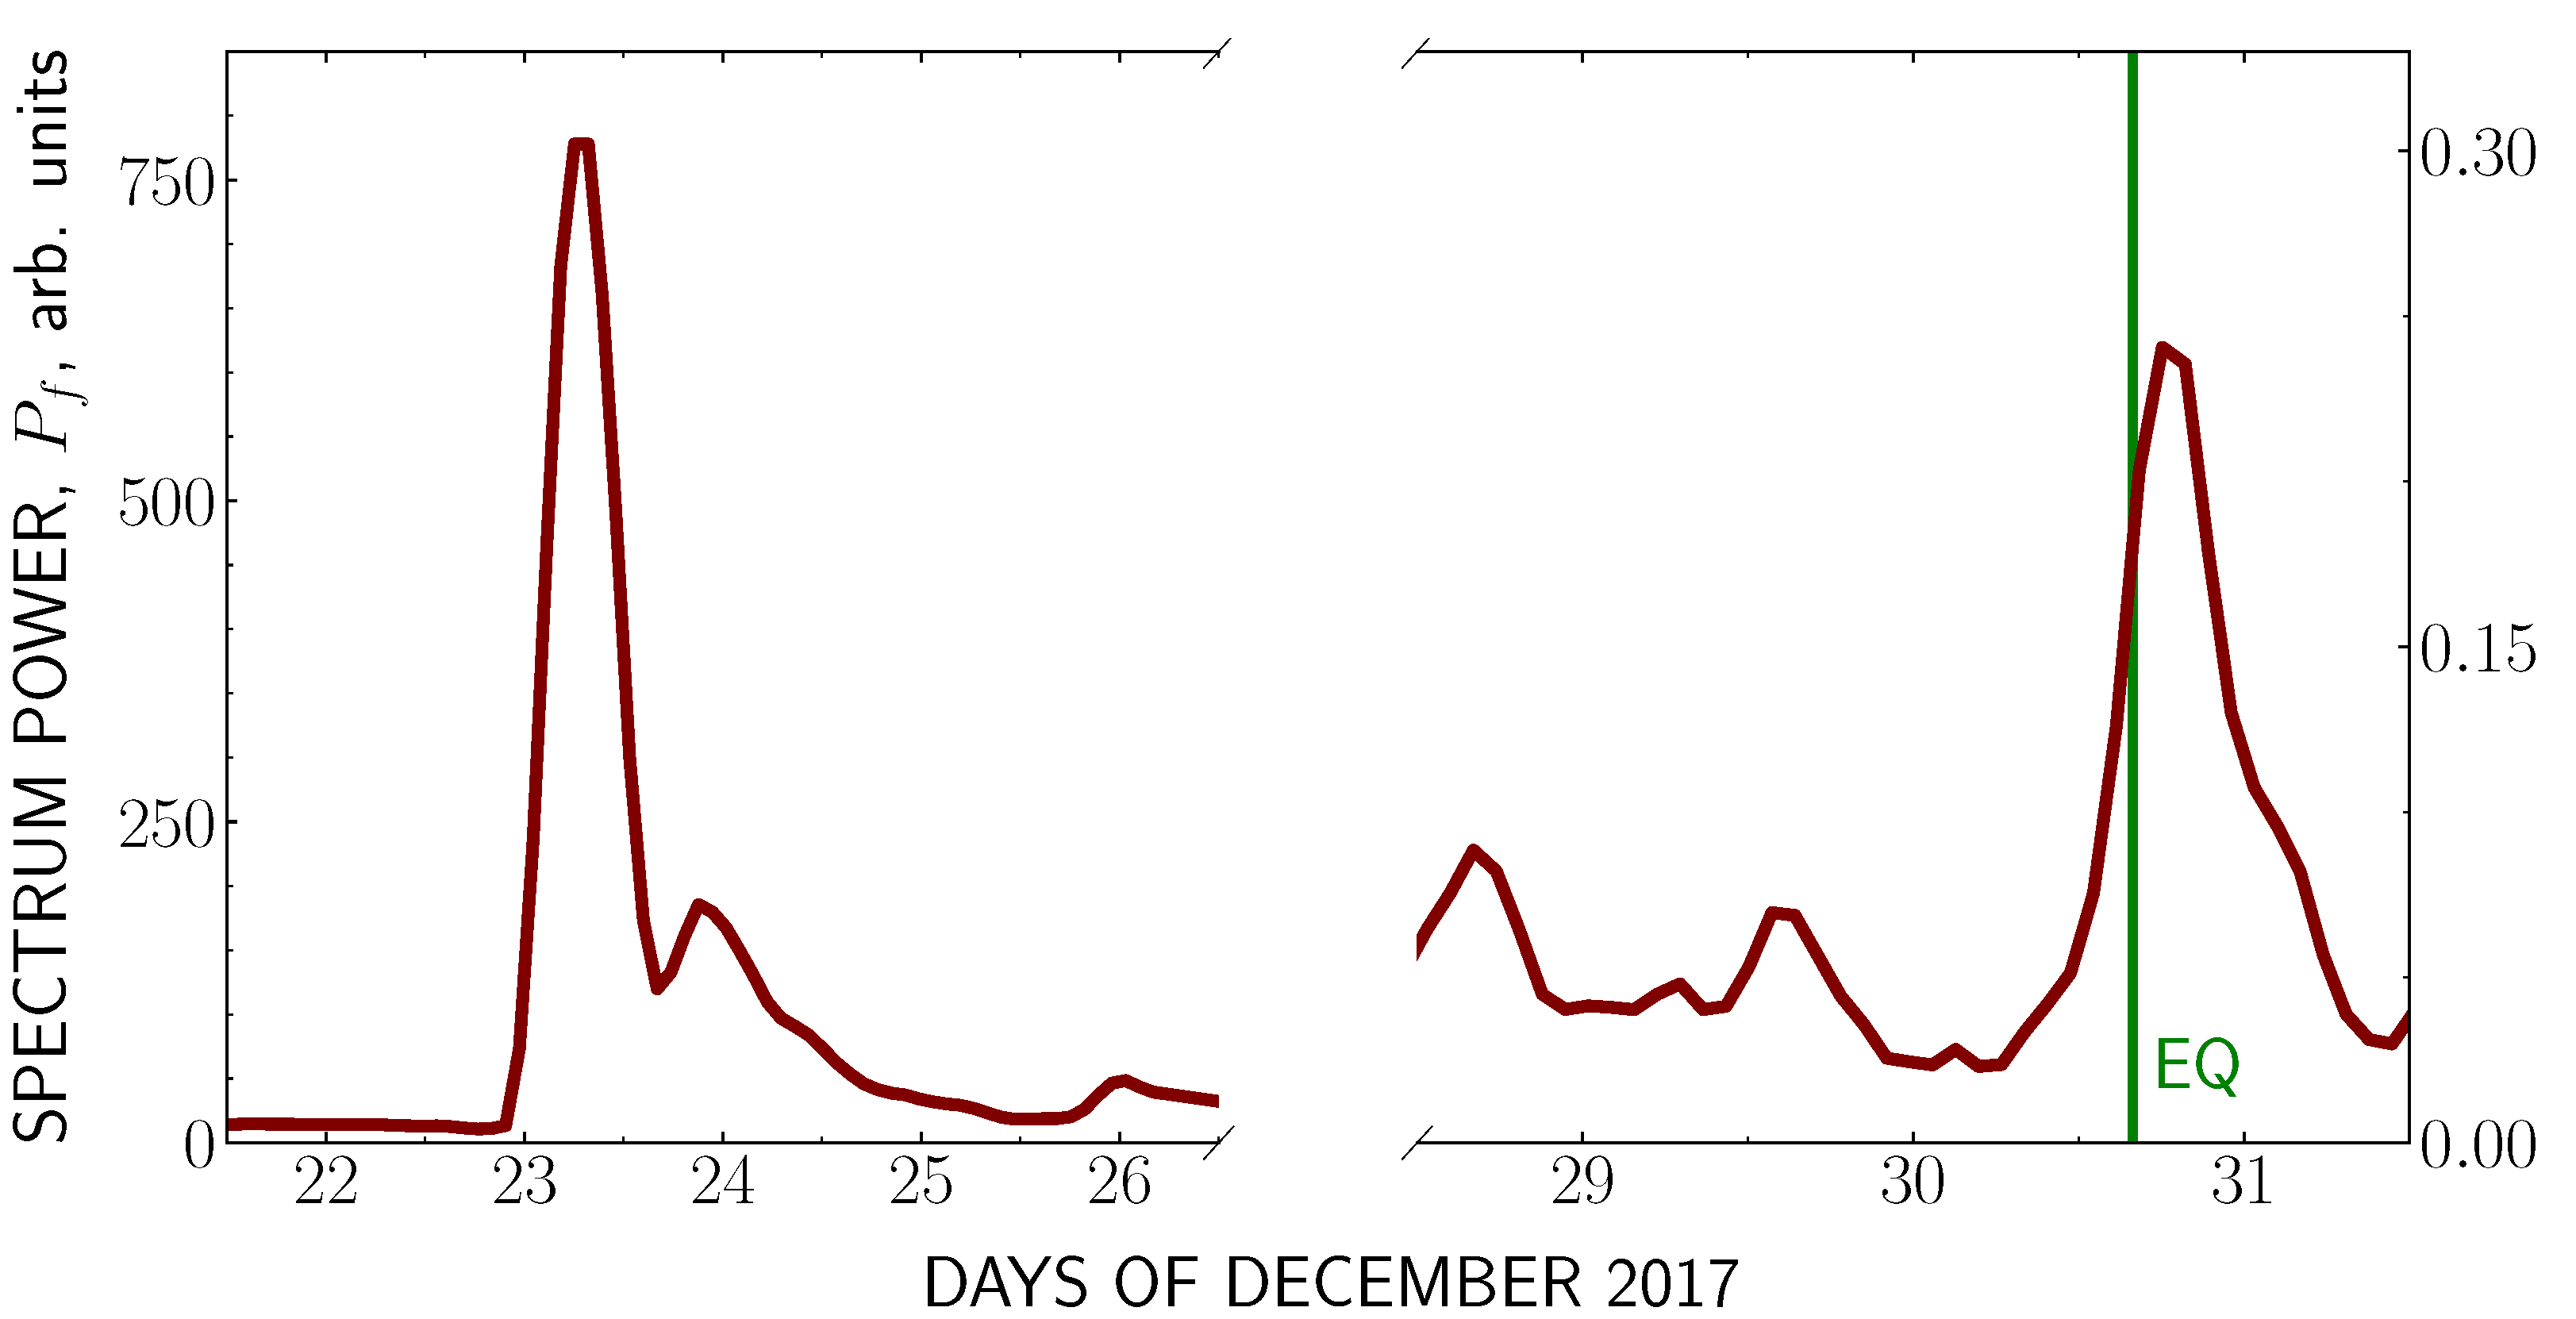
Another approach to analyzing the behaviour of the gamma ray flux is based on the calculation of the dynamic power spectrum of its variation. In contrast to the exploration of the time series applied above, this method is capable of revealing the weak disturbances in a particular frequency range.
The calculation of the power spectrum of the gamma flux variation consists of the following. Among the time series of the counting rate in the gamma detector, a time window with a fixed duration, , was selected, the frequency spectrum of the counting rate variation was defined within this window, and an integral average power of this spectrum was calculated between the frequency limits . Then, the time window was displaced to the step , and the whole procedure was repeated. The parameters accepted for this algorithm in the present study were s ( h), s (or h), and s (or h).
Figure 8 presents the resulting distribution of the integral power values
of the dynamic spectra calculated according to the method described for the
keV channel of the underground gamma detector over a few days around the 30 December 2017 earthquake. As follows from the left plot of this figure, at the peak of the gamma ray outburst on 23–24 December, the integral power of the dynamic variation spectrum was ∼8000 times above the background. A much smaller, but noticeable, increase in the spectrum power, 2.7 times above the mean square level of its background fluctuation, is also seen in the right plot of the same figure both before and after the earthquake moment. According to these high-sensitivity data, the gamma radiation flux still remained disturbed during the whole next day after the seismic event.
The
ACOUSTIC panel of
Figure 5 demonstrates the time history of the counting rate of short time pulses with a peak amplitude above the threshold ADC code of 300 in the smoothed envelope channel of the underground microphone (see the description of the acoustic detector in
Section 2). The one-second-normalized counting rate values presented here were obtained by averaging of the original pulse number measurements over successive 10 min long time intervals.
It can be seen in the ACOUSTIC panel that ∼7 days before the growth of gamma radiation (and ∼10 days before the earthquake), a quasi-regular sequence of the peaks of acoustic emission was detected in the borehole. The duration of each of the peaks was about (1–2) h, and the separating time gaps between them varied in the limits of (5–12) h. The sequence of acoustic pulses terminates shortly before the beginning of the increase in radiation.
The data of precision temperature monitoring with the thermometer placed 40 m below the surface of the ground are shown in the
TEMPERATURE panel of
Figure 5. As is seen there, just at the beginning of the seismic activity period, there was a noticeable temperature deviation registered in the borehole of up to (5–7)
centigrade above the general cooling trend of the continuing winter season, which is indicated in the plot by the thin straight line. Starting together with the rise of gamma ray intensity, the anomalous temperature enhancement terminates a few days after the earthquake.
The Doppler shift measurements of the reflected radio wave at ionosphere sounding with the frequency 5121 kH are presented in the bottom panel of
Figure 5. In this plot, a significant decrease in the Doppler frequency can be seen, which coincides with the beginning of the gamma outburst of 23–24 December 2017. It should be noted that during the whole period of 18–31 December, the geomagnetic environment remained quiet, and there were not any magnetic storms that could influence the ionosphere [
39]. The geomagnetic quietness at that time was an important condition for the revealing of the seismogenic effect in the ionosphere.
In
Figure 9, the time history of the intensity of acoustic pulses and temperature in the borehole, as well as of the Doppler shift values, is represented over a 3 weeks long time lapse before the 30 December 2017 earthquake. (The temperature measurement in the borehole was started only on 1 December, so the plot in the corresponding panel of this figure is not complete). It is seen that outside the 10 days period that immediately preceded the earthquake, neither any anomaly of the quasi-regular kind in the
ACOUSTIC time series nor a significant deviation in the temperature and Doppler shift values from their usual uniform trends were detected. This observation confirms the connection fidelity of the anomalies plotted in
Figure 5 with the seismogenic processes that were going on in the pre-earthquake time.
4. Discussion
The ionization of the near-surface atmosphere before an earthquake plays a leading role in the propagation of seismogenic disturbances from the lithosphere to ionosphere [
25,
26]. The present study is aimed to investigate the intensity variations of ionizing gamma rays in the subsurface rock layers and in the near-surface atmosphere. One of the most informative geophysical markers of earthquake preparation is the emanation of radon due to the change in the stressed-deformed state of rocks in a seismically active region [
1,
2,
3,
4,
5,
6,
7]. In the present study, when searching for the anomalous effects connected with radon emanation, we used the detection method of the gamma rays emitted by the daughter products of radon decay.
The intensity of gamma radiation as well as radon concentration in the near-surface atmosphere are influenced by a variety of meteorological factors [
11,
17,
18], which, by circumstance, hinders the selection of seismogenic effects. To avoid the influence of precipitation and temperature variation, the gamma detector used in the present study was placed in a borehole at a depth of 40 m. The observations have shown that the background flux of gamma rays in the borehole varies negligibly between the days, and, in contrast to the gamma radiation in the atmosphere, it is not influenced by precipitation such as rain, snow, and hail. This determines the application possibility of the equipment installed in the borehole for revealing small and short-time changes in the gamma ray flux.
Two types of anomalies were detected in the monitoring data of gamma radiation acquired during the times shortly preceding earthquakes. The first is the appearance (2–10) days before an earthquake of the bay-like drops in the time series of the gamma radiation flux, both measured in the borehole and in the near-surface atmosphere. In these events, the epicenter of an M5.0−M6.2 earthquake occurred at a (15–354) km distance from the borehole, within the limits of the Dobrovolsky radius [
36].
The time behaviour of the intensity of detected gamma rays depends on the content of radon in the sub-soil layer of rocks. According to [
7], the variation in radon concentration on the surface reflects the changes in the compression or extension strain in the deep lithosphere layers. The penetrability of a massive rock to gas fluids is defined by the presence or absence of internal mutually connected cracks and pores. Within the compression zone of a seismically active region of the earth’s crust, it is typical to see the closure of such cracks and pores, with a decrease in radon content on the surface, while in a zone of expansion, both the fracturing and porosity grow, which leads to an increase in radon emanation. Ref. [
7] emphasized the essential nature of non-linearity in dependence of the speed of radon exhalation on the tension state of the crust deformation. In northern Tien Shan, earthquakes predominantly occur under compression due to the action of the squeezing forces of the thrusting Arabian and Hindustan tectonic plates. Seemingly, the bay-like drops of the intensity of soft gamma rays detected within the Dobrovolsky distance before the earthquakes from
Table 1 originated as a result of rock compression in the zone of earthquake preparation.
The second type of anomalous effect was observed on the eve of an M4.2 earthquake on 30 December 2017. This was a unique event in which the focus of earthquake was located practically beneath the observation point, at a distance of 5.3 km from the borehole. An outburst of soft gamma rays was detected with an amplitude multiple times above the level of background fluctuations, which occurred 7 days before the main shock of the earthquake. The outburst of gamma rays was accompanied by the simultaneous growth of geoacoustic emissions and a rising trend in the temperature in the borehole, which provided evidence in favour of seismogenic origin of the detected anomalies.
A significant increase in ionizing radiation both in the borehole and, after a ∼5 h long delay, above the soil surface can seemingly result from the intensified exhalation of radon from the deep lithosphere layers in the near-epicenter region. An increase in soil radon concentration followed by an increase in gamma ray intensity a few days before an earthquake in Eastern Taiwan was reported in [
9,
10].
In publications [
40,
41], it has been noted that anomalous changes in the content of radioactive substances may exist for a relatively long time after an earthquake, which is a good marker of an active geological fault. Indeed, when considering the behaviour of the gamma ray flux during some days after earthquake in
Figure 3,
Figure 4 and
Figure 5, it can be found, that frequently there was not any returning trend to the level of background intensity which had existed before the period of seismic activity. As an illustration, both at the moment of the 30 December 2017 earthquake and during some days after it, the gamma ray background was disturbed, which is best revealed in the dynamic power spectrum of the gamma intensity variation in
Figure 8. Similarly, a disturbance was observed at the Tien Shan station in the flux of environmental gamma rays and neutrons after the 1 May 2011 earthquake [
38]. As for the more distant earthquakes listed in
Table 1, in the cases of the 31 August 2018 M5.0, and, especially, of the 19 January 2020 M6.2 earthquakes, the flux of gamma rays remained suppressed for (5–10) days after the main shock, and during some days after the 15 February 2020 M5.6 earthquake, a tendency toward an enhanced intensity of the radiation flux was observed (see
Figure 3 and
Figure 4). Seemingly, the delayed restoration of the radiative background after an earthquake and the direction of the radiation intensity change reflect the regional peculiarities of the exhalation process of radon in the co- and post-seismic times.
Anomalous peaks in the intensity of acoustic signals in the pre-earthquake time, as plotted in
Figure 5, can result from the intensification of the processes of micro-crack formation within the stressed rock medium at the depth of the lithosphere. It is known that such processes are accompanied by the generation of elastic vibrations that propagate through the earth’s crust in the form of sound waves called geoacoustic emissions [
42,
43]. A ∼7 day long time delay between the beginning of the sequence of anomalous increases in the counting rate of acoustic pulses and the rise of gamma radiation in the borehole may reflect the time that was necessary for the radioactive substances to penetrate over the micro-cracks newly opened from the depth of the earth’s crust into the subsoil layers. The locally increasing trend of the temperature in the borehole, which generally coincides with the rise in gamma ray background, can also be connected with the exhalation of the deep lithosphere gases.
Simultaneously with the complex of anomalous effects observed before the 30 December 2017 earthquake, both in the borehole and above the surface of the ground, an ionosphere disturbance was registered as well, which revealed itself through the lowering of the Doppler shift of ionospheric signal. There are two basic models of disturbance propagation from the lithosphere up to the ionosphere height that are presently discussed in the scientific literature: the acoustic mechanism and propagation through the intermediary electric currents and fields.
The acoustic mechanism is studied rather well. According to this model, the vertical movement of the earth’s surface at an earthquake time generates infrasonic waves, which reach the ionosphere and can be registered in the Doppler shift of the ionospheric signal [
27,
28].
The mechanism of disturbance propagation through the electric currents and fields is based on the concept of the global electric circuit, suggested in 1921 by C. Wilson. A primary consequence of the stressed deformation change in the rocks before an earthquake is the emanation of radioactive radon and the daughter products of its decay, which leads to the ionization of the near-surface atmosphere layers. According to the concept of lithosphere-atmosphere-ionosphere coupling [
25,
26], under the influence of ionization, the conductivity of the atmospheric boundary layer changes next, which stimulates the generation of the electric fields and the formation of inhomogeneities of electron concentration in the ionosphere. In the frames of this concept, the disturbance of the Doppler frequency on the eve of the 30 December 2017 earthquake can be considered as an ionospheric response of seismogenic origin. The simultaneous detection of anomalies in different geophysical fields before an earthquake increases both the reliability of every particular observation and the fidelity of its connection with the process of earthquake preparation.
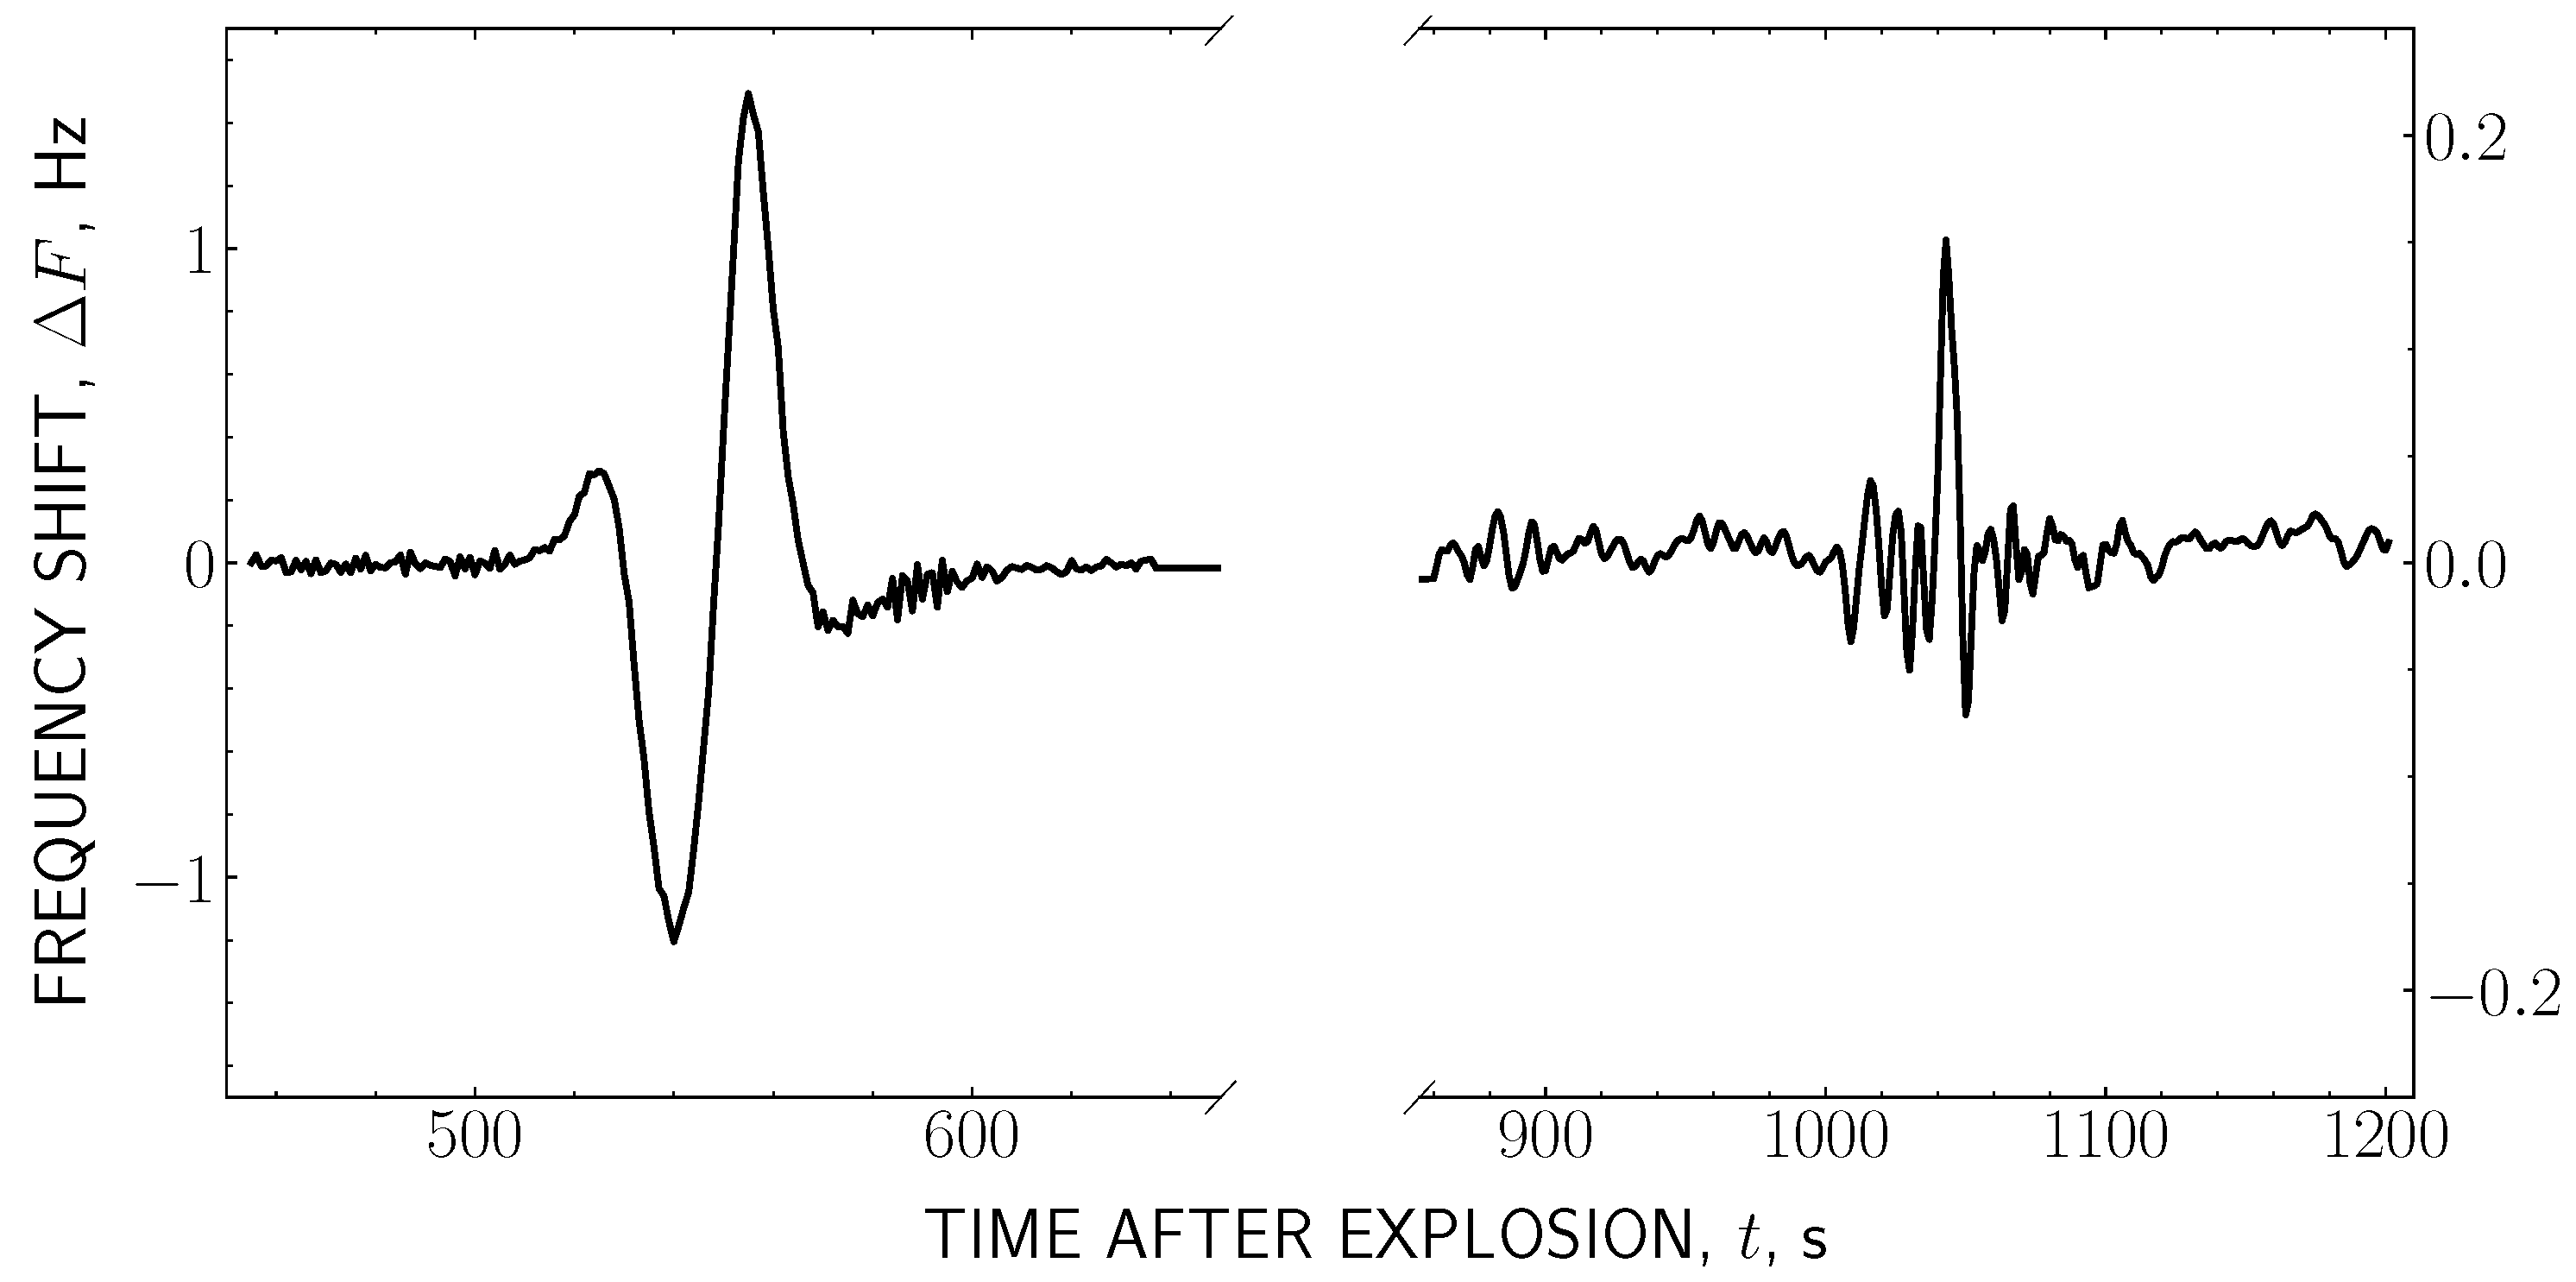
A confirmation of the mechanism of disturbance propagation into the ionosphere stimulated by the rise of radioactivity in the near-surface atmosphere was obtained via a retrospective analysis of the Doppler shift records, which were done during the underground nuclear explosions in the 1980s at the Semipalatinsk testing site in Kazakhstan. In
Figure 10, an original time history of Doppler shift values is presented, which was acquired on 19 October 1989 after a 75 kt TNT equivalent explosion. The Doppler ionosonde was placed at the testing site, such that the radio wave reflection point in the ionosphere was situated immediately above the epicenter. It is seen in
Figure 10 that 510 s (8.5 min) after the explosion, a large perturbation appears in the time series of Doppler frequency caused by the penetration of the intensive acoustic wave into the ionosphere. The source of this wave is the movement of the earth’s surface within the splitting zone of the explosion. Later on, at the time mark of 1005 s (16.75 min), another, essentially weaker, disturbance is present in the Doppler shift record.
The plot of
Figure 10 is one of the records made during the underground nuclear explosions at the Semipalatinsk testing site, when, according to the data of the dosimetric service, the radioactivity level in the near-surface atmosphere above the epicenter was enhanced up to (15–40) R/h. It was found that secondary disturbances of smaller amplitude were frequently met in such records. Usually, these disturbances appeared with a (15–18) min time delay upon the exit of the radioactive components of the explosion and of the large masses of natural radon and thorium ejected to the earth’s surface by the seismic influence of the explosion on the rock. It is interesting to note, that after a 260 t TNT fugas ground surface explosion in 1981 no secondary effect was detected in the Doppler shift record [
44]. For comparison, we can mention the results of a modern analysis of the consequences of an underground nuclear explosion on 12 February 2013 (Pungery, Northern Korea) [
26]. After the explosion, an M4.9 seismic shock was registered, and the appearance of a negative anomaly of electron concentration in the ionosphere was also detected according to the data of GPS satellites. This confirms the supposition of the authors of [
26] that the burst ionization at the exit of the radioactive components of the underground explosion onto the surface can be accompanied by a local increase in the atmosphere conductivity and a decrease in electron concentration in the ionosphere above the region of enhanced conductivity.
Thus, the current study succeeded at experimentally tracing an appearance of disturbances in the ionosphere under the triggering influence of ionization growths in the near-surface atmosphere, both connected with an underground nuclear explosion and with an M4.2 earthquake. While in the case of the explosion, the release of ionizing radioactive substances took place after the explosion, in the period of earthquake preparation, the exhalation of radioactive substances (radon and its decay products) was ongoing before the main seismic shock. The data presented here can be considered as direct experimental confirmation of the propagation of seismogenic disturbances from the lithosphere up to the ionosphere, in agreement with the concept of lithosphere-atmosphere-ionosphere coupling, in which the role of initiating link plays the ionization of the near-surface atmosphere.
5. Conclusions
The main results of the present investigation can be summarized as the following.
1. Presently, complex monitoring of the various geophysical fields is ongoing at the Tien Shan mountain scientific station and at the “Orbita” radio-polygon, which are located in a seismically hazardous region of northern Tien Shan in the vicinity of the sources of disastrous Vernen (M7.3), Chilick (M8.3), and Kemin (M8.2) earthquakes. The main purpose of this activity is searching for the seismogenic effects which precede an earthquake.
2. Before an M4.2 earthquake with a close epicenter distance of 5.3 km, the simultaneous appearance of anomalous effects in the variation of geoacoustic emissions, temperature, and gamma radiation in subsoil rock layers (at a depth of 40 m in a borehole), as well as of the gamma rays in the near-surface atmosphere, were found. The time delay between the beginning of the detected anomalies and the earthquake was about (7–10) days.
3. Simultaneously with the said seismogenic anomalies, disturbances were also found in the Doppler shift of the ionospheric signal on the low-inclined radio-pass. This effect is considered here in the frames of the lithosphere-atmosphere-ionosphere coupling concept as an ionospheric response of seismogenic origin.
4. Additionally, the ionosphere disturbances were detected by the Doppler shift of the ionospheric signal at the increase in radioactivity in the near-surface atmosphere after underground nuclear explosions.
5. Characteristic bay-like drops in the time series of the intensity of gamma radiation, both in the subsoil layers and in the atmosphere, were found (2–8) days before the M5.0–M6.2 earthquakes, which had an epicenter location at distances of (15–354) km from the gamma detector, within the limits of the Dobrovolsky radius.


 ,
, 


