Abstract
Predicting employability in an unstable developing country requires the use of contextual factors as predictors and a suitable machine learning model capable of generalization. This study has discovered that parental financial stability, sociopolitical, relationship, academic, and strategic factors are the factors that can contextually predict the employability of information technology (IT) graduates in the democratic republic of Congo (DRC). A deep stacking predictive model was constructed using five different multilayer perceptron (MLP) sub models. The deep stacking model measured good performance (80% accuracy, 0.81 precision, 0.80 recall, 0.77 f1-score). All the individual models could not reach these performances with all the evaluation metrics used. Therefore, deep stacking was revealed to be the most suitable method for building a generalizable model to predict employability of IT graduates in the DRC. The authors estimate that the discovery of these contextual factors that predict IT graduates’ employability will help the DRC and other similar governments to develop strategies that mitigate unemployment, an important milestone to achievement of target 8.6 of the sustainable development goals.
1. Introduction
In Sub-Saharan countries, the rate of graduate employability is rapidly declining in spite of the skills and competencies of graduates [1]. Twinoburyo et al. [2] have shown that Sub-Saharan countries have the highest unemployment rate in the world with an average of 7%, and the majority of those who are employed in such countries have substandard jobs. The rate of youth unemployment is 43 percent in Zambia and 33 percent in Rwanda and Malawi. [3]. By 2021, the proportion of unemployed youth in South Africa was 34.9 percent [4]. The democratic republic of Congo (DRC), a low-income country, is similarly experiencing high youth unemployment with more than 50 percent of youths being jobless or with low-paid jobs owing to poor education [5,6,7].
The large population of inactive youth in Africa today has yielded high insecurity as youths join armed groups for upkeep [8]. Consequently, there are problems such as violation of human rights, limited access to education, and substandard jobs for these youths [9]. In the DRC, more than 130 rebel army groups are composed of youths and children [10]. Thus, the employability of graduates is an important subject of academic and social debate. The United Nations sustainable development goal (SDG) target 8.6 was designed in 2015 to mitigate the high rate of unemployed youths globally. However, this target is yet to be achieved in 2022 owing to obstacles such as the COVID-19 pandemic [11,12]. It can be summed that no significant reduction has occurred in the global number of unemployed and uneducated young people, and that SDG target 8.6 is yet to be achieved, particularly in the DRC [13].
High unemployment rates and the security crisis in the DRC call for special emphasis to be put on identification and prescription of measures for predicting employability among youth groups [14,15]. Indeed, when youth unemployment extends over a long period, young people become exposed to the risks of delinquency and criminality, poor physical and mental health, and drug use. Large numbers of unemployed youth also poses a direct threat to national stability and undermines the success of economic and social development programs in the DRC [9].
Several factors have been identified for predicting employability in Sub-Saharan countries. In particular, South-African studies show that youth inclusivity, education quality, socio-economic stability among youths, design and implementation of policies, and stability of the labor market are influential factors affecting employability [4]. Etshim [16] concluded that limited collaboration between higher education practitioners and employers when setting appropriate academic curricula has largely contributed to unemployable youths. In the DRC, factors such as corruption, the underfunding of education and research, lack of adequate human capital, persistent wars, and lack of proper law enforcement have negatively affected employability of graduates.
The public sector in the DRC provides employment opportunities for young people [15]. Unfortunately, two major factors cause this initiative to be ineffective, namely nepotism and conflict of generations. Therefore, it can be concluded that factors which affect employability in Sub-Saharan countries are not uniform. The inconsistency of factors makes it difficult to generalize the implementation of mitigation measures. This calls for researchers within these countries to innovate ways of assisting the governments to curb unemployment.
Exploratory factor analysis (EFA) is a reliable but underutilized method for predicting employability in such unstable developing countries such as the DRC [17]. The nature of such countries is the presence of multiple hidden factors that hinder transition of graduates from university to the labor market [7]. Furthermore, the non-uniform nature of employability factors makes it difficult to predict uniformly for such countries. Many researchers have applied data mining techniques to predict employability by using secondary data and applying either feature selection to extract factors that predict this social fact [18] or feature engineering to constitute factors in order to provide appropriate factors that predict graduates’ employability [19] and then try to mitigate the unemployment problem by developing prescriptive models [20,21,22]. Nevertheless, the use of secondary data and the application of feature selection and feature engineering techniques to obtain factors constitute several challenges to capture relevantly graduates’ employability reality in developing countries, especially in the presence of socio-political and economic crises. This is because secondary data presents limitations such as the lack of transparency and reliability which limit the ability of researchers to comprehend the observed phenomena [23].
As a solution to this problem, feature engineering can be coupled with factor analysis techniques to enhance the reliability of retained factors [24]. EFA, which is one of the techniques of factor analysis, plays a preponderant role in data mining as it detects factors to be retained in an observed set of variables [25]. Qamhieh, Sammaneh, and Demaidi [21] observed that the best way of predicting and prescribing employability in developing countries is to consider contextual factors such as the prevailing socio-political and economic factors. It however appears that no study has proposed a consistent set of consistent factors from the EFA technique which can effectively predict the employability of IT graduates in sub-Saharan countries and allow the formulation of a generalizable predictive model. Thus, the main objective of this study was to predict the employability of IT graduates in the DRC using contextual factors as predictors (features). The specific objectives were to:
- (a)
- Identify contextual factors that predict the employability of IT graduates in an unstable developing country such as the DRC; and
- (b)
- Develop a deep stacking model using the identified contextual factors to predict the employability of such graduates.
The goal of the study was to contribute to the SDG target 8.6 realization by proposing the contextual factors that effectively predict IT graduates’ employability in the DRC and similarly unstable developing countries. The research also set out to determine a suitable machine learning (ML) model that will use the proposed factors to accurately predict IT graduates’ employability.
The subsequent sections will proceed as follows: Section 2 provides the main concepts of the study and a review of the existing literature. Section 3 presents the methodology used to conduct the research. Results from the analysis are presented in Section 4 and discussed in Section 5. Finally, Section 6 concludes with an overview of the study undertaking while advising the areas of future research based on the study limitations.
2. Literature Review
2.1. Sustainable Development Goal Target 8.6
SDG 8 is part of the 17 SDGs implemented by the UN in 2015 [26]. This SDG communicates the vision of the international labor organization (ILO) to promote decent and productive work for all human beings without exclusion [27]. SDG 8, which is dedicated to promoting a growing, sustainable and inclusive economy, productive and remunerative employment, and decent work for all humans [28] has 10 targets [29]. Target 8.6 states that by 2020, the proportion of unemployed youth, illiterate youth, and youth without vocational training should be reduced [13].
2.2. Exploratory Factor Analysis
Data are exponentially growing and becoming more available in the information age. From data, researchers can get insight of a problem because it establishes link between all human events to enable the understanding of the past and to project to the future. Data have become the main solution to organizational problems [30]. To get insight from data, several techniques can be used. EFA constitutes one of the techniques that enable scholars to organize, accumulate, analyze data. EFA assists social scientists to make optimized conclusions about which factors influence a social phenomenon. The technique enhances repeatability of a research results since it offers reliable outcomes when analyzing real-world phenomena [31]. Therefore, with the lack of consistent factors that influence employability in developing countries in the existing literature [21], EFA assisted the authors in the determination of relevant factors that can be examined in the DRC and generalized to similar developing countries that are faced with socio-political and economic instability [32]. Despite the difficulty of capturing factors that predict employability of youth in the DRC [24], EFA enabled investigators to develop a relevant questionnaire to reflect the understanding of social issues through a set of variables [33].
2.3. Deep Neural Network
Deep neural networks (DNNs) are constructed using the multilayer perceptron (MLP) architecture [34]. MLP is a feedforward model [35] which learns in two phases: forward and backward [36]. Given the loss function , with the inputs, parameters, the target, and as the weight of the connection from neuron i of layer h − 1 to neuron j, the MLP algorithm uses gradient descent theory or its variants to adjust weights by applying partial derivation of the loss function for each parameter [37] to get the new weight as follows:
represents the learning rate that is very important. It is a hyper-parameter to speed up the training of the artificial neural network (ANN) and is optimized based on the error of the validation set after a large number of neuron weight updates [38]. Several DNNs exist including convolutional neural network (CNN), long short-term memory (LSTM), recurrent neural network (RNN), and gated recurrent unit (GRU) [39]. CNN is a DNN that, although used in most cases to analyze visual imagery in deep learning (DL), can perform well in tasks such as image captioning, image classification, pose estimation, image segmentation, neural style transfer, and natural language processing (NLP) tasks [40,41]. In tasks which are not related to images, CNN uses 1-dimensional array representation instead of 2-dimensional or 3-dimensional arrays [42]. RNN uses the back-propagation algorithm for model training. The back propagation is performed for each time stamp. Therefore, RNN is also referred to as backpropagation in time model. It should be noted that this is the main problem of this type of DNN because its process generates the vanishing of the gradients. RNN offers the possibility to use previous outputs as inputs while having hidden states [43]. RNN is a suitable algorithm for time series problems [44]. Figure 1 illustrates the work flow of RNN.

Figure 1.
Graphical working flow of RNN. Reprinted with permission from ref. [43]. 2022, International Journal for Modern Trends in Science and Technology.
Because of the problem of gradient vanishing that characterizes RNNs, LSTM was developed with better long-term dependency memory capabilities. LSTM thus uses memory cells in the hidden cells of its layers [45]. LSTM has three main units. These are the forget gate, the input gate, and the output gate. The forget gate activates outputs using the sigmoid function. While the other two gates use upstream the sigmoid function and downstream the hyperbolic tangent function for activations [46]. On the other hand, GRUs are DNNs which are implemented to improve the standard RNN. The GRU uses update gate and reset gate as mechanism to solve the vanishing gradient problem. Thus, GRU is an optimized structure of LSTM [47]. Unlike LSTM which comprises three gates, GRU contains only two. Since GRU has no output gate, it is computationally more efficient than the LSTM [48]. Cell GRU uses the following functions to control the locking of outputs in the update and reset gates respectively [49]:
and represent, respectively, the update and reset gates. denotes the logistic sigmoid function, , and represent bias, while , and refer to weight matrices that correspond to each connected input vector. The weight matrices corresponding to the previous time step are represented by and The candidate hidden layer is represented by . denotes the hidden state from the previous timestamp t − 1. Tan stands for the tangent function. denotes the current hidden state [50,51].
2.4. Deep Stacking Model
Stacking is one of the ensemble ML algorithms [51] that consists of two different layers. The first layer, named the Base-learner, often includes one or more learning algorithms, and the second layer includes a model, also called Meta-learner, that learns from the results of the previous layer of the model [52]. An ensemble model is a set of different classifiers whose decisions are combined to classify new examples of data [53]. The primary objective of these types of methods is to improve the predictive performance of an individual learning model to fit it. Moreover, ensemble methods aim to build a linear combination of a certain model-fitting method instead of using a single method for fitting [54].
In the same logic as the ML method ensemble, there is the DL ensemble that combines DL models so that the final model has better performance for generalization [55]. Its use is of paramount importance while simultaneously training several models because this approach allows one to reduce the variance of DL models, and to combine the predictions of these different models [56]. In fact, when a DNN is being trained, it can be expensive regarding the computational dimension and cause a neural network to exhibit high variance [57]. To overcome this problem, it is best to train different neural network models and then combine their predictions [56]. The combination of these predictions might add bias but will counteract the variance of a single trained neural network model. Indeed, the combination of various neural network models is an efficient approach to guarantee the stability of the prediction and to improve its accuracy [58].
3. Materials and Methods
3.1. Computational Aspects
The current study was conducted in the entire region of the DRC while incorporating four Congolese linguistic zones (Kikongo, Lingala, Tshiluba, Kiswahili) [10] as strata instead of adopting the 26 provinces as the target population. The study utilized survey as strategy to collect primary data through a questionnaire from IT graduates. EFA was conducted to capture contextual factors for constructing the predictive model using retained factors. The authors used online Google form as tool to collect data. All the used codes to compute EFA phases and to build the deep stacking model were developed using Python 3.9.7 language. Additionally, the libraries used to process the collected data, verify the reliability of the questionnaire (using Cronbach’s Alpha test) and to verify the suitability of the collected data for EFA were instantiated from Python 3.9.7, released on 30 August 2021, created by Guido van Rossum at Stichting Mathematisch Centrum, in Amsterdam, Netherlands. The authors used Jupyter (version 6.5.5), created in 2014 out of the IPython project, as package from Anaconda 2.1.1 environment to write the pythonic codes of the study. Using HP Pavillon 11x360 PC to implement the project, the runtime of the entire code for the predictive model was 577.4 s. The runtime to process the collected data and to compute EFA reached 82.38 s. The processor for this used computer was Intel(R) Pentium(R) CPU N3540 @ 2.16 GHz 2.16 GHz and the operating system installed in was Windows 10 Home 64 bit with a RAM of 4 GB.
Regarding the objectives of the study and the applied methods to handle this research, the authors used known methods to first solve the problem of inconsistency of factors that predict Congolese IT graduates’ employability and subsequently to develop the deep stacking model using the identified factors to predict employability. Figure 2 below illustrates the entire process that the authors used to achieve the two specific objectives of the study.
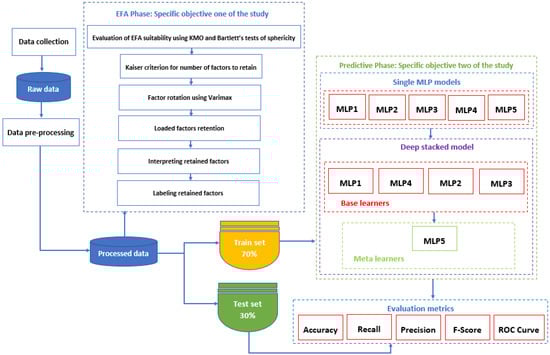
Figure 2.
Flowchart of the used methodology of the study.
In this research, the authors used MLP as the DNN model instead of CNN, LSTM, and GRU as the collected data was neither for timeseries nor contained images although 1D-CNN can be also suitable for binary and text classifications [42]. Figure 2 illustrates the flow chart of activities that ranged from the collecting the study data to evaluating the predictive models. Therefore, after collecting the data from IT graduates, the authors processed it in order to make it suitable for machine learning tasks. As the objective of this research was to predict the employability of Congolese IT graduates by using contextual factors as features, the researchers first performed EFA by following the steps of this data analysis technique, starting from the verification of the EFA assumptions to the labeling of the obtained factors. The obtained factors helped to feed the built predictive models. Five individual MLP models were constructed and were named MLP1, MLP2, MLP3, MLP4, and MLP5. The authors built the deep stacked ensemble model taking as base-learners, respectively, MLP1, MLP4, MLP2, and MLP3 while the meta-learner was the MLP5 model. The collected data was split in 70% for training set and 30% for test set. To evaluate and compare the results of these individual models and the stacked model, the authors applied the five-evaluation metrics (Accuracy, Recall, Precision, F1-Score, and receiver operating characteristic (ROC) curve) that are included in the architecture, in Figure 2.
The deep stacking model constructed in this study is summarized as pseudocode in Algorithm 1. The algorithm shows how the authors were able to define and train the base learner classifiers which are MLP1, MLP4, MLP2, and MLP3 and the meta learner classifier MLP5. The authors retained the above four MLP models in that order as base learners and MLP5 as the meta learner because this combination was identified to be the most accurate of all combinations. The combination of base learners and meta learners enabled building of a deep stacked ensemble model which they named StackMlx1. The stacked model thus allowed the authors to improve learning over any single MLP model on the training dataset (Dtrain).
| Algorithm 1 Pseudocode of the deep stacking model. |
| 1: Input: Dataset D = {(), (), …, ()} |
| 2: Base level classifiers MLP1, MLP4, MLP2, MLP3 |
| 3: Meta level classifier MLearn |
| 4: Output: Trained deep stacking classifier StackMlx1 |
| 5: BEGIN |
| 6: Split D to Dtrain and Dtest |
| 7: Dtrain = {(), (), …, ()} |
| 8: % Dtestwas used in the study to evaluate the performances |
| 9: Dtest = {(), (), …, ()} |
| 10: Step 1: Training of base learners by applying classifiers MLPi to Dtrain |
| 11: For i = 1 to 4 do |
| 12: = MLPi(Dtrain) |
| 13: End For |
| 14: Step 2: Constructing new dataset of predictions Dcreated from Dtrain |
| 15: For j = 1 to n do |
| 16: For i = 1 to 4 do |
| 17: % Here we start using to classify training example |
| 18: |
| 19: End For |
| 20: Dcreated = {}, where |
| 21: End For |
| 22: Step 3: Training the meta level classifier StackMlx1 |
| 23: MLP5 = MLearn |
| 24: StackMlx1 = MLP5(Dcreated) |
| 25: Return StackMlx1 |
| 26: END |
After training each of the base learner classifiers on the training dataset (Dtrain), the meta learner used the record decisions of base learners and their features’ output (see from line 15 to 20 in Algorithm 1) by constructing Dcreated in line 20 of the above pseudocode as a dataset to make a final accurate ensemble prediction with the StackMlx1 model.
3.2. Data Collection and Sample
The authors used data collected from March 2021 to April 2022 through a Google form. The questionnaire was developed with 43 items which were designed to suit the variables outcomes identified from the literature review. This questionnaire consisted of three sections. The first section contained demographic questions in three questions, the second section comprised research questions on the respondent’s socio-economic-political background situation in 25 questions, and the last section addressed the participant’s scientific skills in 15 questions. A total of 21 questions were on a two-point likert scale, nine on a three-point likert scale, six on a five-point likert scale, two questions on a 10-point likert scale; and seven other questions were designed on the six-point likert scale, eight-point likert scale, 11-point likert scale, and 13-point likert scale respectively. The explanation and details of the 43 items can be accessed through the following url: https://dataverse.harvard.edu/api/access/datafile/6311886 (accessed on 15 June 2022).
The collected data were exported to a csv file and used to capture the contextual factors for predicting employability. The authors opted for a survey study for obtaining the primary data because no secondary data could be availed to derive contextual factors that predict IT graduates’ employability in unstable developing countries were found. All graduates who resided within the DRC had completed their undergraduate degree or Masters’ degree in an IT program constituted the unit of analysis of this research [59]. Using snowball sampling technique, the authors received 421 questionnaires from the respondents. After processing data to remove inconsistencies, the final sample was reduced to 355. Although the study was quantitative, the authors opted for snowball as a non-probability sampling technique owing to its efficiency when identifying populations that are stigmatized on a bridge [60] and its convenience when the population under investigation is not immediately available to the researchers [61].
3.3. Data Pre-Processing
Since the data was collected from the DRC, a French-speaking country, the items and questions were written in French. As a processing step the authors used map(), a Pandas’ function to replace French values from the dataset to the English ones. Figure 3 gives the sample of the used pythonic code to translate data from French to English.
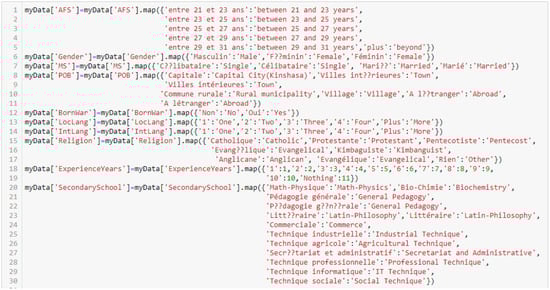
Figure 3.
Sample of used code to translate data from French to English.
After translation, the researchers applied the Pandas map() function to encode the translated data to a numerical value to make it suitable for statistical and ML tasks. The authors encoded the resultant English data using the following pythonic code in Figure 4.
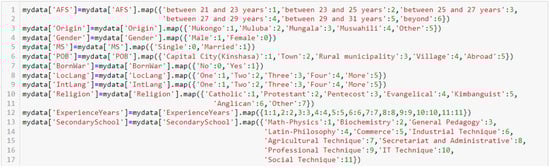
Figure 4.
Sample of used code to encode data and make it suitable for ML tasks.
Subsequently, the Cronbach’s Alpha test was conducted to verify the internal consistency of the questionnaire. A module was created in Python to compute this test, and the code in Figure 5 illustrates its implementation:
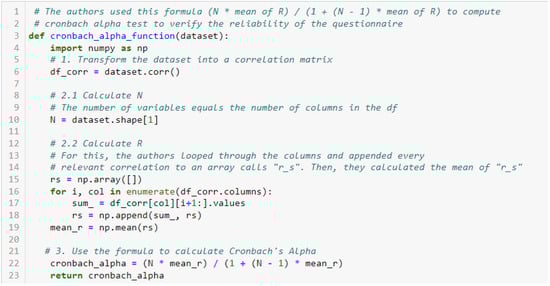
Figure 5.
Cronbach’s Alpha test for verifying internal consistency of the questionnaire.
The result of this test was 0.54 which was poor, but nevertheless considered as acceptable owing to the nature of questions that were not proportionally scaled [62]. Before proceeding to the EFA step, the authors verified suitability of the data by computing the Kaiser-Meyer-Olkin (KMO) test of partial correlation (i.e., with function calculate_kmo() from the factor_analyzer.factor_analyzer module) and Bartlett’s test of Sphericity (i.e., with function calculate_bartlett_sphericity() from the analyzer.factor_analyzer module). The former test presented a result of 0.67 and the latter provided the statistical significance of data with a p-value of 0.000 and a chi 2 of 1628.1. On the other hand, the authors used varimax as method from FactorAnalyzer() function to rotate factors. Thus, from the 43 items that the questionnaire had, EFA derived only five contextual factors grouping 14 items. The final contextual factors were retained after verifying their reliability by using Cronbach’s Alpha test. Only the items with a loading factor equal to or higher than 0.4 were considered.
After the EFA phase the dataset was split into training and test sets considering, respectively, 70% and 30%. Features which were used to predict employability were the fourteen items related to the five retained contextual factors. Thus, Figure 6 shows how those features and the target which was the column Employed were extracted:
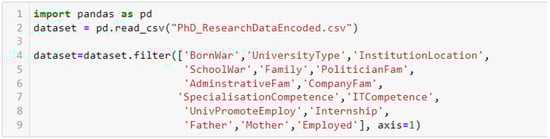
Figure 6.
Extracted contextual variables.
To ensure the numerical stability, higher accuracy, and precision of the DNN models [63,64], the researchers scaled all the data by using StandardScaler() as function from sklearn.preprocessing library. The code in Figure 7 illustrates the process of scaling:
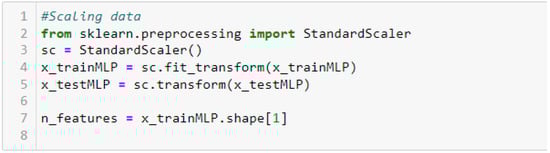
Figure 7.
Process of features scaling.
3.4. Designing the Individual MLP Models
Each of the five individual MLP models had six defined parameters as presented in Figure 8. The activation parameter determines the type of function to activate the output in each hidden layer. Alpha represents the regularization term that prevents overfitting of the model. As no loss function was defined, adam was used by default, while hidden_layer_sizes precises the number of neurons in each hidden layers of the models. The learning_rate parameter indicates the way of updating weights in the models. Max_iter is the epoch term, and random_state represents the number generation for bias and weights initialization. The architectures of the individual models are as follows:
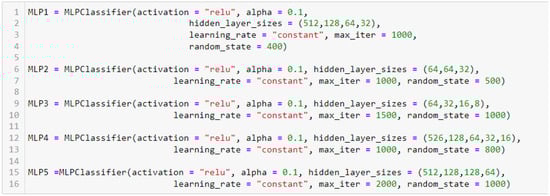
Figure 8.
Individual MLP model architectures.
The Figure 8 shows that MLP1 has four hidden layers. The first hidden layer has 512 neurons, the second 128 neurons, the third 64, and the last 32 neurons. MLP2 comprises three hidden layers which have, respectively, 64, 64, and 32 neurons each. MLP3 contains four hidden layers that have each, respectively, 64, 32, 16, and 8 neurons. While MLP4 has five hidden layers having each, respectively, 526, 128, 64, 32, and 16 neurons. The last individual MLP has four hidden layers. Its first hidden layer has 512 neurons, the second has 128 neurons, the third contains also 128 neurons, and the last comprises 64 neurons. By considering the input layer and the output layer for all the MLP models, it can be seen that MLP1 has in total six layers, MLP2 has five layers, MLP3 comprises six layers, MLP4 has seven layers, and MLP5 contains six layers. The input layer for all the models has fourteen neurons that represent the total number of the contextual variables and the output layer has only one neuron which is the binary possibility of a graduate being employed.
3.5. Designing the Deep Stacking Model
Given that a stacking model comprises the base learner and the meta learner layers, the authors defined MLP1, MLP4, MLP2, and MLP3 as base learners, while MLP5 was defined as the meta learner. Figure 9 depicts the structure of the stacking model.
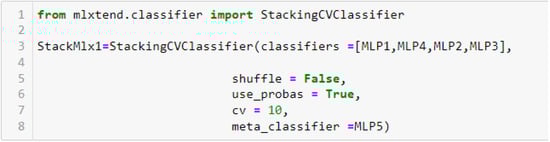
Figure 9.
Architecture of the deep stacking model.
The deep stacking model was implemented using the MLxtend library. This library can be used to implement regression and classification models and is compatible with the estimators provided in the scikit-learn library [65].
4. Results
4.1. Retained Contextual Factors to Achieve the First Specific Objective of the Study
Table 1 contains five contextual factors extracted from exploratory factor analysis to predict the employability of IT graduates in the DRC. The retained factors were labeled for identification. The fourteen related items (see Table 1, the third column) categorized in those five factors were the contextual predictors used to build the DNN models.

Table 1.
Obtained contextual factors that predict IT graduates’ employability in the DRC.
4.2. Predictive Models to Achieve the Second Specific Objective of the Study
The deep stacking model was built using five different MLP models as shown in Figure 2. The paragraphs below present results from the performance of each individual MLP model and the deep stacking model, and summarize these outcomes in order to illustrate graphically the improved performance of the deep stacked model over the individual MLP models. The performance of each individual MLP models is described next.
Using 1000 epochs and random_state of 400 for MLP1, the authors achieved an accuracy of 75%, 0.75 recall, 0.75 precision, and F1-score of 0.67. MLP2 recorded 77% as accuracy performance, recall and precision were both measured at 0.77, and F1-score was 0.71. Regarding MLP3, the results were such that accuracy reached 76%, recall and precision were 0.76 each, and F1-score gave 0.68. MLP4 performed a F1-score of 0.67, the accuracy of 75%, precision and recall reached 0.75 each. The last individual model (MLP5) gave an accuracy of 74%, its F1-score was 0.65, the recall was 0.74, and the precision was 0.74. For recalls and precisions, the study considered the weighted average. All the performances were evaluated on the test set.
After several iterations to fit the stacking model, the authors obtained an accuracy of 80%, recall of 0.80, precision level of 0.81, and F1-score of 0.77.
Table 2 summarizes the performances of all the trained models. As evident from the results, combining the five different models allowed optimization of the stacking model. These results proved the advantage of stacking as a variance optimization method [66].
Table 2.
Summary of the evaluation metrics.
In Figure 10, the histogram image illustrates that the deep stacking model has performed well with a higher accuracy, F1-score, recall, and precision than the five individual MLP models. MLP5 was the lowest model with an accuracy of 74%. Given that F1-score is a metric that determines the number of correctly classified class 1 objects, expressed as a proportion of the number of class 0 objects that are not correctly classified [67], the researchers concluded that the Deep Stacked model can make, in the real world, relevant predictions about the IT graduates’ employability as its value reached 0.77.
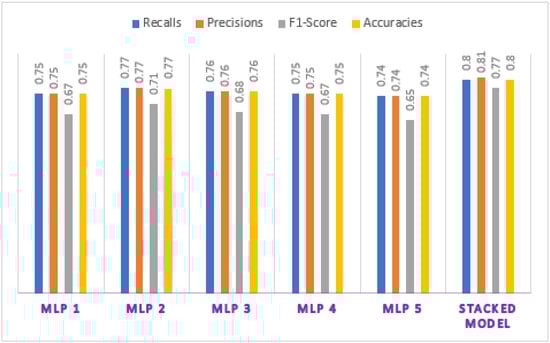
Figure 10.
Model performances chart.
Figure 11 shows the ROC curve. As evident from this figure, the area under the curve (AUC) of the stacked model reached 0.84. This indicates a 84% chance that the stacked model was able to distinguish between positive and negative classes when predicting IT graduates’ employability. AUC denotes the separability of classification such that values closer to 1 represent increasing excellence of the model [68].
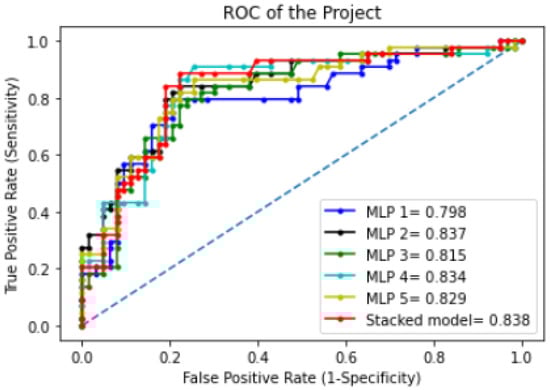
Figure 11.
ROC curves of the models.
5. Discussion
Several different factors have been proposed in previous studies to predict employability in the DRC. Okiemy and Etsiba [69] found that tribalism, favoritism, and corruption influence the decisions of many employers during the hiring process. Ngoy [15] estimated that conflict of generations and favoritism of young people to public services by their relatives were key factors that influenced employability in the DRC. Etshim conducted descriptive research and concluded that lack of collaboration between higher education practitioners and employers, the underfunding of education and research, corruption, favoritism, the lack of adequate human capital, persistent war, and lack of law enforcement in education were predictors of graduates’ employability in the DRC [16]. The existing literature has so far portrayed inconsistency in reporting the factors that predict employability of such graduates. In this research, five factors were discovered to be relevant predictors of the employability of IT graduates in the DRC. These were Socio-political, Relationship, Academic, Strategic factors, and Parental Financial Stability. These factors were derived from the forty-three variables that constituted the items of the study survey questionnaire and obtained after performing EFA.
Fourteen items from the forty-three items are related to the five retained factors. Thus, the authors were able to predict employability by using these fourteen variables as contextual features that predict the employability of IT graduates in the DRC. Given that the goal of this research was to develop a model of employability of graduates using contextual factors in the DRC and subsequently to discover see how the contextual factors could be managed to mitigate the unemployment problem, the results from this study make a valid contribution towards achieving the objectives of SDG target 8.6. From the methodological perspective, five MLP models (i.e., MLP1, MLP2, MLP3, MLP4, and MLP5) were constructed as individual models that the authors combined to build a deep stacking model. Each of these models used the obtained contextual factors as features in the predictive phase. The results of this research showed that all these individual models performed worse than the deep stacking model in terms of accuracy, recall, precision, and F1-score. The study findings confirmed that ensemble learning performs better than individual models, especially when researchers can identify the right models which can serve as base-learner and meta-learner models [70].
6. Conclusions, Limitations, and Future Research
To contribute to the debate on SDG target 8.6 achievement, this research was able to capture contextual factors that accurately predict the employability of IT graduates in the DRC. These factors allowed the authors to build a deep stacking model to predict employability. The performance of the deep stacking model obtained will allow to generalize this model for application in countries similar to the DRC.
The results of this research suggest that the contextual factors that predict the employability of IT graduates in the DRC are five. Three of these five factors strongly predict the employability of IT graduates in the DRC. These factors are socio-political, academic, and relationship. They strongly influence employability as their reliabilities using Cronbach’s Alpha test were, respectively, 0.82, 0.75, and 0.63, while two factors were selected as moderately influencing the employability of such graduates. These were strategic with a reliability score of 0.53, and parental financial stability with a reliability score of 0.52. Thus, this research provides factors that reflect the reality that predicts employability in unstable developing countries. This will allow these countries to be more sensitive to these internal factors and to be more realistic in implementing solutions that can mitigate unemployment problems. By integrating both skills (academic factor) and socio-political and economic factors (socio-political, relationship, parental financial stability, strategic) as predictors of employability of such graduates, this research will enrich the knowledge in the field of employability prediction in these types of countries in a theoretical manner.
Practically, this study provides a framework of reliable and contextual factors that allow predicting objectively and relevantly the employability of IT graduates in unstable developing countries. Hence, using those factors as features to predict employability will help students from such zones to optimize their decision making when enrolling to IT programs as based on their skills and socio-political and economic backgrounds. Furthermore, the proposed deep stacking model provides a theoretical foundation for instantiating predictive models in the IT field. Based on the outcomes of this study, the authors recommend the Congolese government to work on some socio-political and economic issues, which influence and predict employability in the whole country in order to enforce the reduction of the rate of unemployment for the achievement of SDG target 8.6.
In addition, having the knowledge of these obtained contextual factors that predict the employability of such graduates, the Congolese government will be able to develop strategies that mitigate unemployment and thus successfully achieve SDG target 8.6. Indeed, a problem is relevantly solved when the proposed solution is context-based [71]. Furthermore, the data collected from this research will contribute to existing IT and Information Systems knowledge as it will be added as tool to support researchers who would want to conduct data analytics studies on employability in unstable developing countries.
In view of the major contributions that this study has made, it was also faced with several limitations. First was the lack of secondary data that can effectively be used to depict the real problem of employability in unstable developing countries such as the DRC, and the research therefore relied on primary data from a survey study. Secondly, it was difficult to reach a large number of respondents owing to low reachability and high non-response rates among graduates in the DRC. To mitigate this limitation the authors adopted snowball technique to gather data from the study participants. One alternative was to utilize the institutions of higher learning to track alumni from historical records. Nevertheless, the research survey yielded a final data set of 355 records. Moreover, though the Cronbach’s Alpha test for strategic and parental financial stability as retained contextual factors was poorly significant, the authors included them in the results of specifically objective one and as features when achieving the second specific objective. Therefore, results of this study should be considered in light of those limitations.
Hence, regarding future studies, the authors proposed to increase the size of the dataset in order to guarantee the higher performance of the deep stacked model and to remove all the obtained factors that have Cronbach’s Alpha value less than 0.6 to ensure the relevance of the retained factors. Moreover, future studies should try to consider many academic programs instead of only the IT program when predicting employability of graduates. Those studies should also use other Coefficients which are more appropriate to non-scaled questions such as McDonald Omega test to check the reliability of the questionnaire. To mitigate the unemployment rate in unstable developing countries, feature studies should implement recommender systems as prescriptive solutions by considering the obtained contextual factors as predictors of employability of such graduates.
The results of this study constitute the first step of a core research that aims to develop a BERT-based recommender system to prescribe suitable Congolese IT students’ employability profiles by considering the discovered contextual factors as prescribers of employability of such students. Therefore, the authors suggest to improve especially the results of the specific objective one in future research by excluding all the factors which will have a lower Cronbach’s Alpha value than 0.6.
Author Contributions
Conceptualization, H.N.M.; methodology, H.N.M.; software, H.N.M.; validation, S.N.M. and L.W.M.; formal analysis, H.N.M.; investigation, H.N.M.; resources, H.N.M.; data curation, H.N.M.; writing—original draft preparation, H.N.M.; writing, H.N.M.; visualization, H.N.M.; supervision, S.N.M. and L.W.M.; manuscript proofreading S.N.M. and L.W.M., project administration, S.N.M. and L.W.M. All authors have read and agreed to the published version of the manuscript.
Funding
This work was fully funded by the Université de l’Assomption au Congo through grant No. UAC/ISDA.072022.
Institutional Review Board Statement
Not applicable.
Informed Consent Statement
Not applicable.
Data Availability Statement
The raw and encoded data used in this study can be accessed using the following link https://doi.org/10.7910/DVN/SI2RP1 (accessed on 15 June 2022).
Acknowledgments
The authors would like to express their profound gratitude to the Congregation of the Augustinians of the Assumption and the Management Office of the Université de l’Assomption au Congo for supporting this research.
Conflicts of Interest
The authors declare no conflict of interest.
References
- Kassa, E.T. Exploring Employability of Business Graduates: Evidence from Woldia University. J. Knowl. Econ. 2022. [Google Scholar] [CrossRef]
- Twinoburyo, E.N.; Henao, L.; Dushime, O.; Simkoko, A.; Kassa, Y.; Ndahiro, D. Africa 2030. Sustainable Development Goals. Three-Year Reality Check; The Sustainable Development Goals Center for Africa: Kigali, Rwanda, 2019. [Google Scholar]
- DTDA. Labour Market Profile: Tanzania Zanzibar 2021/2022. Copenhague: Danish Trade Union Development Agency. 2021. Available online: https://www.ulandssekretariatet.dk/wp-content/uploads/2021/06/LMP-Tanzania-andZanzibar-2021-Final.pdf (accessed on 3 May 2022).
- Geza, W.; Ngidi, M.S.C.; Slotow, R.; Mabhaudhi, T. The Dynamics of Youth Employment and Empowerment in Agriculture and Rural Development in South Africa: A Scoping Review. Sustainability 2022, 14, 5041. [Google Scholar] [CrossRef]
- ILO. World Employment and Social Outlook: Trends 2022; International Labour Organization: Geneva, Switzerland, 2022; Available online: https://www.ilo.org/wcmsp5/groups/public/---dgreports/---dcomm/---publ/documents/publication/wcms_834081.pdf (accessed on 3 May 2022).
- ILO. State of Skills: The Democratic Republic of the Congo; International Labour Organization: Geneva, Switzerland, 2019. [Google Scholar]
- Awad, A. From school to employment; the dilemma of youth in Sub–Saharan Africa. Int. J. Adolesc. Youth 2020, 25, 945–964. [Google Scholar] [CrossRef]
- Hussain, M.A.; Awad, A. Inactive Youth in Sub-Saharan Africa: Does Inequality of Opportunity Matter? Economies 2022, 10, 27. [Google Scholar] [CrossRef]
- USAID. The Impact of COVID-19 on Artisanal Gold Miners in Eastern DRC; USAID: Washington, DC, USA, 2020.
- IPSS. The Democratic Republic of Congo (DRC): Conflict Insights; Institute for Peace and Security Studies: Addis Ababa, Ethiopia, 2021. [Google Scholar]
- Sachs, J.; Kroll, C.; Lafortune, G.; Fuller, G.; Woelm, F. Sustainable Development Report 2021: The Decade of Action for the Sustainable Development Goals. Includes the SDG Index and Dashboards; Cambridge University Press: Cambridge, UK, 2021. [Google Scholar]
- Posel, D.; Oyenubi, A.; Kollamparambil, U. Job loss and mental health during the COVID-19 lockdown: Evidence from South Africa. PLoS ONE 2021, 16, e0249352. [Google Scholar] [CrossRef] [PubMed]
- Cieslik, K.; Barford, A.; Vira, B. Young people not in Employment, Education or Training (NEET) in Sub-Saharan Africa: Sustainable Development Target 8.6 missed and reset. J. Youth Stud. 2022, 25, 1126–1147. [Google Scholar] [CrossRef]
- Lipoko, D.U.D.; Iwu, C.G.; Opute, A.P. Gender discrepancy in economic participation: The case of young women in the Democratic Republic of Congo. EUREKA Soc. Humanit. 2021, 6, 14–30. [Google Scholar] [CrossRef]
- Ngoy, A.-R.B. L’Emploi des Jeunes en République Démocratique du Congo; L’Harmattan: Paris, France, 2018. [Google Scholar]
- Etshim, R. Collaboration between Higher Education and Labor Market in Kinshasa, DR Congo. J. Int. Educ. Leadersh. 2017, 7, 1–17. [Google Scholar]
- Zaleski, S.; Michalski, R. Success Factors in Sustainable Management of IT Service Projects: Exploratory Factor Analysis. Sustainability 2021, 13, 4457. [Google Scholar] [CrossRef]
- Sobnath, D.; Kaduk, T.; Rehman, I.U.; Isiaq, O. Feature Selection for UK Disabled Students’ Engagement Post Higher Education: A Machine Learning Approach for a Predictive Employment Model. IEEE Access 2020, 8, 159530–159541. [Google Scholar] [CrossRef]
- Mohamed, S.; Abdellah, E. Data Mining Techniques for Predicting Employability in Morocco. Int. J. Eng. Technol. 2018, 7, 17–20. [Google Scholar]
- Qamhieh, M.; Sammaneh, H.; Demaidi, M.N. PCRS: Personalized Career-Path Recommender System for Engineering Students. IEEE Access 2020, 8, 214039–214049. [Google Scholar] [CrossRef]
- Suryawanshi, K.; Patil, A.; Choudhari, M.S. Proposed Recommended System for Employability Skilling using Neural Network. Int. J. Adv. Res. Sci. Commun. Technol. 2021, 4, 111–117. [Google Scholar] [CrossRef]
- Parida, B.; KumarPatra, P.; Mohanty, S. Prediction of recommendations for employment utilizing machine learning procedures and geo-area based recommender framework. Sustain. Oper. Comput. 2022, 3, 83–92. [Google Scholar] [CrossRef]
- Martins, F.S.; Da Cunha, J.A.C.; Serra, F.A.R. Secondary Data in Research—Uses and Opportunities. Rev. Ibero-Am. Estratégia 2018, 17, 1–4. [Google Scholar] [CrossRef]
- Rawat, T.; Khemchandani, V. Feature Engineering (FE) Tools and Techniques for Better Classification Performance. Int. J. Innov. Eng. Technol. 2017, 8, 169–179. [Google Scholar] [CrossRef]
- Iantovics, L.B.; Rotar, C.; Morar, F. Survey on establishing the optimal number of factors in exploratory factor analysis applied to data mining. WIREs Data Min. Knowl. Discov. 2019, 9, e1294. [Google Scholar] [CrossRef]
- UN. Resolution Adopted by the General Assembly on 25 September 2015; A/RES/70/1; United Nations: New York, NY, USA, 2015. [Google Scholar]
- ILO. Gender Equality and Decent Work: Selected ILO Conventions and Recommendations That Promote Gender Equality as of 2012; International Labour Organization: Geneva, Switzerland, 2012. [Google Scholar]
- Rai, S.M.; Brown, B.D.; Ruwanpura, K.N. SDG 8: Decent work and economic growth—A gendered analysis. World Dev. 2019, 113, 368–380. [Google Scholar] [CrossRef]
- Frey, D.F. Economic growth, full employment and decent work: The means and ends in SDG 8. Int. J. Hum. Rights 2017, 21, 1164–1184. [Google Scholar] [CrossRef]
- Cuenca, V.; Urbina, M.; Córdova, A.; Cuenca, E. Use and Impact of Big Data in Organizations. In Artificial Intelligence, Computer and Software Engineering Advances, CIT 2020; Advances in Intelligent Systems and Computing Book Series; Botto-Tobar, M., Cruz, H., Cadena, A.D., Eds.; Springer: Cham, Switzerland, 2021; Volume 1327, pp. 147–161. [Google Scholar] [CrossRef]
- Goretzko, D.; Bühner, M. Robustness of factor solutions in exploratory factor analysis. Behaviormetrika 2022, 49, 131–148. [Google Scholar] [CrossRef]
- Preacher, K.; Zheng, G.; Kim, C.; Mels, G. Choosing the optimal number of factors in exploratory factor analysis: A model solution perspective. Multivar. Behav. Res. 2013, 48, 28–56. [Google Scholar] [CrossRef] [PubMed]
- Shrestha, N. Factor Analysis as a Tool for Survey Analysis. Am. J. Appl. Math. Stat. 2021, 9, 4–11. [Google Scholar] [CrossRef]
- Sarker, I.H. Deep Learning: A Comprehensive Overview on Techniques, Taxonomy, Applications and Research Directions. SN Comput. Sci. 2021, 2, 420. [Google Scholar] [CrossRef] [PubMed]
- Mpia, H.N.; Inipaivudu, N.B. Gradient Back-Propagation Algorithm in the Multi layer Perceptron: Foundations and Case Study. Int. J. Innov. Appl. Stud. 2021, 32, 271–290. [Google Scholar]
- Liu, H.; Fan, K.; He, B.; Wang, W. Unmanned Aerial Vehicle Acoustic Localization Using Multilayer Perceptron. Appl. Artif. Intell. 2021, 35, 537–548. [Google Scholar] [CrossRef]
- Omurlu, I.K.; Cantas, F.; Ture, M.; Ozturk, H. An empirical study on performances of multilayer perceptron, logistic regression, ANFIS, KNN and bagging CART. J. Stat. Manag. Syst. 2020, 23, 827–841. [Google Scholar] [CrossRef]
- Park, J.; Yi, D.; Ji, S. A Novel Learning Rate Schedule in Optimization for Neural Networks and It’s Convergence. Symmetry 2020, 12, 660. [Google Scholar] [CrossRef]
- Alzubaidi, L.; Zhang, J.; Humaidi, A.J.; Al-Dujaili, A.; Duan, Y.; Al-Shamma, O.; Santamaría, J.; Fadhel, M.A.; Al-Amidie, M.; Farhan, L. Review of deep learning: Concepts, CNN architectures, challenges, applications, future directions. J. Big Data 2021, 8, 1–74. [Google Scholar] [CrossRef]
- Galety, M.; Al Mukthar, F.H.; Maaroof, R.J.; Rofoo, F. Deep Neural Network Concepts for Classification using Convolutional Neural Network: A Systematic Review and Evaluation. Technium 2021, 3, 58–70. [Google Scholar] [CrossRef]
- Ghosh, A.; Sufian, A.; Sultana, F.; Chakrabarti, A. Fundamental Concepts of Convolutional Neural Network. In Recent Trends and Advances in Artificial Intelligence and Internet of Things; Intelligent Systems Reference Library Book Series; Balas, V., Kumar, R., Srivastava, R., Eds.; Springer: Cham, Switzerland, 2020; Volume 172, pp. 519–567. [Google Scholar] [CrossRef]
- Sharma, A.K.; Chaurasia, S.; Srivastava, D.K. Sentimental Short Sentences Classification by Using CNN Deep Learning Model with Fine Tuned Word2Vec. In Proceedings of the International Conference on Computational Intelligence and Data Science (ICCIDS 2019), Gurgaon, India, 6–7 September 2019; Volume 167, pp. 1139–1147. [Google Scholar] [CrossRef]
- Fayeem, A.; Kumar, A.; Sagar, R.; Aggarwal, A.; Jain, D. Stock Price Prediction: Recurrent Neural Network in Financial Market. Int. J. Mod. Trends Sci. Technol. 2022, 8, 259–264. [Google Scholar] [CrossRef]
- Ishfaque, M.; Dai, Q.; Haq, N.U.; Jadoon, K.; Shahzad, S.M.; Janjuhah, H.T. Use of Recurrent Neural Network with Long Short-Term Memory for Seepage Prediction at Tarbela Dam, KP, Pakistan. Energies 2022, 15, 3123. [Google Scholar] [CrossRef]
- Chandra, R.; Jain, A.; Chauhan, D.S. Deep learning via LSTM models for COVID-19 infection forecasting in India. PLoS ONE 2022, 17, e0262708. [Google Scholar] [CrossRef] [PubMed]
- Xie, C.; Wang, D.; Wu, H.; Gao, L. A long short-term memory neural network model for knee joint acceleration estimation using mechanomyography signals. Int. J. Adv. Robot. Syst. 2020, 17. [Google Scholar] [CrossRef]
- Bai, C. AGA-GRU: An Optimized GRU Neural Network Model Based on Adaptive Genetic Algorithm. J. Phys. Conf. Ser. 2020, 1651, 012146. [Google Scholar] [CrossRef]
- Kirori, Z.; Ireri, E. Towards Optimization of the Gated Recurrent Unit (GRU) for Regression Modeling. Int. J. Soc. Sci. Inf. Technol. 2020, V, 157–167. [Google Scholar]
- Mateus, B.C.; Mendes, M.; Farinha, J.T.; Assis, R.; Cardoso, A.M. Comparing LSTM and GRU Models to Predict the Condition of a Pulp Paper Press. Energies 2021, 14, 6958. [Google Scholar] [CrossRef]
- Lynn, H.M.; Pan, S.B.; Kim, P. A Deep Bidirectional GRU Network Model for Biometric Electrocardiogram Classification Based on Recurrent Neural Networks. IEEE Access 2019, 7, 145395–145405. [Google Scholar] [CrossRef]
- Jurek, A.; Bi, Y.; Wu, S.; Nugent, C. A survey of commonly used ensemble-based classification techniques. Knowl. Eng. Rev. 2013, 29, 551–581. [Google Scholar] [CrossRef]
- Susan, S.; Kumar, A.; Jain, A. Evaluating Heterogeneous Ensembles with Boosting Meta-Learner. In Inventive Communication and Computational Technologies; Lecture Notes in Networks and Systems; Ranganathan, G., Chen, J., Rocha, Á., Eds.; Springer: Singapore, 2021; Volume 145, pp. 699–710. [Google Scholar] [CrossRef]
- Utkin, L.V.; Zhuk, K.D. Improvement of the Deep Forest Classifier by a Set of Neural Networks. Informatica 2020, 44. [Google Scholar] [CrossRef]
- Bühlmann, P. Bagging, Boosting and Ensemble Methods. In Handbook of Computational Statistics; Gentle, J., Härdle, W., Mori, Y., Eds.; Springer: Berlin, Germany, 2012; pp. 985–1022. [Google Scholar]
- Ganaie, M.; Hu, M.; Tanveer, M.; Suganthan, P. Ensemble deep learning: A review. arXiv 2021, arXiv:2104.02395. Available online: https://arxiv.org/abs/2104.02395 (accessed on 15 May 2022). [CrossRef]
- Brownlee, J. Ensemble Learning Methods for Deep Learning Neural Networks. Machine Learning Mastery Pty. Ltd. 2018. Available online: https://machinelearningmastery.com/ensemble-methods-for-deep-learning-neural-networks (accessed on 15 May 2022).
- Ying, X. An Overview of Overfitting and its Solutions. J. Phys. Conf. Ser. 2019, 1168, 022022. [Google Scholar] [CrossRef]
- Goodfellow, I.; Bengio, Y.; Courville, A. Deep Learning; Massachusetts Institute of Technology: Cambridge, MA, USA, 2016. [Google Scholar]
- Li, W.; Xiang, P.; Chen, Y.-J.; Xie, X.; Li, Y.; Xie, X. Unit of Analysis: Impact of Silverman and Solmon’s Article on Field-Based Intervention Research in Physical Education in the U.S.A. J. Teach. Phys. Educ. 2017, 36, 131–141. [Google Scholar] [CrossRef]
- Valerio, M.A.; Rodriguez, N.; Winkler, P.; Lopez, J.; Dennison, M.; Liang, Y.; Turner, B.J. Comparing two sampling methods to engage hard-to-reach communities in research priority setting. BMC Med. Res. Methodol. 2016, 16, 146. [Google Scholar] [CrossRef]
- Naderifar, M.; Goli, H.; Ghaljaei, F. Snowball Sampling: A Purposeful Method of Sampling in Qualitative Research. Strides Dev. Med. Educ. 2017, 14. [Google Scholar] [CrossRef]
- Taherdoost, H.; Madanchian, M. Empirical Modeling of Customer Satisfaction for E-Services in Cross-Border E-Commerce. Electronics 2021, 10, 1547. [Google Scholar] [CrossRef]
- Nawi, N.M.; Atomi, W.H.; Rehman, M. The Effect of Data Pre-Processing on Optimized Training of Artificial Neural Networks. In Proceedings of the 4th International Conference of Electrical Engineering and Informatics (ICEEI 2013), Bangi, Malaysia, 24–25 June 2013; Volume 11, pp. 32–39. [Google Scholar] [CrossRef]
- Halim, K.N.A.; Jaya, A.S.M.; Fadzil, A.F.A. Data Pre-Processing Algorithm for Neural Network Binary Classification Model in Bank Tele-Marketing. Int. J. Innov. Technol. Explor. Eng. 2020, 9, 272–277. [Google Scholar] [CrossRef]
- Raschka, S. MLxtend: Providing machine learning and data science utilities and extensions to Python’s scientific computing stack. J. Open Source Softw. 2018, 3, 638. [Google Scholar] [CrossRef]
- Yao, Y.; Vehtari, A.; Simpson, D.; Gelman, A. Using Stacking to Average Bayesian Predictive Distributions (with Discussion). Bayesian Anal. 2018, 13, 917–1003. [Google Scholar] [CrossRef]
- Hand, D.J.; Christen, P.; Kirielle, N. F*: An interpretable transformation of the F-measure. Mach. Learn. 2021, 110, 451–456. [Google Scholar] [CrossRef]
- Yang, S.; Berdine, G. The receiver operating characteristic (ROC) curve. Southwest Respir. Crit. Care Chron. 2017, 5, 34–36. [Google Scholar] [CrossRef]
- Okiemy, M.; Etsiba, S. Employment Access and Job Search Channels for Young People in Congo. Theor. Econ. Lett. 2021, 11, 302–319. [Google Scholar] [CrossRef]
- Tang, Y.; Gu, L.; Wang, L. Deep Stacking Network for Intrusion Detection. Sensors 2022, 22, 25. [Google Scholar] [CrossRef] [PubMed]
- Ilhan, A.; Akin, M.F. Analysis of Contextual Problem Solutions, Mathematical Sentences, and Misconceptions of Pre-Service Mathematics Teachers. Int. Electron. J. Math. Educ. 2022, 17, em0666. [Google Scholar] [CrossRef]
Publisher’s Note: MDPI stays neutral with regard to jurisdictional claims in published maps and institutional affiliations. |
© 2022 by the authors. Licensee MDPI, Basel, Switzerland. This article is an open access article distributed under the terms and conditions of the Creative Commons Attribution (CC BY) license (https://creativecommons.org/licenses/by/4.0/).