Article

Analysis of the Evolution of the Relationship between the Urban Pattern and Economic Development in Guangdong Province Based on Coupled Multisource Data

1
School of Natural Science, Anhui Agricultural University, Hefei 230036, China
2
Key Laboratory of Agricultural Sensors, Ministry of Agriculture and Rural Affairs of China, Hefei 230036, China
*
Author to whom correspondence should be addressed.
ISPRS Int. J. Geo-Inf. 2022, 11(10), 512; https://doi.org/10.3390/ijgi11100512
Submission received: 24 August 2022 / Revised: 28 September 2022 / Accepted: 5 October 2022 / Published: 8 October 2022

Abstract

:
Regarding the rapid development of urban agglomeration (UA) in Guangdong Province in the past two decades, this study revealed the temporal and spatial evolution of the urban pattern of the province and the current urbanization process. This study determined the geographical spatial distribution and change in the UA lighting scale in Guangdong Province, analyzed the relationship between the lighting change and development and the dynamic evolution of the gross domestic product, and explored the expansion intensity and center of gravity migration direction of UA. The results showed that from 2000 to 2020, the lighting scale of the border areas of Guangdong Province was lower than that of the inland areas, whereas the lighting growth rate of the border areas was higher than that of the inland areas. The built-up area steadily expanded from the center to the outside within the time range of the study, and the center of gravity of the ellipse tended to shift northwest. The study provides visual and scientific data for the spatiotemporal evolution of the urban pattern in Guangdong Province and has important reference significance for analyzing urbanization development and planning urban construction.

1. Introduction

Urbanization is the process of expansion in urban population and scale, and the corresponding series of economic and social changes [1]. After the reform and development in 1978, China’s urbanization has been in a stage of rapid growth [2], and the rural areas and small towns of Guangdong Province have gradually become the main system of the new urbanization development direction. Additionally, the recent phased changes in construction land area and its gross domestic product (GDP) in rural areas and small towns are important indicators to accurately understand the expansion of UA and its economic development. They are significant in the study of the UA process in Guangdong Province, planning future urban construction, and conducting the integrated construction of related industries.
After the implementation of China’s reform and opening up policy in 1978, the process of urbanization in China accelerated. In the following three decades, the urbanization rate has increased by nearly 30%; during this period, the scope of urban built-up areas has rapidly expanded, compared with the land area in 1981, and has increased nearly fourfold. By 2018, the urban residence rate of China’s population was close to 60%, and the urbanization process entered a new stage. UA is a form of spatial organization in which cities within a specific range develop to the highest form [3]. It occurs when the relationship between cities changes from the main competition to the coexistence of competition and cooperation. The city is closely related to the spatial organization in the UA, with a high degree of co-urbanization and integration; therefore, UA is one of the most important carriers of global economic development [4]. Presently, China has formed UAs on the Pearl River Delta, the Yangtze River Delta (YRD), Chengdu–Chongqing, Beijing–Tianjin–Hebei, and other important locations. However, as the process of urbanization has accelerated, several environmental disasters, such as the increasing heat island effect, serious air pollution, and increase in the shortage of available water resources, have emerged [5]. Moreover, the uneven development among regions in the process of UA development is becoming increasingly serious, so we should formulate a balanced development strategy for UA in regions, and better planning for the development integration of UA should be investigated. The investigation by Chu et al. on UA has received considerable attention in the field [6]. From a quantitative perspective, the spatiotemporal evolution characteristics of the Beijing-Tianjin-Hebei UA are discussed through landscape patterns and statistical data analysis; however, considerable differences in landscape pattern index between cities and UAs are still observed, indicating that the method needs further development. J.Wang et al. [7] calculated the development level of UA in the YRD in 1978 according to various comprehensive evaluation index systems and models of environment and resources. According to Zheng.Z et al., [8] the frame system of UA are determined using mathematical analysis, which enriches the research content of UA. Laurence J. C. Ma [9] studied the process of urbanization in Guangdong Province using data from a comprehensive survey of cities and towns. However, only a relatively few investigations have been reported on the development and evolution of urban agglomerations, and the simple regional statistical data analysis and subsequent image data are no longer sufficient for UA studies. Luminous remote sensing has been widely used in the dynamic evolution of the urban spatial pattern because of its economy, timeliness, intuition, and accurate positioning of urban spatial distribution. After the National Defense Meteorological Satellite Program Operational Line Scanner (DMSP/OLS) night-light data were released in 1992, it was extensively used to monitor and analyze human activities and natural phenomena [10]. Afterward, based on the DMSP data, Z. Liu et al. [11] applied the method of systematic correction of multisatellite for many years to extract the dynamics of urban expansion in long series of years, which effectively reduced the abnormal deviation in night stable-light data. Imhoff et al. [12] used urban light footprints derived from DMSP/OLS satellite images combined with census data and digital soil maps to estimate the extent of built land in the United States and its potential impact on soil resources. Small et al. [13] measured the stability of DMSP data by comparing the brightening area and built-up area of Landsat images of 17 cities, and found that the brightening area of cities is always larger than the maximum estimated built-up area. Su et al. [14] proposed a neighborhood statistical method based on the relative spatial variation in adjacent built and nonbuilt pixels in DMSP images, and the area and perimeter area of the Pearl River Delta were extracted. Ye et al. [15] used DMSP night-light images and Landsat thematic mapper data to analyze the temporal change in land use and reveal the spatiotemporal dynamics of land use. Thereafter, in October 2011, the visible infrared imaging radiation sensor (VIIRS) aboard the Somi National Polar Rail Partnership of the United States was successfully launched [16]. NPP-VIIRS satellite data exhibit high resolution and more grayscale, which provides a high-quality global data source for the real-time monitoring of human activities and long-term large-scale urban research [17]. For example, Zheng et al. [18] used the noctilucent images obtained by VIIRS’s day and night band to monitor and evaluate cities in Northeast China and concluded that the intensity of expansion decreased from the border to the inland areas. Referencing statistical data, Shi, et al. [19] extracted the built areas from VIIRS and DMSP data and observed that the accuracy of VIIRS data was higher. Based on VIIRS data, the GDP distribution map and carbon dioxide emission model can be constructed to study the dynamic changes in different periods [20,21]. Based on the back propagation neural network classification, T. Ma et al. [22] divided NPP-VIIRS data images as urban and nonurban categories. Based on VIIRS composite data, Z. Yu et al. [23] extracted and compared the built-up areas of 17 prefectures and cities in Shandong Province and then determined the expansion types of each city.
Moreover, luminous remote sensing data are important in the exploration of urbanization. Henderson, [24] explored the extent to which the rapid development of urbanization was frequently caused by the low economic growth of a city. Z. Jiang et al. [25] compared the luminous intensity of NPP-VIIRS from 2013 to 2016 to accurately identify shrinking cities in the urbanization process in China. Based on multiyear remote sensing images and GIS technology, X.-Z. Pan and Zhao. [26] analyzed the spatial process of urbanization in Yixing City and its impact on soil resources. Combining night-light data and natural cities, Yang et al. [27] analyzed the overall development level of urbanization of urban centers in multicenter cities from many angles. Used night-light data also can estimate the urbanization speed, study the impact of regional economic factors on urbanization and build an urban illuminance index to quantitatively evaluate the process of urbanization [28,29]. Achievements have been made in the study of urbanization, such as by J. Liu et al. [30], who put forward the urbanization level index based on urban land area, together with the absolute urban expansion index and the relative urbanization expansion index, and described the process of urban expansion in China. Based on the DMSP data calibration method, Xin et al. [31] applied the correlation and multiple linear regression analyses to the social and economic factors of Wuhan. Based on the difference in pixel values between nighttime lights’ built-up area and non-built-up area to extract the annual built-up areas, test the urbanization process, and assess urban expansion [32], Y. Jiang et al. [33] used the irregular spatial grid analysis method to explore the dynamic changes in urban spatial expansion and socioeconomic vitality in Xinjiang from 2013 to 2017. Additionally, J. Pan. [34] retrieved the land surface temperature of Lanzhou from remote sensing data and extracted the elements of the urban heat island. Based on VIIRS statistical data and town-level GDP, Liang et al. [35] studied the specialization of GDP in Ningbo by multiple linear and random forest regressions. Shi, Yu, et al. [36] applied the linear regression method to fit the correlation between total night-light (VIIRS and DMSP data) and GDP and electric power consumption (from national statistics) in Chinese provinces and cities and observed that the correlation of the VIIRS data was higher. J. Ma et al. [37] selected the weighted combination model of the sigmoid function for the regression analysis of DMSP and logarithmic-transformed NPP-VIIRS data, which greatly improved the consistency of luminous data. Using Beijing–Tianjin–Hebei, YRD, and Pearl River Delta as study areas, Hesong et al. [38] performed the correlation analysis of the overlapping years in 2012 and 2013, and the power function model was used to transform NPP-VIIRS data to simulate DMSP/OLS data.
Traditional research based on DMSP/OLS light image data and statistical survey data is difficult to conduct because the data are single, and the image has a time lag. It hardly meets the urgent requirements of the current developments in remote sensing, whereas VIIRS data, because of their strong spatial orientation, short revisit period, and other advantages, are sufficient for research on urban expansion and its evolution. To study the spatial evolution law and characteristics of the urban pattern in Guangdong Province in the past 20 years, this study selected the long time series annual dataset after the fusion of the VIIRS and DMSP datasets as the basic data source and analyzed the relationship among the urban lighting scale, GDP, construction area, and ellipse center of gravity. The spatiaotemporal evolution of the urban pattern in Guangdong Province was studied using four analysis methods: night-light statistics, GDP spatial modeling, dichotomy extraction, and standard deviation ellipse. This study deeply analyzes the spatiotemporal evolution characteristics of the urban pattern in Guangdong Province and finds out the dynamic change law of GDP, with a view to providing a basis for the future formulation of urban construction planning and economic development strategy in Guangdong Province.

2. Study Area and Data

2.1. Study Area

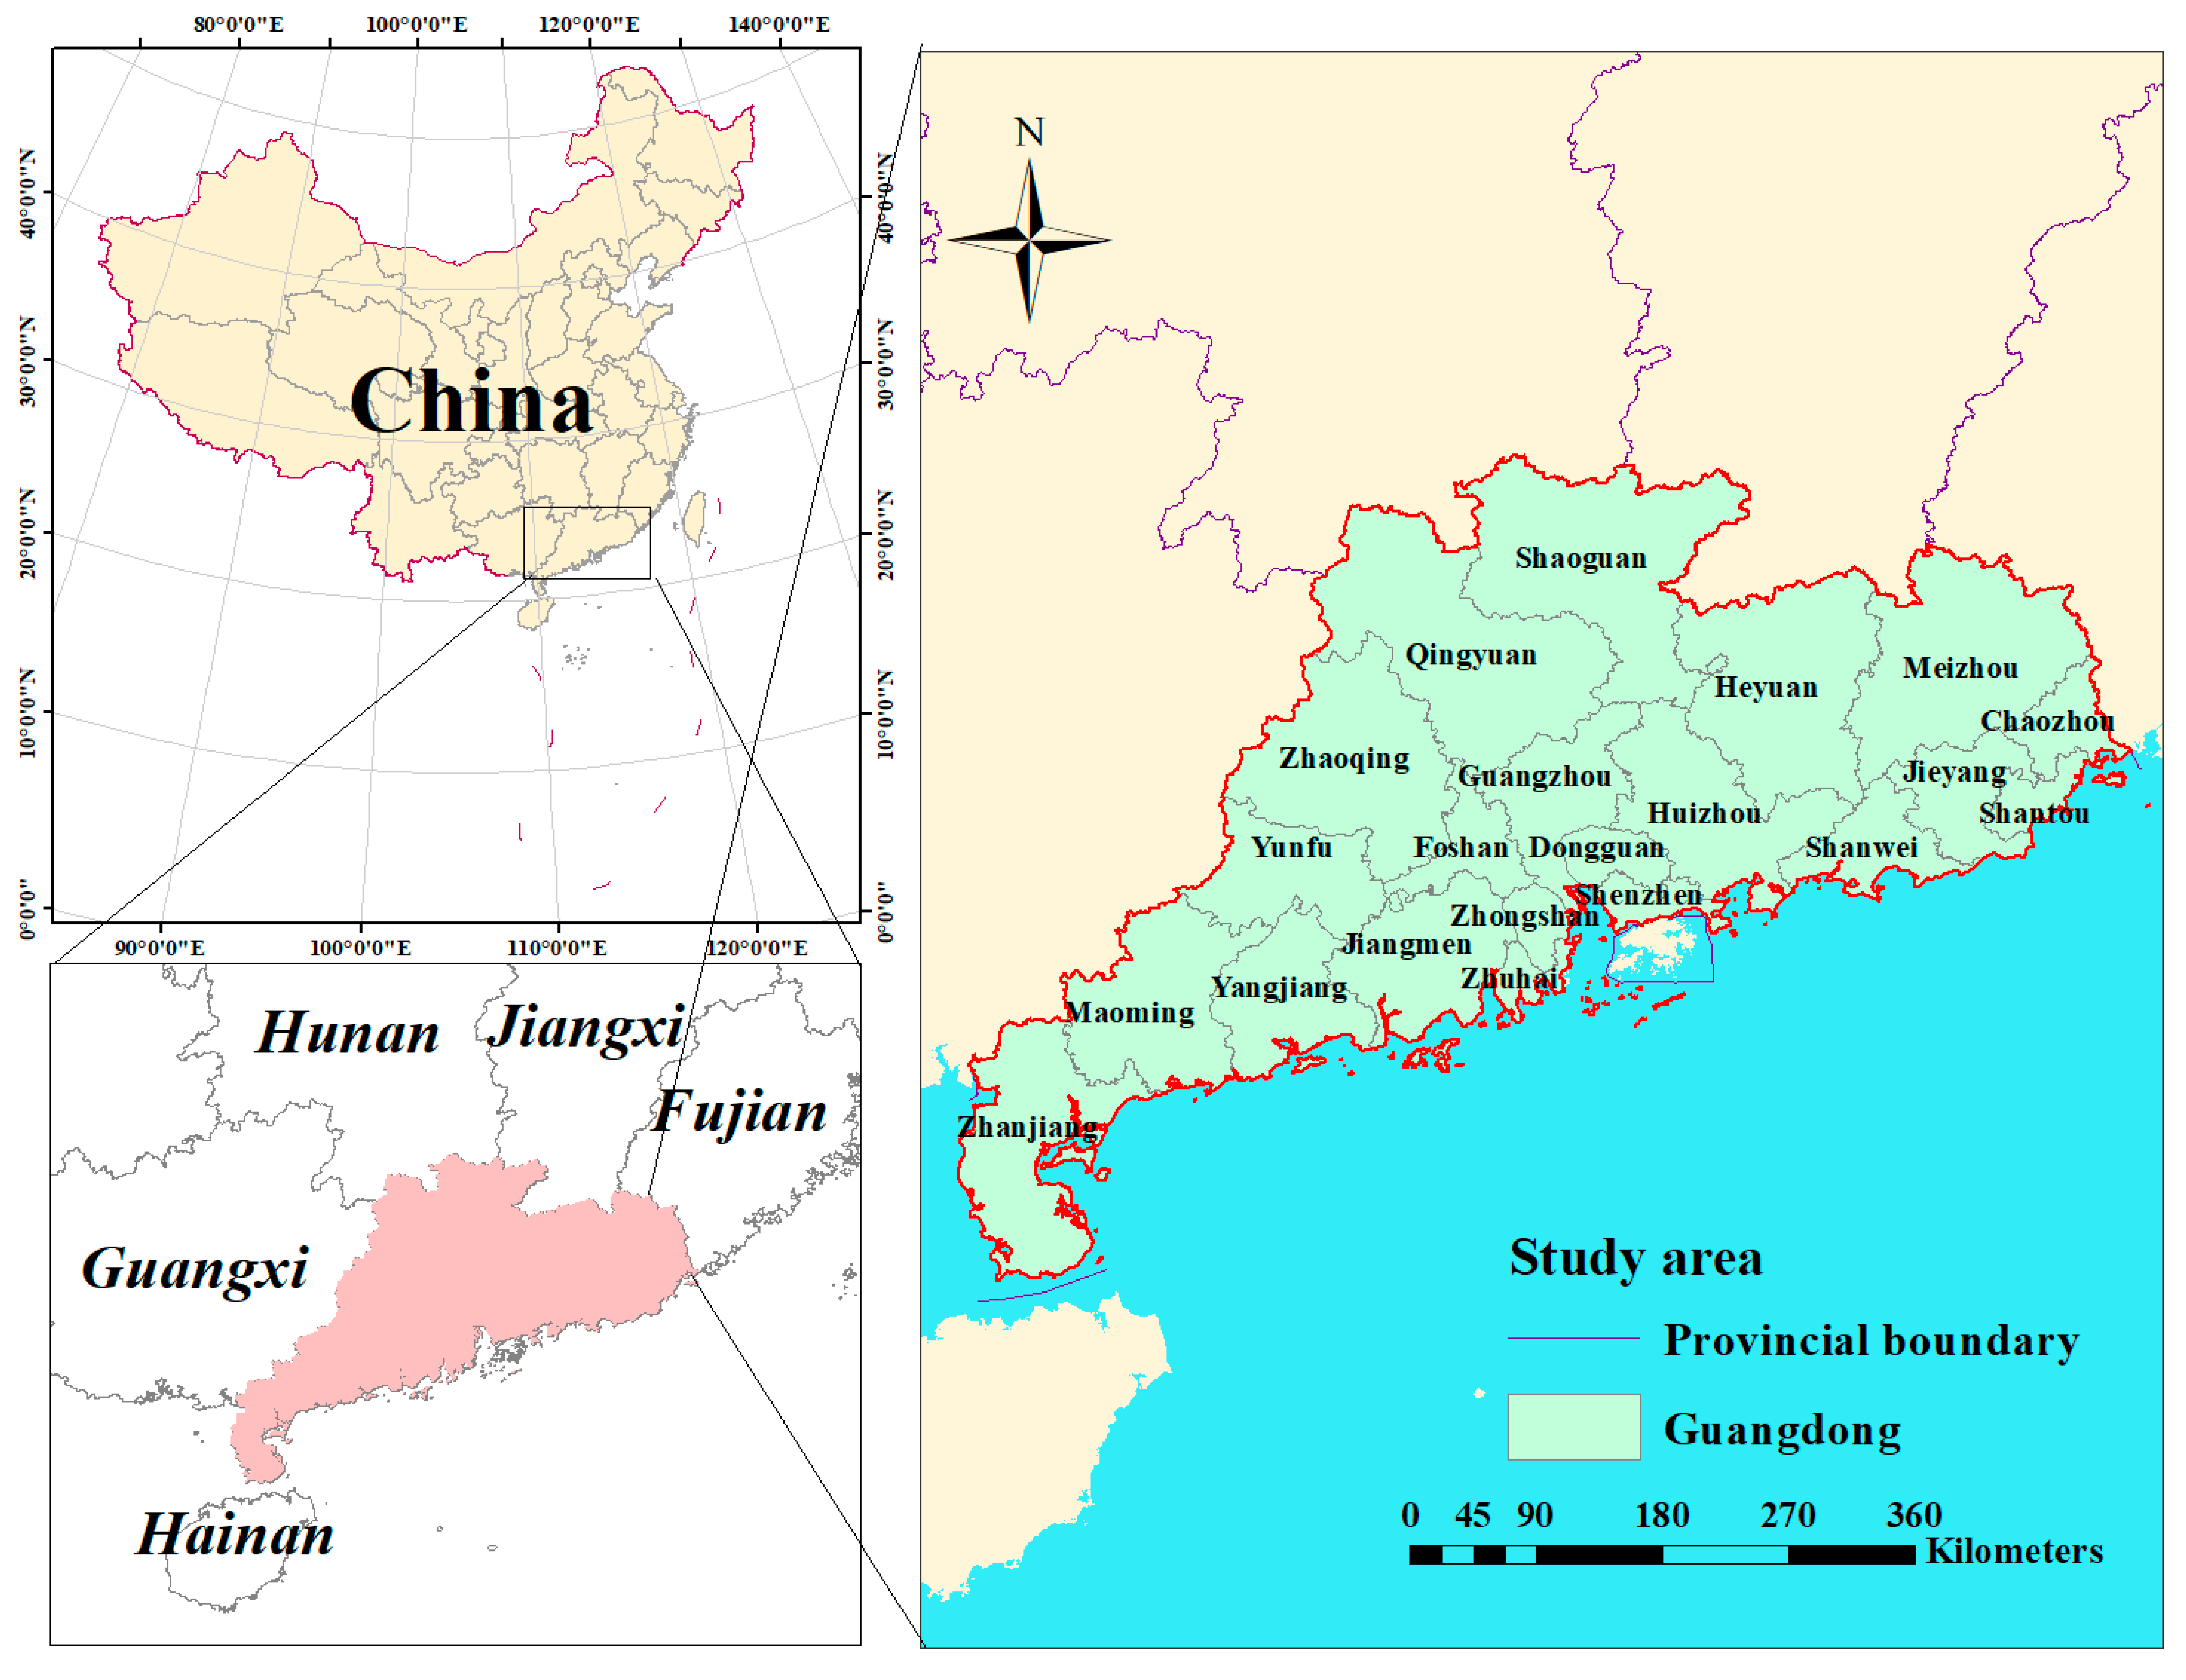
Guangdong Province is located in the southernmost part of the Chinese mainland, bordered by Fujian to the east, Jiangxi and Hunan to the north, Guangxi to the west, and the South China Sea to the south. The whole territory is located at (109°39′–117°19′ E), (20°13′–25°31′ N), with a length and width of −698 and −796 km from north to south and east to west, respectively. The total land area in the territory is ~178,900 km2 (Figure 1). The geological structure of the province is complex, with mountains in the north, hills in the middle, plain terraces in the south, and many rivers, mainly in the Pearl River basin (Dongjiang, Xijiang, Beijiang, and Pearl River Delta), rich in water resources. The Guangdong UA comprises 21 cities, adjacent to Hong Kong and Macao, with deepening regional financial cooperation and an average annual GDP growth rate of 14.1%, ranking as the Chinese largest provincial economy and the 14th biggest economy globally [39].

2.2. Data Sources and Processing

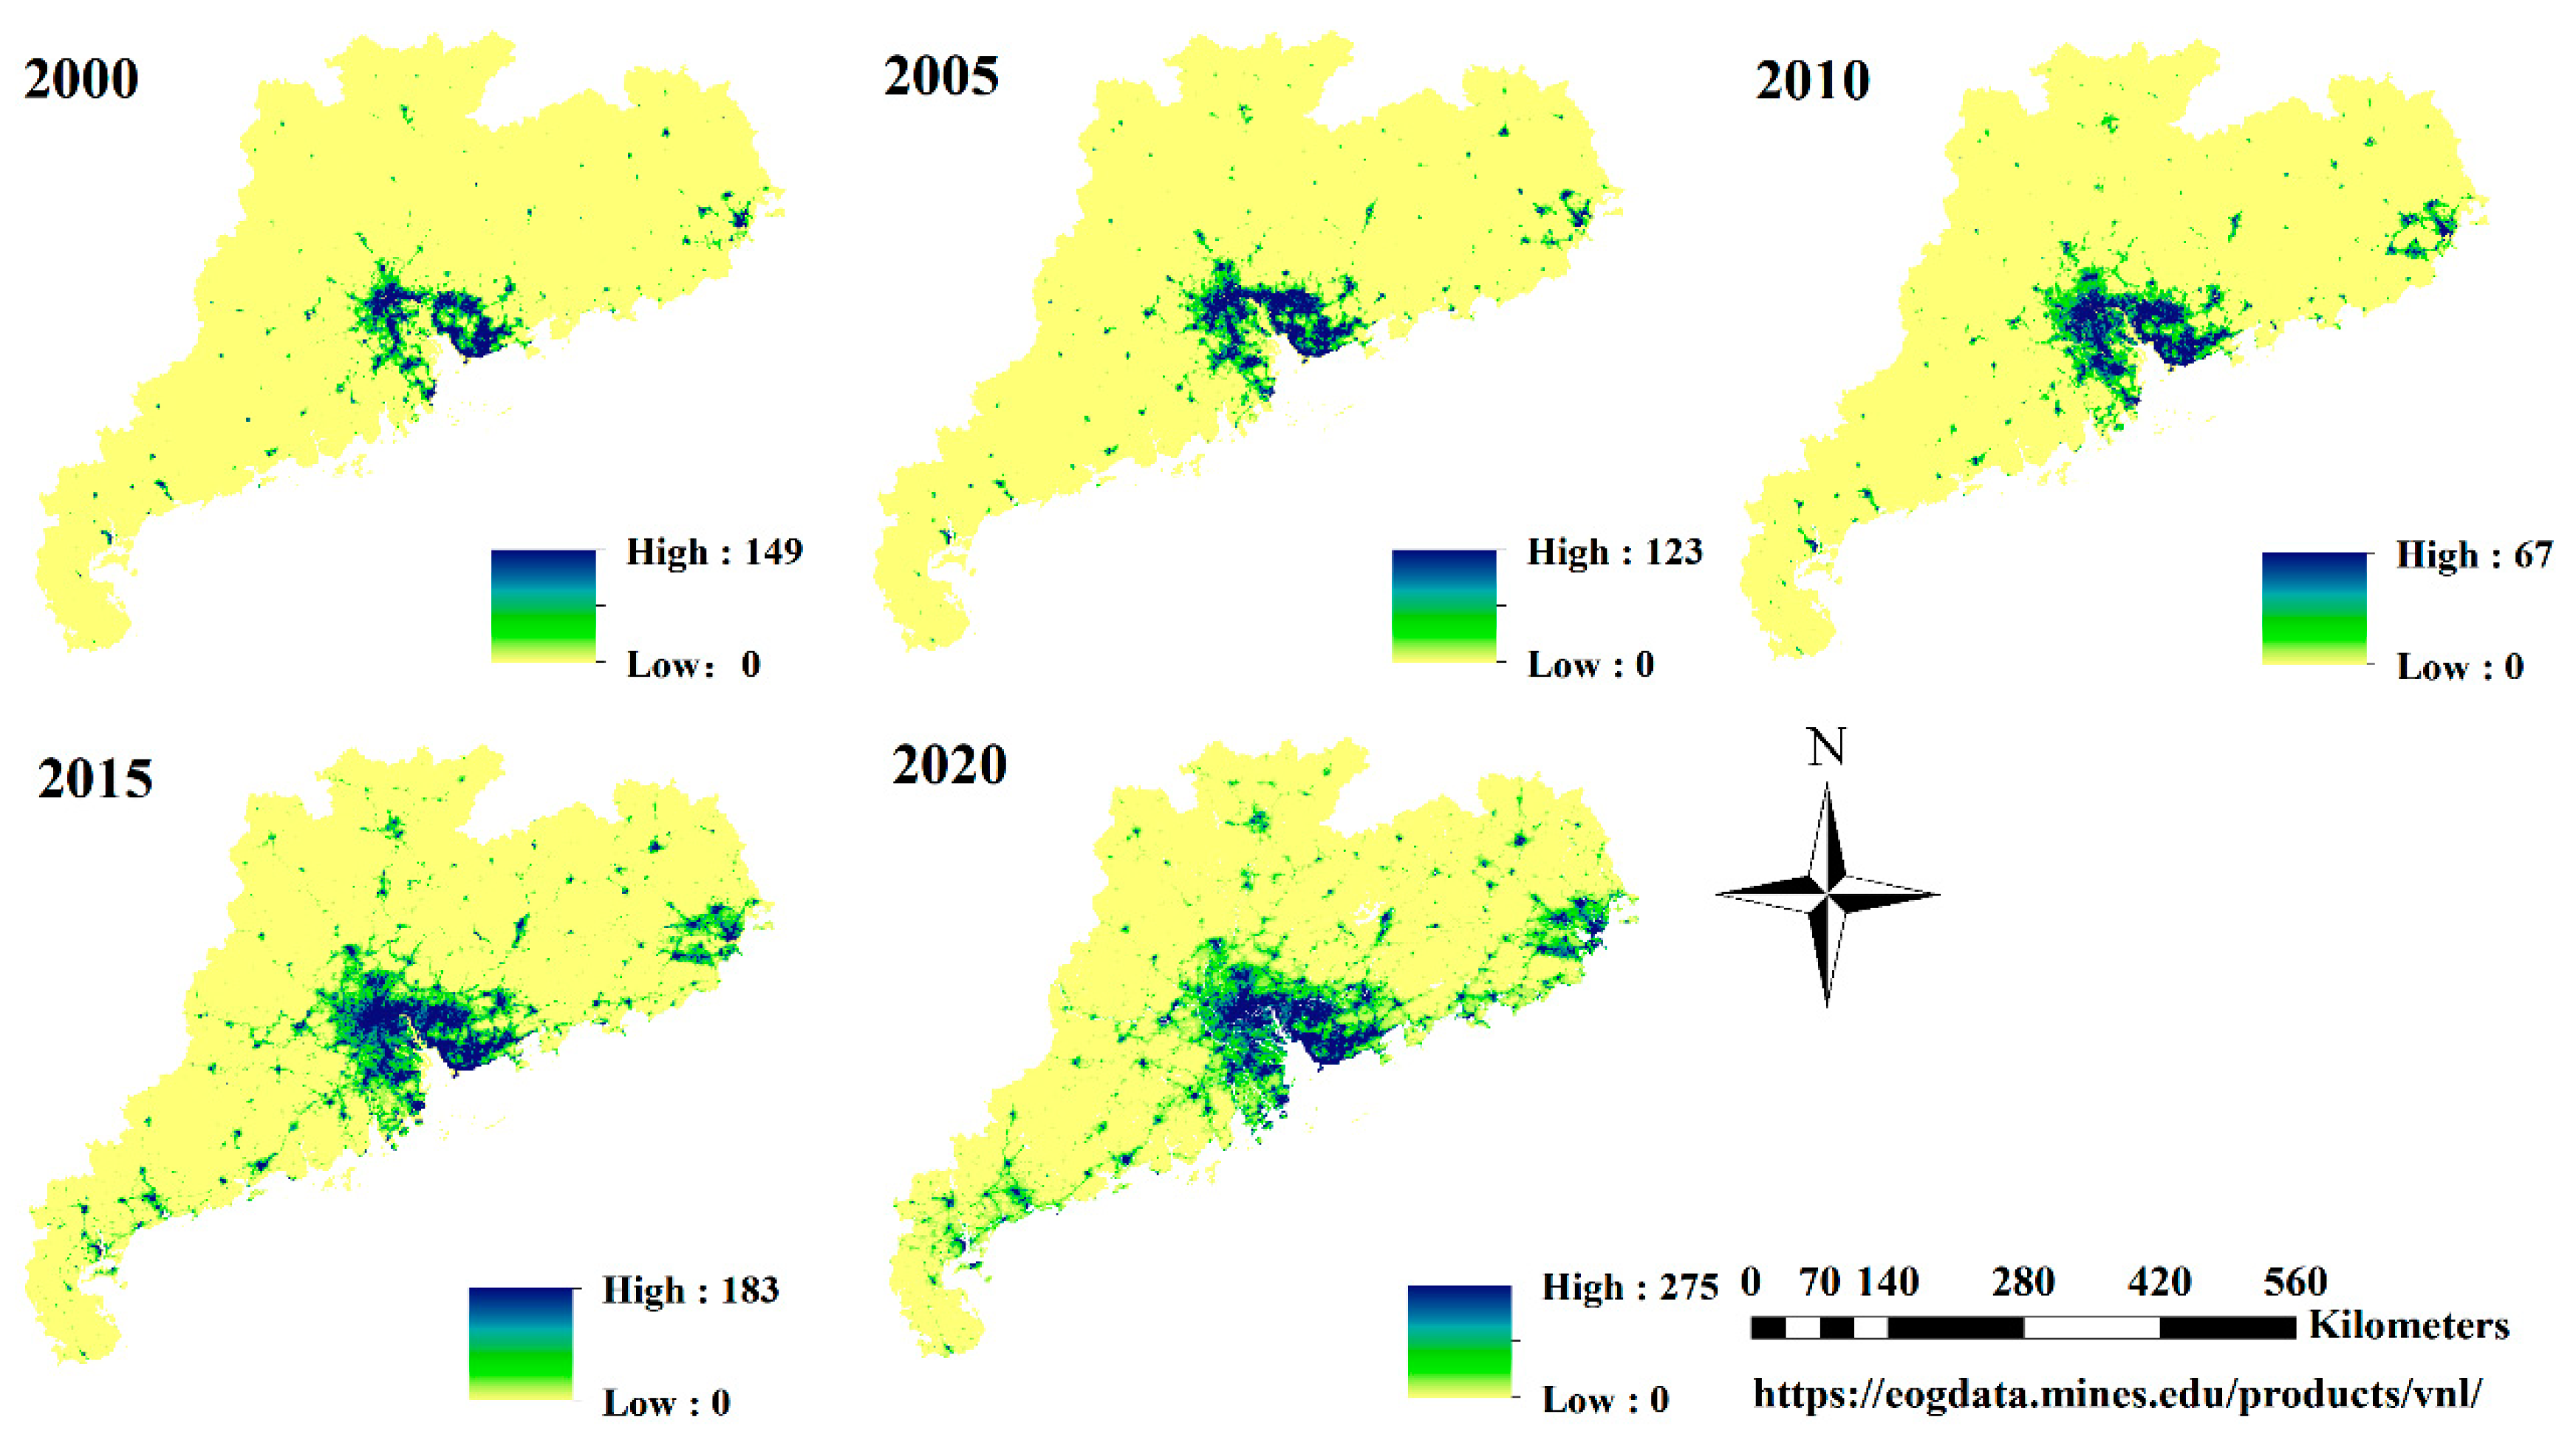
The NPP-VIIRS and DMSP-OLS night-light remote sensing data used in this study provide annual image products for the Earth Observation Group (downloaded from https://eogdata.mines.edu/products/vnl/ (accessed on 3 March 2022)). To accurately analyze the law of urban evolution in Guangdong Province in the past two decades, a function correction model should be established to correct each other for the annual DMSP light image data of long time series. Thereafter, based on the principle that the gray value of the pixel in the same position in the light image in the following year should not be lower than that of the previous year [40], the DMSP data should be continuously corrected, and the VIIRS data should be resampled to the same resolution. Finally, the best time interface for the fusion of the DMSP and VIIRS data sets was established, and the proposed long time series annual dataset was the basic data for this study. Because the change in the image of the continuous year is small, it is difficult to distinguish in the image, so we chose to divide the image with five years as the time interval. The luminous distribution maps for five years in the study area (2000, 2005, 2010, 2015, and 2020) are explained in Figure 2.

3. Methods

3.1. Night-Light Statistics

This study was based on the statistics of the changes in the total night-light of the Guangdong UA from 2000 to 2020, described by the total night-light, LTotal, which is the sum of the luminance value of each pixel in the region and the night-light growth rate, RGrow. The calculation formula is as follows:
L T o t a l = i = 1 n r i
R G r o w = L T o t a l 2020 L T o t a l 2000 L T o t a l 2000 × 100 %
where ri denotes the pixel radiance value of the i level lighting in the study area, and n is the total number of pixels.

3.2. Spatial Modeling of GDP

The total night-light intensity, TNL, and the average light relative intensity, I, were used to describe the economic level differences of the 21 administrative regions in Guangdong Province. According to Equations:
T N L = i = 1 63 ( D N i × n i )
I = T N L D N m a x × N L
where DNi and ni denote the pixel value of the i level lighting and its corresponding pixel number; NL and DNmax denote the total number of pixels and the maximum value of lighting in the region, respectively.
The corresponding TNL and I of each district were calculated; the correlation of the two indexes was analyzed using linear, power function, exponential, and logarithmic models; and the scatter diagram and threshold, R2, of the two groups, light index and GDP, were obtained [20]. R2 was discriminated, the best fitting light index was selected, and the spatial model of the light index and GDP statistical data was constructed. The model predicted the urban GDP output of the corresponding year, while the accuracy of the predicted value was verified by fitting the correlation between the statistical and simulation values, and the calculated simulated value was assigned to each pixel of the luminous image.

3.3. Dichotomy

For the extraction of built areas, previous investigation proposed mutation detection methods, higher resolution methods and so on; however, these methods are highly subjective and cannot accurately divide the region. The dichotomy has high accuracy because of its strong ability to capture weak light. The built-up area of Guangdong Province from 2000 to 2020 was found in the Ministry of Housing and Urban Construction of the People’s Republic of China (http://www.MoHurd.gov.cn (accessed on 3 March 2022)). Combined with the size of the pixels, the optimal threshold of light segmentation was discovered through experiments to reclassify the raster data to distinguish the built and nonbuilt areas. Thereafter, the difference in the built area in the study area was characterized, and the law of urban development was calculated.

3.4. Standard Deviation Ellipse

The standard deviation ellipse [41] reveals the spatial distribution of the center of gravity and range, based on the geographical location of the point elements in this study.
Here, an equation was used to calculate the variation in elliptical central coordinates between 2000 and 2020 and to reveal the characteristics of the spatial–temporal evolution of the center of gravity, distribution range, and shape of the Guangdong UA as follows:
X ¯ = i = 1 n X i W i i = 1 n W i
Y ¯ = i = 1 n Y i W i i = 1 n W i
where X ¯ and Y ¯ are the X and Y coordinates of the center of gravity of the standard deviation ellipse; Xi and Yi are the coordinates of pixels; Wi as the weight, the light grayscale value as the weight; and n is the total number of pixels.

4. Results and Analysis

4.1. Statistical Results and Night-Light Analysis

The TNL of Guangdong Province in 2000 and 2020 was calculated and shown in Figure 3. The results showed that the total amount of night-light exhibited an upward trend. In 2000, the total amount of light in Shenzhen, Dongguan, Guangzhou, and Foshan was the highest, ranking in the first echelon, and the lighting scale among the four cities was close. The second echelon closely following was Jiangmen and Shantou, and the total amount of lighting in the two cities was close to the average level. The total amount of light in other cities was lower than average, indicating that there was a large gap in the scale of lighting between cities. In 2020, the total amount of light in Guangzhou, Shenzhen, Dongguan, and Foshan is still ranked in the first echelon, of which Guangzhou has become the city with the highest total amount of night lights, and Huizhou has the most significant growth in the past two decades, while other cities have increased significantly.
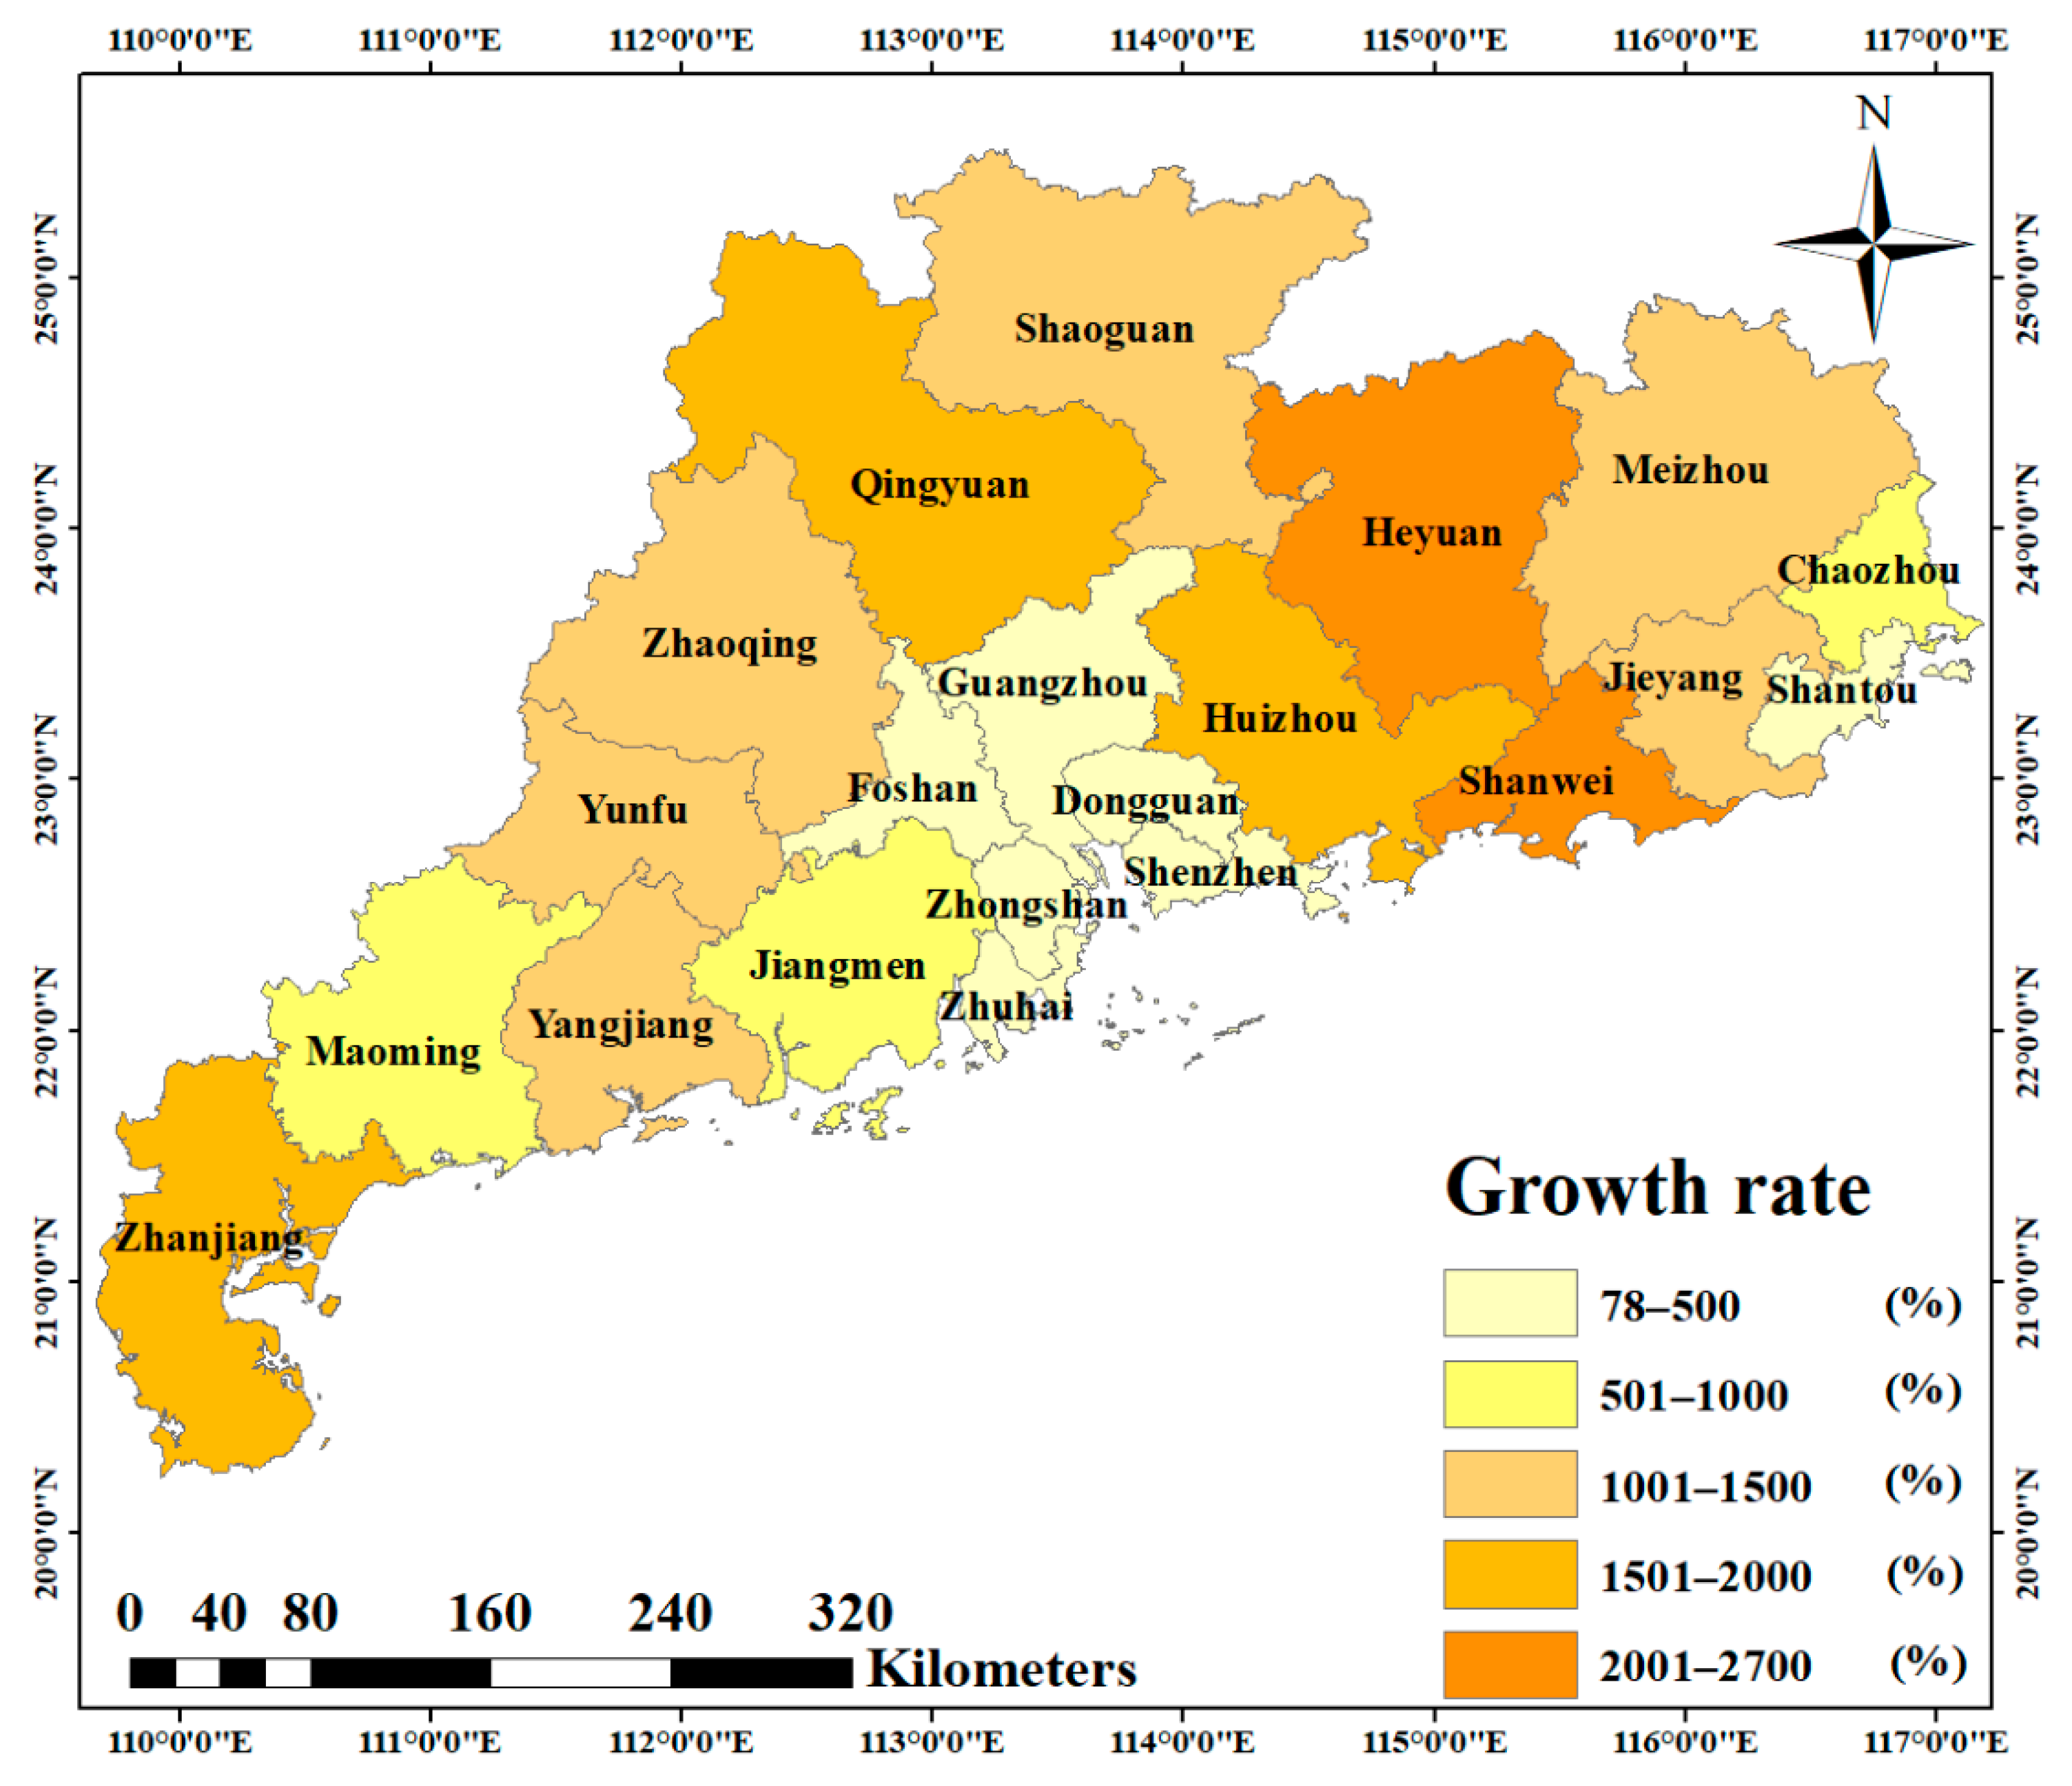
The luminous growth rate of the 21 prefecture-level cities in Guangdong Province was calculated, and the prefecture-level cities of the Guangzhou UA were divided into five levels, according to the lighting growth rate in Figure 4. Qingyuan, Huizhou, Heyuan, and Shanwei exhibited growth rates exceeding 1501%. The lighting growth rate was the highest in the long time series span of nearly two decades. The cities with a lighting growth rate of 1001% and 1500% are Yunfu, Zhaoqing, Yangjiang, Meizhou, Jieyang, and Shaoguan, and the lighting scale of cities has increased greatly. The growth rate of lighting scale in other cities is lower than the average (980%), among which the regional growth rate centered on Dongguan, Shenzhen and Guangzhou was less than 500%.
Regarding the difference in the night-light scale, from 2000 to 2020, the lighting scale of border areas in Guangdong Province was lower than that of inland areas, and the lighting growth rate was more significant than that of the inland areas. The lighting scale of the border areas particularly grew rapidly, whereas the inland areas were in a relatively flat situation. In the past two decades, the lighting scale of all prefecture-level cities has increased significantly, but there is still a large gap between the border areas and inland areas, and the development differences between regions are still obvious.

4.2. Spatial Modeling of GDP

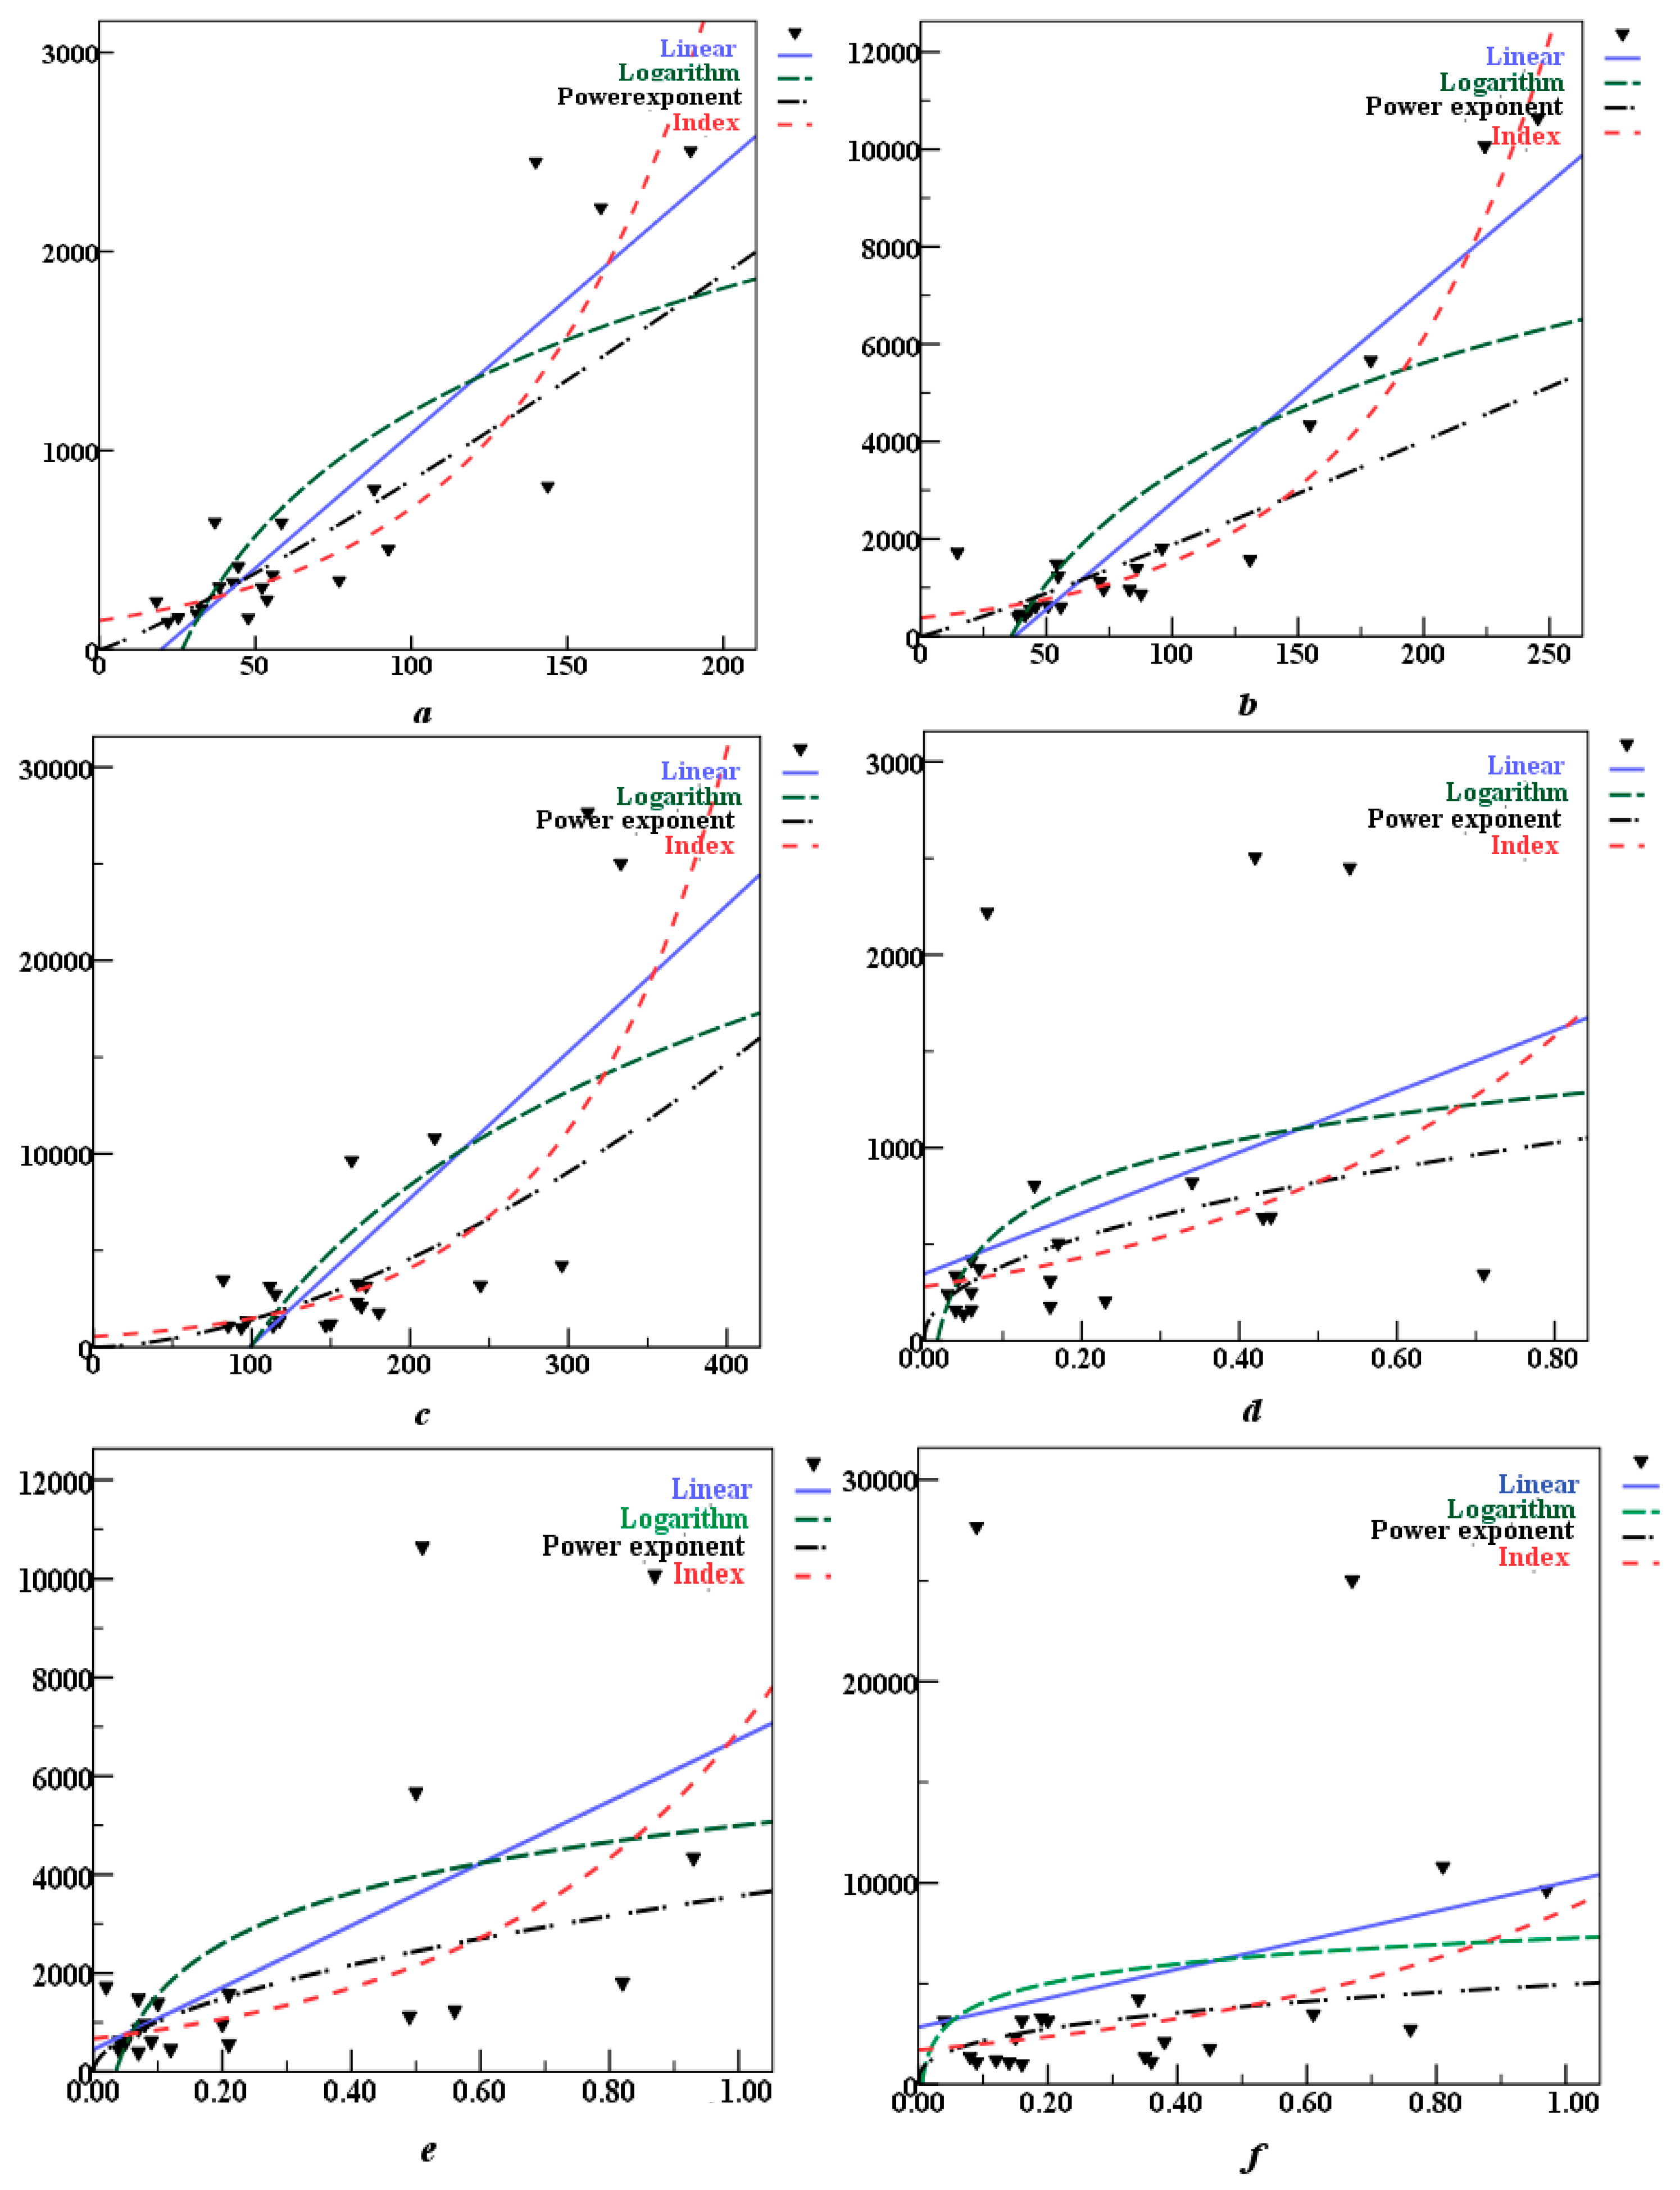
Using the GDP statistical data of the 21 administrative regions in Guangdong Province found in the Guangdong statistical yearbook (http://stats.gd.gov.cn/gdtjnj/ (accessed on 3 March 2022)), combined with TNL and I, the linear, logarithmic, power exponent, and index regression models between the GDP statistical data and TNL and I were established. Figure 5 shows 2000, 2010, and 2020 data.
The correlation of strong and weak between coordinate points and trend lines can be found directly from the trend lines of the four regression models in the diagram. In order to determine the best regression model, the R2 of linear, logarithmic, exponential, and exponential-regression models is statistically analyzed. The results are shown in Table 1.
The correlation coefficients between the GDP and average relative light intensity were below 0.55; therefore, they were not suitable for studying the correlation between the GDP and light index in Guangdong Province. However, among the four regression models of the total night-light and GDP, the power-exponential regression model had the highest correlation coefficient, i.e., the correlation between TNL and GDP was the strongest (R2 = 0.874).
Summarily, the TNL light index with the highest correlation coefficient with a 95% confidence interval was selected as the best regression model. The corresponding equation is
G D P i = P 0 × Q i P 1
P0 is regression model coefficients, and Qi represents TNL or I. The regression models for 2000, 2010, and 2020 are y = 1.8276x0.592, y = 1.738x0.708, y = 0.005x1.214, respectively.
The regression model was used to predict the urban GDP, and the linear relationship between the statistical and predicted GDP was fitted. The R2 of 2000, 2010, and 2020 was 0.8778, 0.8362, and 0.8542, respectively, in Figure 6. The Figure 6 shows a large error between the predicted values and statistical values of individual cities. It is mainly due to the saturation of pixel gray values in Guangzhou, Foshan, and other cities; however, the urban economy is still in the early stages of rapid development, resulting in a mismatch between GDP and light grayscale values, and the error increases. However, in cities such as Dongguan and Shenzhen, the total number of pixels is less because of the small urban area, thereby increasing the error values. However, compared with the economically backward areas, there is a strong correlation between the predicted values and statistical values of GDP, so the calculated simulation data have certain applicability.
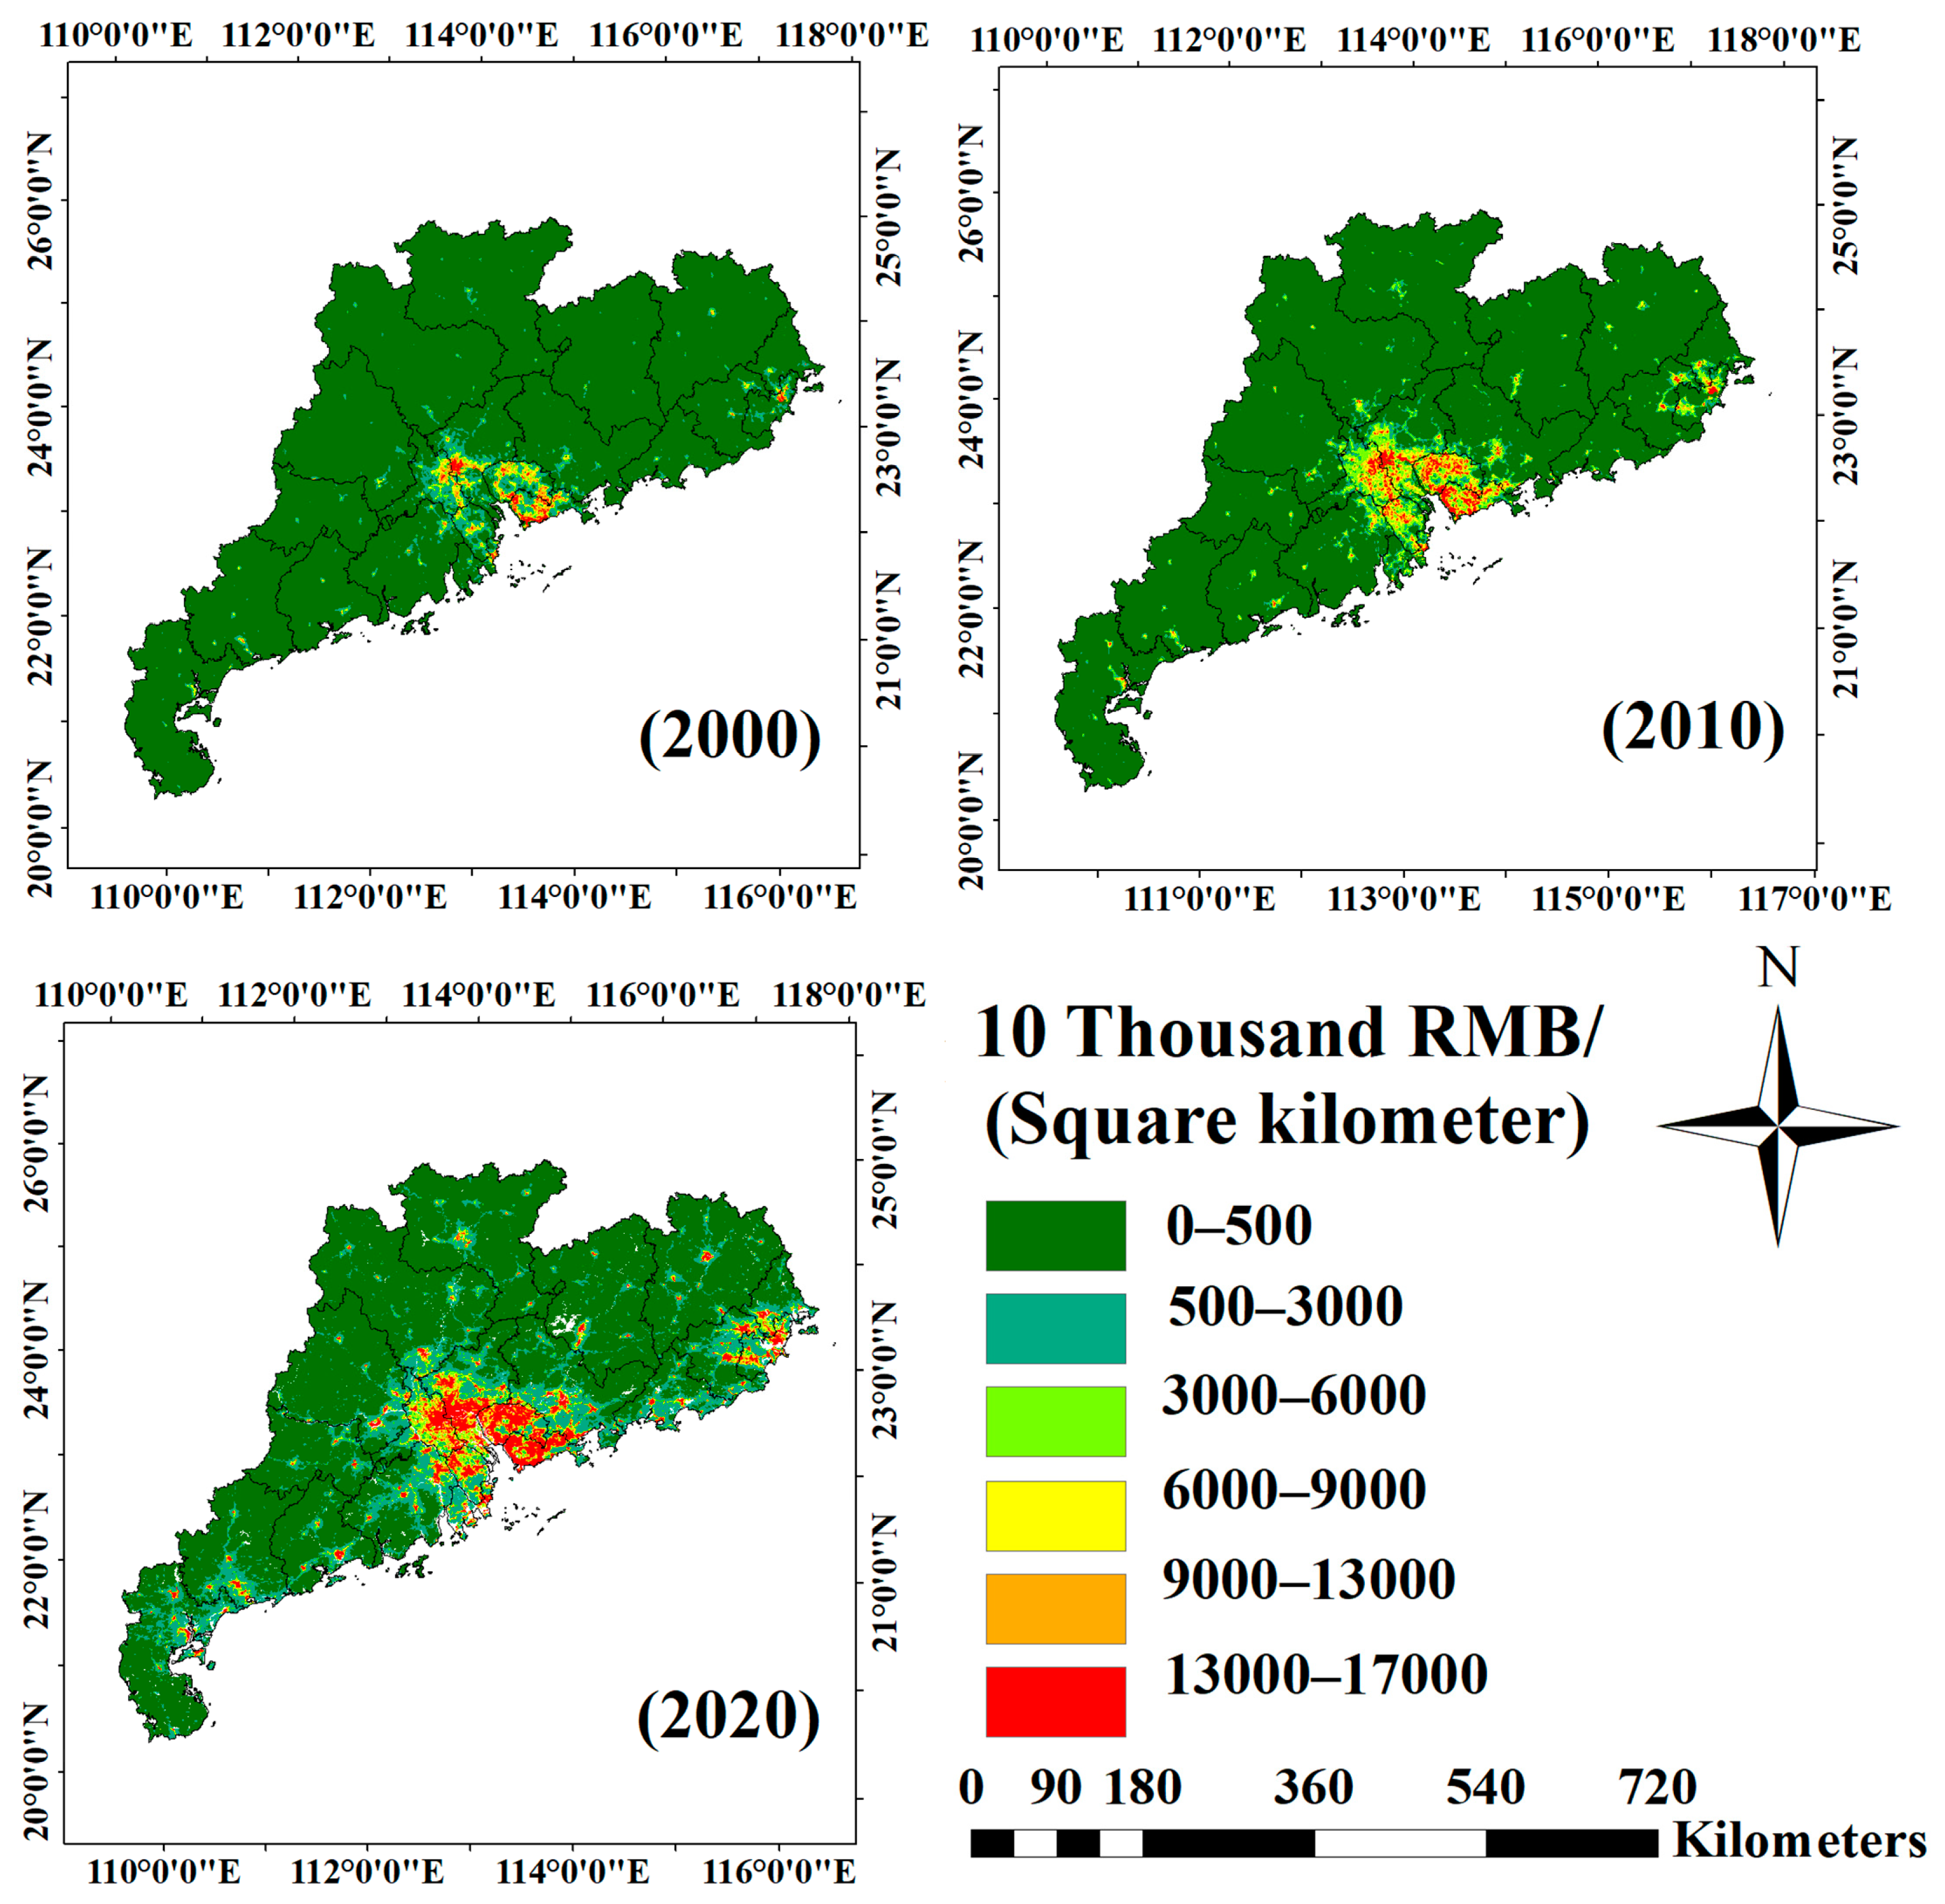
The simulation GDP was assigned to each pixel of the luminous image, and the GDP was divided into five levels by the natural discontinuity classification method to form a GDP density spatial distribution map in Figure 7. According to GDP statistics, the overall economic development of the Guangdong UA was good from 2000 to 2020. From 2000 to 2010, the GDP of the province increased 2.39 times (3.3533 trillion yuan), and from 2010 to 2020, the GDP increased 1.31 times (6.2321 trillion yuan). According to the GDP spatial density distribution map, the most economically developed cities were Dongguan, Guangzhou, Foshan, and Shenzhen, which were concentrated in the center of Guangdong Province. Their economic scale increased by 5.2, 4.2, 2.3, and 4.5 times, respectively, from 2000 to 2010 and 2.2, 2.4, 1.9, and 2.7 times from 2010 to 2020, respectively. The economic growth from 2000 to 2010 was more rapid, and the growth situation from 2010 to 2020 was good and tended to be gradually stable. Medium economic development areas were mainly distributed in Shantou, Huizhou, and Zhuhai Cities as the center. The economically underdeveloped areas were mainly distributed in county-level urban areas, mainly represented by the Yuncheng, Jiangcheng, and Qingcheng Districts and Taishan City. Compared with the economically developed areas, their development was relatively backward. However, the cities in which these towns were located particularly developed rapidly from 2000 to 2020, growing 7.3, 19.7, 6.9, and 11.8 times, respectively. Although there were still large regional differences in the economic development of the 21 administrative regions in Guangdong Province, the scale of inter-regional economic differences gradually shrunk with the rapid economic development of small cities.

4.3. Analysis of the Results of Extracting Built-Up Areas by Dichotomy

To study the change in the urban built-up area of the long time series, based on the threshold classification method and annual dataset of the long time series after the fusion of the VIIRS and DMSP datasets, the area of the urban built-up area of each prefecture-level city in Guangdong Province was extracted. The extraction results are shown in Figure 7. The data of the built-up area of Guangdong Province from 2000 to 2020 were found by the Ministry of Housing and Urban Construction of the People’s Republic of China and processed and counted. Afterward, the number of pixels of the built-up area corresponding to different thresholds was compared through repeated experiments. Finally, the best segmentation threshold of the built-up area was obtained.
According to the optimal segmentation threshold, the raster data were reclassified into built-up and nonbuilt-up areas. Considering that the consecutive change in the built-up area in two years was not apparent, to explain the spatial–temporal evolution characteristics of the built-up area, the built-up area of Guangdong Province was extracted every 5 years, and the results are shown in Figure 8.
The specific embodiment in Figure 8 shows the changes in the established areas of Guangdong Province through the speed and intensity indices. The corresponding equations are as follows:
U S I = U A i + n U A i n
U I I = U S I U A i
UAi+n and UAi represent the area of the extracted construction area in the (i + n)-th and i-th years, respectively, and n represents the unit of years. According to the corresponding calculation of the expansion speed and intensity indices, the data are shown in Table 2.
As shown in Figure 7 and Table 2, the area of the completed area of Guangdong Province steadily increased from 2000 to 2020. The expansion speed and intensity from 2000 to 2005 were the highest, and the indices were 396.854 km2/a year and 24.27% urban construction, which were particularly rapid. Afterward, the expansion rate and intensity in 2005–2010 and 2010–2015 were approximately 200 km2/a year and 5%, respectively, and the development was relatively fast. The speed of urban construction was relatively slow from 2015 to 2020, and the corresponding two indicators were 169.332 km2/a year and 2.99%, respectively.

4.4. Analysis of the Result of the Standard Deviation Ellipse

Based on the fitting data of the night-light data of Guangdong Province in 2000, 2005, 2010, 2015, and 2020, the weighted standard ellipse of Guangdong Province was calculated, and the coordinate and range of the center of gravity of the ellipse and the changing trend in the major and minor axes were analyzed. The images of the corresponding year of the ellipse and the center of gravity of the ellipse were obtained by calculation, and the results are shown in Figure 9. The relevant data of the weighted average ellipse (ellipse range, center of gravity offset distance, major axis difference, center of gravity coordinates, and main moving direction of the center of gravity) were processed and are shown in Table 3.
Figure 9 shows that the center of gravity of the Guangdong UA has been changing, mainly in Dongguan City–Zengcheng District–Huangpu District–Tianhe District, moving three times northwest from 2000 to 2020, once southwest, and entirely moving southwest. Combined with Table 3, the offset distances of the center of gravity of the ellipse in 2000–2005 and 2005–2010 were 5.68 and 5.70 km (Dongguan City–Zengcheng District–Huangpu District) with a small range of movement. The offset distances were the largest from 2010 to 2015, moving 17.00 km. From 2010 to 2015, the focus of urban development moved close to Tianhe and Huangpu Districts. From 2015 to 2020, the center of gravity of the Guangdong UA continued to change in Tianhe District, shifting 4.93 km. The focus of economic development in the study area in the past two decades gradually neared the UA center in Guangdong Province and tended to be stable in Tianhe District.
The elliptical oblateness represented the direction of urban development, and the greater the difference between the major and minor axes, the greater the oblateness, and the more apparent the direction of urban expansion. Regarding the scope, the size of the standard deviation ellipse steadily expanded outward in the time sequence of this study, indicating that the economic development of the border cities in Guangdong Province was relatively fast. From 2010 to 2015, the growth of the elliptical range was the largest (4231.15 km2); the expansion of the other three periods was relatively small, and the area growth of the range from 2005 to 2010 was the smallest (214.31 km2). Regarding elliptical oblateness, the difference between the major and minor axes of the ellipse gradually increased, indicating that the direction of urban expansion was more evident, and the overall UA expansion showed a northwest trend.

5. Discussion

5.1. Statistics of the Total Amount of Light at Night

This study compiles statistics on the total amount of night light in 21 prefecture-level cities in Guangdong Province between 2000 and 2020, and further processes and analyzes the data. Simultaneously, the prefecture-level cities are divided into five grades using the natural division method in ArcGIS to explore the differences in the geographical spatial distribution of night-light growth rate in each prefecture-level city. The results show that the total luminous values of all prefecture-level cities in Guangdong Province increased substantially from 2000 to 2020; the light intensity distribution of each prefecture-level city of UA shows a difference between low marginal areas and high inland areas, but the growth rate of light intensity in border areas is obviously higher than that in inland areas. However, due to the large time span, this method cannot accurately describe the slower or faster stages of urbanization in the past two decades because of the period.

5.2. Spatial Modeling of GDP

The regression analysis of statistical TNL and I data is performed using IBM SPSS software. The power-exponential regression model has the strongest correlation between TNL and GDP (R2 = 0.874. Based on the regression model and GDP statistical value, the predicted value of GDP is simulated. Furthermore, linear regression is used to simulate the correlation between the predicted value and statistical values to ensure that the model is reasonable. The predicted value of GDP calculated using the regression model is assigned to each pixel using ArcGIS, and the spatial dynamic distribution map of GDP is obtained. According to Figure 7, the economic growth trend of all prefecture-level cities in Guangdong Province within the scope of the study is good, but in 2000, the GDP density was only high around Guangzhou, Shenzhen and other large cities, while the other areas are generally low. This is because, while cities across the country are accelerating after China’s reform and opening up, the economy is still lagging in many areas because of the small GDP base. From 2000 to 2010, the GDP density entered a stage of rapid growth, and the province’s GDP increased by 2.39 times (3.3533 trillion yuan). This is because, with the active support of national policies, Guangdong Province relies on its own superior geographical conditions to attract foreign investment. However, there is an imbalance in economic development between regions. Economically developed areas are mainly concentrated in the central areas of the province, while medium-sized economic areas and underdeveloped areas are mainly distributed in the periphery of the provincial center and county-level urban areas. This is similar to the conclusion that the high GDP area in South China is mainly distributed on the southeast coast [20], and the reason for this phenomenon is mainly due to the different degrees of resource development caused by the difference in geomorphological types. The complex and diverse geomorphological types of Guangdong Province are also factors in inter-regional economic differences.The GDP economy experienced rapid growth from 2010 to 2020. The GDP has increased by 1.31 times (6.2321 trillion yuan), with the multiple reductions due to the large base of GDP in 2010. During this period, the GDP in underdeveloped areas has developed at a high speed, but the difference between regions is still obvious, and because the night lighting data is saturated, such as Guangzhou, Shenzhen, Dongguan and other economically developed cities, the GDP density map cannot accurately express them, so there may be greater economic differences between regions.

5.3. Extracting Built-Up Areas

In this study, the built area is extracted by using a dichotomy, and the best threshold for dividing the built area and the nonbuilt area is determined through repeated experiments on statistical data of built area. The gray value of the light image is reclassified by using ArcGIS software to characterize the dynamic change trend of the built area over time. The built-up areas in Guangdong Province are mainly concentrated in the cities such as Guangzhou, Shenzhen and Dongguan, while the areas in the north and southwest of Guangdong Province are relatively sparse, which is strongly consistent with the density distribution of GDP in Guangdong Province (Figure 7). From the viewpoint of expansion form, it belongs to the extensional expansion, and is based on the center, mainly toward the northwest and northeast, in which the northwest expansion is more obvious. The expansion speed and intensity showed a trend of deceleration after rapid growth in 2000–2020, with the largest expansion speed and intensity in 2000–2005, a slight decrease in expansion speed and intensity in 2005–2010 and 2010–2015, and a slow speed of urban construction from 2015 to 2020 (Table 2). This is mainly because the area of urban administrative districts is limited, and because the landforms of many areas are quite complex and difficult to develop and use. In terms of the extraction accuracy of the built-up area, the global fixed threshold method and the local optimization threshold method often miss the small area in the town, causing the result that the total area of the built-up area tends to be overestimated [14] and the deficiency of the dichotomy.

5.4. Standard Deviation Ellipse

Based on the weighted standard deviation ellipse obtained from the night lighting data of 2000, 2005, 2010, 2015 and 2020 in Guangdong Province, this study uses the spatial statistical tool of ArcGIS to show the distribution range of the ellipse and the spatiotemporal evolution trend of the center of gravity of the ellipse shown in Figure 9. The overall direction of the center of gravity in Guangdong Province shifts to the northwest, which is consistent with the conclusion that the manufacturing industry shifts to the northwest [42], confirming the correctness of the results obtained in this study. Among them, the center of gravity moved from (123°53′ E 7°39′ N) in 2000 to (123°56′ E 7°25′ N) in 2020, in which the shift of the center of gravity of the ellipse from 2000 to 2005 was 5.68 km (Dongguan-Zengcheng District). During this period, the development of Guangzhou (provincial capital city) was ahead of Dongguan, and the center of gravity of economic development shifted to Guangzhou. This is mainly because in an environment of great development in China, Guangzhou took the lead in carrying out the strategic planning research on the overall urban development in 2000 and implemented it in action, and the urban development has made great achievements. From 2005 to 2010, the center of gravity of the ellipse shifted 5.70 km to the southwest (Zengcheng District-Huangpu District). As the main secondary industry in Huangpu District, its industrial industry is growing, which has enhanced the industrial strength of Guangzhou. The offset from 2010 to 2015 is 17.00 km (Huangpu District-Tianhe District), because Tianhe District was officially designated as the new urban central areas in the urban zoning planning of Guangzhou in 2004, and the establishment of the economic zone made the center of gravity move toward Tianhe District, but after 2010, the gradual formation of Tianhe Central Business District inevitably shifted the center of gravity to the northwest. The offset from 2015 to 2020 is 4.93 km, and the focus of economic development of the study area has always remained in the Tianhe District of Guangzhou City, which further strengthens the overall economic strength of Guangzhou, which plays a strong driving role in the economic development of the entire UA, but it is also a factor causing significant differences in the regional economy of Guangdong Province.
In terms of the scope of ellipse distribution, Guangdong has shown a trend of continuous expansion from the center to the outside in the past 20 years, which is because Guangdong Province continues to strengthen inter-regional economic cooperation. Economically developed cities such as Guangzhou, Shenzhen and Dongguan play a leading role in the rapid economic development of the surrounding cities.
The phenomenon that the difference between the major axes and the minor axis of the ellipse increases gradually shows that the expansion of the city has an obvious trend toward the northwest, which is consistent with the expansion trend of the built area.

6. Conclusion

This study used the annual dataset of the long time series after the fusion of VIIRS and DMSP datasets from 2000 to 2020 as the basic data source of the research. The change in the total amount of night-light and its growth rate, expansion speed and intensity of the urban built-up area, dynamic GDP change in the time series, and transfer of the weighted average elliptical center of gravity in the Guangdong UA were studied. Thereafter, the evolution trend of the urban spatiotemporal pattern of Guangdong Province was predicted, and the distribution characteristics of urban economic development were investigated to provide reference for the analysis of regional economic development and urban planning and construction. The main conclusions of the study are as follows:
(1) From 2000 to 2020, the total amount of lighting in Guangdong Province increased steadily. This is because after China joined the World Trade Organization in 2001, it implemented omnidirectional and multilevel opening up to the outside world, while in Guangdong Province, with its superior geographical location, the industry continues to accumulate and the lighting scale continues to rise. The light intensity distribution of each prefecture-level city of the UA shows the difference between the low marginal area and the high inland area, but the light intensity growth rate of the edge area is obviously higher than that of the inland area. However, due to Shenzhen, Guangzhou and other developed cities, the base of the lighting scale is relatively large, and the time span of the study is large; furthermore, light saturation was observed, which cannot accurately express the results.
(2) The GDP density distribution maps for 2000, 2010, and 2020 were obtained within the time range of the study area. The power-index model obtained through various linear regressions has a high degree of fit, and the calculated GDP prediction value is closely related to the statistical value. The density map can accurately reflect the regional economic distribution in Guangdong Province, and can directly express the regional economic differences through the image. The economies of Guangzhou, Shenzhen, and Dongguan cities expand from the center to the boundary, thereby providing a certain reference value for the analysis of the economic evolution characteristics of Guangdong Province in the future.
(3) From 2000 to 2020, the overall urbanization of Guangdong Province develops rapidly, forming a trend of taking Guangzhou, Shenzhen, Dongguan and other cities as the center and extending to the peripheral border cities, and the main direction of expansion is the northwest and northeast. Although the overall development situation is good, the phenomenon of uneven development between regions remains a major concern. The development level of Zhaoqing, Yunfu, Maoming, and other peripheral cities remains low, with much room for improvement, whereas the development speed of economically developed cities such as Shenzhen and Guangzhou has gradually slowed down after the rapid development.
(4) According to the weighted standard deviation ellipse of Guangdong Province, the position of the center of gravity is relatively stable, and there is a local fluctuation in Guangzhou from 2005 to 2020, indicating a shift to the northwest overall. The distribution range of the ellipse increased gradually, the relationship between regions was constantly strengthened, and the difference between the major and minor axes of the ellipse increased, indicating that Guangdong Province showed a trend toward the northwest.
(5) In summary, many underdeveloped cities in Guangdong Province have developed well along with local economic development strategies under the general situation of the socialist market economic system in recent years. However, due to geographical and natural limitations, traffic obstacles and other factors, there are still significant differences in the level of development between different regions. According to the research results, the inland central cities of Guangdong Province (Shenzhen, Guangzhou, Dongguan, Foshan, etc.) outperform most of the border cities in terms of economy, urban expansion, and lighting scale. Therefore, Guangdong Province cannot only develop economically rich areas, but also implement strong policies to promote the development of other regions. Cities in coastal areas should strengthen external cooperation along with their superior geographical conditions to enhance the level of urban development. Through regional integration, the province should constantly strengthen the infrastructure construction, reduce regional link obstacles, and strengthen the economic ties between developed and backward areas. Guangdong Province has made significant achievements in the practice of sustainable development during the rapid urbanization process. Guangdong Province has completed its transformation from extensive to intensive economic growth. Environmentally friendly new technologies and materials are widely used in industrial manufacturing, and the government continues to invest heavily in protecting the ecological environment while developing holistically. When participating in urban construction, urban developers should aim at the common development of themselves and the city, and emphasize symbiosis and co-creation with the city. The Guangdong provincial government should strengthen regional economic cooperation and reduce the production and operating costs of small- and medium-sized enterprises, as well as individual businesses due to the epidemic, while governments of other countries should also actively learn from the development strategy of Guangdong Province.
Night-light data were used to study the spatiotemporal evolution of the urban pattern and plan future urban development. The data reflected the characteristics and influencing factors of urban development. In the future, the UA of Guangdong Province can be comprehensively analyzed for a long time on a large scale using a timely and stable dataset with high precision.

Author Contributions

Conceptualization: Shuang Hao and Pengfei Li; methodology: Pengfei Li; software: Pengfei Li and Yazhou Xu; formal analysis: Pengfei Li and Congcong Liao; resources: Shuang Hao; data curation: Shuang Hao and Pengfei Li; writing—original draft preparation: Pengfei Li; writing—review and editing: Shuang Hao and Liangliang Sheng; funding acquisition: Shuang Hao, Yuhuan Cui and Yazhou Xu. All authors have read and agreed to the published version of the manuscript.

Funding

This research was funded by National Natural Science Foundation of China, grant number 41801332; National College Students’ Innovation and Entrepreneurship Training Program, grant number 202210364036; Anhui University Natural Science Research Project, grant number KJ2021A0178.

Data Availability Statement

The data used in this study can be found here: https://eogdata.mines.edu/products/vnl/ (accessed on 3 March 2022).

Acknowledgments

The authors would like to thank the anonymous reviewers for their valuable comments.

Conflicts of Interest

The authors declare that they have no known competing financial interests or personal relationships that could have appeared to influence the work reported in this paper.

References

  1. Guan, X.L.; Wei, H.K.; Lu, S.S.; Dai, Q.; Su, H.J. Assessment on the urbanization strategy in China: Achievements, challenges and reflections. Habitat Int. 2018, 71, 97–109. [Google Scholar] [CrossRef]
  2. Planning, L. Urban growth pattern modelling: A case study of Wuhan city, PR China Urban growth pattern modeling: A case study of Wuhan city, PR China. Landsc. Urban Plan. 2015, 62, 199–217. [Google Scholar]
  3. Peng, J.; Lin, H.; Chen, Y.; Blaschke, T.; Luo, L.; Xu, Z.; Hu, Y.; Zhao, M.; Wu, J. Spatiotemporal evolution of urban agglomerations in China during 2000–2012: A nighttime light approach. Landsc. Ecol. 2020, 35, 421–434. [Google Scholar] [CrossRef]
  4. Fang, C.; Yu, D. Urban agglomeration: An evolving concept of an emerging phenomenon. Landsc. Urban Plan. 2017, 162, 126–136. [Google Scholar] [CrossRef]
  5. Yu, M.; Guo, S.; Guan, Y.; Cai, D.; Zhang, C.; Fraedrich, K.; Liao, Z.; Zhang, X.; Tian, Z. Spatiotemporal Heterogeneity Analysis of Yangtze River Delta Urban Agglomeration: Evidence from Nighttime Light Data (2001–2019). Remote Sens. 2021, 13, 1235. [Google Scholar] [CrossRef]
  6. Chu, M.; Lu, J.; Sun, D. Influence of Urban Agglomeration Expansion on Fragmentation of Green Space: A Case Study of Beijing-Tianjin-Hebei Urban Agglomeration. Land 2022, 11, 275. [Google Scholar] [CrossRef]
  7. Wang, J.; Fang, C.; Wang, Z. Advantages and dynamics of urban agglomeration development on Yangtze River Delta. J. Geogr. Sci. 2012, 22, 521–534. [Google Scholar] [CrossRef]
  8. Zheng, Z.; Bohong, Z. Study on Spatial Structure of Yangtze River Delta Urban Agglomeration and Its Effects on Urban and Rural Regions. J. Urban Plan. Dev. 2012, 138, 78–89. [Google Scholar] [CrossRef]
  9. Laurance, J.C.M.; Lin, C. Development of towns in China: A case study of Guangdong province. In Population and Development Review; Population Council: New York, NY, USA, 2017; Volume 19, pp. 583–606. [Google Scholar]
  10. Huang, Q.; Yang, X.; Gao, B.; Yang, Y.; Zhao, Y. Application of DMSP/OLS nighttime light images: A meta-analysis and a systematic literature review. Remote Sens. 2014, 6, 6844–6866. [Google Scholar] [CrossRef] [Green Version]
  11. Liu, Z.; He, C.; Zhang, Q.; Huang, Q.; Yang, Y. Extracting the dynamics of urban expansion in China using DMSP-OLS nighttime light data from 1992 to 2008. Landsc. Urban Plan. 2012, 106, 62–72. [Google Scholar] [CrossRef]
  12. Imhoff, M.L.; Lawrence, W.T.; Elvidge, C.D.; Paul, T.; Levine, E.; Privalsky, M.V.; Brown, V. Using nighttime DMSP/OLS images of city lights to estimate the impact of urban land use on soil resources in the United States. Remote Sens. Environ. 1997, 59, 105–117. [Google Scholar] [CrossRef]
  13. Small, C.; Pozzi, F.; Elvidge, C.D. Spatial analysis of global urban extent from DMSP-OLS night lights. Remote Sens. Environ. 2005, 96, 277–291. [Google Scholar] [CrossRef]
  14. Su, Y.; Chen, X.; Wang, C.; Zhang, H.; Liao, J.; Ye, Y.; Wang, C. A new method for extracting built-up urban areas using DMSP-OLS nighttime stable lights: A case study in the Pearl River Delta, southern China. GIScience Remote Sens. 2015, 52, 218–238. [Google Scholar] [CrossRef]
  15. Ye, Y.; Li, S.; Zhang, H.; Su, Y.; Wu, Q.; Wang, C. Spatial-Temporal Dynamics of the Economic Efficiency of Construction Land in the Pearl River Delta Megalopolis from 1998 to 2012. Sustainability 2017, 10, 63. [Google Scholar] [CrossRef] [Green Version]
  16. Li, X.; Xu, H.; Chen, X.; Li, C. Potential of NPP-VIIRS Nighttime Light Imagery for Modeling the Regional Economy of China. Remote Sens. 2013, 5, 3057–3081. [Google Scholar] [CrossRef] [Green Version]
  17. Cao, C.; Xiong, J.; Blonski, S.; Liu, Q.; Uprety, S.; Shao, X.; Bai, Y.; Weng, F. Suomi NPP VIIRS sensor data record verification, validation, and long-term performance monitoring. J. Geophys. Res. Atmos. 2013, 118, 664–678. [Google Scholar] [CrossRef]
  18. Zheng, Q.; Deng, J.; Jiang, R.; Wang, K.; Xue, X.; Lin, Y.; Huang, Z.; Shen, Z.; Li, J.; Shahtahmassebi, A.R. Monitoring and assessing “ghost cities” in Northeast China from the view of nighttime light remote sensing data. Habitat Int. 2017, 70, 34–42. [Google Scholar] [CrossRef]
  19. Shi, K.; Huang, C.; Yu, B.; Yin, B.; Huang, Y.; Wu, J. Evaluation of NPP-VIIRS night-time light composite data for extracting built-up urban areas. Remote Sens. Lett. 2014, 5, 358–366. [Google Scholar] [CrossRef]
  20. Zhao, M.; Cheng, W.; Zhou, C.; Li, M.; Wang, N.; Liu, Q. GDP Spatialization and Economic Differences in South China Based on NPP-VIIRS Nighttime Light Imagery. Remote Sens. 2017, 9, 673. [Google Scholar] [CrossRef] [Green Version]
  21. Zhang, P.; Liu, S.; Du, J. A Map Spectrum-Based Spatiotemporal Clustering Method for GDP Variation Pattern Analysis Using Nighttime Light Images of the Wuhan Urban Agglomeration. ISPRS Int. J. Geo-Inf. 2017, 6, 160. [Google Scholar] [CrossRef] [Green Version]
  22. Ma, T.; Yin, Z.; Li, B.; Zhou, C.; Haynie, S. Quantitative Estimation of the Velocity of Urbanization in China Using Nighttime Luminosity Data. Remote Sens. 2016, 8, 94. [Google Scholar] [CrossRef]
  23. Yu, Z.; Zeng, W.; Cheng, X. The Research on Urban Expansion and Spatial Correlation Based on VIIRS/DNB Data: A Case Study of Shandong Province. IOP Conf. Ser. Earth Environ. Sci. 2021, 714, 022057. [Google Scholar] [CrossRef]
  24. Henderson, V. The Urbanization Process and Economic Growth: The So-What Question. J. Econ. Growth 2003, 8, 47–71. [Google Scholar] [CrossRef]
  25. Jiang, Z.; Zhai, W.; Meng, X.; Long, Y. Identifying Shrinking Cities with NPP-VIIRS Nightlight Data in China. J. Urban Plan. Dev. 2020, 146, 04020034. [Google Scholar] [CrossRef]
  26. Pan, X.-Z.; Zhao, Q.-G. Measurement of urbanization process and the paddy soil loss in Yixing city, China between 1949 and 2000. CATENA 2007, 69, 65–73. [Google Scholar] [CrossRef]
  27. Yang, Z.; Chen, Y.; Guo, G.; Zheng, Z.; Wu, Z. Using nighttime light data to identify the structure of polycentric cities and evaluate urban centers. Sci. Total Environ. 2021, 780, 146586. [Google Scholar] [CrossRef] [PubMed]
  28. Yi, K.; Tani, H.; Li, Q.; Zhang, J.; Guo, M.; Bao, Y.; Wang, X.; Li, J. Mapping and Evaluating the Urbanization Process in Northeast China Using DMSP/OLS Nighttime Light Data. Sensors 2014, 14, 3207–3226. [Google Scholar] [CrossRef] [Green Version]
  29. Zeng, C.; Song, Y.; Cai, D.; Hu, P.; Cui, H.; Yang, J.; Zhang, H. Exploration on the spatial spillover effect of infrastructure network on urbanization: A case study in Wuhan urban agglomeration. Sustain. Cities Soc. 2019, 47, 101476. [Google Scholar] [CrossRef]
  30. Liu, J.; Zhang, Q.; Hu, Y. Regional differences of China’s urban expansion from late 20th to early 21st century based on remote sensing information. Chin. Geogr. Sci. 2012, 22, 1–14. [Google Scholar] [CrossRef]
  31. Xin, X.; Liu, B.; Di, K.; Zhu, Z.; Zhao, Z.; Liu, J.; Yue, Z.; Zhang, G. Monitoring urban expansion using time series of night-time light data: Acase study in Wuhan, China. Int. J. Remote Sens. 2017, 38, 6110–6128. [Google Scholar] [CrossRef]
  32. Kabanda, T. Using land cover, population, and night light data to assess urban expansion in Kimberley, South Africa. S. Afr. Geogr. J. 2022, 1–14. [Google Scholar] [CrossRef]
  33. Jiang, Y.; Sun, S.; Zheng, S. Exploring Urban Expansion and Socioeconomic Vitality Using NPP-VIIRS Data in Xia-Zhang-Quan, China. Sustainability 2019, 11, 1739. [Google Scholar] [CrossRef] [Green Version]
  34. Pan, J. Area Delineation and Spatial-Temporal Dynamics of Urban Heat Island in Lanzhou City, China Using Remote Sensing Imagery. J. Indian Soc. Remote Sens. 2016, 44, 111–127. [Google Scholar] [CrossRef]
  35. Liang, H.; Guo, Z.; Wu, J.; Chen, Z. GDP spatialization in Ningbo City based on NPP/VIIRS night-time light and auxiliary data using random forest regression. Adv. Space Res. 2020, 65, 481–493. [Google Scholar] [CrossRef]
  36. Shi, K.; Yu, B.; Huang, Y.; Hu, Y.; Yin, B.; Chen, Z.; Chen, L.; Wu, J. Evaluating the ability of npp-viirs nighttime light data to estimate the gross domestic product and the electric power consumption of China at multiple scales: A comparison with DMSP-OLS Data. Remote Sens. 2014, 6, 1705–1724. [Google Scholar] [CrossRef] [Green Version]
  37. Ma, J.; Guo, J.; Ahmad, S.; Li, Z.; Hong, J. Constructing a New Inter-Calibration Method for DMSP-OLS and NPP-VIIRS Nighttime Light. Remote Sens. 2020, 12, 937. [Google Scholar] [CrossRef] [Green Version]
  38. Hesong, D.; Renjie, L.I.; Jianming, L.I.; Shuai, L.I. Study on urban spatiotemporal expansion pattern of three first-class urban agglomerations in China derived from integrated DMSP-OLS and NPP-VIIRS nighttime light data. J. Geo-Inf. Sci. 2020, 22, 5001161. [Google Scholar]
  39. Zhao, M.-M.; Li, R. Decoupling and decomposition analysis of carbon emissions from economic output in Chinese Guang-dong Province: A sector perspective. Energy Environ. 2018, 29, 543–555. [Google Scholar] [CrossRef]
  40. Shi, L.; Wurm, M.; Huang, X.; Zhong, T.; Leichtle, T.; Taubenböck, H. Urbanization that hides in the dark—Spotting China’s “ghost neighborhoods” from space. Landsc. Urban Plan. 2020, 200, 103822. [Google Scholar] [CrossRef]
  41. Lefever, D.W. Measuring Geographic Concentration by Means of the Standard Deviational Ellipse. Am. J. Sociol. 1926, 32, 88–94. [Google Scholar] [CrossRef]
  42. Wang, F. The Spatial Evolution Analysis of Manufacturing Industrial Gravity Centre of Guangdong Province. Am. J. Ind. Bus. Manag. 2018, 08, 721–734. [Google Scholar] [CrossRef]
Figure 1. Locations of urban agglomeration.
Ijgi 11 00512 g001
Figure 2. Luminous images of the study area.
Ijgi 11 00512 g002
Figure 3. Total night lights from 2000 to 2020.
Ijgi 11 00512 g003
Figure 4. Luminous growth rate of prefecture-level cities.
Ijgi 11 00512 g004
Figure 5. (ac) GDP regression (100 million RMB) with TNL (103) and (df) GDP regression (100 million RMB) with I.
Ijgi 11 00512 g005
Figure 6. (ac) Correlation between simulated and statistical (GDP/100 million RMB).
Ijgi 11 00512 g006
Figure 7. Spatial distribution of GDP density in 2000, 2010, and 2020.
Ijgi 11 00512 g007
Figure 8. Extraction area of built-up areas in Guangdong Province.
Ijgi 11 00512 g008
Figure 9. Ellipse of weighted mean and change in center of gravity.
Ijgi 11 00512 g009
Table 1. Data statistics of R2.
TNL I
Year200020102020200020102020
Linear0.7820.7750.7450.3360.4100.179
Logarithm 0.6500.6150.5980.4040.4290.193
Power exponent0.8740.8360.8410.4820.5490.344
Index0.7400.814 0.8300.3960.4710.337
Table 2. Statistics of urban agglomeration in Guangdong Province.
Index20002005201020152020
Total area/km21634.783169.054618.075654.786501.44
Growth area/km21984.27999.021036.71846.66
Rate of expansion (km2/a year)396.854199.804207.342169.332
Expansion strength (%)24.275.524.492.99
Table 3. Standard deviation ellipse data.
YearRange
/km2
Offset Distance/kmDifference Value/kmMain Direction
of Movement
200023,919.95166.089
200524,793.445.68169.983Northwest
201025,007.755.7175.756Southwest
201529,238.917193.962Northwest
202029,919.494.93204.842Northwest
Publisher’s Note: MDPI stays neutral with regard to jurisdictional claims in published maps and institutional affiliations.